Interplay between kinesin-1 and cortical dynein during axonal outgrowth and microtubule organization in Drosophila neurons
- Feinberg School of Medicine, Northwestern University, United States
Figures
Figure 1 with 1 supplement
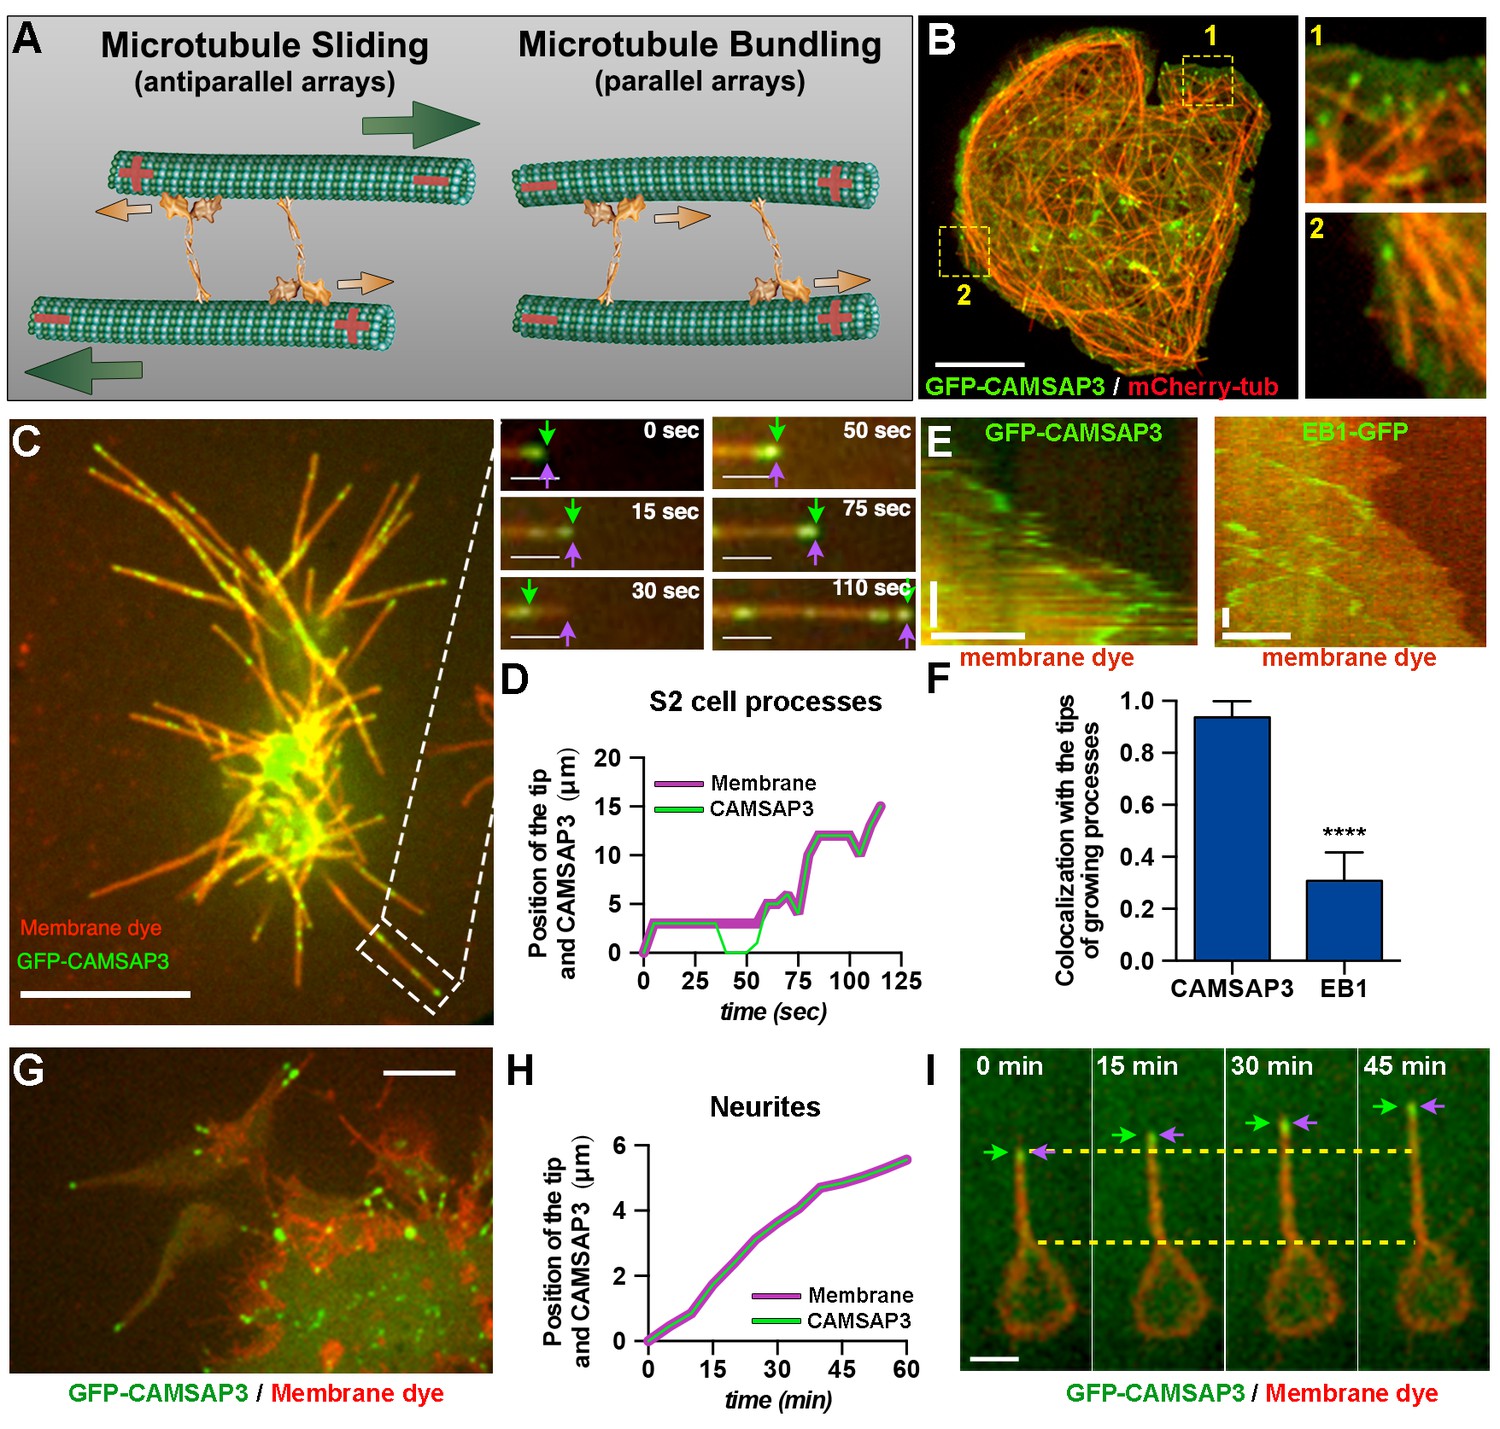
Microtubule minus-ends push the plasma membrane during the initial stages of neurite outgrowth.
(A) Model of microtubule-microtubule sliding driven by kinesin-1. Kinesin-1 slides antiparallel microtubules apart with their minus-ends leading (left panel). When kinesin-1 binds to parallel microtubules (right panel), forces applied by the two motors to the two microtubules are counteracted resulting in no net movement; instead, kinesin-1 crosslinks these microtubules. Large green arrows indicate direction of microtubule sliding; small orange arrows indicate the direction of kinesin-1 movement relative to microtubules. (B) A representative S2 cell expressing GFP-CAMSAP3 and mCherry-tubulin. Note that CAMSAP3 molecules accumulate at microtubule ends. Two different regions of the cell body (labeled 1 and 2) were magnified in the insets (see Video 2). Scale bar, 5 µm. (C and D) Minus-ends of microtubules localize at the tips of growing processes during the initial stages of process formation in S2 cells. GFP-CAMSAP3 expressing S2 cells were plated on coverslips and imaged 5 min after plating. The plasma membrane was stained with a Deep Red membrane dye (red). (C) Last frame of a time-lapse video. Images at different time points of the growing process in the white box are shown at higher magnification. Green arrows indicate positions of the most distal CAMSAP3 dot; magenta arrows show the position of the tip of the process (see Video 4). Scale bars are 10 µm and 3 µm for main and inset panels, respectively. (D) A graph showing the position of the process tip and the microtubule minus-ends shown in the inset of (C) as a function of time. (E–F) Microtubule plus-ends do not colocalize with the tip of growing processes in S2 cells. (E) Representative kymographs of growing processes from cells expressing GFP-CAMSAP3 (left panel) or EB1-GFP (right panel). The plasma membrane was stained with a Deep Red membrane dye. Note that CAMSAP3 consistently localizes at the tips of the processes during outgrowth events, however EB1 comets do not colocalize with the tip of the growing processes (horizontal scale bar, 10 µm; vertical scale bar, 25 s). (F) Graph depicting the fraction of time that CAMSAP3 or EB1 colocalize with the tips of the processes during the growing events. Error bars indicate s.d. (CAMSAP3, n=55 growing processes; EB1, n=51 growing processes). Data collected from four independent experiments. ****p<0.0001. (G–I) Localization of microtubule minus-ends at the tips of the processes during the initial stages of neurite formation in cultured neurons. (G) A still image of 4 hr-cultured neurons expressing elav>GFP-CAMSAP3. The plasma membrane was labeled with Deep Red dye. Note that CAMSAP3 mostly localized to the tips of neurites. Scale bar, 5 µm. (H) Diagram showing the position of the neurite tip and the microtubule minus-ends of the axon showed in (I) as a function of time. (I) Still images from a time-lapse of a 4 hr-cultured neuron plated as described in (G). Yellow dashed lines are guides to visualize the neurite growth. Green arrows indicate positions of CAMSAP3; magenta arrows show position of the tip of the process (see Video 5). Scale bar, 5 µm.
Figure 1—figure supplement 1
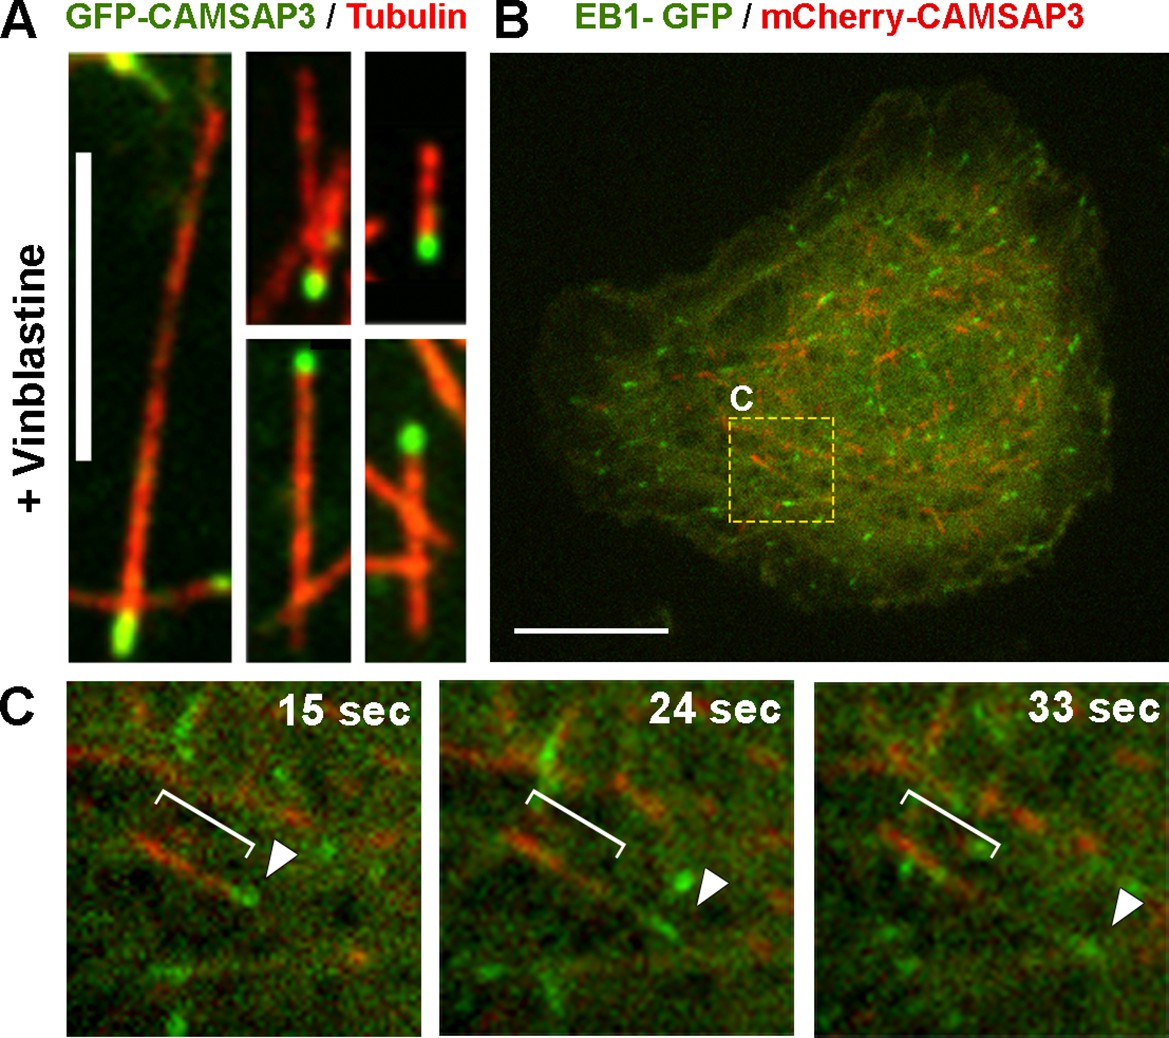
CAMSAP3 labels minus-ends of microtubules in Drosophila S2 cells.
(A) Microtubules in S2 cells expressing GFP-CAMSAP3 were fragmented by 1 hr treatment with 25 µM vinblastine; cells were fixed and stained with primary antitubulin antibody DM1α and TRITC-labeled secondary antibody. Note that GFP-CAMSAP3 decorates only one end of each microtubule fragment. Scale bar, 5 µm. (B) A still image of a S2 cell coexpressing EB1-GFP and mCherry-CAMSAP3 (see Video 3). The yellow box represents the area magnified in (C). Scale bar, 10 µm. (C) Still frames from a time-lapse sequence of the cell depicted in (B) captured at different time points. The white bracket and the white arrowhead show localization of mCherry-CAMSAP3 or EB1-GFP, respectively, on a single microtubule.
Figure 2 with 2 supplements
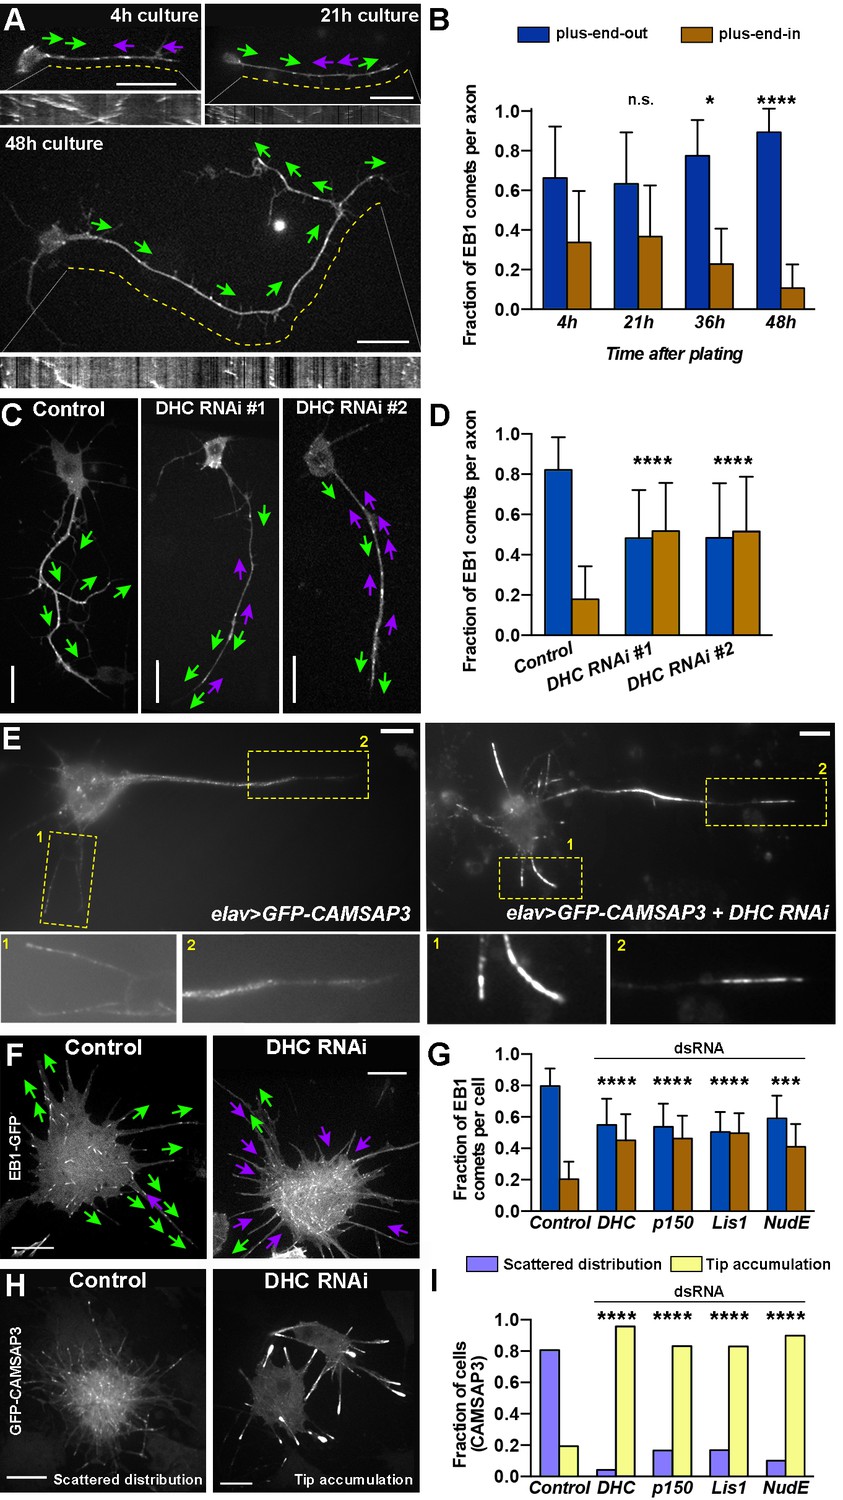
Dynein specifies microtubule orientation in axons.
(A and B) Axonal microtubules gradually acquire uniform orientation during development. (A) Representative still images of EB1-GFP expressing neurons cultured for 4 hr, 21 hr, or 48 hr. Kymographs of EB1 comets are shown below corresponding images. Magenta and green arrows indicate direction of EB1 comet movement (plus-end-in and plus-end-out, respectively). Dashed yellow lines define the area of the axon used for plotting EB1-GFP kymographs (see Video 6). Scale bars, 10 µm. (B) Fraction of EB1-GFP comets directed toward the tip of the neurites (plus-end-out) or the cell body (plus-end-in). See Material and methods for an explanation of EB1 comet quantification. Error bars indicate s.d. (4 hr, n=35 axons with 761 comets; 21 hr, n=33 axons with 408 comets; 36 hr, n=33 axons with 526 comets; 48 hr, n=25 axons with 299 comets). *p=0.034, ****p<0.0001, n.s. = not significant. Data collected from three independent experiments. (C and D) Dynein knockdown causes mixed orientation of microtubules in axons. (C) Representative still images of control (elav-gal4) and dynein knockdown (two different DHC shRNAs driven by elav-Gal4) 48 hr-cultured neurons expressing EB1-GFP. Magenta and green arrows indicate directions of EB1 comet movement (plus-end-in and plus-end-out, respectively) (see Video 7). Scale bars, 10 µm. (D) Fraction of EB1-GFP comets directed toward the tip of the neurites (plus-end-out) or the cell body (plus-end-in). Error bars indicate s.d. (Control, n=28 axons with 269 comets; DHC RNAi#1, n=45 axons with 928 comets; DHC RNAi#2, n=30 axons with 454 comets). ****p<0.0001. Data collected from three independent experiments. (E) Dynein knockdown in neurons results in accumulation of microtubule minus-ends at the tips of neurites. Images of 48 hr-cultured neurons expressing elav>GFP-CAMSAP3 (left panel) or elav>GFP-CAMSAP3 + DHC RNAi (right panel). Bottom panels are magnifications of the yellow-boxed areas. Scale bars, 10 µm. (F–G) Dynein inactivation induces antiparallel microtubule arrays in S2 cell processes. (F) Representative images of untreated (control) or DHC dsRNA-treated S2 cells expressing EB1-GFP. Magenta and green arrows indicate plus-end-in or plus-end-out direction of EB1 comet movement, respectively (see Video 8). Scale bars, 10 µm. (G) Graphs depict the direction of EB1-GFP comets in the processes of control S2 cells, and cells after knockdown of DHC, p150Glued, Lis1, or NudE. Error bars indicate s.d. (Control, n=55 cells with 1747 comets; DHC RNAi, n=50 cells with 1929 comets; p150 RNAi, n=26 cells with 2282 comets; Lis1 RNAi, n=33 cells with 3359 comets; NudE RNAi, n=24 cells with 2518 comets). ***p=0.001–0.0001, ****p<0.0001. Data collected from three independent experiments. (H–I) Dynein inactivation in S2 cells results in accumulation of microtubule minus-ends in the process tips. (H) Representative images of untreated (control) or DHC dsRNA-treated S2 cells expressing GFP-CAMSAP3. In control S2 cells, CAMSAP3 particles display a scattered distribution with few minus-ends at process tips. In dynein RNAi S2 cells, CAMSAP3 particles robustly accumulate at the tips of the processes. Scales bars, 10 µm. (I) Graphs show the fraction of S2 cells displaying the phenotypes depicted in (H). (Control, n=117 cells; DHC RNAi, n=84 cells; p150Glued=90 cells; Lis1 RNA1, n=83 cells; NudE RNAi=79 cells). DHC, dynein heavy chain. ****p<0.0001. Data collected from three independent experiments.
Figure 2—figure supplement 1

Knockdown efficiency of DHC and dynein cofactors in Drosophila S2 cells.
(A) Western blot analysis of S2 cell extracts obtained from control (untreated) or DHC dsRNA-treated cells using anti-DHC and anti-KHC (loading control) antibodies. (B) Temporal color code hyper-stacks representing the displacement of lysosomes in S2 cells. Lysosomes were stained by addition of Lysotracker to the medium. Lysosome transport of untreated (control) or dsRNA-treated S2 cells was recorded for 1 min and analyzed by temporal code. White color represents static lysosomes. DHC, dynein heavy chain. Scale bars, 10 µm.
Figure 2—figure supplement 2
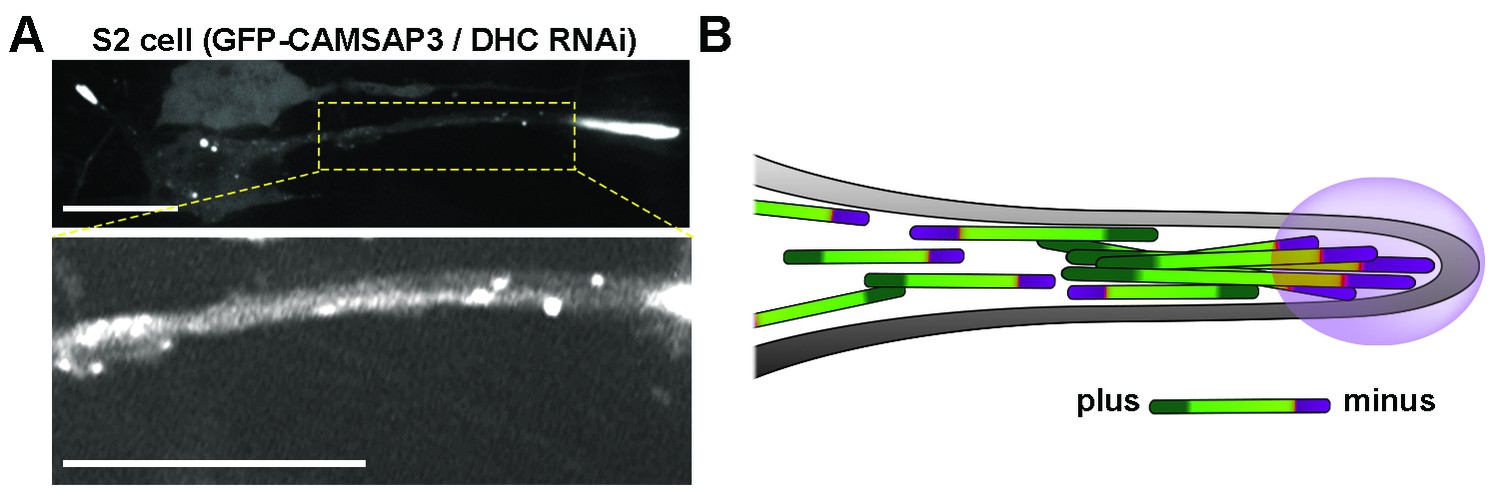
Distribution of GFP-CAMSAP3 in DHC RNAi S2 processes.
(A) Distribution of GFP-CAMSAP3 in DHC depleted S2 process. CAMSAP3 molecules accumulate mainly at the end of the tip of the processes (upper panel). Adjustment of contrast in the boxed area reveals multiple GFP-CAMSAP3 speckles in the intermediate segment of the process (bottom panel). Scale bars, 10 µM. (B) Schematic representation of microtubules organization in DHC depleted S2 process. In the absence of dynein, S2 cells develop processes containing microtubule arrays of mixed polarity. The tips of the processes contain massive accumulation of minus-ends, other minus-ends are scattered in the shafts of the processes. DHC, dynein heavy chain.
Figure 3 with 1 supplement
Dynein recruitment to the cortex is required for microtubule sorting.
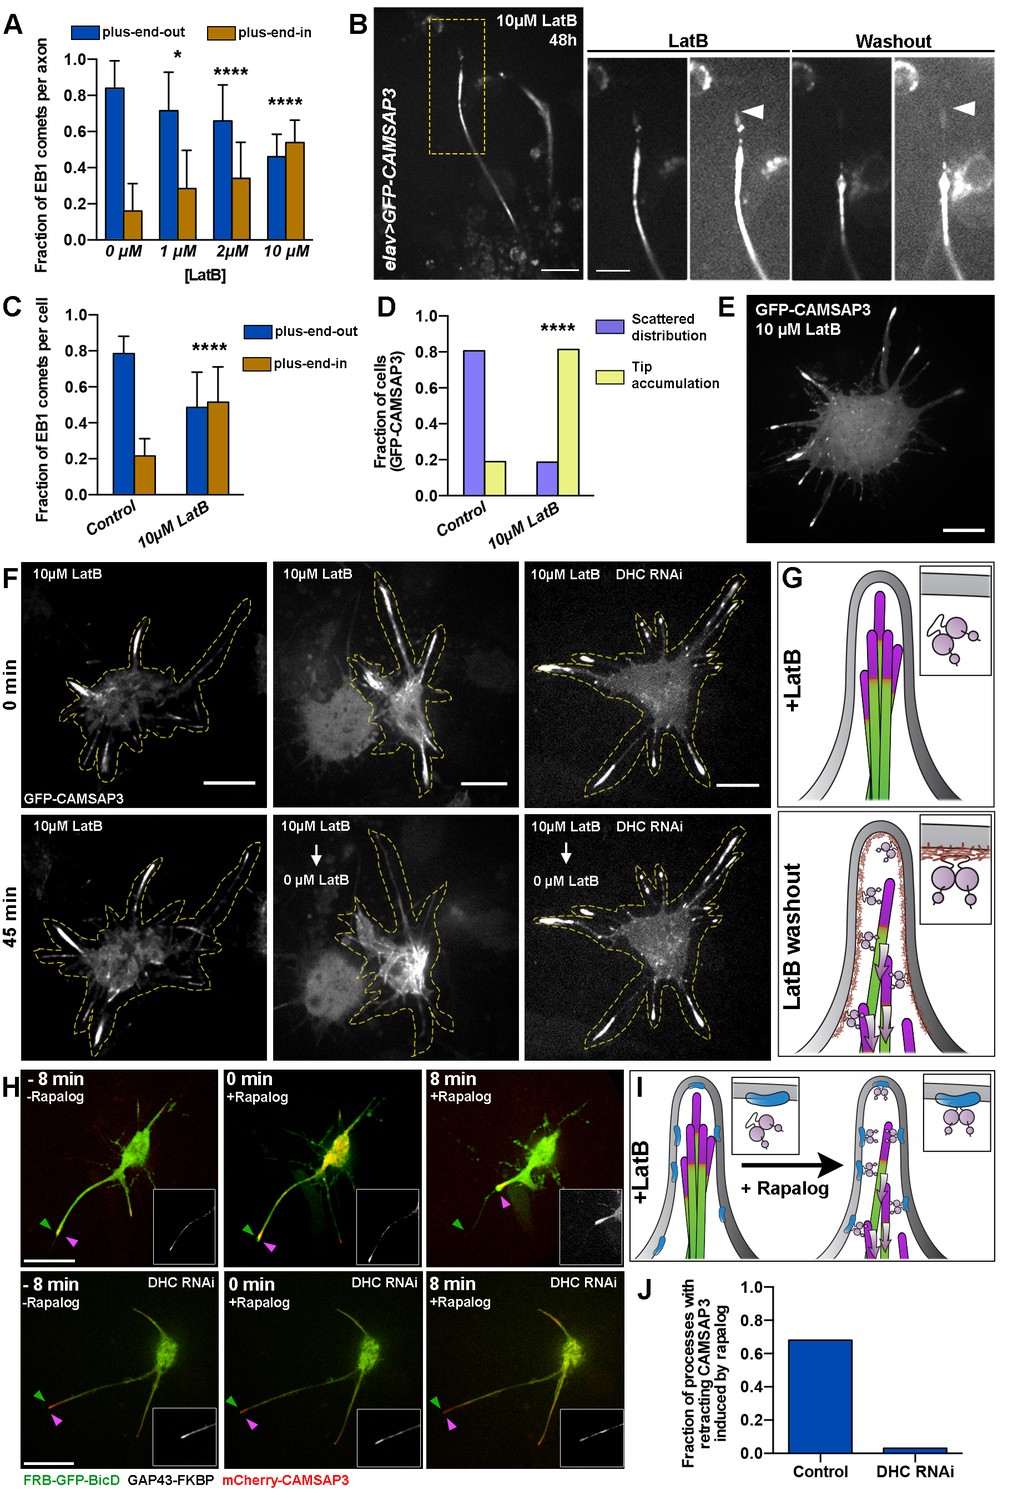
(A) Actin depolymerization in cultured neurons results in formation of axons with antiparallel microtubules. Graph depicts the fraction of axonal EB1 comets moving in each direction in 48 hr-cultured neurons treated with different concentrations of LatB. Error bars indicate s.d. (0 µM LatB, n=34 axons with 905 comets; 1 µM LatB, n=20 axons with 852 comets; 2 µM LatB, n=37 axons with 102 comets; 10 µM LatB, n=15 axons with 547 comets). *p=0.0144, ****p<0.0001. Data collected from three independent experiments. (B) LatB treatment induces accumulation of minus-ends in neurite tips. A 48 hr-cultured neuron expressing elav>GFP-CAMSAP3. Panels on the right are magnified areas of the neurite tip before or 14 hr after LatB washout. Images are overexposed to show the outline of the neurite. Note that LatB washout induces retrograde movement of CAMSAP3 decorated microtubules. Scale bars are 10 µm and 5 µm, respectively. (C–E) Actin depolymerization in S2 cells results in the formation of processes with antiparallel microtubule orientation and an accumulation of microtubule minus-ends at the tips of processes (compare with Figure 2F–H). (C) Graph depicting the direction of EB1-GFP comets in S2 processes. Error bars indicate s.d. (Control, n=20 cells with 1833 comets; 10 µM LatB, n=22 cells with 2408 comets). ****p<0.0001. Data collected from three independent experiments. (D) Graph depicting the distribution of GFP-CAMSAP3 in the processes of S2 cells treated with 0.5 µM (control) or 10 µM LatB (Control, n=82 cells; 10 µM LatB, n=75 cells). ****p<0.0001. Data collected from three independent experiments. (E) Confocal image of a S2 cell expressing GFP-CAMSAP3 plated in 10 µM LatB. Note that GFP-CAMSAP3 accumulates at process tips. Scale bar, 10 µm. (F and G) Recruitment of dynein to cortical actin activates the sorting activity of dynein. (F) Representative still images from time-lapses of S2 cells expressing GFP-CAMSAP3 plated for 4 hr in the presence of 10 µM of LatB. In control cells, the microtubule minus-ends remain at the tips of the processes (left panels). LatB washout resulted in a clearing of microtubules minus-ends from processes (middle panels). Dynein knockdown impairs the microtubule sorting activity after LatB washout and microtubule minus-ends remained clustered at the tips (see Video 9). Scale bars, 10 µm. (G) Schematic representation of the LatB washout assays (microtubule minus-ends are represented in magenta). In the presence of LatB, dynein is decoupled from the plasma membrane, preventing its sorting activity (top panel). After washout, dynein is recruited to the plasma membrane by cortical actin, resulting in robust microtubule sorting and transport of minus-end-out microtubules toward the cell body (bottom panel).(H–I) Direct recruitment of dynein to the membrane bypasses the F-actin requirement for microtubule sorting. Endogenous dynein can be recruited to the plasma membrane in S2 cells coexpressing FRB-GFP-BicD and GAP43-FKBP. In the presence of 10 µM LatB, cortical actin is depolymerized and therefore dynein remains soluble in the cytoplasm. Addition of 1 µM rapalog induces the direct recruitment of the dynein-BicD complex to the plasma membrane (see Material and methods). The sorting activity of dynein was tracked by imaging mCherry-CAMSAP3. (H) Still images from time-lapses of a S2 cell before (left panel) and after addition of rapalog (middle and right panels). Magenta and green arrowheads represent the position of the membrane and the CAMSAP3, respectively. Note that the CAMSAP3 signal moves toward the cell body when rapalog is added while there is not a substantial retraction of the processes (see Video 10). If the same experiment is performed in DHC RNAi cells, addition of rapalog does not induce retrograde transport of the minus-end-out microtubules from the tips of processes (see Video 10). Scale bars, 10 µm. (I) Schematic representation of the BicD-dynein recruitment assays (microtubule minus-ends are represented in magenta). In the presence of LatB, dynein is soluble in the cytoplasm. Addition of rapalog directly recruits dynein to the membrane in the presence of BicD recruitment proteins, activating dynein’s sorting activity and retrograde transport of microtubules to the cell body. (J) Fraction of processes that displayed retrograde movement of minus-end-out microtubules as imaged by CAMSAP3 signal. (Control, n=122 processes; DHC RNAi, n=99 processes). DHC, dynein heavy chain.
Figure 3—figure supplement 1
Validation of the rapalog recruitment assays in S2 cells.
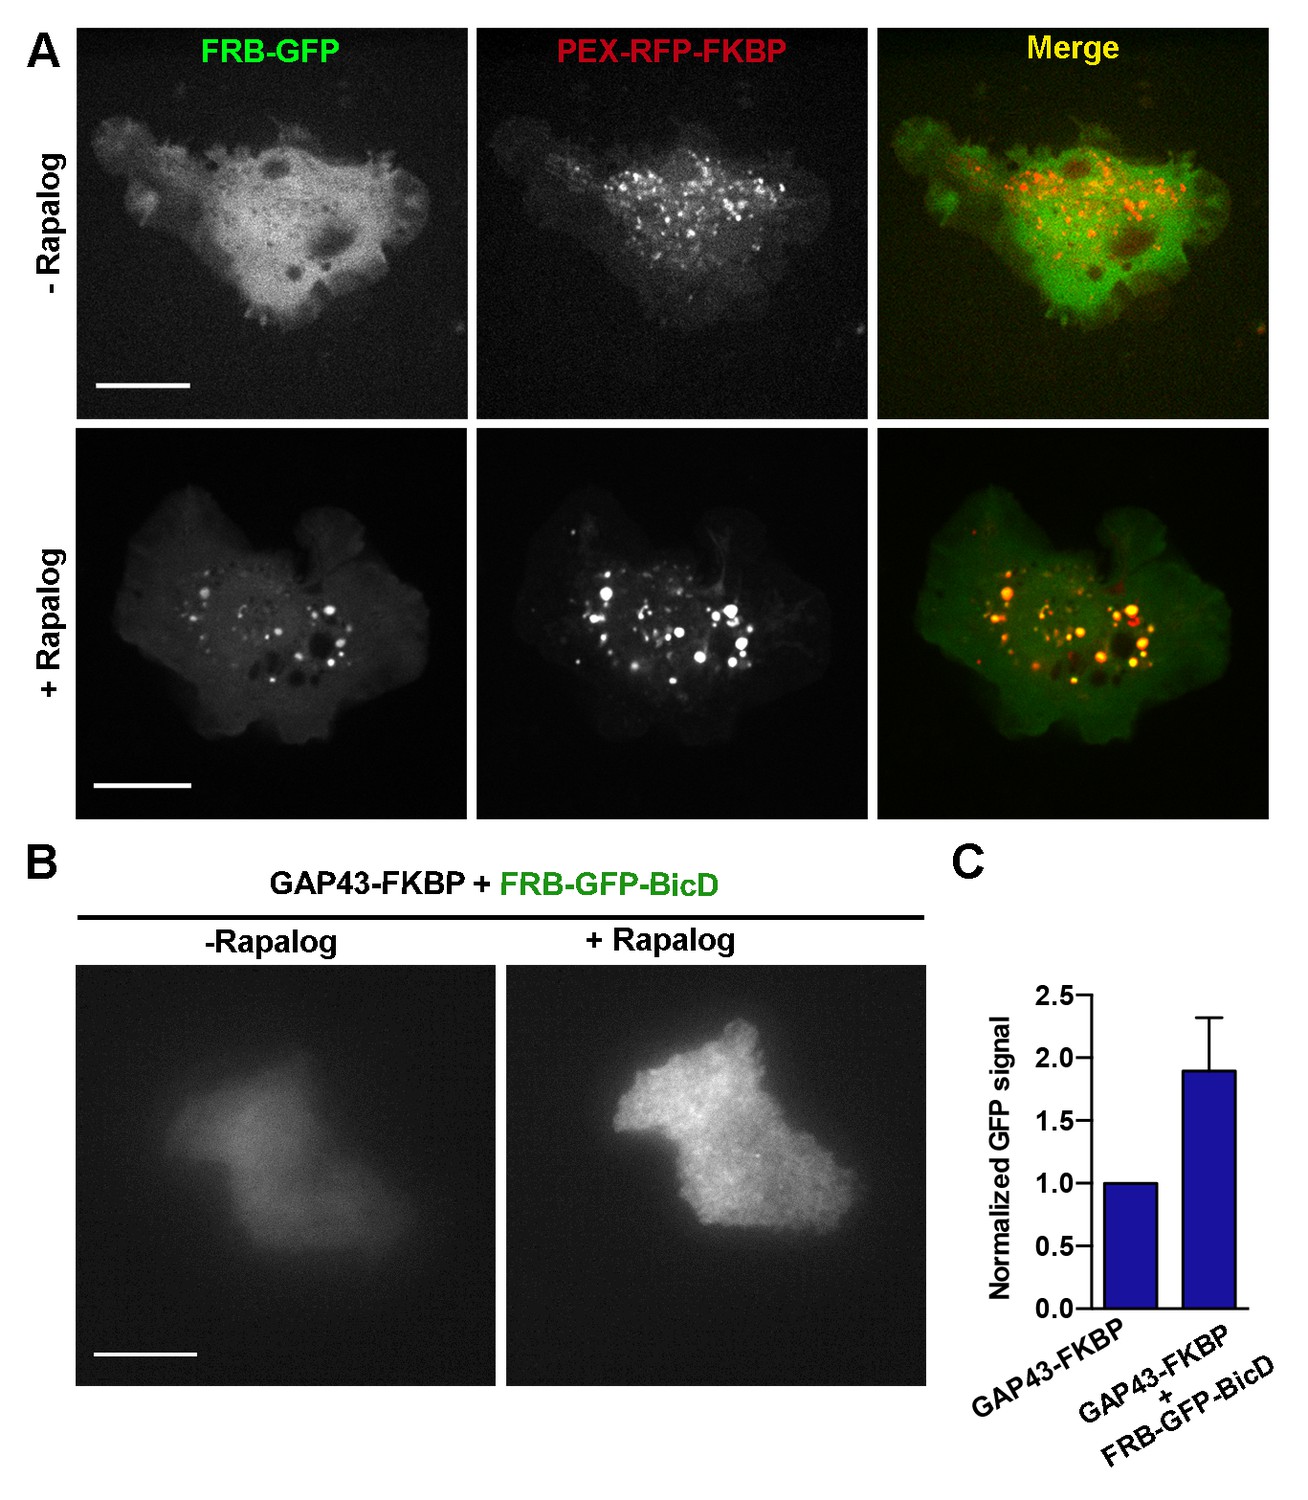
(A) S2 cells expressing FRB-GFP and PEX3-RFP-FKBP before (upper panels) and after (bottom panels) addition of rapalog. Note that in the presence of rapalog, GFP signal concentrates to peroxisomes. Scale bars, 10 µm. (B) TIRF images of S2 cells expressing FRB-GFP-BicD and GAP43-FKBP before and after addition of rapalog. Both images were acquired using the same laser power and exposure time. (C) Quantification of the GFP TIRF signal in cells expressing FRB-GFP-BicD with or without GAP43-FKBP after addition of rapalog. Note that the increase of the GFP signal at the membrane only happens in the presence of GAP43-FKBP, demonstrating that BicD was successfully recruited to the plasma membrane. Error bars indicate s.d. (FRB-GFP-BicD, n=12 cells; FRB-GFP-BicD + GAP43-FKBP, n=14 cells). TIRF, total internal reflection fluorescence.
Figure 4

Model of microtubule sliding and axon formation.
(A) Kinesin-1 induced sliding of antiparallel microtubules initiates formation of processes. Note that at this stage cortical dynein can only slide microtubules parallel to the plasma membrane, suggesting that dynein is not involved in the initiation of processes. (B) Short neurites contain antiparallel microtubule arrays. Under this configuration, kinesin-1 still slides microtubules with their minus-ends out, and cortical dynein can start removing minus-end-out microtubules to the cell body. (C) Due to continuous dynein-powered sorting activity, the growing axon is mostly filled with uniformly oriented plus-end-out microtubules. At this stage, dynein can continue removing minus-end-out microtubules, and can contribute to axon elongation by pushing plus-end-out microtubules toward the tip (see Roossien et al., 2014). Note that at this stage, kinesin-1 motors only bundle parallel microtubules and no longer contribute to microtubule sliding or outgrowth. The triangles on the right represent the contribution of the motors at each stage.
Videos
Video 1
Microtubules slide in both directions in Drosophila-cultured neurons.
Time-lapse video of photoconverted microtubules in Drosophila-cultured neurons expressing tdEOS-αtubulin. A small area of the nascent axon was photoconverted by 405 nm light. Note that microtubules slide in both directions. Scale bar 5 µm.
Video 2
CAMSAP3 decorates microtubule-ends in Drosophila cells.
Related to Figure 1B. A time-lapse video of S2 cells expressing GFP-CAMSAP3 and mCherry-tubulin. Scale bar 10 µm.
Video 3
Microtubule plus-ends and minus-ends binding proteins do not colocalize in Drosophila S2 cells.
Related to Figure 1—figure supplement 1B,C. A time-lapse video of a S2 cell coexpressing EB1-GFP and mCherry-CAMSAP3. Scale bar, 10 µm.
Video 4
Initial process outgrowth in Drosophila S2 cells is driven by microtubule minus-ends.
Related to Figure 1C. A time-lapse video of Drosophila S2 cells expressing GFP-CAMSAP3 plated for 5 min. Deep red dye was used to stain the membrane. Scale bars 10 µm and 5 µm, respectively.
Video 5
Microtubule minus-ends push the plasma membrane in growing neurites of young cultured Drosophila neurons.
Related to Figure 1I. Time-lapse video of a Drosophila neuron expressing elav>GFP-CAMSAP3 cultured for 4 hr. Deep red dye was used to stain the membrane. Scale bar 5 µm.
Video 6
Axonal microtubule organization switches from mixed to uniform orientation during neuron development.
Related to Figure 2A. Time-lapse videos of Drosophila-cultured neurons expressing ubi-EB1-GFP cultured for 4 hr, 21 hr and 48 hr. Scale bars, 10 µm.
Video 7
Dynein knockdown causes axons to contain antiparallel microtubules.
Related to Figure 2C. Time-lapse videos of a control and two elav>DHC shRNA Drosophila cultured neurons expressing EB1-GFP. Scale bars, 10 µm.
Video 8
Dynein RNAi causes mixed microtubule orientation in processes of Drosophila S2 cells.
Related to Figure 2F. Time-lapse videos of a control (untreated) and DHC RNAi Drosophila S2 cells expressing EB1-GFP. Scale bars, 10 µm.
Video 9
Cortical dynein sorts cytoplasmic microtubules.
Related to Figure 3F. Time-lapse images of S2 cells expressing GFP-CAMSAP3 cultured with 10 µM LatB. The drug was then washed out in control and DHC RNAi cells. Scale bars, 10 µm.
Video 10
Direct recruitment of cytoplasmic dynein to the plasma membrane activates its microtubule sorting activity in the absence of F-actin.
Related to Figure 3H. S2 cells expressing GAP43-FKBP, FBP-GFP-BicD and mCherry-CAMSAP3 (control and DHC RNAi) were cultured in the presence of 10 µM LatB for 2 hr. To recruit BicD to the membrane 1 µM rapalog was added to the medium. Time-lapse videos were taken before and after addition of rapalog. Scale bar, 10 µm.
Download links
A two-part list of links to download the article, or parts of the article, in various formats.
Downloads (link to download the article as PDF)
Open citations (links to open the citations from this article in various online reference manager services)
Cite this article (links to download the citations from this article in formats compatible with various reference manager tools)
Interplay between kinesin-1 and cortical dynein during axonal outgrowth and microtubule organization in Drosophila neurons
eLife 4:e10140.
https://doi.org/10.7554/eLife.10140


