Pharyngeal neuronal mechanisms governing sour taste perception in Drosophila melanogaster
- Department of Bio & Fermentation Convergence Technology, Kookmin University, Republic of Korea
Figures
Figure 1 with 1 supplement
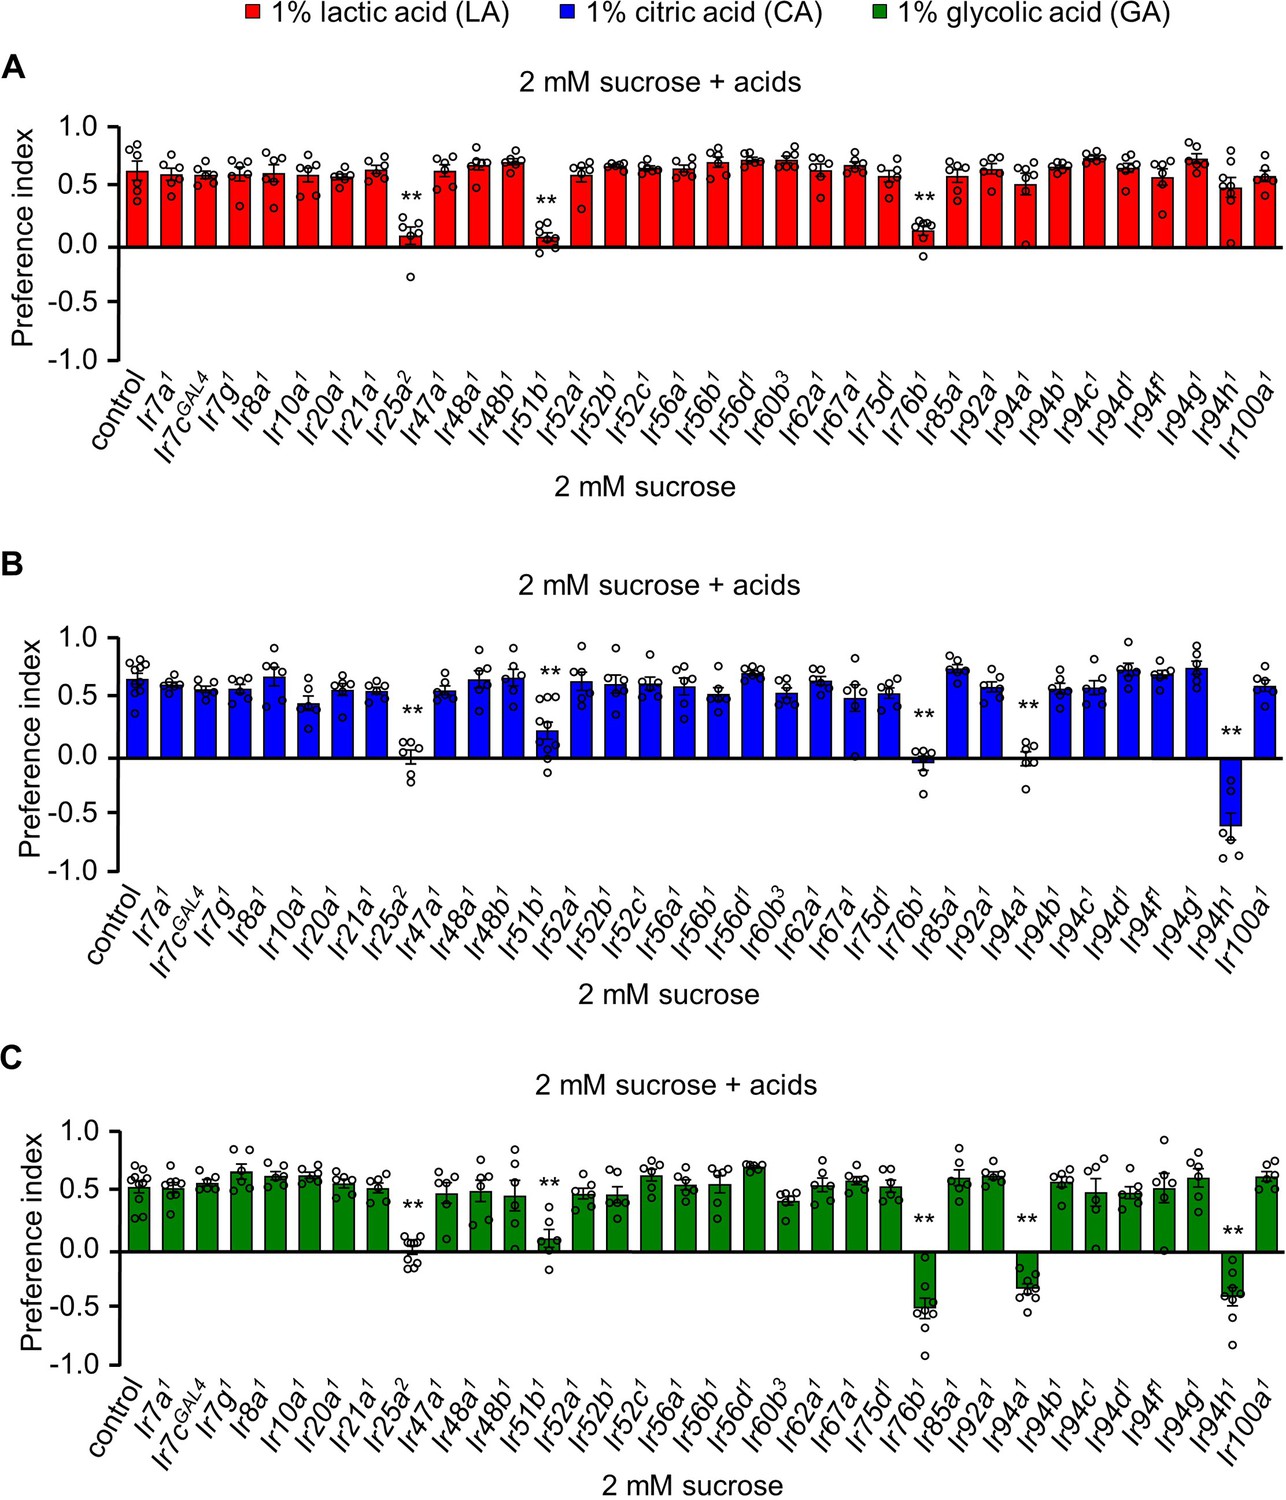
Ionotropic receptors are essential for sensing carboxylic acids in Drosophila melanogaster.
Screening of candidate 33 Ir mutants through binary food choice assay in presence of (A) 1% lactic acid (LA), (B) 1% citric acid (CA), and (C) 1% glycolic acid (GA) (n = 6–8 biological replicates). The control flies were w1118. All error bars represent SEMs. Single-factor ANOVA with Scheffe’s analysis was used as a post hoc test to compare multiple sets of data. Circular dots represent the number of trials performed. Asterisks indicate statistical significance compared with control; **p < 0.01.
Figure 1—figure supplement 1
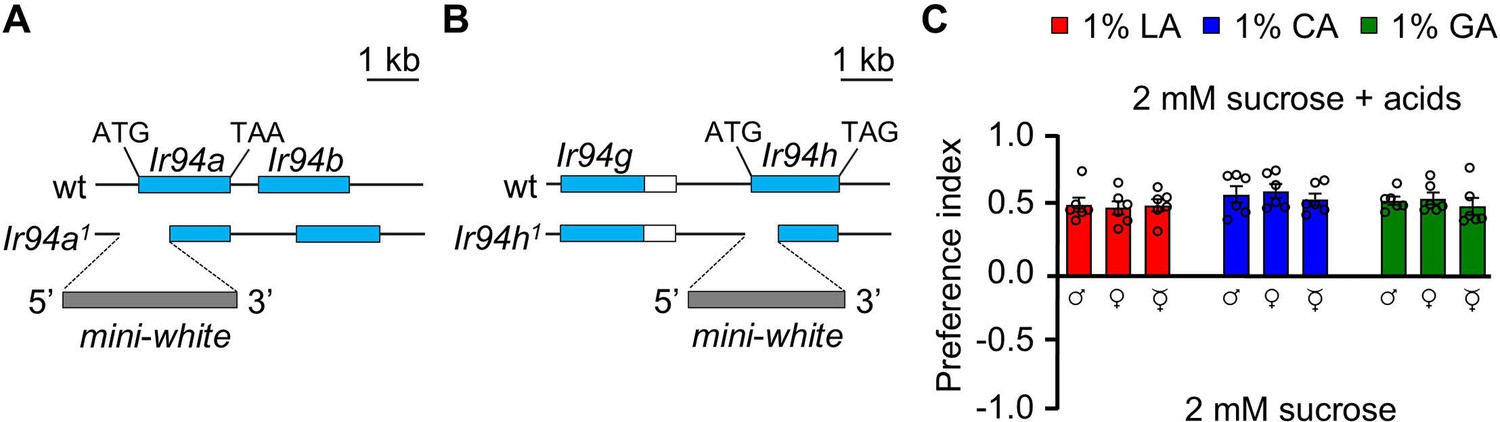
Structural analysis of (A) Ir94a1 and (B) Ir94h1 genes, (C) gender-dependent response to 1% carboxylic acid.
Figure 2 with 1 supplement
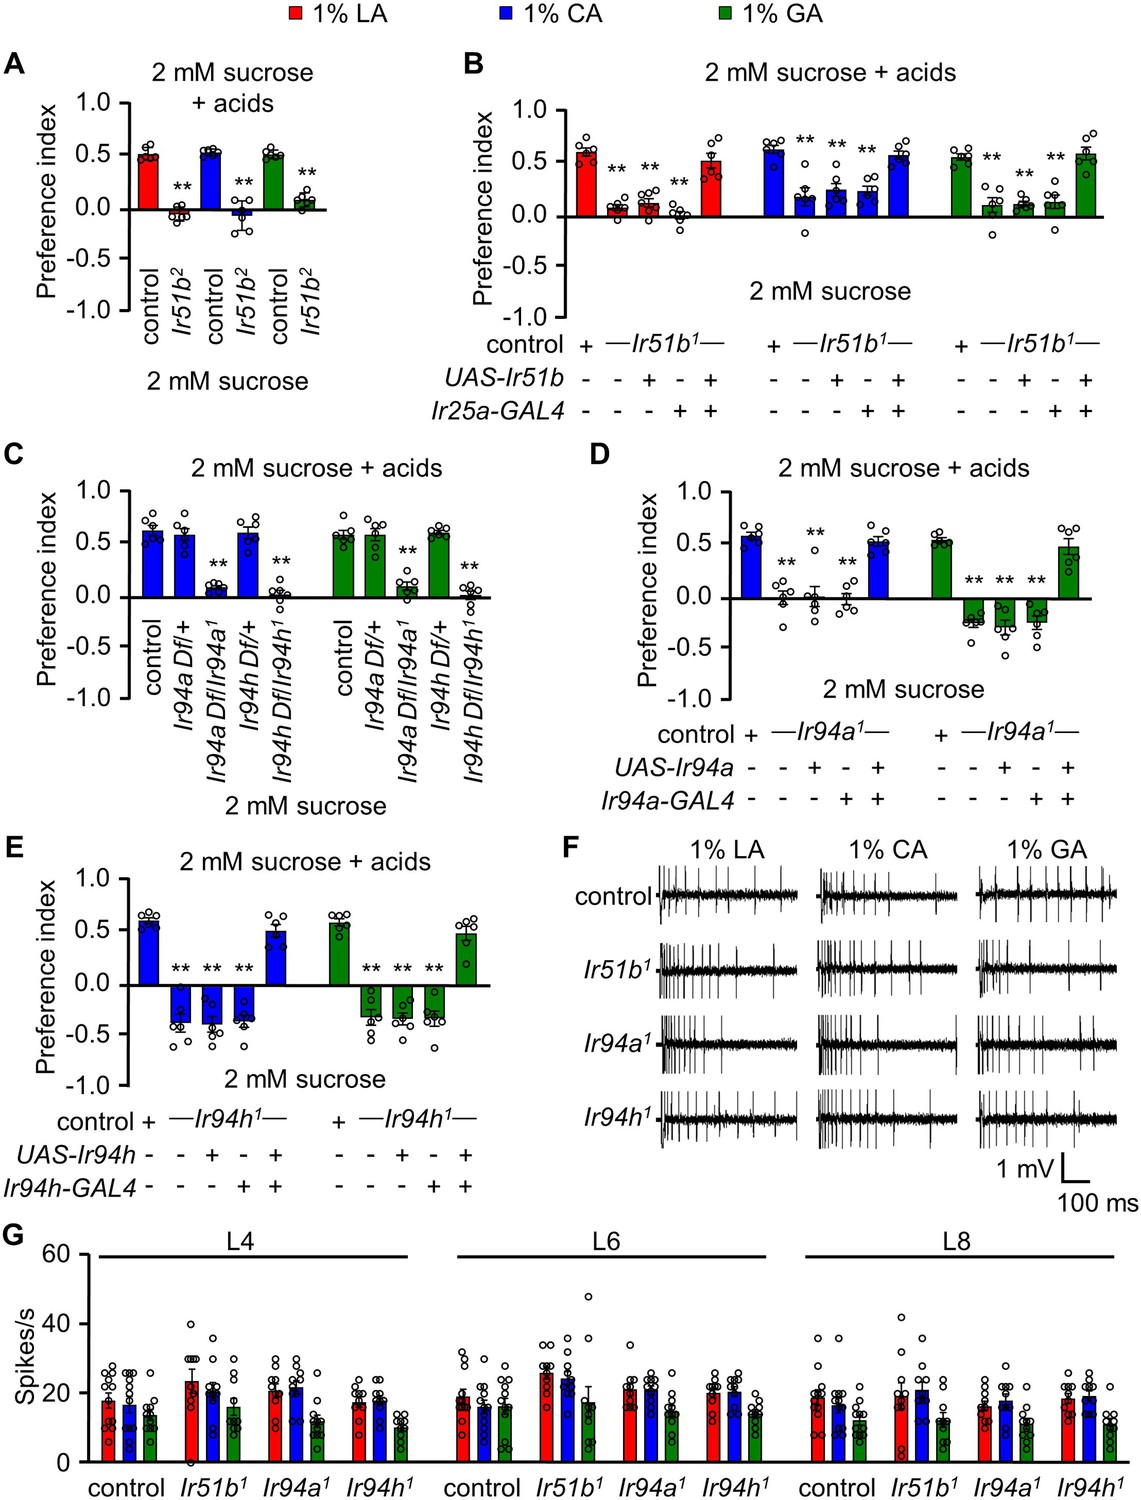
IR51b, IR94a, and IR94h are required to sense 1% lactic acid (LA), citric acid (CA), and glycolic acid (GA).
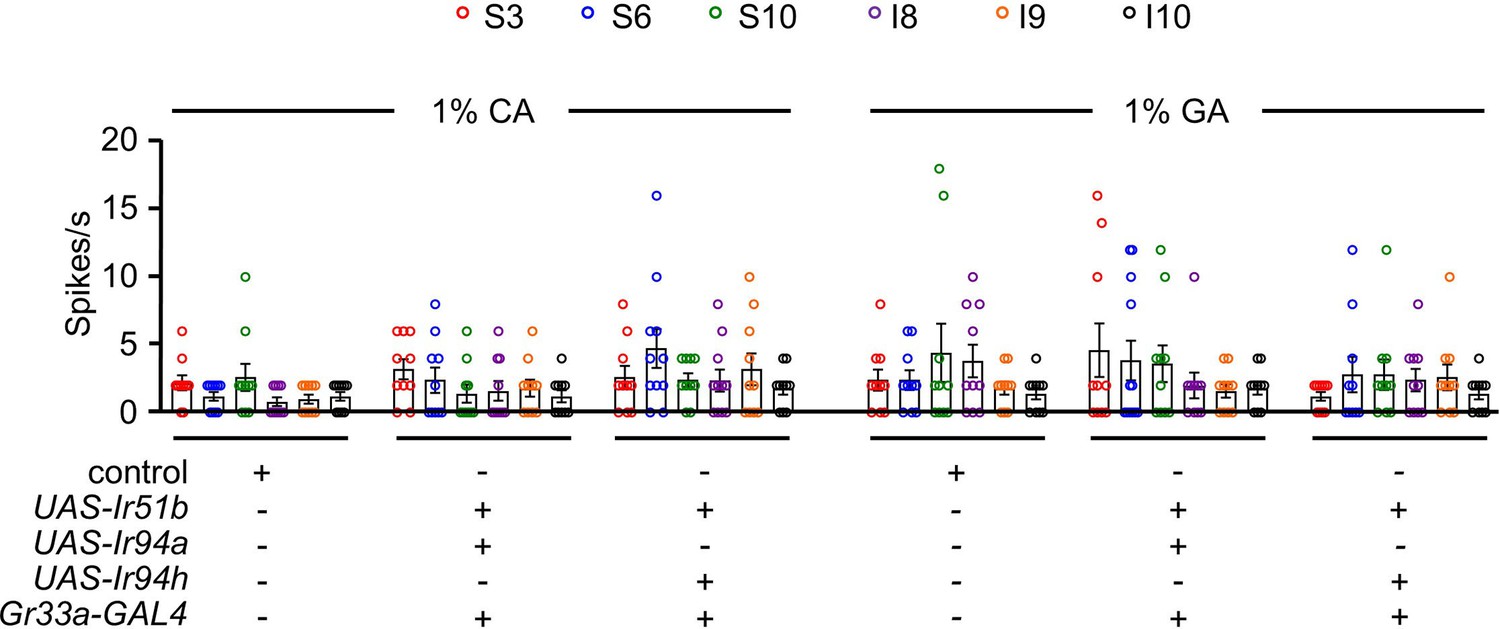
(A) Two-way choice assay of control and Ir51b2 (in-frame knock-in of GAL4) in 1% LA, CA, and GA (n = 6 biological replicates). (B) Rescue of Ir51b1 mutant defect to sense the taste of carboxylic acid in binary food choice assay driven under the control of broadly expressed Ir25a-GAL4 (n = 6–10 biological replicates). (C) Feeding assay analysis of Ir94a and Ir94h mutation in trans with a deficiency (Df) that spans Ir94a and Ir94h, respectively, in 1% CA and GA (n = 6 biological replicates). (D) Binary food choice assay to rescue the defect of Ir94a1 by expressing wild-type cDNA under the control of Ir94a-GAL4 in presence of 1% CA and GA (n = 6–8 biological replicates). (E) Rescuing the defect of Ir94h1 by expressing wild-type cDNA under the control of Ir94h-GAL4 in presence of 1% CA and GA (n = 6–8 biological replicates). (F) Sample trace representing the action potential from 1% CA in control, Ir51b1, Ir94a1, and Ir94h1 flies. (G) Average number of spikes per second of control flies along with Ir51b1, Ir94a1, and Ir94h1 flies stimulated by 1% LA, CA, and GA from L-type sensilla (L4, L6, and L8) (n = 10 biological replicates). The control flies were w1118. All error bars represent SEMs. Single-factor ANOVA with Scheffe’s analysis was used as a post hoc test to compare multiple sets of data. Circular dots represent the number of trials performed. Black asterisks indicate statistical significance compared with control; **p < 0.01.
Figure 2—figure supplement 1
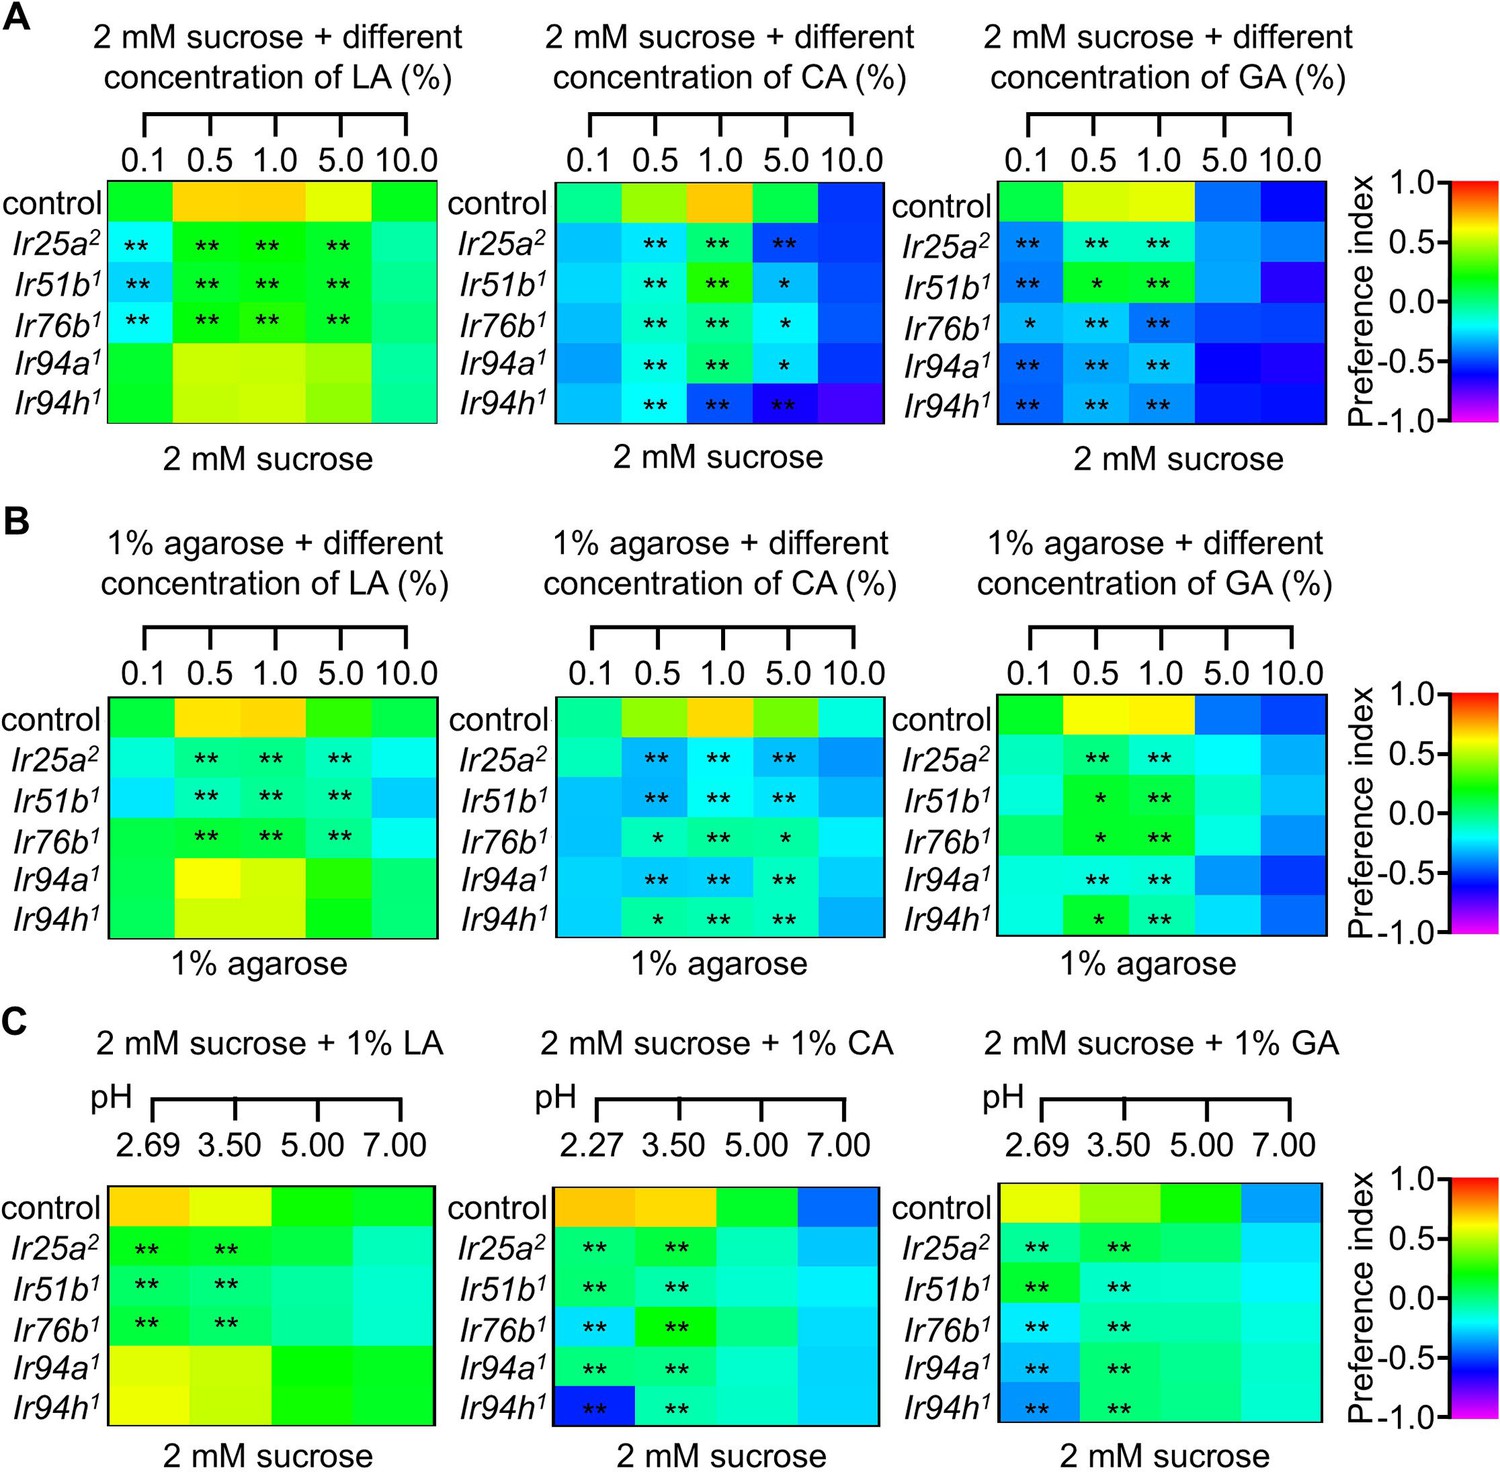
Carboxylic acid profiling in the (A) presence or (B) absence of varying sucrose concentrations and (C) pH levels.
The control flies were w1118. All error bars represent SEMs. Single-factor ANOVA with Scheffe’s analysis was used as a post hoc test to compare multiple sets of data. Black asterisks indicate statistical significance compared with control; *p<0.05, **p < 0.01.
Figure 3 with 1 supplement
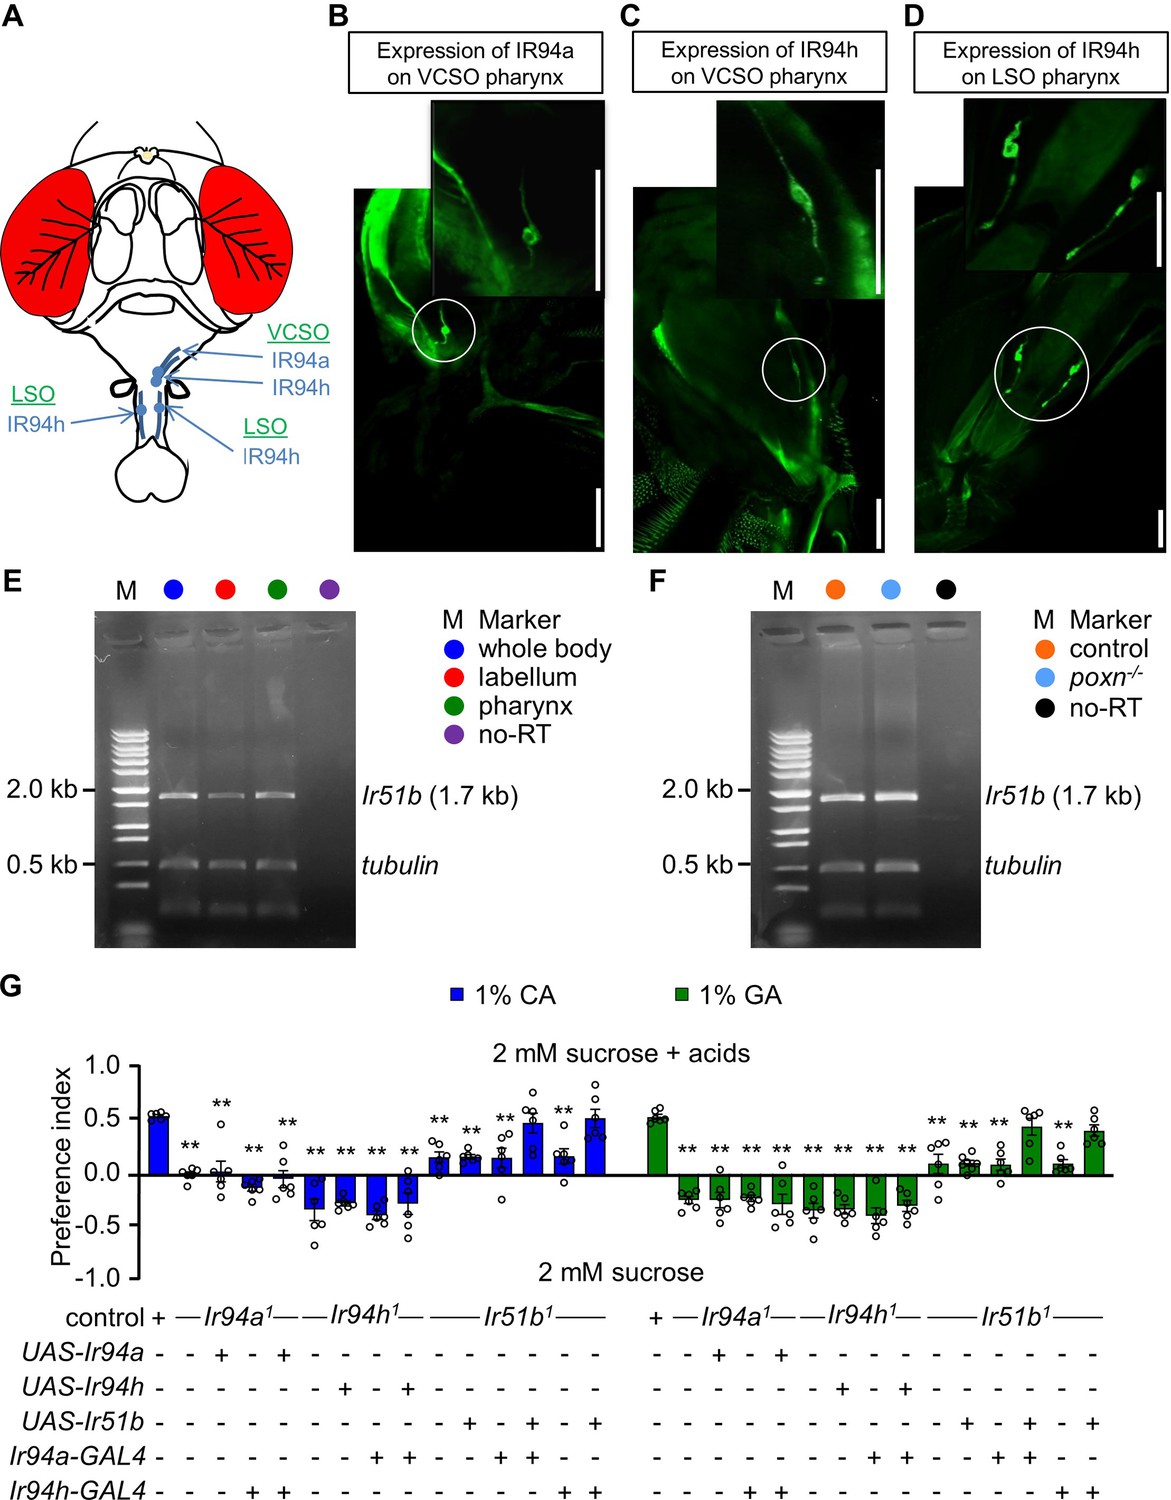
Ir51b, Ir94a, and Ir94h are expressed in pharynx of Drosophila melanogaster.
(A) Schematic diagrammatic representation of head of Drosophila depicting the location of Ir94a and Ir94h pharyngeal neuron. Images showing the expression of Ir94a and Ir94h neuron in different regions of pharynx, (B) the expression of Ir94a-GAL4 in ventral cibarial sense organ (VCSO) region of pharynx, (C) the expression of Ir94h-GAL4 in VCSO region of pharynx, and (D) the expression of Ir94h-GAL4 in labral sense organ (LSO) region of pharynx (scale bars, 100 μm). (E) Gel picture of RT-PCR resulting Ir51b expression in whole body, labellum, and pharynx. In lanes designated as ‘no-RT’, polyA+ RNA extracts underwent RT omission, and the absence of PCR products serves as evidence of the absence of genomic DNA contamination. Amplified tubulin (0.5 kb) was used as control. DNA ladder marker is denoted by ‘M’. (F) Gel picture of results from RT-PCR showing Ir51b expression in control (w1118) and poxn null alleles (poxn70 and poxnΔM22−B5) from pharynx. In lanes designated as ‘no-RT’, polyA+ RNA extracts underwent RT omission, and the absence of PCR products serves as evidence of the absence of genomic DNA contamination. Amplified tubulin (0.5 kb) was used as control. DNA ladder marker is denoted by ‘M’. (G) Feeding assay to rescue the defect of Ir94a1 and Ir51b1 by Ir94h-GAL4; and Ir94h1 and Ir51b1 by Ir94a-GAL4 in presence of 1% citric acid (CA) and glycolic acid (GA) (n = 6 biological replicates). All error bars represent SEMs. Single-factor ANOVA with Scheffe’s analysis was used as a post hoc test to compare multiple sets of data. Circular dots represent the number of trials performed. Black asterisks indicate statistical significance compared with control; **p < 0.01.
-
Figure 3—source data 1
Original gel picture to Figure 3, panel E.
Given gel is the picture of RT-PCR resulting Ir51b expression in whole body, labellum, and pharynx.
- https://cdn.elifesciences.org/articles/101439/elife-101439-fig3-data1-v1.zip
-
Figure 3—source data 2
Original gel picture to Figure 3, panel F.
Given gel is the picture of results from RT-PCR showing Ir51b expression in control (w1118) and poxn null alleles (poxn70 and poxnΔM22−B5) from pharynx.
- https://cdn.elifesciences.org/articles/101439/elife-101439-fig3-data2-v1.zip
Figure 3—figure supplement 1
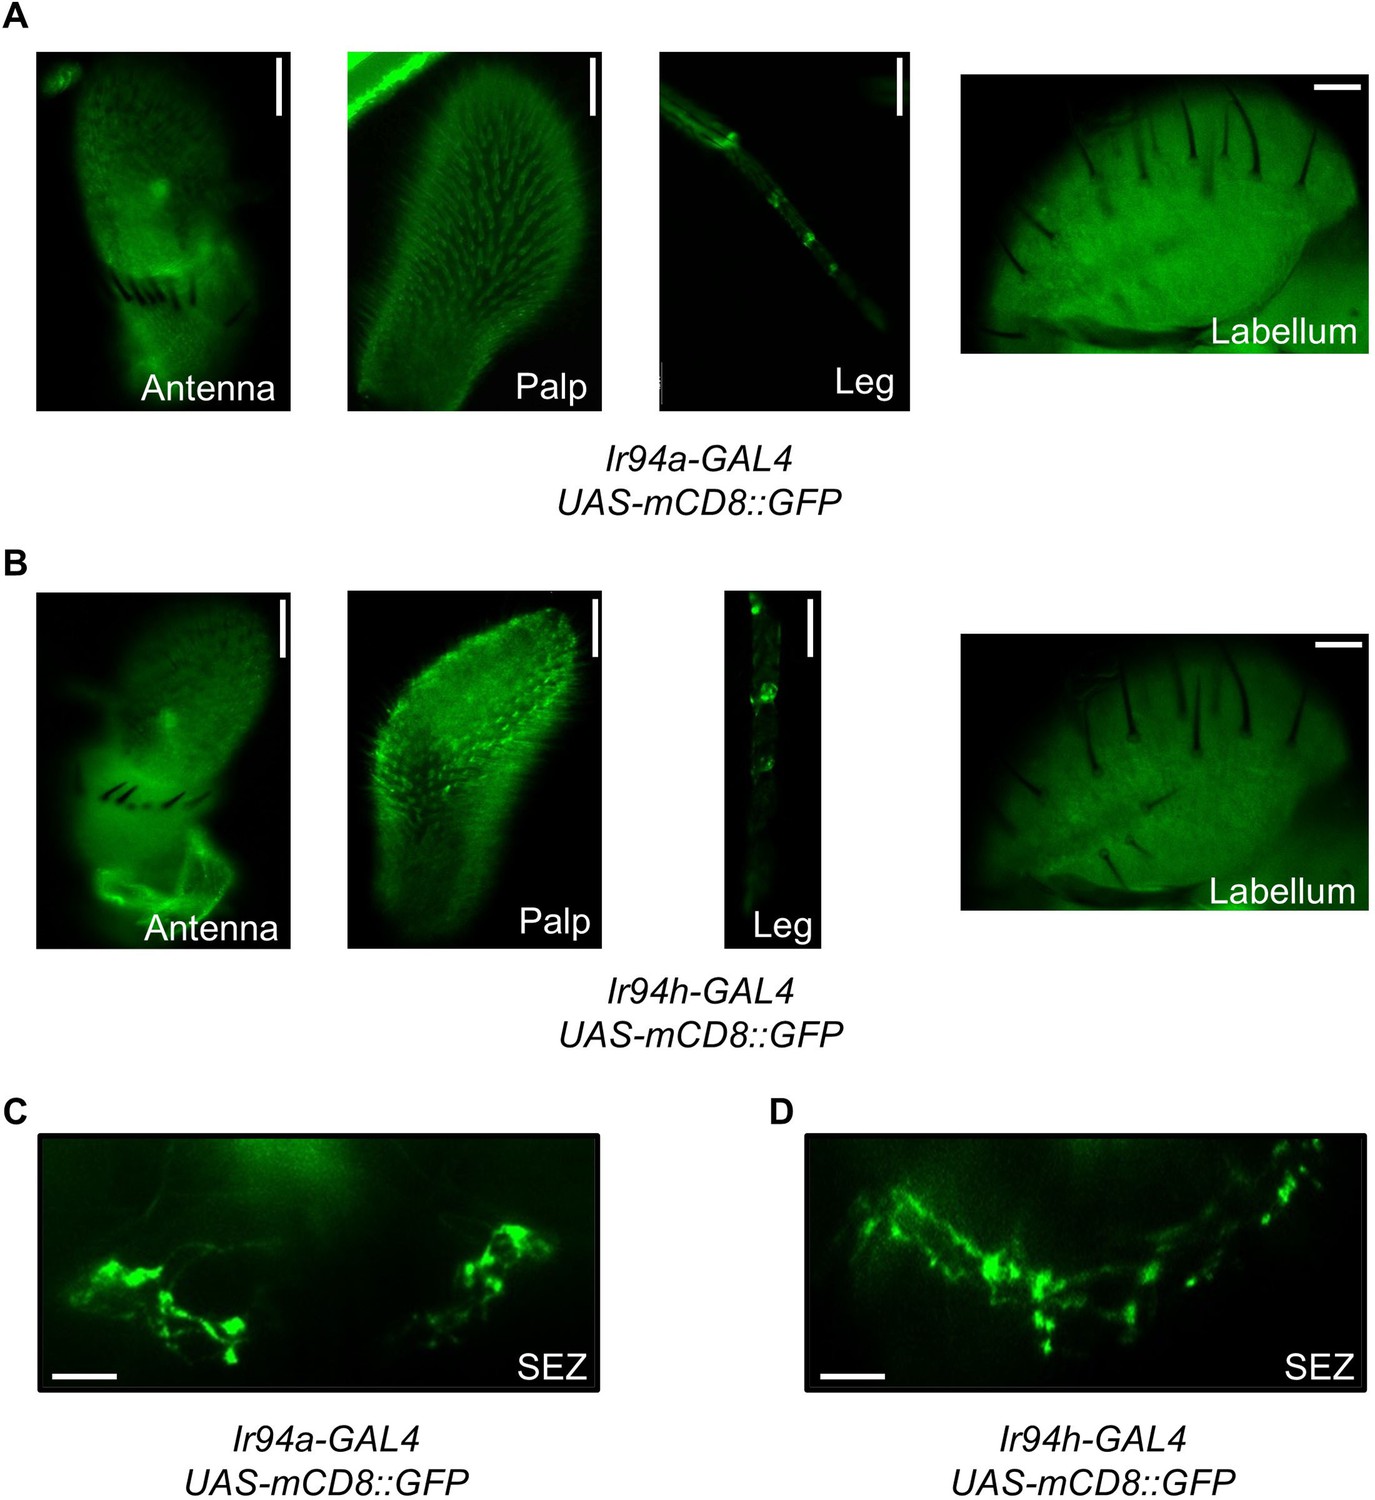
Limited expression of Ir94a and Ir94h in (A-C) gustatory organs and (D) brain suboesophageal region.
Figure 4
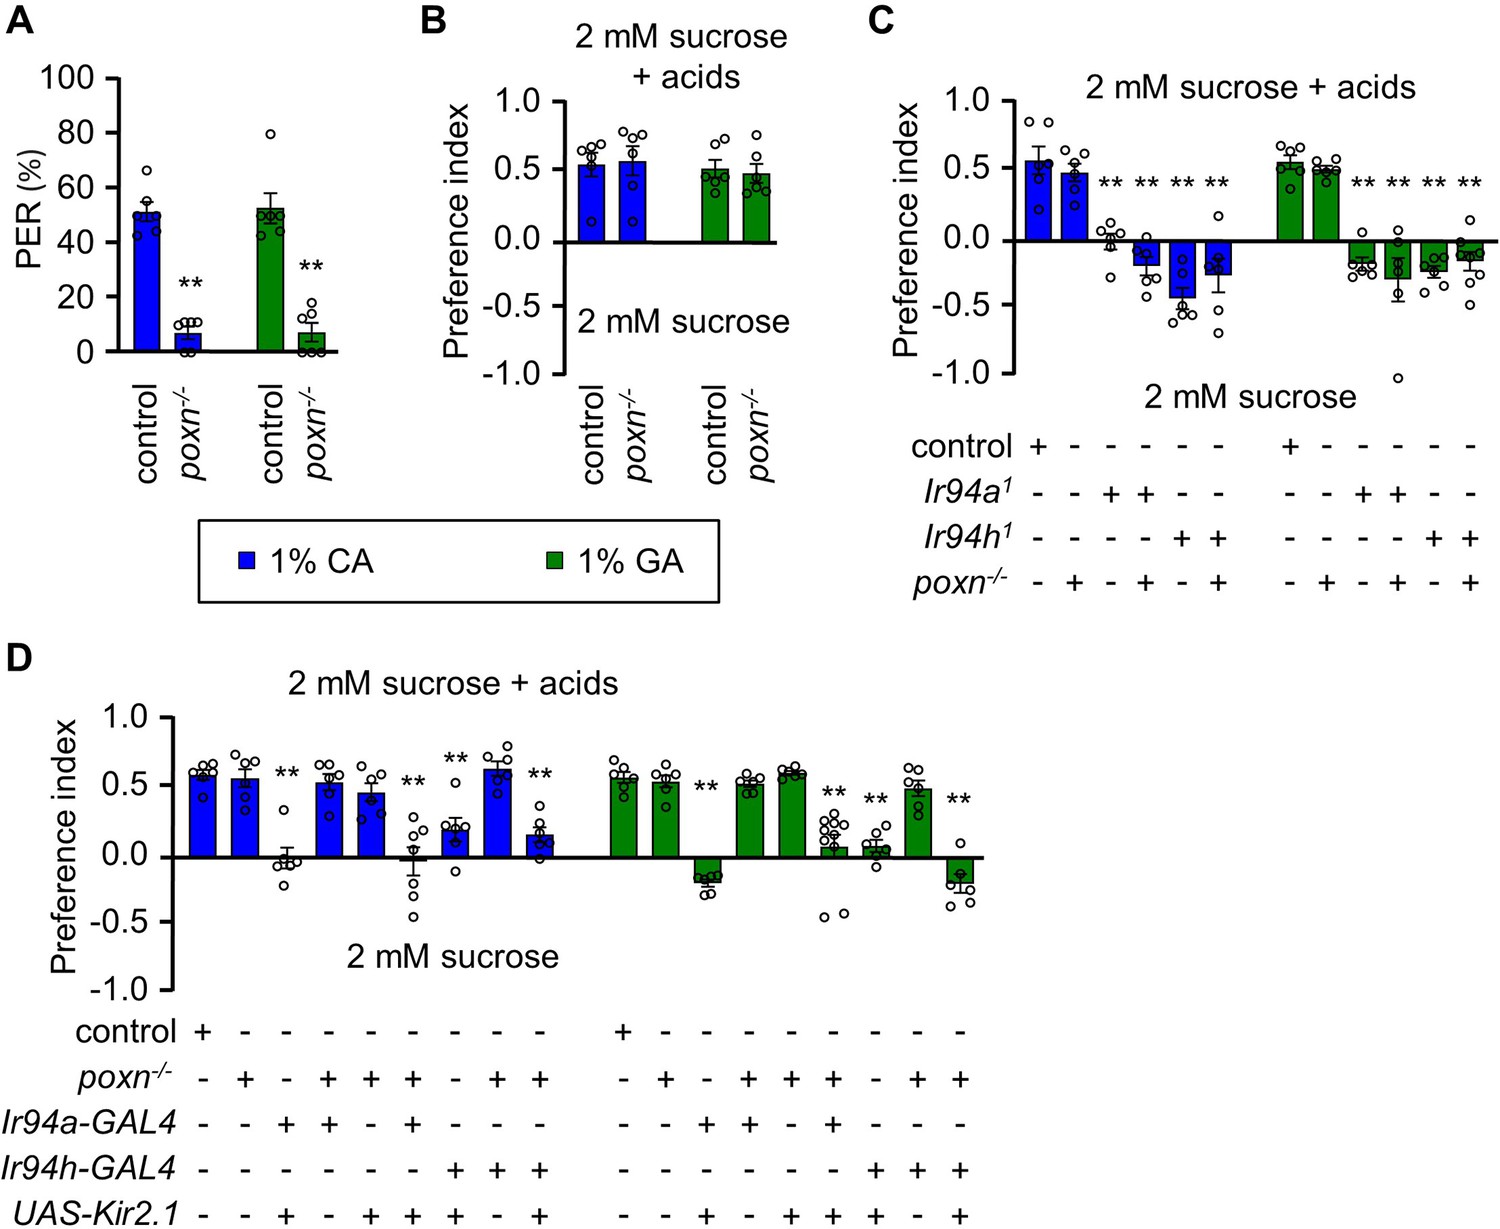
Pharyngeal gustatory receptor neurons (GRNs) have a role in sensing the taste of carboxylic acids.
(A) Proboscis extension response (PER) assay, (B) Binary food choice assay of control and poxn−/− mutant (poxn70/poxn∆M2−-B5) in presence of 1% citric acid (CA) and 1% glycolic acid (GA) (n = 6 biological replicates). (C) Feeding assay control and mutant line (Ir94a1 and Ir94h1) in poxn−/− mutant (poxn70/poxn∆M22−B5) mutant background in 1% CA and 1% GA (n = 6–8 biological replicates). (D) Mean preference index from binary food choice assay in presence of 1% CA and 1% GA for genetically silenced flies. Genetic manipulations were performed in poxn−/− mutant (poxn70/poxn∆M22−B5) mutant background for Ir94a-GAL4 and Ir94h-GAL4 by crossing with UAS-Kir2.1 (n = 6–10 biological replicates). The control flies were w1118. All error bars represent SEMs. Single-factor ANOVA with Scheffe’s analysis was used as a post hoc test to compare multiple sets of data. Black circular dots represent the number of trials performed. Black asterisks indicate statistical significance compared with control; **p < 0.01.
Figure 5 with 1 supplement
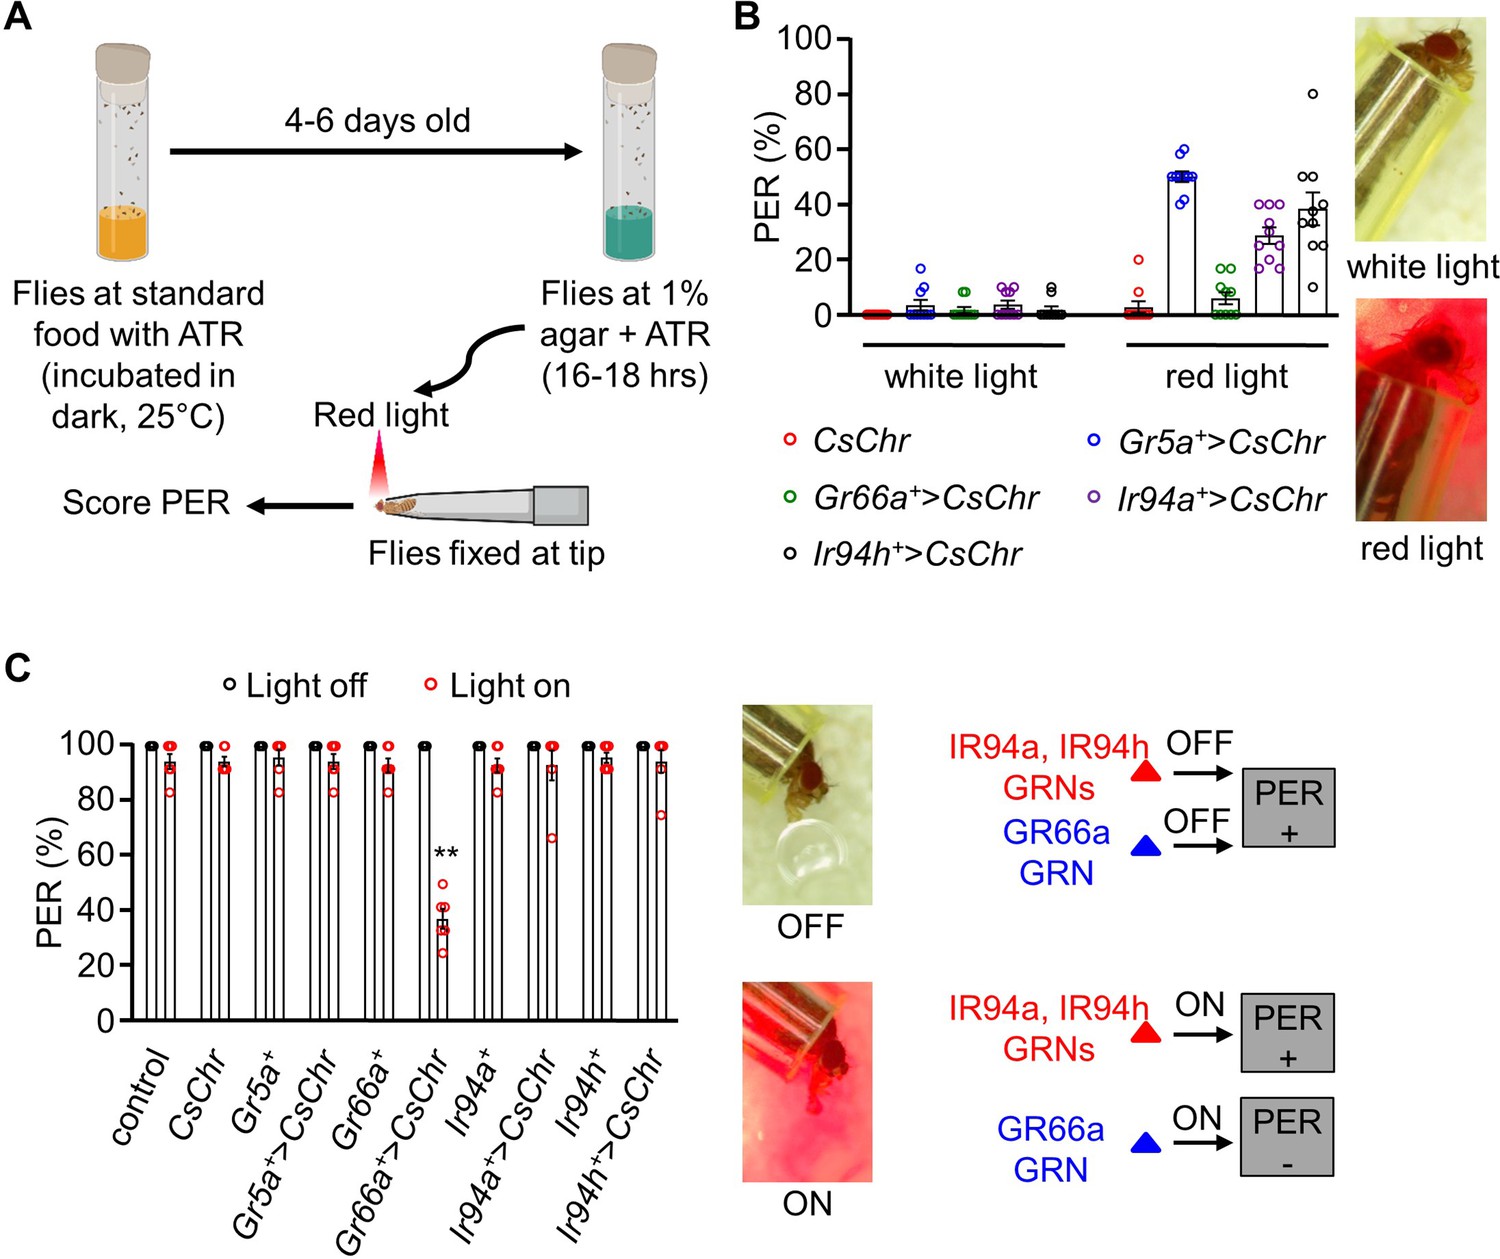
Stimulation of pharyngeal Ir94a and Ir94h gustatory receptor neurons (GRNs) using the optogenetic method.
(A) Schematic representation of optogenetics methods performed in the study (details in the Method section). (B) Optogenetic activation of Gr5a, Gr66a, Ir94a, and Ir94h GRNs by expressing red-shifted channelrhodopsin (UAS-CsChrimson) under the control of respective GAL4 drivers. White-light and red-light sources with low exposure time (3–5 s) were used in the experiment (n = 6–10 biological replicates). (C) Optogenetic activation of Gr5a, Gr66a, Ir94a, and Ir94h GRNs by expressing red-shifted channelrhodopsin (UAS-CsChrimson) under the control of respective GAL4 drivers with sucrose stimulation in white-light and red-light source. Left: Photograph showing the proboscis extension response (PER) in present and absence of red-light source. Bottom: Schematic representation showing PER response to sucrose in presence or absence of red light (n = 6 biological replicates). The control flies were w1118. All error bars represent SEMs. Single-factor ANOVA with Scheffe’s analysis was used as a post hoc test to compare multiple sets of data. Different colored circular dots represent the number of trials performed. Black asterisks indicate statistical significance compared with control; **p < 0.01.
Figure 5—figure supplement 1
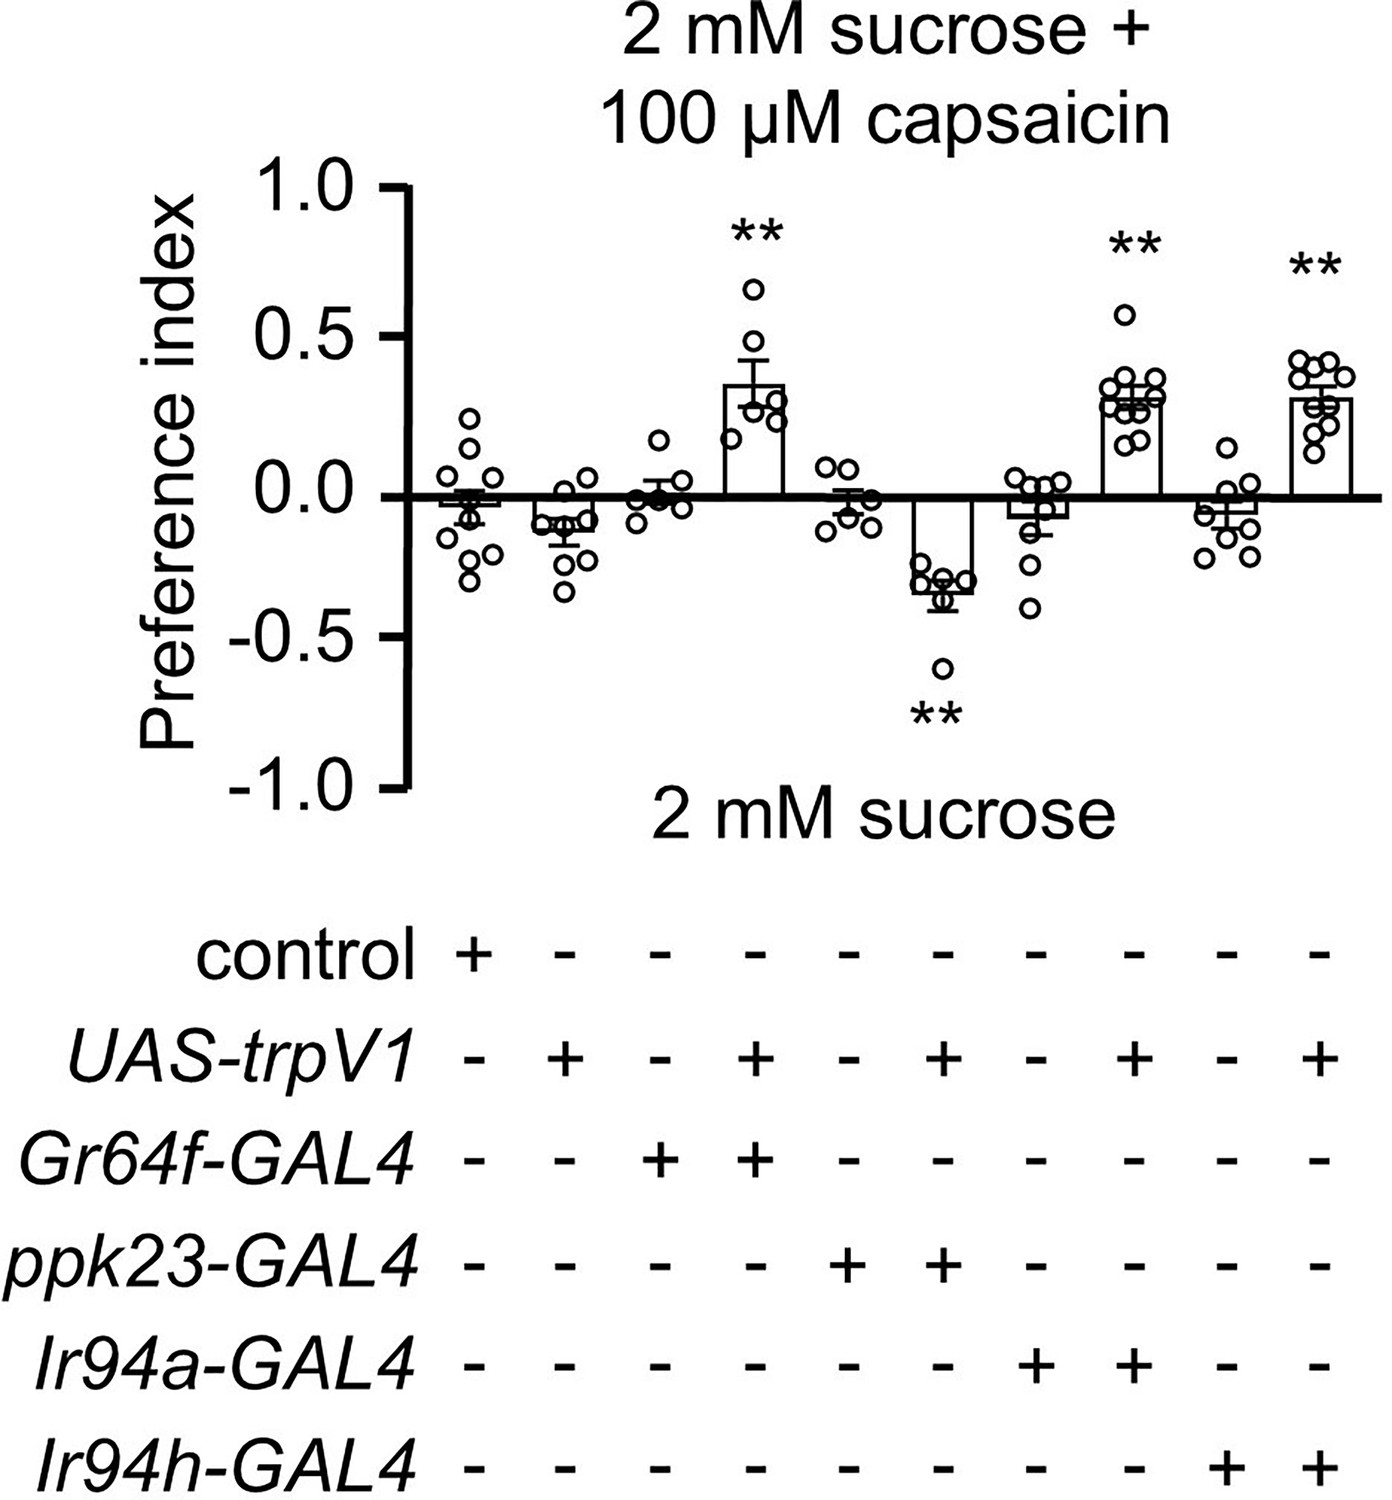
Stimulation of pharyngeal Ir94a and Ir94h gustatory receptor neurons (GRNs) via chemogenetic method.
The control flies were w1118. All error bars represent SEMs. Single-factor ANOVA with Scheffe’s analysis was used as a post hoc test to compare multiple sets of data. Black colored circular dots represent the number of trials performed. Black asterisks indicate statistical significance compared with control; **p < 0.01.
Figure 6 with 2 supplements
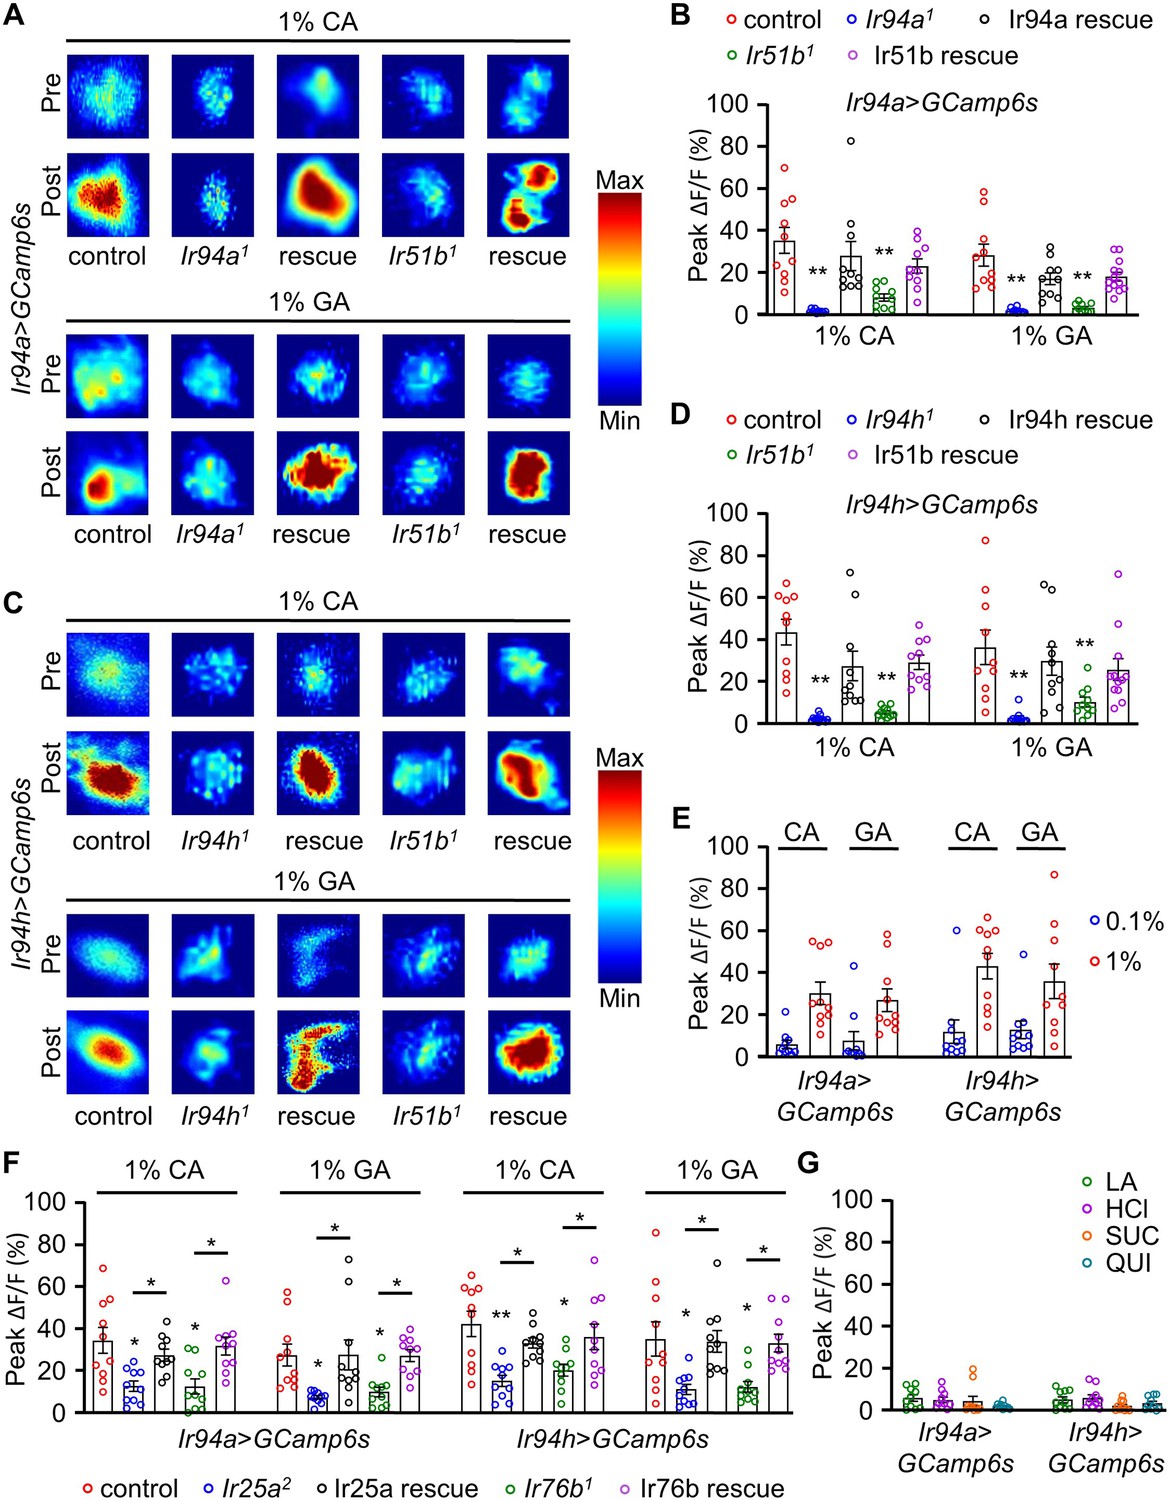
Calcium imaging analysis showing the activation of pharyngeal Ir94a and Ir94h gustatory receptor neurons (GRNs) with carboxylic acid applied as stimulus.
(A) Heatmap analysis of pre- and post-stimulus with Ir94a-GAL4 flies with expression of GCaMP6s in control, mutant (Ir94a1 and Ir51b1) background, and rescue flies. (B) Quantification of peak fluorescence changes with stimulation by 1% citric acid (CA) and glycolic acid (GA) for Ir94a-GAL4 flies with expression of GCaMP6s calcium indicator (n = 10–12 biological replicates). (C) Heatmap analysis of pre- and post-stimulus with Ir94h-GAL4 flies with expression of GCaMP6s in control, mutant (Ir94h1 and Ir51b1) background, and rescue flies. (D) Quantification of peak fluorescence changes with stimulation by 1% CA and GA for Ir94h-GAL4 flies with expression of GCaMP6s calcium indicator (n = 10–12 biological replicates). (E) Ir94a and Ir94h neuron calcium imaging in 0.1% and 1% CA and GA (n = 10 biological replicates). (F) Quantification of peak fluorescence changes with stimulation by 1% CA and GA for Ir94a-GAL4 and Ir94h-GAL4 flies with expression of GCaMP6s calcium indicator in control, mutant (Ir25a2 and Ir76b1) background and rescue flies (n = 10 biological replicates). (G) Peak fluorescence level intensity stimulated by 1% lactic acid (LA), 1% hydrochloric acid (HCl), sucrose (SUC), and quinine (QUI) with Ir94a-GAL4 and Ir94h-GAL4 flies by expression of GCaMP6s calcium indicator (n = 10 biological replicates). All error bars represent SEMs. Single-factor ANOVA with Scheffe’s analysis was used as a post hoc test to compare multiple sets of data. Colorful circle represents the number of trials performed. Black asterisks indicate statistical significance compared with control; *p<0.05, **p < 0.01.
Figure 6—figure supplement 1
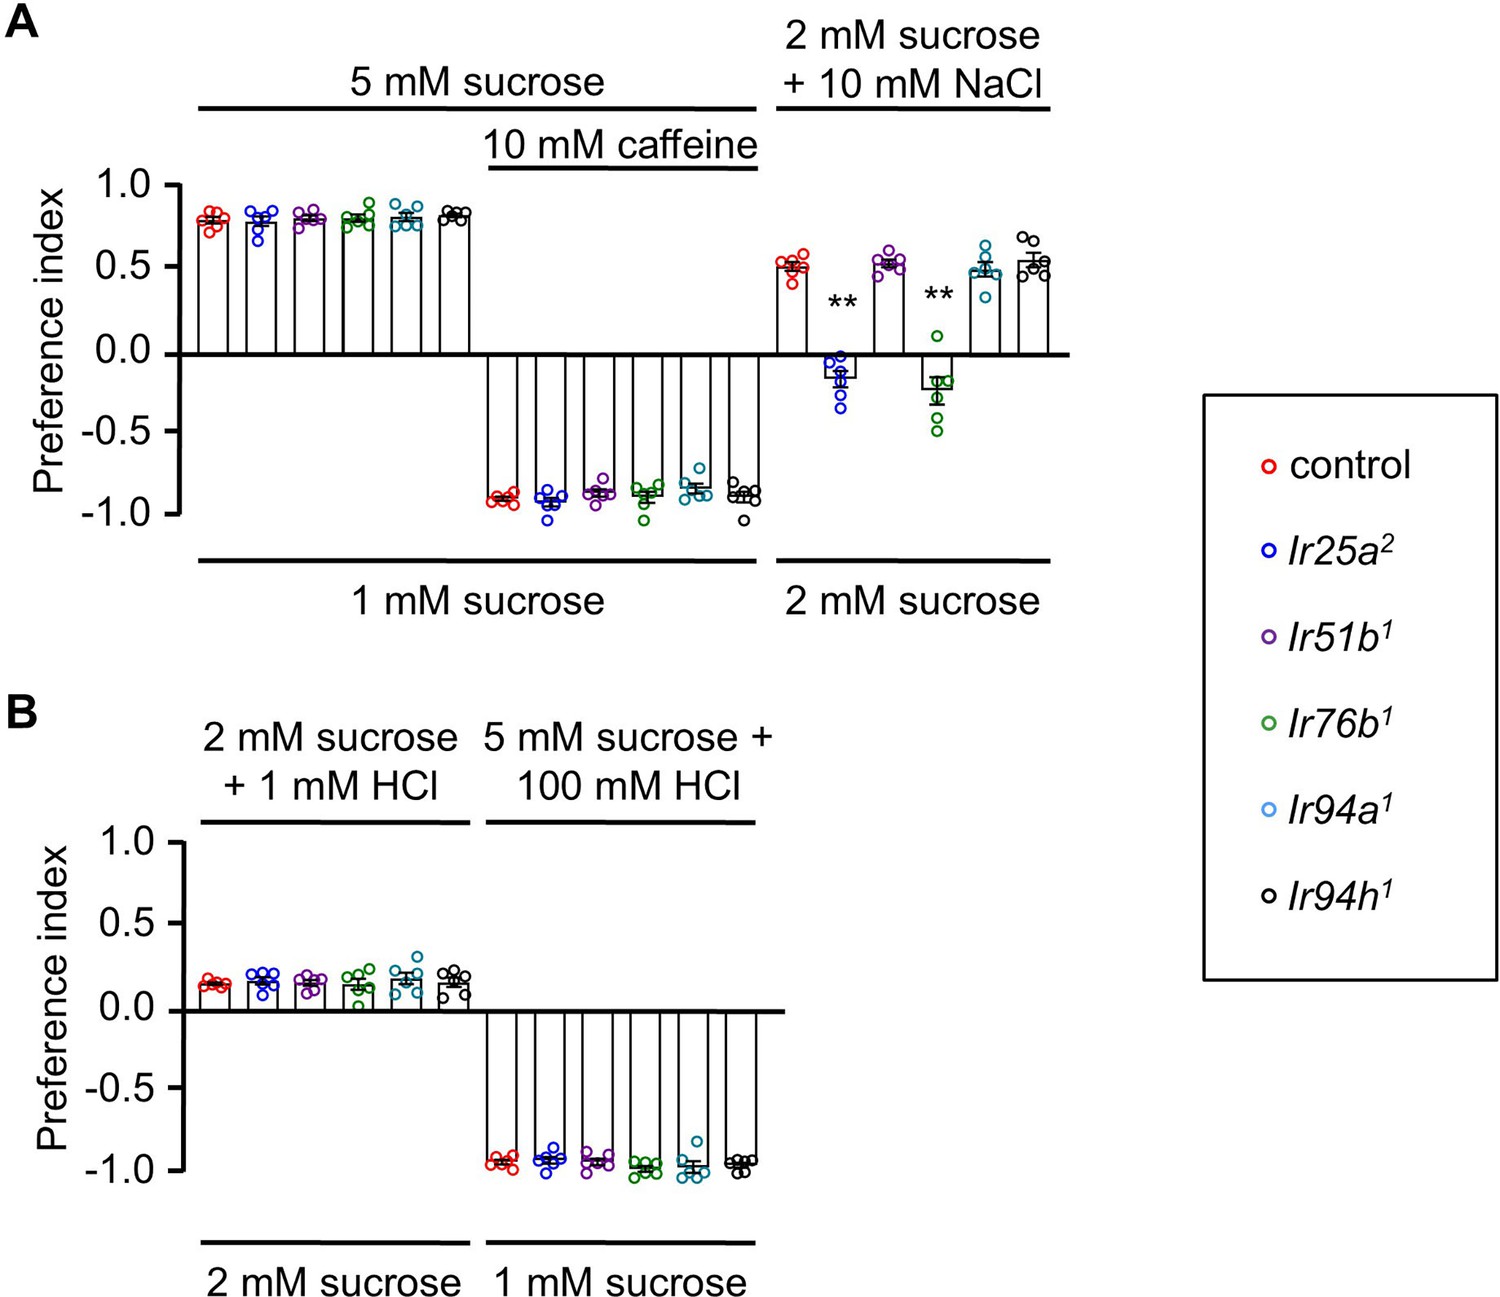
Feeding assay analysis of control and mutants (A-B) .
The control flies were w1118. All error bars represent SEMs. Single-factor ANOVA with Scheffe’s analysis was used as a post hoc test to compare multiple sets of data. Different colored circular dots represent the number of trials performed. Black asterisks indicate statistical significance compared with control; **p < 0.01.
Figure 6—figure supplement 2
Recapitulation of sour receptors.
Videos
Video 1
Ex vivo calcium imaging of Ir94a-GAL4 from ventral cibarial sense organ (VCSO) in pharynx with the stimulus 1% citric acid (CA).
Video 2
Ex vivo calcium imaging of Ir94h-GAL4 from labral sense organ (LSO) in pharynx with the stimulus 1% glycolic acid (GA).
Additional files
-
Supplementary file 1
Statistics for the data shown in Figure 2—figure supplement 1A.
- https://cdn.elifesciences.org/articles/101439/elife-101439-supp1-v1.docx
-
Supplementary file 2
Statistics for the data shown in Figure 2—figure supplement 1B.
- https://cdn.elifesciences.org/articles/101439/elife-101439-supp2-v1.docx
-
Supplementary file 3
Statistics for the data shown in Figure 2—figure supplement 1C.
- https://cdn.elifesciences.org/articles/101439/elife-101439-supp3-v1.docx
-
MDAR checklist
- https://cdn.elifesciences.org/articles/101439/elife-101439-mdarchecklist1-v1.pdf
Download links
A two-part list of links to download the article, or parts of the article, in various formats.
Downloads (link to download the article as PDF)
Open citations (links to open the citations from this article in various online reference manager services)
Cite this article (links to download the citations from this article in formats compatible with various reference manager tools)
Pharyngeal neuronal mechanisms governing sour taste perception in Drosophila melanogaster
eLife 13:RP101439.
https://doi.org/10.7554/eLife.101439.2


