Odors drive feeding through gustatory receptor neurons in Drosophila
- RIKEN Center for Brain Science, Japan
- Neuroengineering Laboratory, Brain Mind Institute & Interfaculty Institute of Bioengineering, EPFL, Switzerland
- RIKEN CBS-KAO Collaboration Center, Japan
- Graduate School of Arts and Sciences, The University of Tokyo, Japan
Figures
Figure 1 with 4 supplements
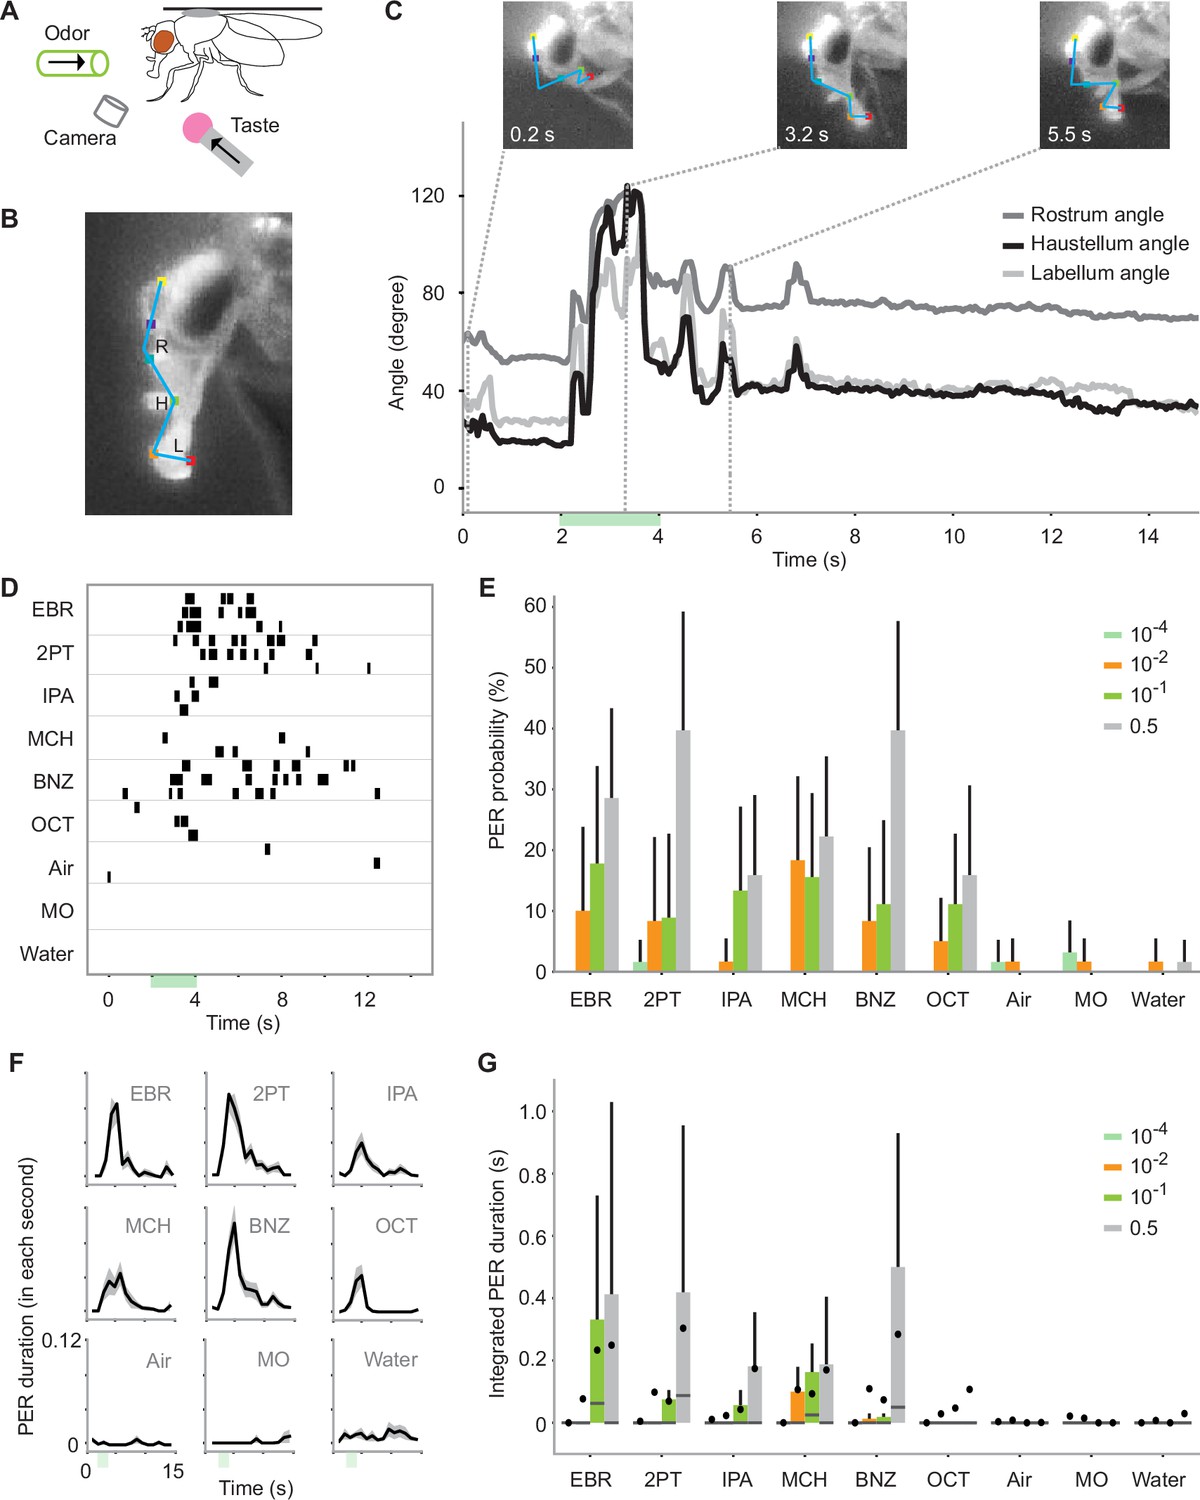
Odors alone evoke proboscis extension reflex (PER).
(A) Schematic for recording odor-evoked PER. (B) Six points on the head are tracked by DeepLabCut. The movement of the proboscis was characterized by the positions of three segments of the proboscis and the angles between the segments, namely the rostrum angle (R), haustellum angle (H), and labellum angle (L). (C) Example odor-evoked PER. Top, images of a proboscis in a retracted (0.2 s), fully extended (3.1 s), and partially extended (5.5 s) state. Bottom, the three angles over time. Green bar indicates an odor application period. Odor is ethyl butyrate. (D) PER to nine odors in an example fly. Each row corresponds to a trial and each tick mark indicates the timing of PER. The odors used are as follows: ethyl butyrate (EBR), 2-pentanone (2PT), isopentyl acetate (IPA), 4-methylcyclohexanol (MCH), benzaldehyde (BNZ), 3-octanol (OCT), and mineral oil (MO). (E) PER probability in wild-type flies in response to different concentrations of odors. The same stimulus was used for air, mineral oil, and water controls. n=21, 26, 27, and 28 flies for 10–4, 10–2, 10–1, and 0.5 concentration groups, respectively. Error bar, standard error of the mean. PER probability was different between odor concentrations and identities (p=3.0e-05 and 2.0e-7 for odor concentration and identity factors, Scheirer–Ray–Hare test). (F) PER duration in wild-type flies. The black lines indicate the mean and the shaded areas indicate the standard error of the mean. n=28 flies. (G) Integrated PER duration in wild-type flies in response to different concentrations of odors. The data is from the same flies as in E. Integrated PER duration was different between odor concentrations and identities (p=3.6e-13 and 3.5e-11 for odor concentration and odor identity factors, Scheirer–Ray–Hare test). Box plots indicate the median (gray line), mean (black dot), quartiles (box), and 5–95% range (bar).
Figure 1—figure supplement 1
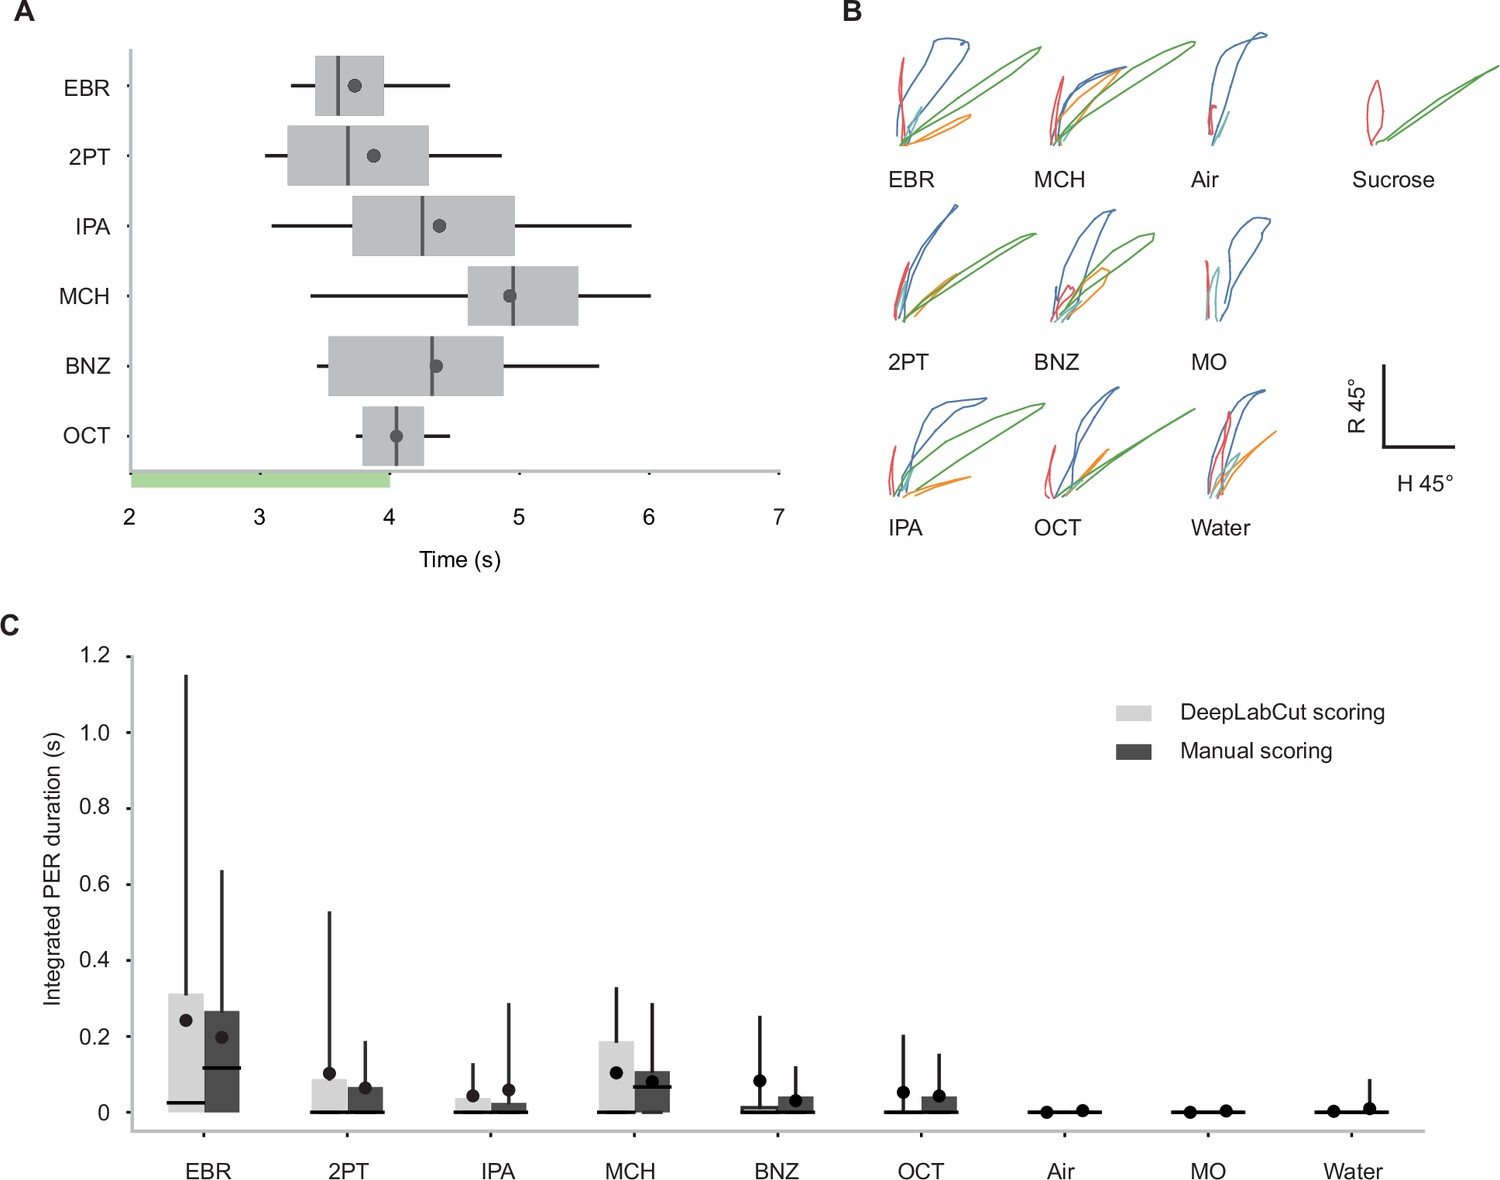
Characteristics of proboscis extension reflex (PER) in wild-type flies.
(A) Latency to the first odor-evoked PER in wild-type flies. Odor concentration was 0.5 (n=28 flies). Green bar indicates the odor application period. p=1.0e-4, one-way ANOVA. Box plots indicate the median (gray line), mean (black dot), quartiles (box), and 5–95% range (bar). (B) K-medoid clustering of odor- and sucrose-evoked proboscis extensions based on the rostrum and haustellum angles over time in wild-type flies. All the trajectories during PER and partial proboscis extensions were clustered into five clusters (color coded), and the representative trajectory closest to each cluster medoid was plotted for each stimulus. The green trajectories represent full extensions that qualify the definition of PER (see Methods). Note that these green trajectories are observed in response to sucrose and all the odors (except for the controls), suggesting that the movement of proboscis during odor-evoked PER is similar to that during sucrose-evoked PER. (C) Integrated PER duration in response to different odors in wild-type flies analyzed by DeepLabCut or manual scoring. The values measured by the two methods were similar (p=0.94 and 5.5e-3 for scoring method and odor identity factors, Scheirer-Ray-Hare test). Odor concentration is 0.1. Box plots indicate the median (gray line), mean (black dot), quartiles (box), and 5–95% range (bar).
Figure 1—figure supplement 2
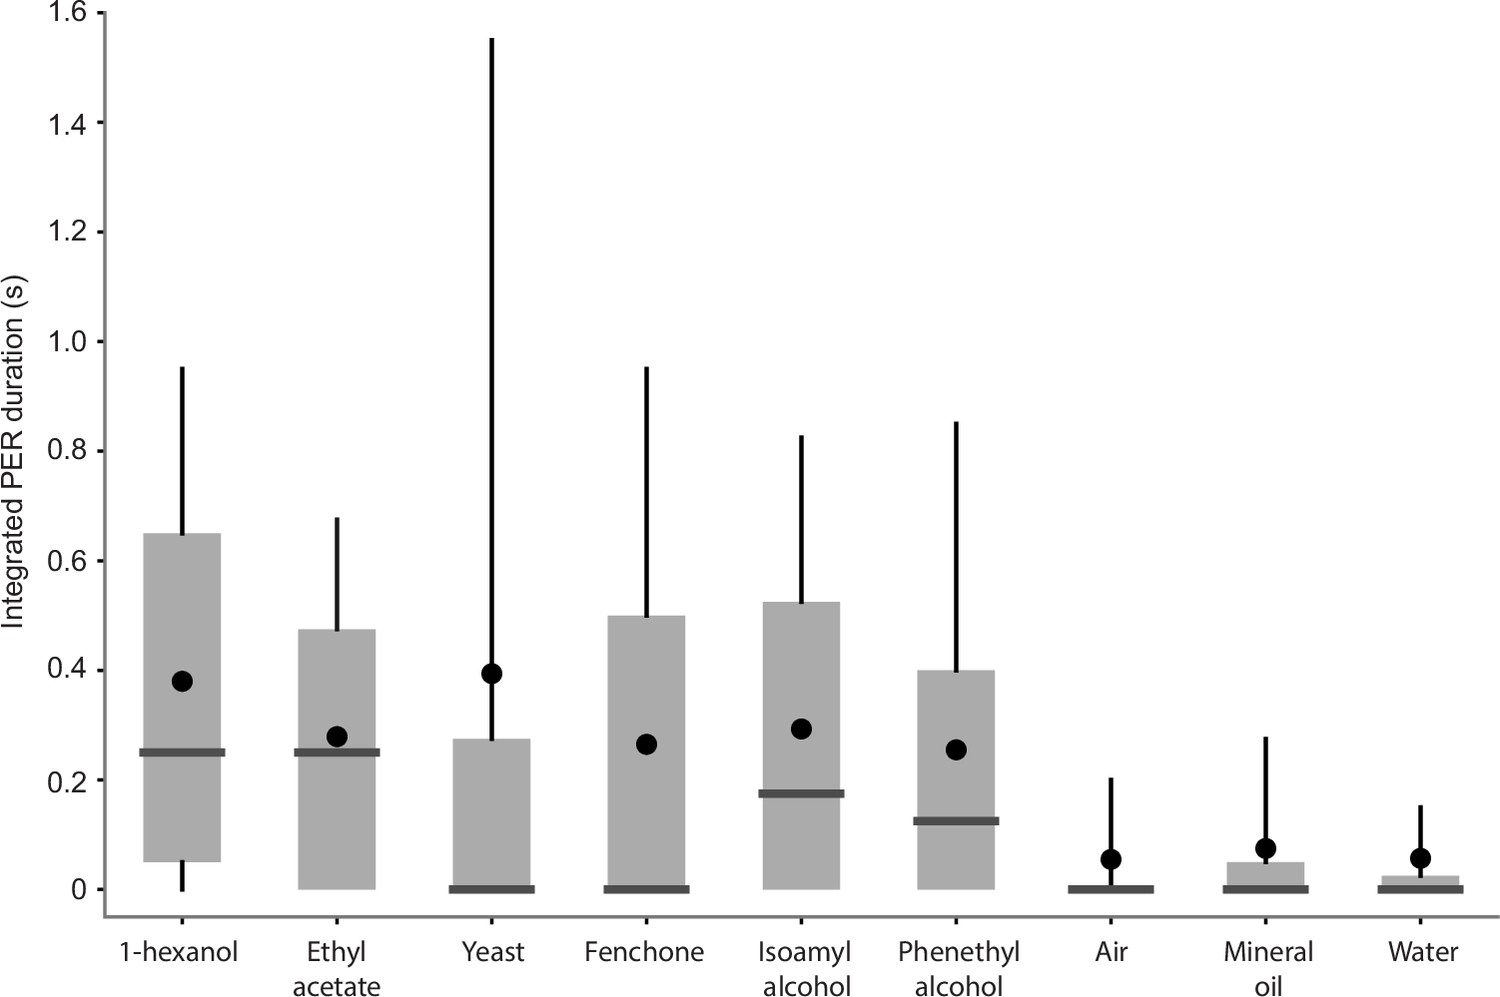
Proboscis extension reflex (PER) evoked by additional odors.
Integrated PER duration in wild-type flies in response to 1-hexanol, ethyl acetate, yeast odor, fenchone, isoamyl alcohol, phenethyl alcohol, air, mineral oil, and water. In this experiment, flies were fixed in a vertical position following a protocol in a previous study (Oh et al., 2021). Box plots indicate the median (gray line), mean (black dot), quartiles (box), and 5–95% range (bar).
Figure 1—figure supplement 3

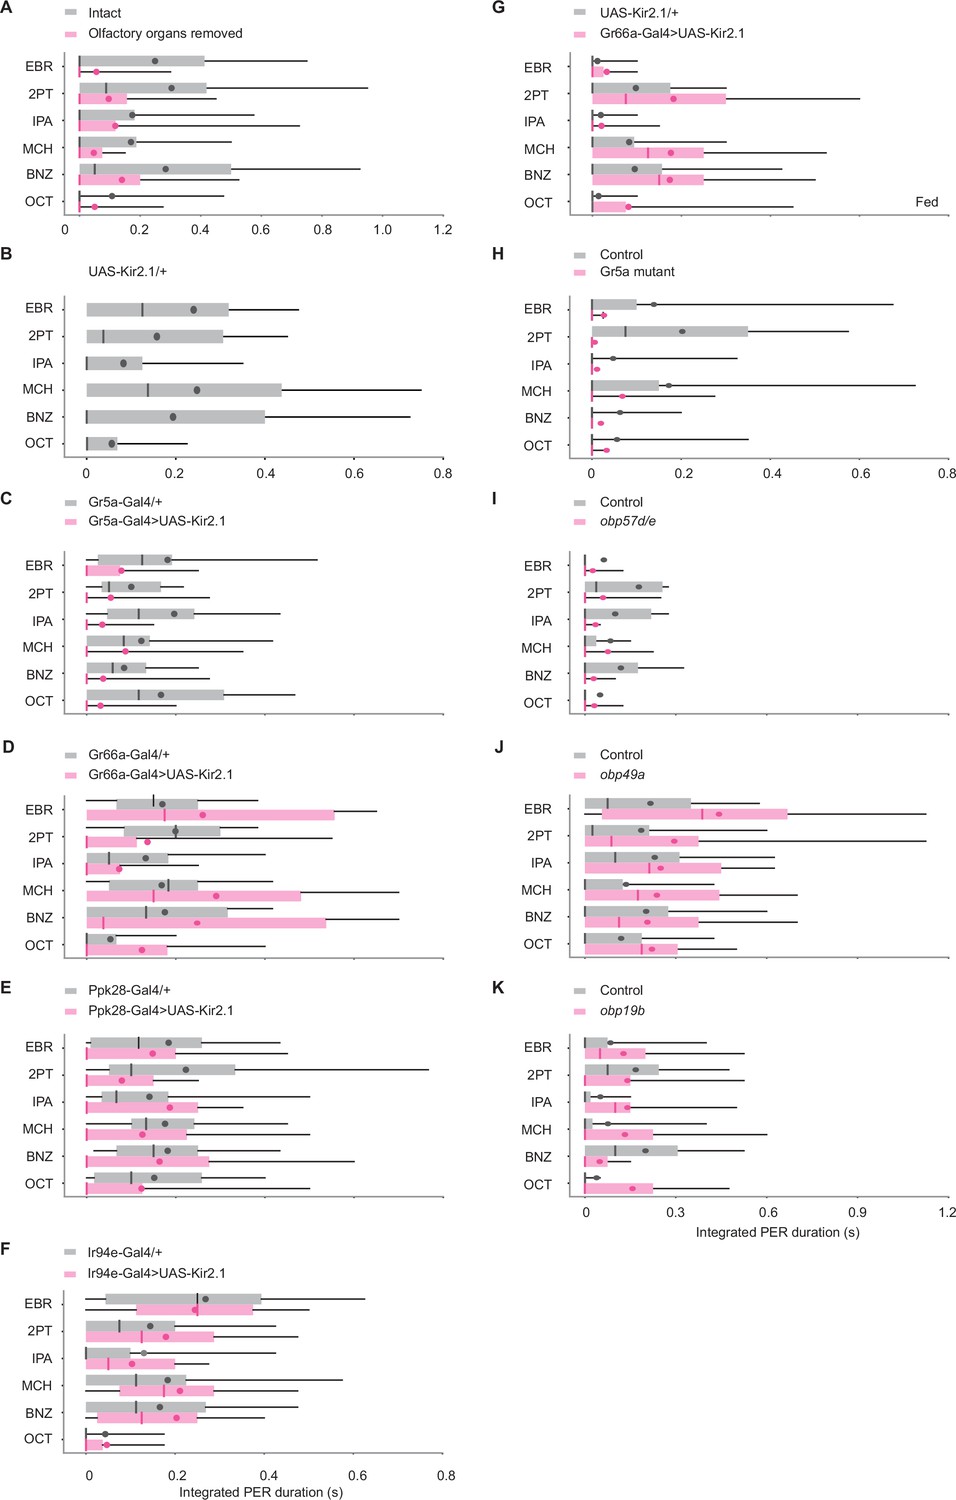
Odor-evoked proboscis extension reflex (PER) in flies with different genetic backgrounds and in another species.
Integrated PER duration in different flies n = 20, 28, and 25 in (A-C). Box plots indicate the median (gray and red lines), mean (black and red dots), quartiles (box), and 5-95% range (bar).
Figure 1—video 1
Odor-evoked proboscis extension reflex (PER).
A video capturing odor-evoked PER with the plot of the haustellum angle over time. Six points on the head were tracked by DeepLabCut.
Figure 2 with 3 supplements
Odors evoke proboscis extension reflex (PER) through gustatory receptor neurons (GRNs).
(A) Integrated PER duration in intact (n=28) and olfactory organs removed (n=32) wild-type flies. Flies with olfactory organs removed show less PER compared to control flies (p=0.0079 and 0.10 for group and odor factors, Scheirer–Ray–Hare test). (B–F) Integrated PER duration in UAS control UAS-Kir2.1/+, n=20, (B), GRN silenced (Gr5a-Gal4>UAS-Kir2.1, n=25 for C; Gr66a-Gal4>UAS-Kir2.1, n=24 for D; Ppk28-Gal4>UAS-Kir2.1, n=28 for E; Ir94e-Gal4>UAS-Kir2.1, n=23 for F) and Gal4 control flies (Gr5a-Gal4/+, n=31 for C; Gr66a-Gal4/+, n=21 for D; Ppk28-Gal4/+, n=28 for E; Ir94e-Gal4/+, n=30 for F). Each silenced line was compared to the UAS control in B (p=4.9e-5, 0.49, 0.17, 0.11, and 0.12, 0.0014, 0.55, 1.2e-5 for genotype and odor factors for C-F, Scheirer–Ray–Hare test). Data were also compared between each silenced line and its Gal4 control (p=1.0e-15, 0.28, 0.00062, 0.14, and 0.71, 0.0012, 0.56, 5.6e-9 for genotype and odor factors for C-F, Scheirer–Ray–Hare test). (G) Integrated PER duration in control (UAS-Kir2.1/+, n=21) and Gr66a GRN-silenced (Gr66a-Gal4>UAS-Kir2.1, n=21) flies in a fed state. Silencing of Gr66a GRNs enhances odor-evoked PER in a fed state (p=1.8e-4 and 0.041 for genotype and odor factors, Scheirer–Ray–Hare test). Odor concentration was 10–1. (H) Integrated PER duration in control (n=29) and Gr5a mutant (n=29) flies. PER is severely reduced in mutant flies (p=1.1e-4 and 0.32 for genotype and odor factors, Scheirer–Ray–Hare test). Control: EP(x)496 flies. Mutant: ΔEP(x)–5 flies. (I–K) Integrated PER duration in control and Obp RNAi flies. Obp57d/e RNAi flies show reduced (I, n=33 and 25 for control and RNAi, p=0.039 and 0.48 for genotype and odor factors, Scheirer–Ray–Hare test), Obp49a RNAi flies show enhanced (J, n=24 and 20 for control and RNAi, p=0.0066 and 0.16 for genotype and odor factors, Scheirer–Ray–Hare test), and Obp19b RNAi flies show similar levels of PER (K, n=24 and 21 for control and RNAi, p=0.24 and 0.26 for genotype and odor factors, Scheirer–Ray–Hare test) as compared to their respective controls, which are tubulin-Gal4/y,w1118;P{attP,y[+],w[3']} (for I), tubulin-Gal4/w1118;P{VDRCsh60200}attP40 (for J), and tubulin-Gal4/w1118 (for K). Box plots indicate the median (gray and red lines), mean (black and red dots), quartiles (box), and 5–95% range (bar).
Figure 2—figure supplement 1
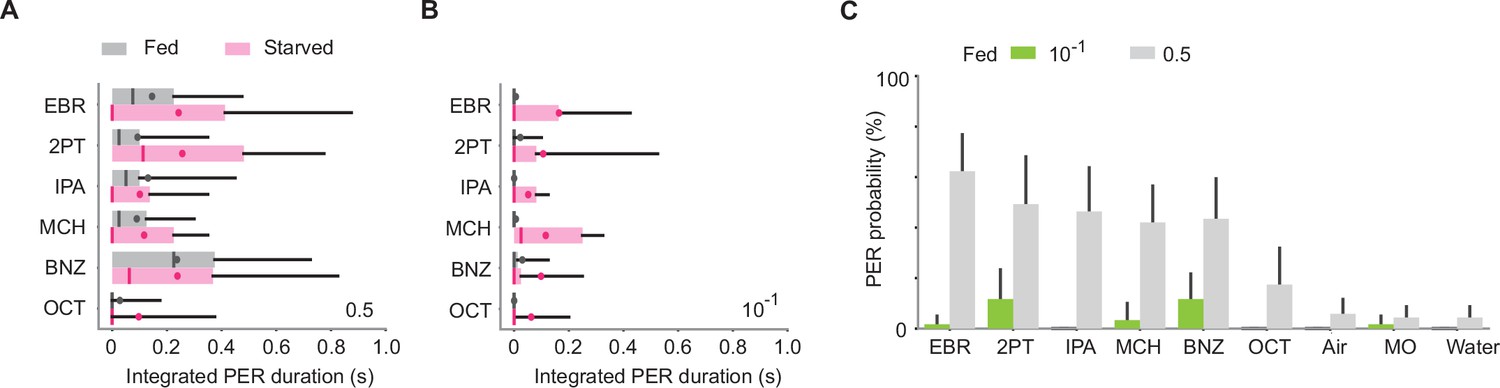
Dependence of odor-evoked proboscis extension reflex (PER) on a feeding state.
(A) Integrated PER duration in starved (n = 28) and fed (n = 19) wild-type flies (p = 0.88 and 5.6e-3 for state and odor factors, Scheirer–Ray–Hare test). Odor concentration is 0.5. (B) Same as in a but for odor concentration of 10-1. PER is enhanced in a starved state (p = 1e-6 and 0.74 for state and odor factors, Scheirer–Ray–Hare test). (C) PER probability in wild-type fed flies in response to different concentrations of odors. n = 19 and 28 for 10-1 and 0.5 concentration groups, respectively. Error bar, standard error of the mean. Box plots indicate the median (gray and red lines), mean (black and red dots), quartiles (box), and 5-95% range (bar).
Figure 2—figure supplement 2
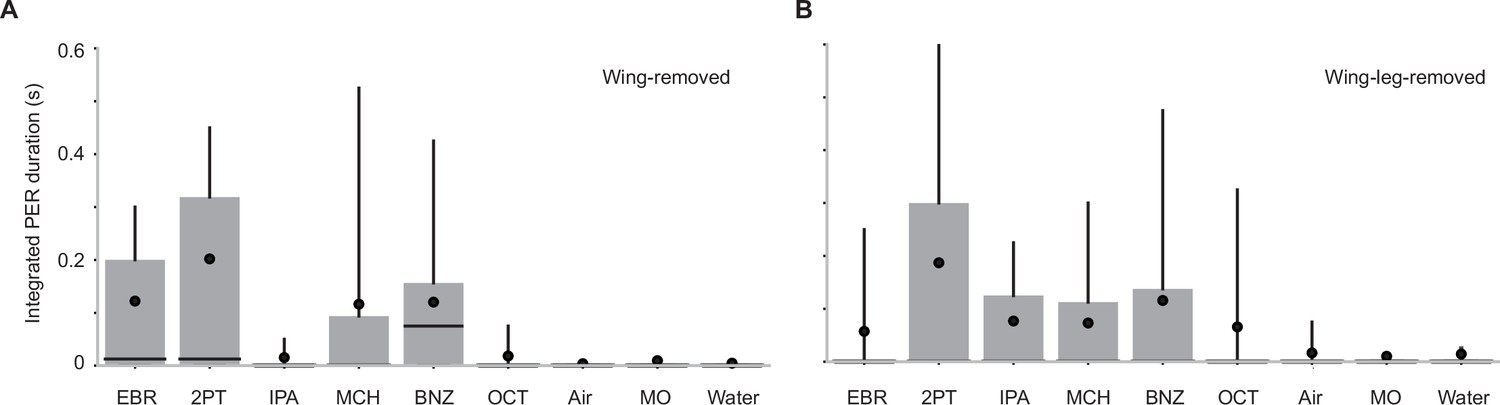
Wings and legs are not required for odor-evoked PER.
(A) Integrated PER duration in wing-removed Orco-Gal4>UAS-Kir2.1 flies (n = 26). GRNs in wings were dispensable for PER to certain odors (p = 6.0e-9, Kruskal-Wallis test, p = 0.0020, 0.0011, 0.75, 0.089, 0.00071, 0.58, 0.84, and 0.94 for comparison between mineral oil (MO) control vs EBR, 2PT, IPA, MCH, BNZ, OCT, Air, and Water, Dunn’s post-hoc tests with Benjamini–Hochberg false discovery rate correction). (B) Integrated PER duration in wing- and leg-removed, Orco-Gal4>UAS-Kir2.1 flies (n = 27). GRNs in wings were dispensable for PER to certain odors (p = 0.004, Kruskal-Wallis test, p = 0.39, 0.029, 0.18, 0.18, 0.029, 0.44, 0.88, and 0.71 for comparison between mineral oil (MO) control vs EBR, 2PT, IPA, MCH, BNZ, OCT, Air, and Water, Dunn’s post-hoc tests with Benjamini–Hochberg false discovery rate correction). Box plots indicate the median (gray line), mean (black dot), quartiles (box), and 5-95% range (bar).
Figure 2—figure supplement 3
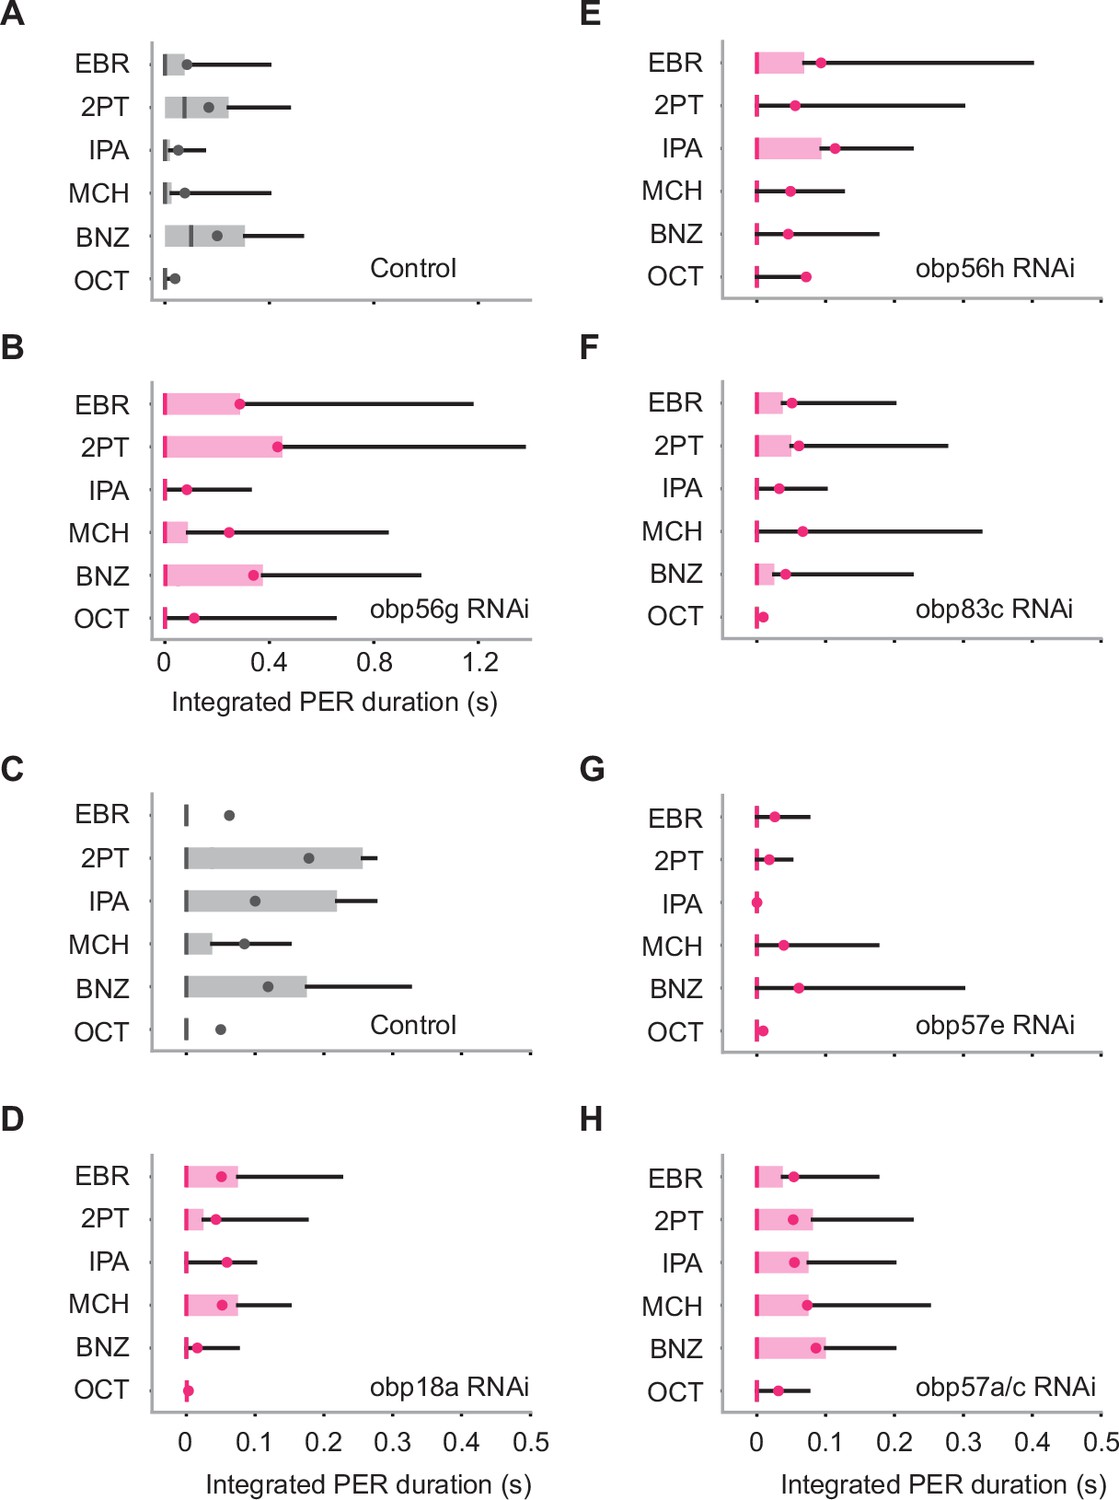
Contributions of odorant binding proteins (OBPs) to odor-evoked proboscis extension reflex (PER).
(A, B) Integrated PER duration in control (tubulin-Gal4/w1118) and Obp56g RNAi flies. These flies show similar levels of PER (n = 24 and 23 for control and RNAi, p = 0.58 and 0.0017 for group and odor factors, Scheirer–Ray–Hare test). (C-H) Integrated PER duration in control (tubulin-Gal4/y,w1118;P{attP,y[+],w[3']}) and OBP RNAi flies. Obp18a RNAi and Obp57e RNAi flies show reduced level of PER as compared to control (n = 33, 25, 22, 25, 27, and 28 flies for C-H, p = 0.050, 0.36, 0.18, 1.9e-4, 0.92 and 0.10, 0.48, 0.063, 0.045, 0.022 for group and odor factors for (D-H), Scheirer–Ray–Hare test). Box plots indicate the median (gray and red lines), mean (black and red dots), quartiles (box), and 5-95% range (bar).
Figure 3 with 3 supplements
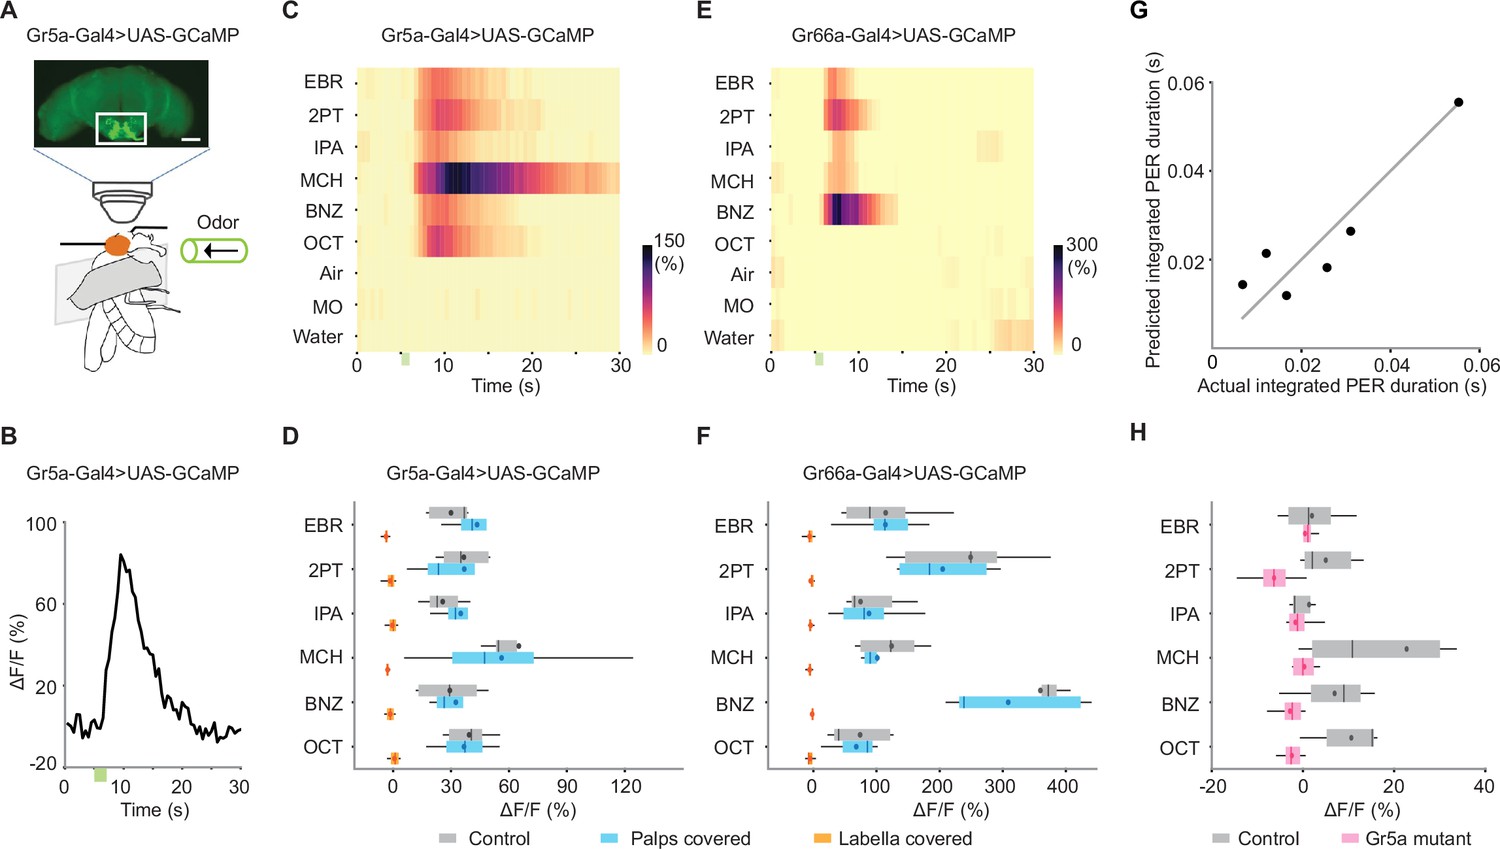
Sweet- and bitter-sensing gustatory receptor neurons (GRNs) directly respond to odors.
(A) Schematic for two-photon calcium imaging of GRN axon termini in the subesophageal zone. The top image shows an anterior view of a brain of Gr5a-Gal4>UAS-GCaMP6s fly. White rectangle indicates the target region of calcium imaging. Scale bar: 50 μm. (B) Example response (ΔF/F) to ethyl butyrate. Green bar indicates an odor application period. Odor concentration was 10–1 for all the odors in all the experiments described in this figure. (C) Summary responses of Gr5a GRNs to nine odors. Green bar indicates an odor application period. ΔF/F of GCaMP6s fluorescence is color coded according to the scale bar (n=5). (D) Trial-averaged peak responses of Gr5a GRNs to individual odors. Covering the labella with glue reduced odor responses as compared to control (n=5 and 4 for control and labella covered, p=2.6e-15 and 5.1e-3 for organ condition and odor factors, mixed two-way ANOVA) but covering the maxillary palps had no effects (n=5 and 4 for control and palps covered, p=0.69 and 0.055 for organ condition and odor factors, mixed two-way ANOVA). (E, F) Same as in C, D, but for Gr66a GRNs. As in Gr5a GRNs, covering the labella with glue reduced odor responses as compared to control (n=6 and 5 for control and labella covered, p=3.0e-16 and 1.1e-7 for organ condition and odor factors, mixed two-way ANOVA) but covering the maxillary palps had no effects (n=6 and 5 for control and palps covered, p=0.48 and 4.2e-11 for organ condition and odor factors, mixed two-way ANOVA). (G) A linear combination of Gr5a and Gr66a GRN responses well predicted the magnitude of odor-evoked PER. PER was measured in Gr5a-Gal4>UAS-GCaMP flies. Each dot represents an odor. Coefficient of determination = 0.81. Weights for Gr5a and Gr66a GRNs are 5.0e-4 and −2.3e-5, indicating that the former and the latter contributes to enhancement and suppression of PER, respectively. (H) Odor responses are severely reduced in Gr5a GRNs in a Gr5a receptor mutant background (n=5 and 8 for control and mutant, P=8.0e-06 and 0.037 for genotype and odor factors, mixed two-way ANOVA). Box plots indicate the median (gray and red lines), mean (black and red dots), quartiles (box), and 5–95% range (bar).
Figure 3—figure supplement 1
Responses of GRNs to odors and sucrose.
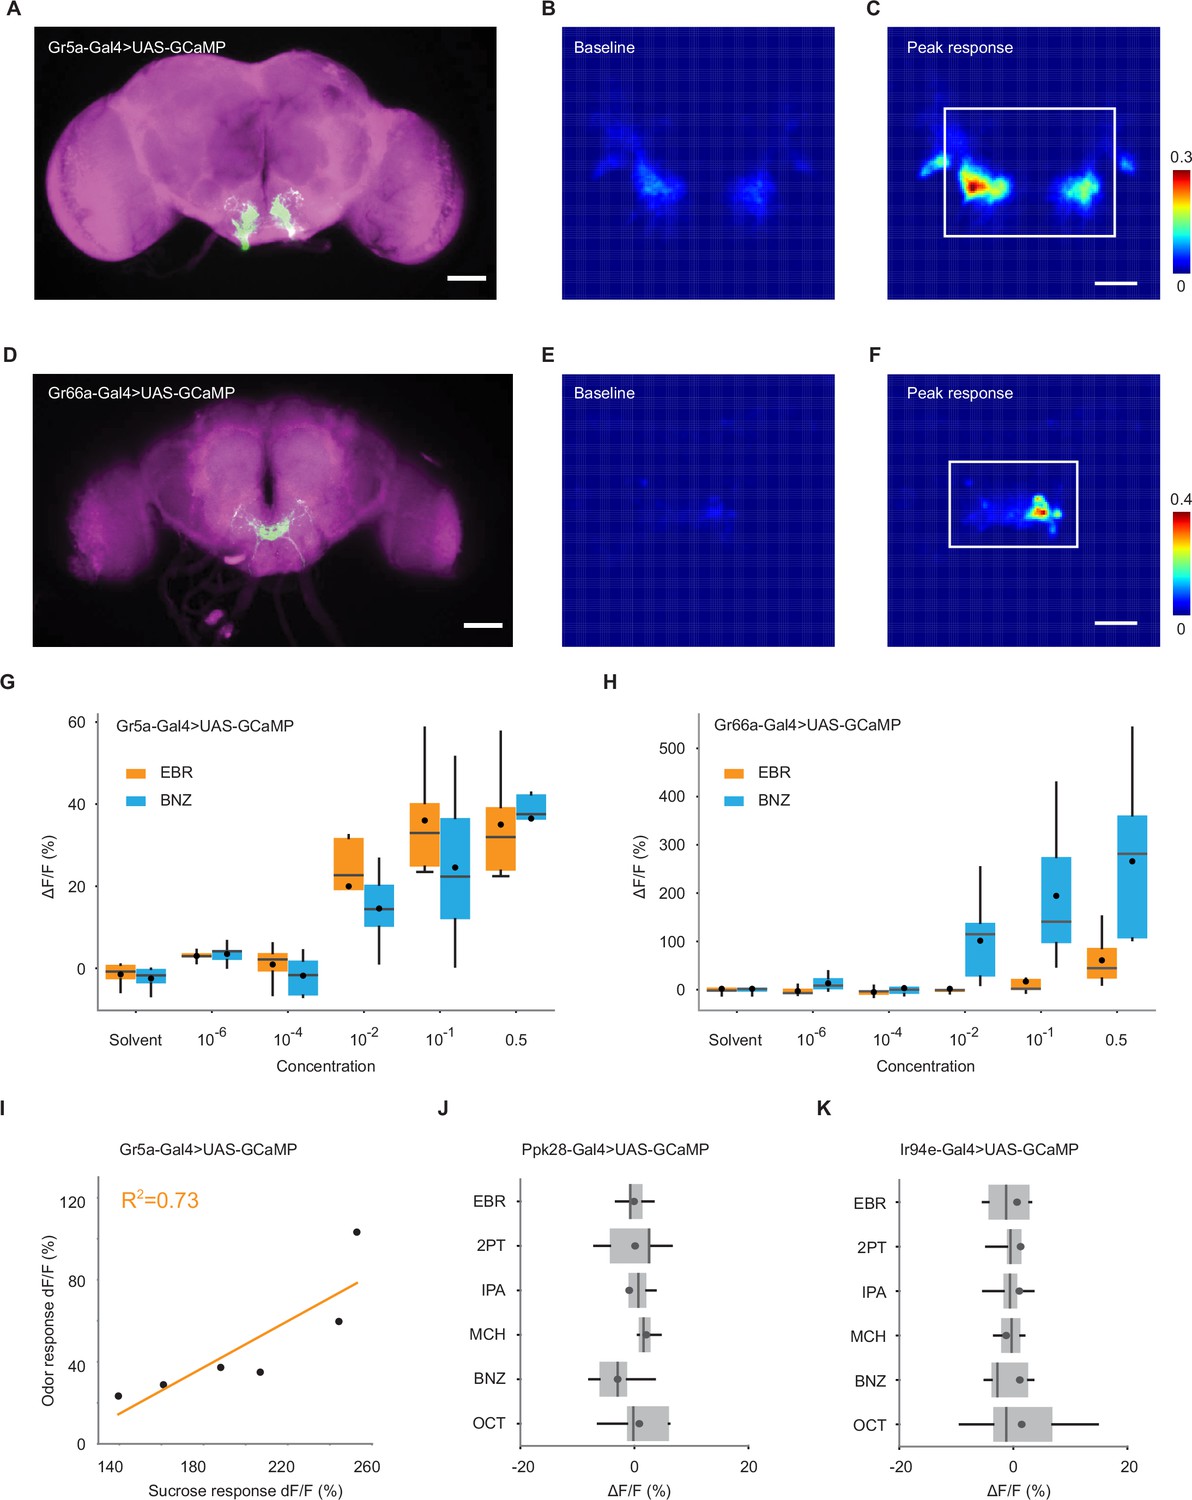
(A) Image of a brain of Gr5a-Gal4>UAS-GCaMP6s fly, stained with anti-GFP to reveal Gr5a neurons (green) and nc82 to reveal synapses (magenta). Scale bar, 50 μm. (B) Baseline fluorescence intensity of GCaMP6s in Gr5a GRNs. Fluorescence (arbitrary unit) is color-coded according to the scale bar. (C) Peak fluorescence intensity of GCaMP6s in the same fly as shown in B after stimulation with 4-methylcyclohexanol. Fluorescence is color-coded according to the scale bar. The ROI used for ΔF/F calculation is indicated by a white rectangle. Scale bar, 20 μm. (D–F) Same as in A-C, but for Gr66a-Gal4>UAS-GCaMP6s fly and benzaldehyde stimulation. (G) Trial-averaged peak responses of Gr5a GRNs to different concentrations of ethyl butyrate (EBR) and benzaldehyde (BNZ). n = 5 flies. (H) Same as in G, but for Gr66a GRNs. (I) Responses to 4-methylcyclohexanol are positively correlated with that to sucrose (0.25%) in Gr5a GRNs (R2 = 0.73, p = 0.031). Each dot corresponds to a fly. (J) Trial-averaged peak responses of Ppk28 GRNs to individual odors. These neurons do not respond to odors. n = 5 flies. (K) Same as in J, but for Ir94e GRNs. n = 9 flies. Box plots indicate the median (gray line), mean (black dot), quartiles (box), and 5-95% range (bar).
Figure 3—figure supplement 2
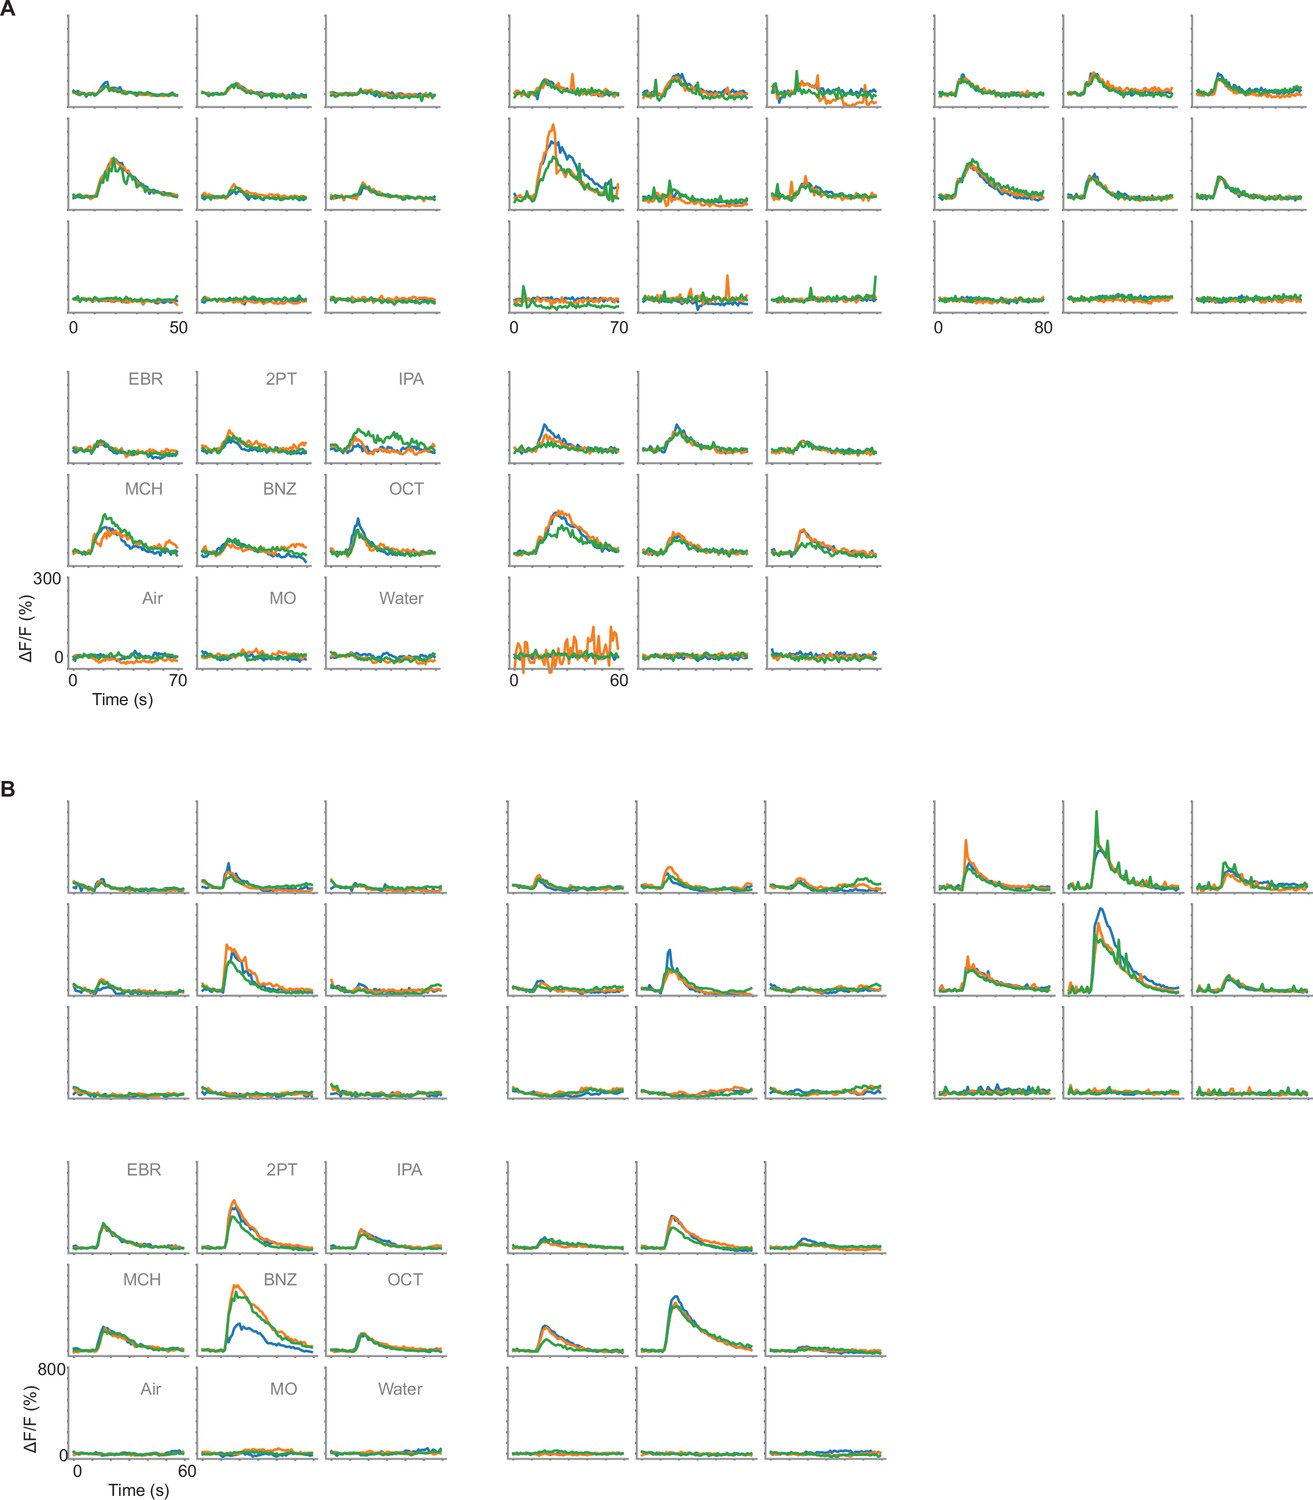
Individual responses of GRNs to odors.
(A) Time course of calcium responses (ΔF/F) to odors in Gr5a GRNs. Responses to nine odors in each fly are shown in one panel (n=5 flies). Odor application period is 5–7 s, and each odor was applied three times (different trials are shown in different colors). (B) Same as in A, but for Gr66a GRNs.
Figure 3—figure supplement 3
PER and GRN responses to various concentrations of banana odor.
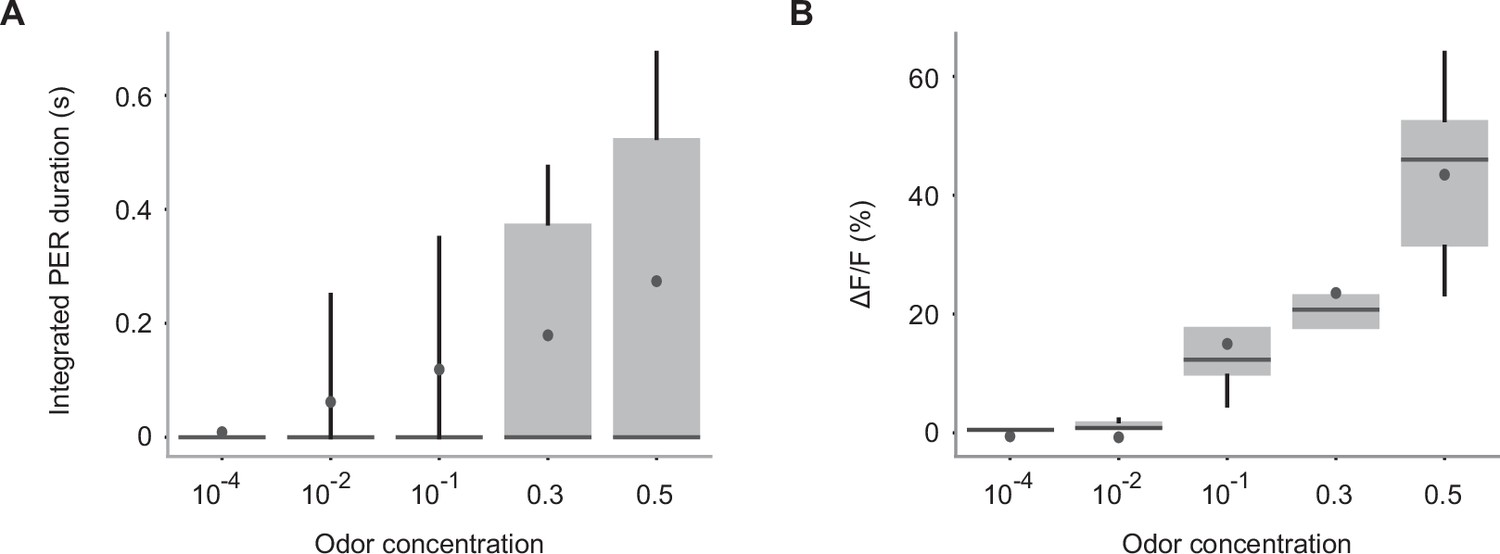
(A) Integrated PER duration in response to a banana odor presented at various concentrations in wild-type flies. n = 21 flies. Box plots indicate the median (gray line), mean (black dot), quartiles (box), and 5-95% range (bar). (B) Trial averaged peak responses of Gr5a GRNs in response to various concentrations of banana odor in Gr5a-Gal4>UAS-GCaMP6s flies. n = 5 flies. Error bar, standard error of the mean. Box plots indicate the median (gray line), mean (black dot), quartiles (box), and 5-95% range (bar).
Figure 4
Individual taste sensilla sense odors.
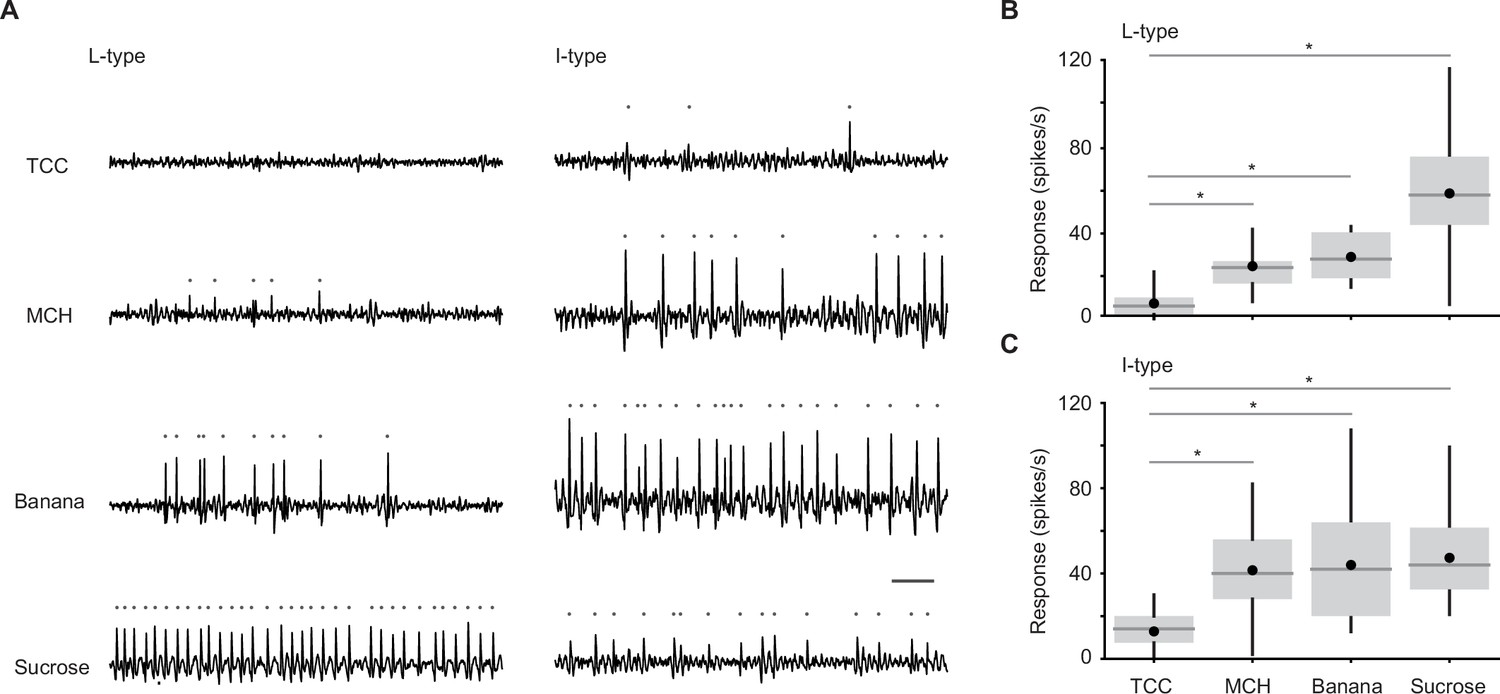
(A) Example responses of individual taste sensilla recorded using tip recording. Left, example responses to tricholine citrate (TCC) (30 mM), 4-methylcyclohexanol (MCH) (1%), banana odor (1%), and sucrose (100 mM) recorded in the same L-type sensillum; Right, example responses to the same set of stimuli in the same I-type sensillum. Traces show the activity between 200 and 700 ms after the stimulus onset. Each gray dot indicates a spike. Bar indicates 50 ms. (B) Average responses of L-type sensilla. (n=20, 6, 17, 20 flies for TCC, MCH, banana odor, and sucrose, respectively). Responses to stimuli are significantly larger than those to TCC (p=3.0e-18, one-way ANOVA followed by Tukey’s HSD, p=0.0051, 0.0021, and 2.7e-7 for MCH, banana, and sucrose compared to TCC). (C) Average responses of I-type sensilla. (n=30, 9, 22, 30 flies for TCC, MCH, banana odor, and sucrose, respectively). Responses to stimuli are significantly larger than those to TCC (p=1.4e-12, one-way ANOVA followed by Tukey’s HSD, p=3.9e-6, 2.0e-7, and 5.9e-12 for MCH, banana, and sucrose compared to TCC). Box plots indicate the median (gray line), mean (black dot), quartiles (box), and 5–95% range (bar). Asterisk indicates P<0.05.
Figure 5 with 1 supplement

Odor-taste integration in single taste sensillum.
(A) Example responses of an L-type taste sensillum to sucrose (0.25%, top), banana odor (0.1%, middle), and the mixture of the two (bottom). Traces show the activity between 200 and 700 ms after the stimulus onset. Each gray dot indicates a spike. Bar indicates 50 ms. (B) Average responses of L-type sensilla. Responses to the mixture are significantly larger than those to components (n=14 flies, p=0.001, repeated measures ANOVA followed by paired t-tests with Bonferroni correction, p=0.0030 and 0.0032 for sucrose and banana compared to mixture). Box plots indicate the median (gray line), mean (black dot), quartiles (box), and 5–95% range (bar). Asterisk indicates p<0.05.
Figure 5—figure supplement 1

Correlation between odor and taste responses in individual sensilla.
Spike responses to banana odor (0.01%) are positively correlated with those to sucrose (0.25%) in L-type sensilla. Each dot corresponds to a fly (R2 = 0.62, p = 0.00044).
Figure 6
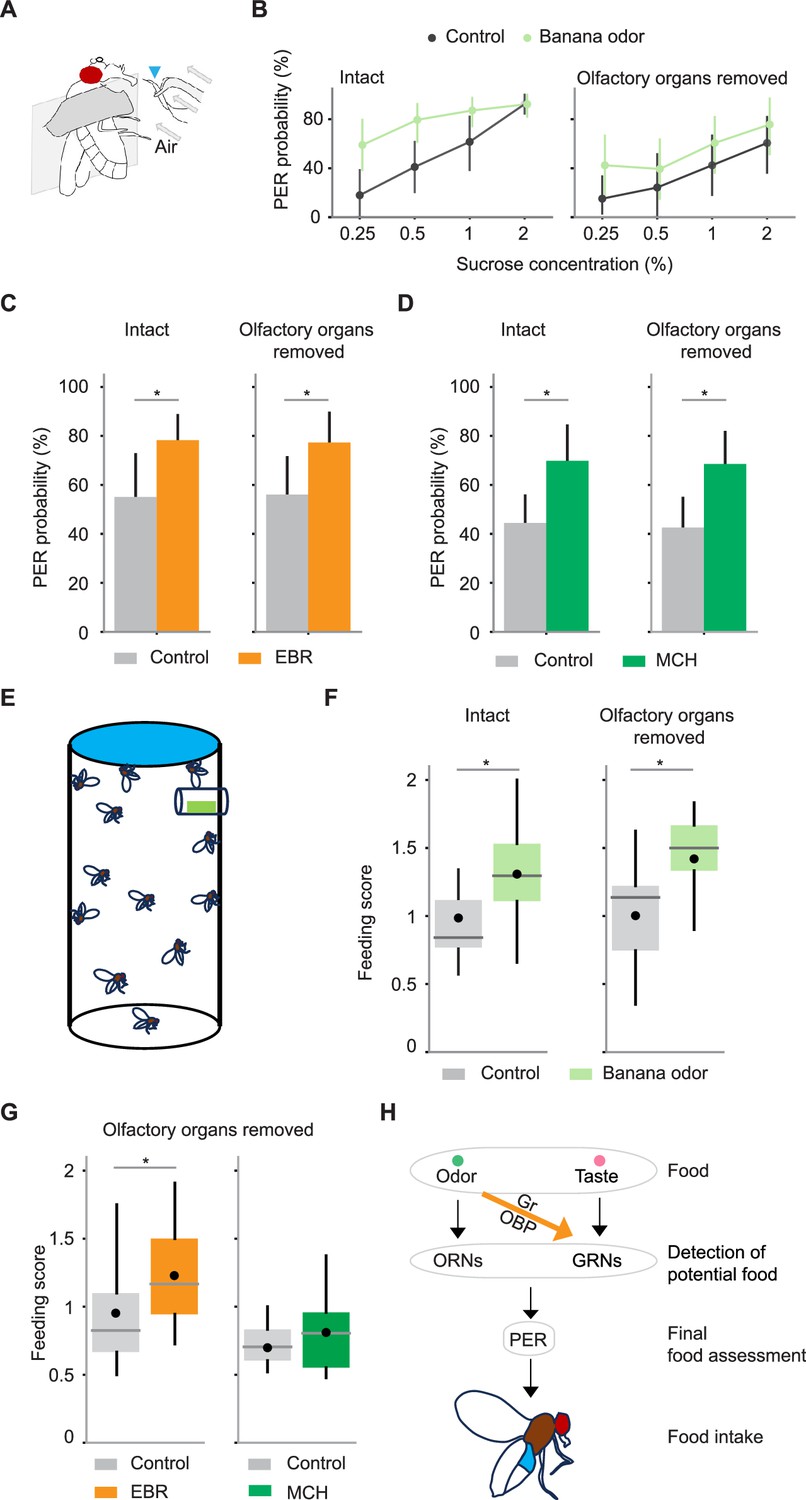
Gustatory receptor neurons (GRNs) integrate multisensory input to enhance proboscis extension reflex (PER) and food consumption.
(A) Schematic for examining PER in response to odor-taste multimodal stimuli. Stimuli are presented to the labellum with a wick (arrowhead) immersed in a sucrose solution with or without odors. A constant air stream was applied from behind the wick. (B) PER probability in response to sucrose at different concentrations with (green) or without (black) banana odor in wild-type flies. Odor concentration was 10–4. Banana odor enhances sucrose-evoked PER not only in intact flies (n=13 and 11 for control and banana odor, p=4.6e-4 and 2.1e-7 for odor identity and sucrose concentration factors, Scheirer–Ray–Hare test) but also in flies without olfactory organs (n=11 and 11 for control and banana odor, p=0.035 and 0.0070 for odor identity and sucrose concentration factors, Scheirer–Ray–Hare test). Error bar, standard error of the mean. (C) PER probability in response to sucrose is increased with ethyl butyrate (EBR) in both intact and olfactory organs-removed flies (n=25 and 25 for intact and olfactory organs-removed flies, p=0.0052 and 0.0068 for intact and olfactory organ-removed flies, Wilcoxon signed-rank test). (D) Same as in C, but for 4-methylcyclohexanol (MCH) (n=21 and 36, p=0.0072 and 0.00074 for intact and olfactory organs-removed flies, Wilcoxon signed-rank test). The concentration of odors and sucrose was 10–4 and 0.25% for C and D. Error bar, standard error of the mean. (E) Schematic for quantifying sucrose consumption in the presence or absence of odors. A filter paper on the top was impregnated with sucrose solution containing blue dye and a small piece of filter paper placed in the mesh tube near the top was impregnated with odor or control solution (see Methods). (F) The amount of sucrose consumed by flies with or without the presence of banana odor was quantified with a feeding score (see Methods). The amount of feeding was significantly larger in the presence of odor for both intact (n=20 and 22 for control and banana odors, p=0.005, Wilcoxon signed-rank test) and olfactory organs-removed flies (n=13 and 15 for control and banana odors, p=0.007, Wilcoxon signed-rank test). (G) The same as in F but with EBR and MCH odors and only for olfactory organs-removed flies (EBR experiment, n=16 and 17 for control and EBR, p=0.03, Wilcoxon signed-rank test; MCH experiment, n=11 and 14 for control and MCH, p=0.24, Wilcoxon signed-rank test). (H) Summary of mechanisms underlying PER and food intake in a multisensory environment. Error bars are the standard error of the mean in bar plots. Box plots indicate the median (gray line), mean (black dot), quartiles (box), and 5–95% range (bar). Asterisk indicates p<0.05.
Author response image 1

Example calcium responses to sucrose and odor (MCH) in the same fly (normalized by the respective peak responses to better illustrate the time course of responses).
Sucrose (blue) and odor (orange) concentrations are 100 mM, and 10-1respectively. Odor stimulation begins at 5 s and lasts for 2 s. Sucrose was also applied at the same timing for the same duration although there was a limitation in controlling the precise timing and duration of tastant application. Because of this limitation, we did not quantify the off time constant of two responses.
Author response image 2
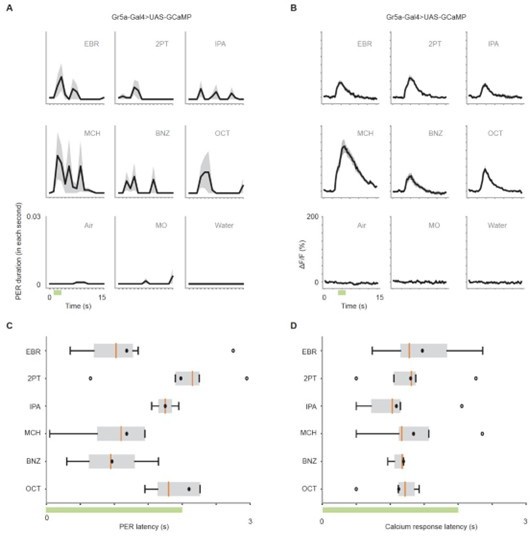
(A) PER duration in each second in Gr5a-Gal4>UAS-GCaMP6s flies. The black lines indicate the mean and the shaded areas indicate the standard error of the mean. n = 25 flies. (B) Time course of calcium responses (ΔF/F) to nine odors in Gr5a GRNs. n = 5 flies. (C) Latency to the first odor-evoked PER in Gr5a-Gal4>UAS-GCaMP6s flies. Green bar indicates the odor application period. p = 0.67, one-way ANOVA. Box plots indicate the median (orange line), mean (black dot), quartiles (box), and 5-95% range (bar). Dots are outliers. (D) Latency of calcium responses (10% of rise to peak time) in Gr5a GRNs. Green bar indicates the odor application period. p = 0.32, one-way ANOVA. Box plots indicate the median (orange line), mean (black dot), quartiles (box), and 5-95% range (bar). Dots are outliers.
Tables
Key resources table
| Reagent type (species) or resource | Designation | Source or reference | Identifiers | Additional information |
|---|---|---|---|---|
| Chemical compound, drug | 2-pentanone | Wako | Cat#: 133–03743; CAS: 107-87-9 | |
| Chemical compound, drug | Banana essence | Narizuka corporation | N/A | |
| Chemical compound, drug | Mineral oil | nacalai tesque | Cat#: 23334–85; CAS: 64741-97-5 | |
| Chemical compound, drug | Ethyl butyrate | Sigma-Aldrich | Cat#: E15701; CAS: 105-54-4 | |
| Chemical compound, drug | Isopentyl acetate | Sigma-Aldrich | Cat#: 016–03646; CAS: 123-92-2 | |
| Chemical compound, drug | 4-methylcyclohexanol | Sigma-Aldrich | Cat#: 153095; CAS: 589-91-3 | |
| Chemical compound, drug | 3-octanol | Tokyo Chemical Industry | Cat#: O0121; CAS: 589-98-0 | |
| Chemical compound, drug | Benzaldehyde | Sigma-Aldrich | Cat#: 418099; CAS: 100-52-7 | |
| Chemical compound, drug | 1-hexanol | Tokyo Chemical Industry | H0130 | |
| Chemical compound, drug | Ethyl acetate | Tokyo Chemical Industry | A0030 | |
| Chemical compound, drug | Yeast | nacalai tesque | M1E8921 | |
| Chemical compound, drug | Fenchone | Tokyo Chemical Industry | F0164 | |
| Chemical compound, drug | Isoamyl alcohol | Tokyo Chemical Industry | I0289 | |
| Chemical compound, drug | Phenethyl alcohol | Tokyo Chemical Industry | P0084 | |
| Chemical compound, drug | TCC | Sigma-Aldrich | C0330 | |
| Antibody | Anti-GFP | Nacalai Tesque | 00404–84 | |
| Antibody | Anti-rat CF488A | Biotium | 20023 | |
| Antibody | Anti-mouse CF633 | Biotium | 20120 | |
| Chemical compound, drug | phosphate-buffered saline | Nacalai Tsque | 2757531 | |
| Chemical compound, drug | 4% paraformaldehyde in PBS | Nacalai Tesque | 915414 | |
| Chemical compound, drug | Goat serum | Invitrogen | 50197Z | |
| Chemical compound, drug | Triton X-100 | nacalai tesque | 3550102 | |
| Chemical compound, drug | Vectashield | Vector laboratories | H-1000 | |
| Strain, strain background (D. melanogaster) | Dickinson wild-type | Gift from Michael Dickinson | ||
| Strain, strain background (D. simulans) | D. simulans | Kyoto Drosophila Stock Center | DGGR #900001 | |
| Strain, strain background (D. melanogaster) | Tubulin-GAL4 | Bloomington | BDSC #5138 | |
| Strain, strain background (D. melanogaster) | Orco-GAL4 | Bloomington | BDSC #26818 | |
| Strain, strain background (D. melanogaster) | Gr66a-GAL4 | Bloomington | BDSC #57670 | |
| Strain, strain background (D. melanogaster) | Ir94e-GAL4 | Bloomington | BDSC #60725 | |
| Strain, strain background (D. melanogaster) | Ppk28-GAL4 | Bloomington | BDSC #60725 | |
| Strain, strain background (D. melanogaster) | UAS-GCaMP6s | Bloomington | BDSC #42746 | |
| Strain, strain background (D. melanogaster) | UAS-GCaMP6s | Bloomington | BDSC #42749 | |
| Strain, strain background (D. melanogaster) | UAS-Obp49a RNAi | Vienna Drosophila Resource Center | VDRC #330599 | |
| Strain, strain background (D. melanogaster) | UAS-Obp19b RNAi | Vienna Drosophila Resource Center | VDRC #1823 | |
| Strain, strain background (D. melanogaster) | UAS-Obp56g RNAi | Vienna Drosophila Resource Center | VDRC #23206 | |
| Strain, strain background (D. melanogaster) | UAS-Obp56h RNAi | Vienna Drosophila Resource Center | VDRC #102562 | |
| Strain, strain background (D. melanogaster) | UAS-Obp18a RNAi | Vienna Drosophila Resource Center | VDRC #101628 | |
| Strain, strain background (D. melanogaster) | UAS-Obp83c RNAi | Vienna Drosophila Resource Center | VDRC #106866 | |
| Strain, strain background (D. melanogaster) | UAS-Obp57d/e RNAi | Vienna Drosophila Resource Center | VDRC #101783 | |
| Strain, strain background (D. melanogaster) | UAS-Obp57e RNAi | Vienna Drosophila Resource Center | VDRC #105001 | |
| Strain, strain background (D. melanogaster) | UAS-Obp57a/c RNAi | Vienna Drosophila Resource Center | VDRC #107489 | |
| Strain, strain background (D. melanogaster) | w1118 | Vienna Drosophila Resource Center | VDRC #60000 | |
| Strain, strain background (D. melanogaster) | w1118;P{VDRCsh60200attP40 | Vienna Drosophila Resource Center | VDRC #60200 | |
| Strain, strain background (D. melanogaster) | y,w1118;P{attP,y[+],w[3']} | Vienna Drosophila Resource Center | VDRC #60100 | |
| Strain, strain background (D. melanogaster) | Gr5a-GAL4 | Gift from Kristin Scott | N/A | |
| Strain, strain background (D. melanogaster) | ΔEP(x)–5 | Gift from Anupama Dahanukar | N/A | |
| Strain, strain background (D. melanogaster) | EP(x)496 | Gift from Anupama Dahanukar | N/A | |
| Strain, strain background (D. melanogaster) | UAS-Kir2.1AAE-GFP | Gift from Graeme Davis | N/A | |
| Software, algorithm | Fiji | https://fiji.sc/ | RRID:SCR_002285 | |
| Software, algorithm | MATLAB | MathWorks | RRID:SCR_001622 | |
| Software, algorithm | R | R Project for Statistical Computing | RRID:SCR_001905 | |
| Software, algorithm | Python | Python Software | RRID:SCR_008394 | |
| Software, algorithm | ZEISS ZEN Imaging Software | Carl Zeiss, Oberkochen, Germany | RRID:SCR_013672 | |
| Software, algorithm | DeepLabCut v2.0 | Mathis et al., 2018; Mathis, 2021; https://github.com/DeepLabCut/Docker4DeepLabCut2.0 |
Table 1
Genotypes used to generate data presented in each figure.
| Figure | Genotype |
|---|---|
| Figures 1B–G–2A, 4—6, Figure 1—figure supplement 1, Figure 1—figure supplement 2, Figure 2—figure supplement 1, Figure 3—figure supplement 3A | Dickinson Wild-type |
| Figure 1—figure supplement 3A | w1118; P{y[+t7.7] w[+mC]=GAL4.1Uw}attP2 |
| Figure 1—figure supplement 3B | w1118; P{y[+t7.7] w[+mC]=p65.AD.Uw}attP40; P{y[+t7.7] w[+mC]=GAL4.DBD.Uw}attP2 |
| Figure 1—figure supplement 3C | D. simulans |
| Figure 2B | UAS-Kir2.1/+ |
| Figure 2C | Gr5a-Gal4/UAS-Kir2.1 Gr5a-Gal4/+ |
| Figure 2D | Gr66a-Gal4/UAS-Kir2.1 Gr66a-Gal4/+ |
| Figure 2E | Ppk28-Gal4/UAS-Kir2.1 Ppk28-Gal4/+ |
| Figure 2F | Ir94e-Gal4/UAS-Kir2.1 Ir94e-Gal4/+ |
| Figure 2G | Gr66a-Gal4/UAS-Kir2.1 UAS-Kir2.1/+ |
| Figure 2—figure supplement 2 | Orco-Gal4 >UAS-Kir2.1 |
| Figure 2H | ΔEP(x)–5 EP(x)496 |
| Figure 2I | tubulin-Gal4/y,w1118;P{attP,y[+],w[3']} tubulin-Gal4/UAS-Obp57d/e RNAi |
| Figure 2—figure supplement 3 | tubulin-Gal4/y,w1118;P{attP,y[+],w[3']} |
| Figure 2J | tubulin-Gal4/w1118;P{VDRCsh60200}attP40 tubulin-Gal4/UAS-Obp49a RNAi |
| Figure 2K | tubulin-Gal4/w1118 tubulin-Gal4/UAS-Obp19b RNAi |
| Figure 2—figure supplement 3 | tubulin-Gal4/w1118 |
| Figure 2—figure supplement 3 | tubulin-Gal4/UAS-Obp56g RNAi |
| Figure 2—figure supplement 3 | tubulin-Gal4/UAS-Obp18a RNAi |
| Figure 2—figure supplement 3 | tubulin-Gal4/UAS-Obp56h RNAi |
| Figure 2—figure supplement 3 | tubulin-Gal4/UAS-Obp83c RNAi |
| Figure 2—figure supplement 3 | tubulin-Gal4/UAS-Obp57e RNAi |
| Figure 2—figure supplement 3 | tubulin-Gal4/UAS-Obp57a/c RNAi |
| Figure 3—figure supplement 1J | UAS-GCaMP6s;Ppk28-Gal4 |
| Figure 3—figure supplement 1K | UAS-GCaMP6s;Ir94e-Gal4 |
| Figure 3A-D, G, Figure 3—figure supplement 1A-C, G, I, Figure 3—figure supplement 2A, Figure 3—figure supplement 3B | Gr5a-Gal4;UAS-GCaMP6s |
| Figure 3E, F, Figure 3—figure supplement 1D-F, Figure 3—figure supplement 2B | UAS-GCaMP6s;Gr66a-Gal4 |
| Figure 3H | ΔEP(x)–5;Gr5a-Gal4;UAS-GCaMP6s EP(x)496;Gr5a-Gal4;UAS-GCaMP6s |
Table 2
Summary of statistical tests.
| Results of multi-factorial statistical tests | P-values for individual factors and their interaction | |||
|---|---|---|---|---|
| Figure | Statistical test | Concentration | Identity | Interaction |
| Figure 1E | Scheirer–Ray–Hare | 3.0E-05 | 2.0E-07 | 2.0E-10 |
| Figure 1G | Scheirer–Ray–Hare | 3.6E-13 | 3.5E-11 | 2.8E-21 |
| Method | Odor | Interaction | ||
| Figure 1—figure supplement 1C | Scheirer–Ray–Hare | 0.94 | 5.5E-03 | 2.8E-03 |
| State | Odor | Interaction | ||
| Figure 2—figure supplement 1A | Scheirer–Ray–Hare | 0.88 | 5.6E-03 | 1.8E-03 |
| Figure 2—figure supplement 1B | Scheirer–Ray–Hare | 1.0E-06 | 0.74 | 2.7E-03 |
| Genotype | Odor | Interaction | ||
| Figure 2A | Scheirer–Ray–Hare | 0.0079 | 0.10 | 0.0020 |
| Figure 2B and C (comparison to UAS control) | Scheirer–Ray–Hare | 4.9E-05 | 0.12 | 3.5E-05 |
| Figure 2B and D (comparison to UAS control) | Scheirer–Ray–Hare | 0.49 | 0.0014 | 6.6E-04 |
| Figure 2B and E (comparison to UAS control) | Scheirer–Ray–Hare | 0.17 | 0.55 | 0.027 |
| Figure 2B and F (comparison to UAS control) | Scheirer–Ray–Hare | 0.11 | 1.2E-05 | 2.0E-07 |
| Figure 2C | Scheirer–Ray–Hare | 1.0E-15 | 0.71 | 1.0E-16 |
| Figure 2D | Scheirer–Ray–Hare | 0.28 | 0.0012 | 3.0E-05 |
| Figure 2E | Scheirer–Ray–Hare | 6.2E-04 | 0.56 | 0.0036 |
| Figure 2F | Scheirer–Ray–Hare | 0.14 | 5.6E-09 | 1.7E-08 |
| Figure 2G | Scheirer–Ray–Hare | 1.8E-04 | 0.041 | 2.6E-05 |
| Figure 2H | Scheirer–Ray–Hare | 1.1E-04 | 0.32 | 0.00015 |
| Figure 2I | Scheirer–Ray–Hare | 0.039 | 0.48 | 0.0083 |
| Figure 2J | Scheirer–Ray–Hare | 0.0066 | 0.16 | 0.0051 |
| Figure 2K | Scheirer–Ray–Hare | 0.24 | 0.26 | 0.0032 |
| Figure 2—figure supplement 3A and B | Scheirer–Ray–Hare | 0.58 | 0.0017 | 0.0011 |
| Figure 2—figure supplement 3C and D | Scheirer–Ray–Hare | 0.050 | 0.10 | 0.0060 |
| Figure 2—figure supplement 3C and E | Scheirer–Ray–Hare | 0.36 | 0.48 | 0.041 |
| Figure 2—figure supplement 3C and F | Scheirer–Ray–Hare | 0.18 | 0.063 | 0.011 |
| Figure 2—figure supplement 3C and G | Scheirer–Ray–Hare | 1.9E-04 | 0.045 | 8.0E-06 |
| Figure 2—figure supplement 3C and H | Scheirer–Ray–Hare | 0.92 | 0.022 | 0.0072 |
| Organ condition | Odor | Interaction | ||
| Figure 3D (control vs labella covered) | Mixed two-way ANOVA | 2.6E-15 | 5.1E-03 | 9.8E-03 |
| Figure 3D (control vs palps covered) | Mixed two-way ANOVA | 0.69 | 0.055 | 0.91 |
| Figure 3F (control vs labella covered) | Mixed two-way ANOVA | 3.0E-16 | 1.1E-07 | 1.9E-07 |
| Figure 3F (control vs palps covered) | Mixed two-way ANOVA | 0.48 | 4.2E-11 | 0.90 |
| Figure 3H | Mixed two-way ANOVA | 8.0E-06 | 0.037 | 0.070 |
| Odor identity | Sucrose concentration | Interaction | ||
| Figure 6B (intact) | Scheirer–Ray–Hare | 4.6E-04 | 2.1E-07 | 0.057 |
| Figure 6B (olfactory organs removed) | Scheirer–Ray–Hare | 0.035 | 0.0070 | 0.93 |
Additional files
Download links
A two-part list of links to download the article, or parts of the article, in various formats.
Downloads (link to download the article as PDF)
Open citations (links to open the citations from this article in various online reference manager services)
Cite this article (links to download the citations from this article in formats compatible with various reference manager tools)
Odors drive feeding through gustatory receptor neurons in Drosophila
eLife 13:RP101440.
https://doi.org/10.7554/eLife.101440.3


