Non-feature-specific elevated responses and feature-specific backward replay in human brain induced by visual sequence exposure
- Center for the Cognitive Science of Language, Beijing Language and Culture University, China
- Key Laboratory of Language Cognitive Science (Ministry of Education), Beijing Language and Culture University, China
- School of Psychological and Cognitive Sciences and Beijing Key Laboratory of Behavior and Mental Health, Peking University, China
- IDG/McGovern Institute for Brain Research, Peking University, China
- Chinese Institute for Brain Research, China
- Peking-Tsinghua Center for Life Sciences, Peking University, China
- Key Laboratory of Machine Perception (Ministry of Education), Peking University, China
Figures
Figure 1
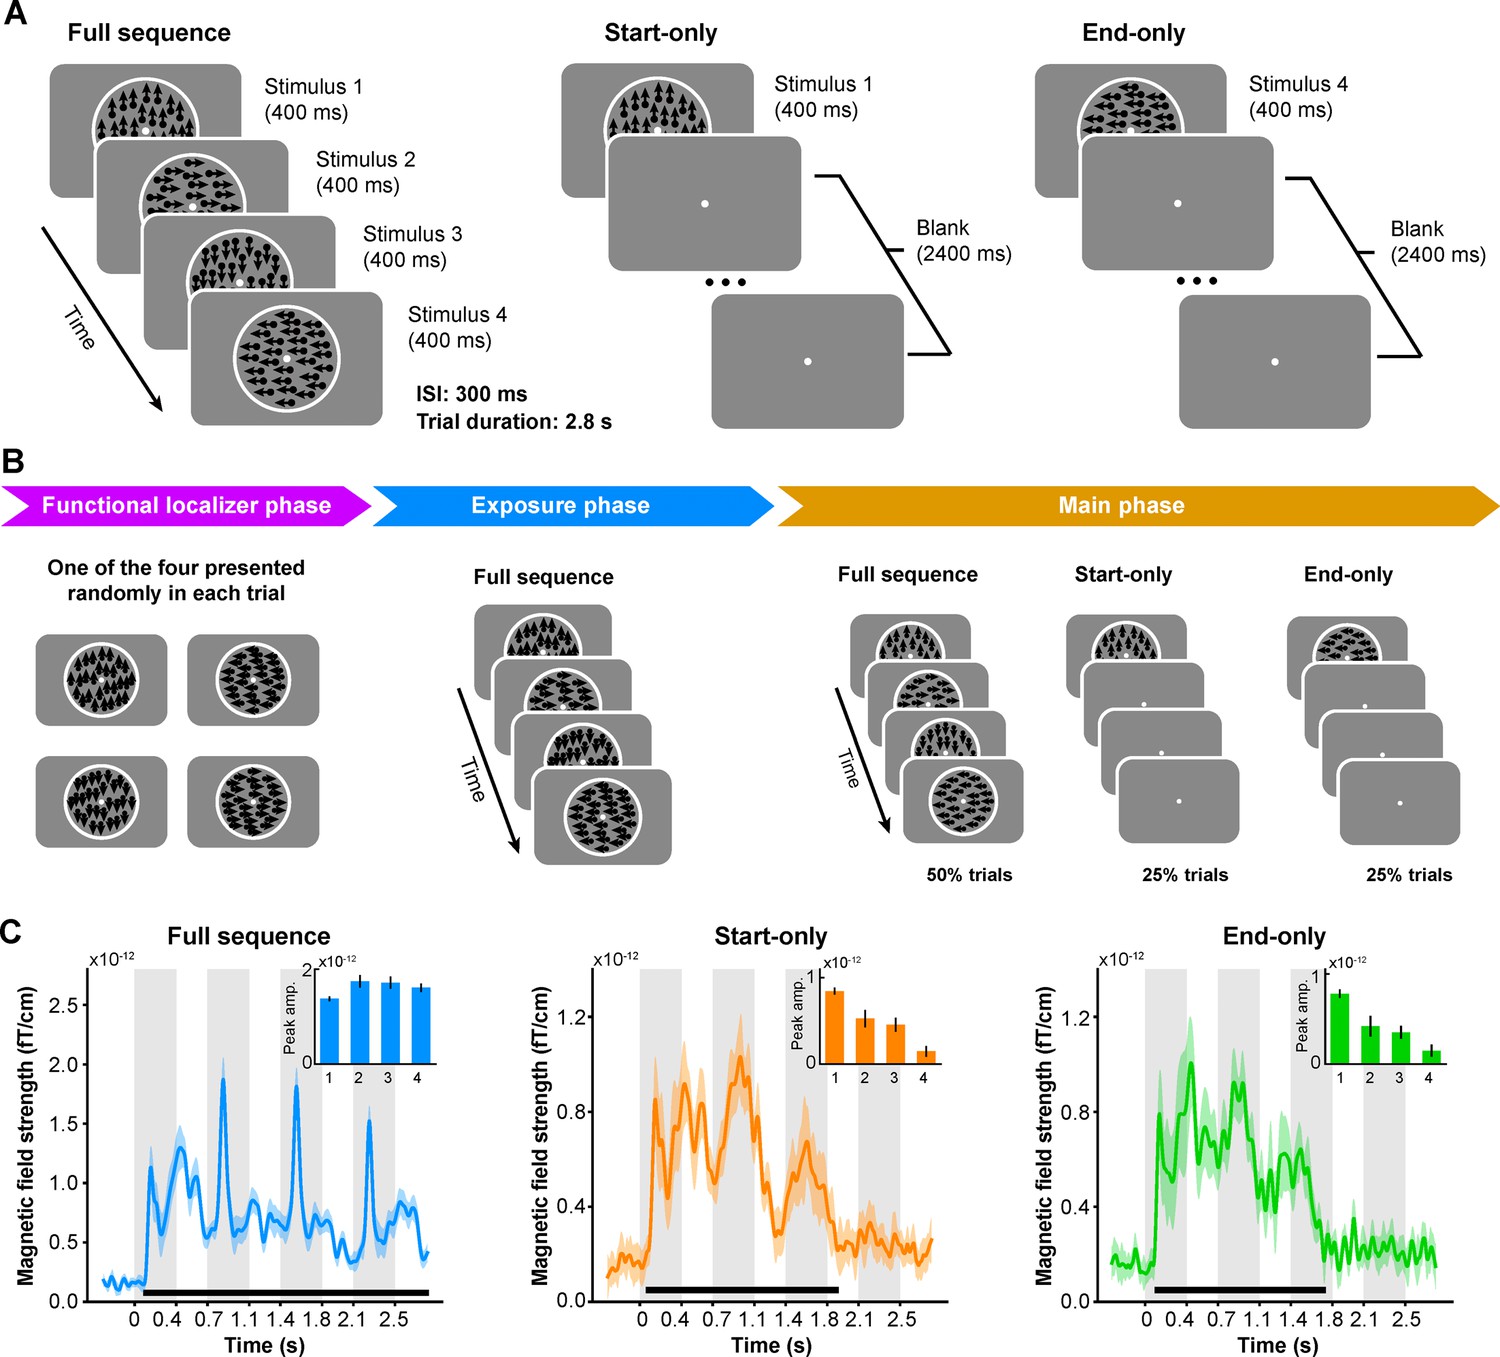
Stimuli, experimental procedure, and evoked responses in Experiment 1.
(A) Participants were presented with random-dot kinematograms (RDKs) in three conditions. In the full sequence trial condition, four successive RDKs were presented. In the start- or end-only condition, only the first or last RDK in the sequence was presented at the beginning of the trial. (B) During magnetoencephalography (MEG) scanning, the participants were presented with two functional localizer runs (i.e. functional localizer phase) before providing any sequence information. Next, they were exposed to four full sequence runs (i.e. exposure phase). Finally, in the main phase, full sequence, start- and end-only trials were presented in a pseudorandomized order. (C) Evoked neural responses as a function of time relative to trial onset (n = 18) in the full sequence, start- and end-only trial conditions, respectively. Bold black lines at the bottom indicate temporal clusters in which they reached significance when compared to the pre-stimulus baseline. Inset figures at the top-right corner show the peak amplitudes during the four corresponding RDK intervals after baseline correction.
Figure 2

Time-resolved decoding probability for each motion direction.
(A) Visualization of the time-resolved decoding probability in the three trial conditions. Each row shows the decoding probabilities for the four motion directions at that time point, and each column indicates one of the four motion directions. (B) The line plots of the time-resolved decoding probability for the three trial conditions. Each colored line shows the time course of the decoding probability for each motion direction. For the start- and end-only conditions, we calculated the permutation threshold estimated by randomly shuffling the labels and re-decoding; only the decoding probability of the cue surpassed the threshold.
Figure 3 with 2 supplements
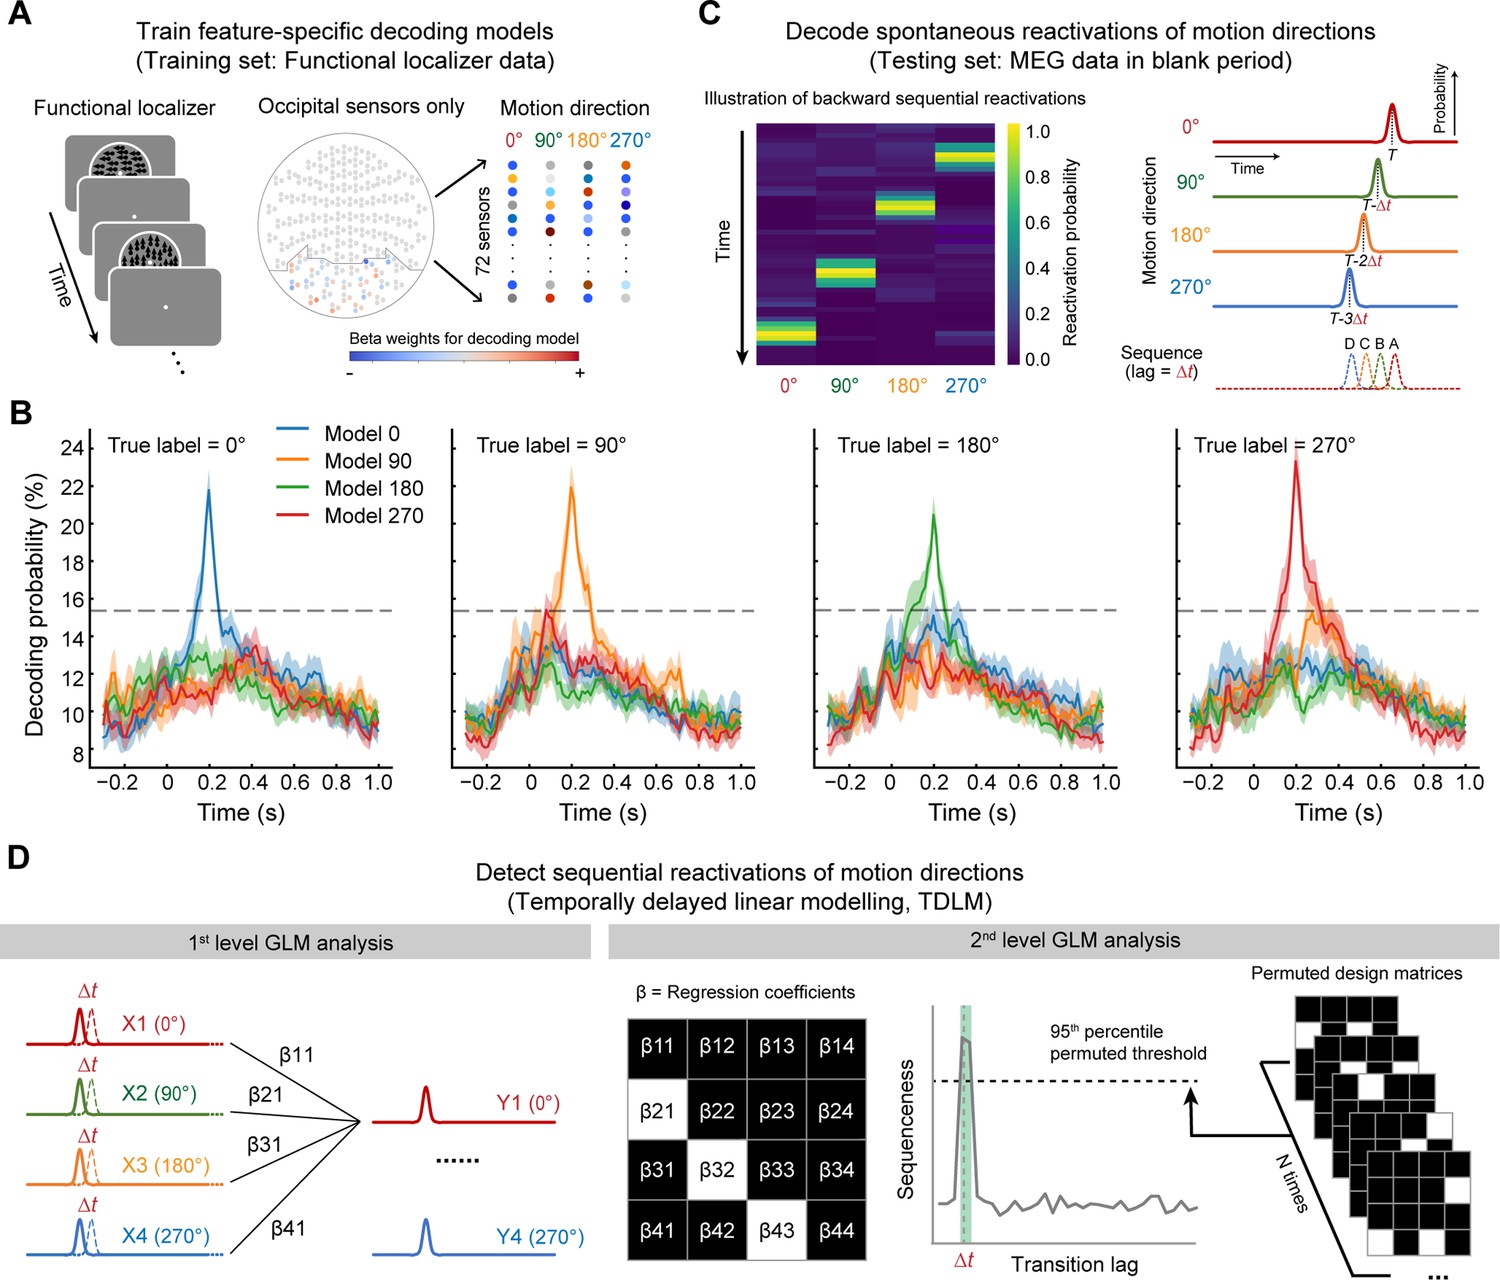
Illustration of replay analysis pipeline: temporally delayed linear modeling (TDLM).
(A) A Lasso logistic regression model was trained for each participant and motion direction using magnetoencephalography (MEG) signals from the functional localizer data. (B) The four feature-specific models that were trained using functional localizer data. The decoding probabilities were aligned at 200 ms poststimulus onset according to their corresponding optimal time point per participant and motion direction. Each colored line indicates the decoding results of a model applied to a motion direction dataset. The dashed horizontal line indicates the permutation threshold estimated by random shuffling of the labels and re-decoding. (C) The four models were next applied to MEG signals during the post-cue blank period to derive a decoded reactivation matrix [time × motion direction]. An illustration of backward sequential reactivations of motion direction is shown on the left. Reactivation probabilities correspond to the decoding probabilities derived from the four models. (D) Using TDLM, we quantified the evidence for sequential replay of the motion sequence during the post-cue blank period in start- and end-only conditions. We first performed a time-lagged regression to generate a [4×4] empirical regression coefficient matrix for each time lag by regressing each lagged predictor matrix, X(Δt), onto the original reactivation matrix, Y (i.e. first-level GLM analysis). Next, we used a second-level GLM analysis to evaluate the extent to which the empirical transition matrix follows a model transition matrix (e.g. forward or backward transitions) (i.e. second-level GLM analysis). Finally, we calculated the difference between the second-level regression coefficients for forward and backward transitions, referred to as ‘sequenceness’. We tested the magnitude of this ‘sequenceness’ at each time lag independently for all transition lags up to 600 ms. The dashed line represents the corrected nonparametric statistical significance threshold. The green area indicates the lags when the evidence of ‘sequenceness’ in the backward direction exceeded the permutation threshold.
Figure 3—figure supplement 1
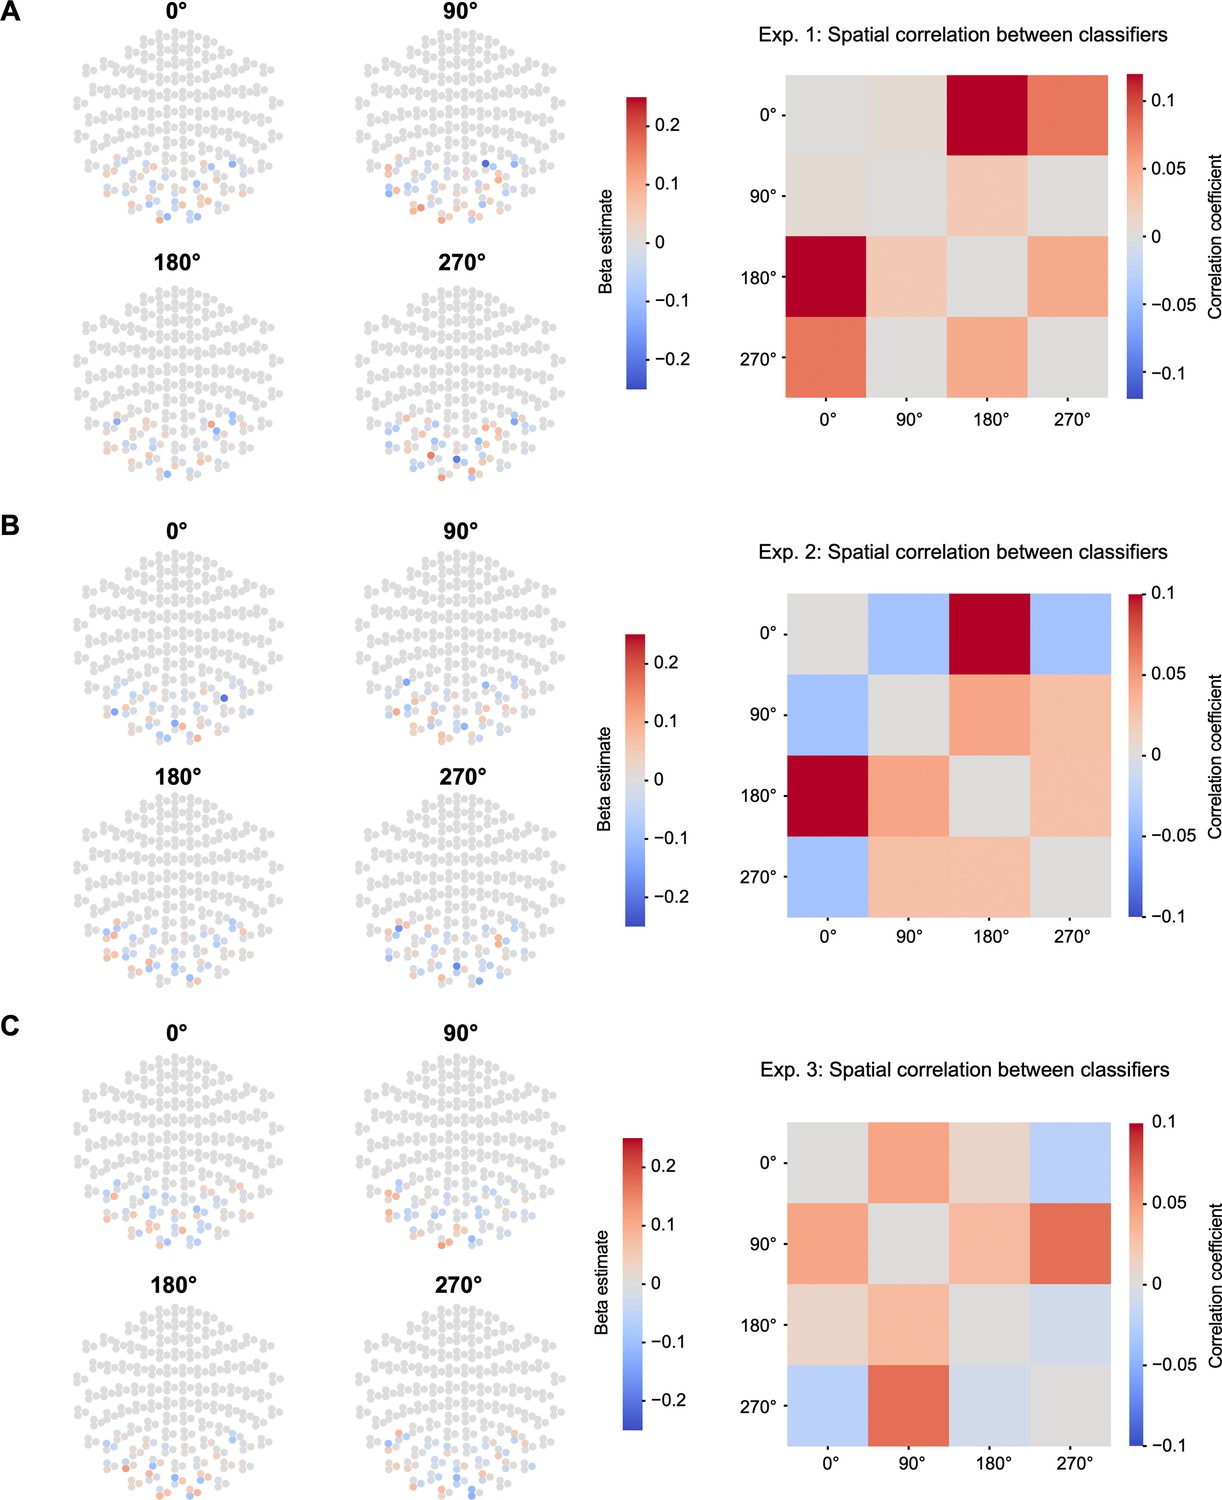
Sensor maps and spatial correlation of trained Lasso logistic regression models.
(A) Left: Sensor map for each state decoding model in Experiment 1; magnetoencephalography (MEG) signals from 72 occipital sensors were selected as features while training the classifier. Right: Correlation matrix among classifiers. No spatial correlation was found among trained classifiers (highest correlation; r<0.12). (B and C) Same as (A), except the sensor maps and correlation matrix correspond to Experiments 2 (Panel B, highest correlation; r<0.1) and 3 (Panel C, highest correlation; r<0.1), respectively.
Figure 3—figure supplement 2
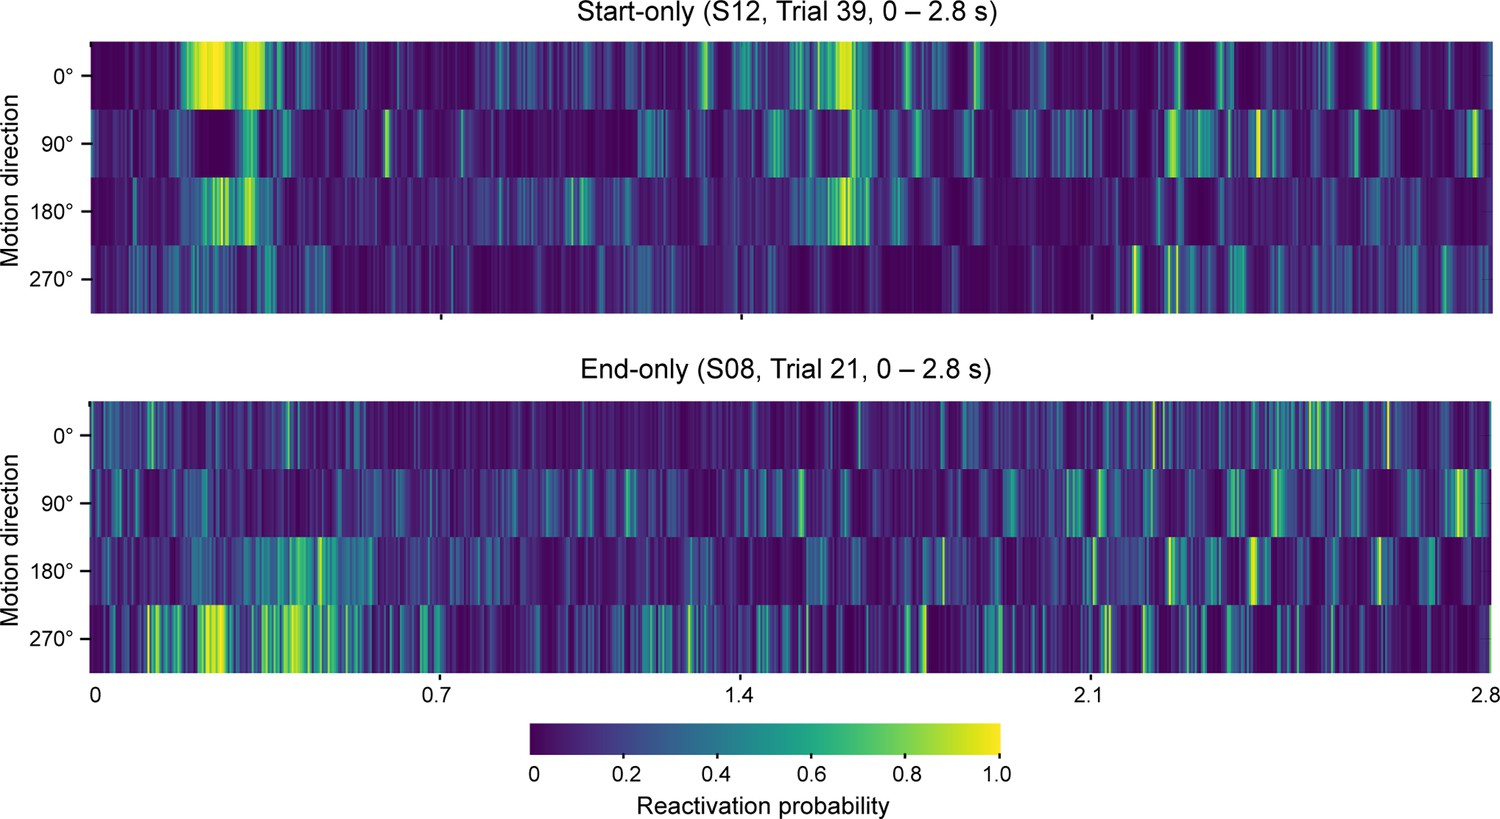
Decoded feature representations in start- and end-only conditions.
Time series of reactivation probability output from the four regression models on an example trial. Time zero corresponds to trial onset. Both participants S08 and S12 were exposed to a fixed motion sequence of 0° → 90° → 180° → 270°.
Figure 4 with 2 supplements
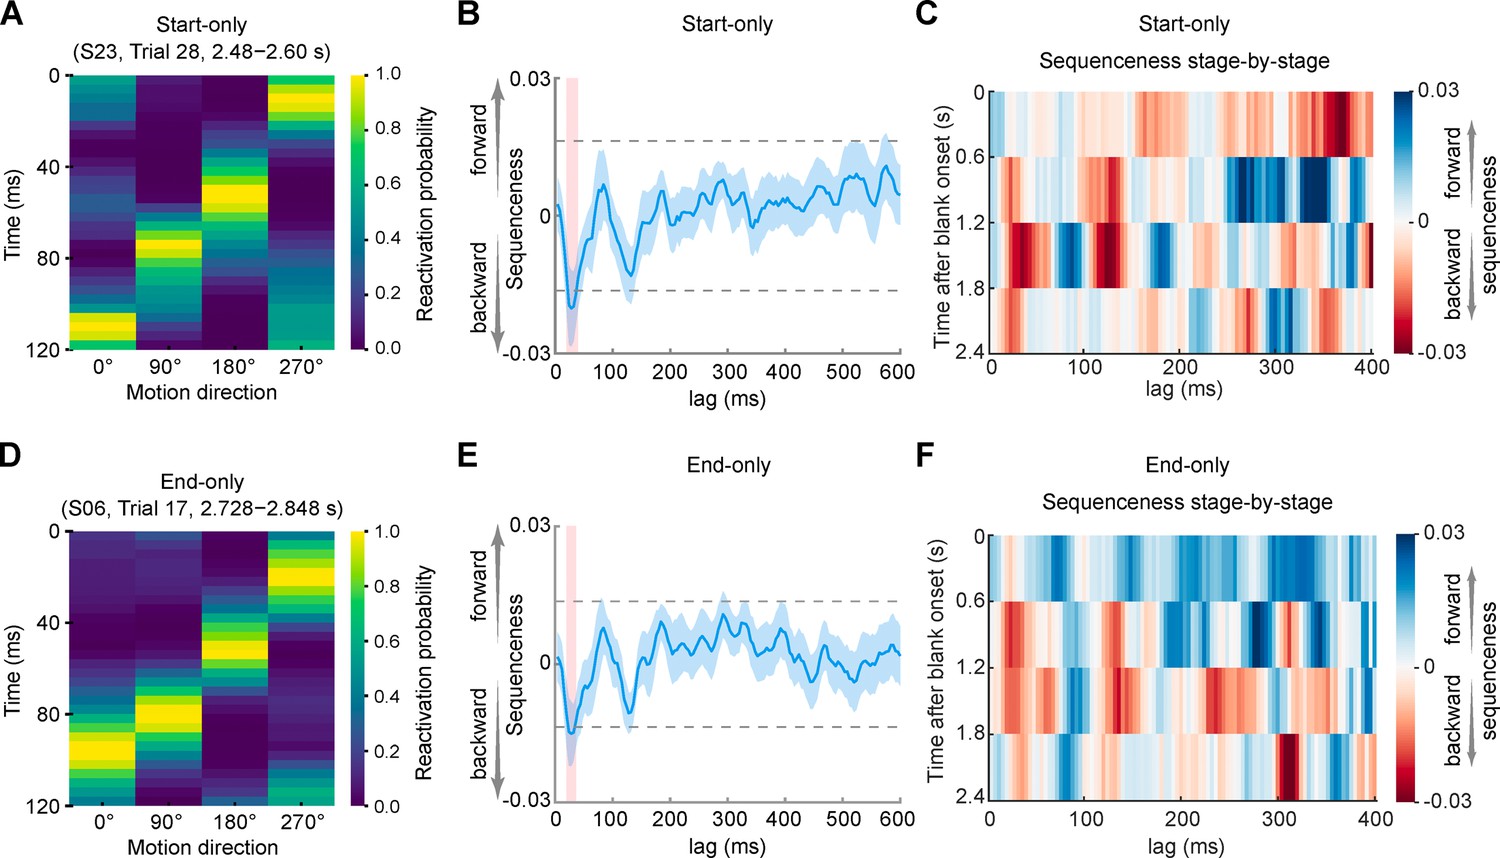
Backward replay in both start- and end-only conditions.
(A and D) Examples of backward sequential reactivation in start- (A) and end- (D) only conditions from a representative participant. Each row represents the reactivation probabilities for the four motion directions at that time point, and each column indicates one of the four motion directions. (B and E) Backward replay of the exposed motion sequence with peak transition lags at 28–40 ms in the start-only condition (B) and at 28–36 ms in the end-only condition (E). Horizontal dashed lines represent corrected significance levels from a nonparametric permutation test at the second-level GLM analysis of temporally delayed linear modeling (TDLM). The sequenceness on the y-axis is a unitless measure. The lag on the x-axis represents the time lag (Δt) between sequential reactivations, rather than absolute time. The red shaded areas indicate the lags when the evidence of sequenceness exceeded the permutation-based significance threshold. (C and F) Backward replay of the exposed motion sequence predominantly appeared at 1.2–1.8 s in the start-only condition (C) and 0.6–1.8 s in the end-only condition (F) after the onset of the blank period.
Figure 4—figure supplement 1
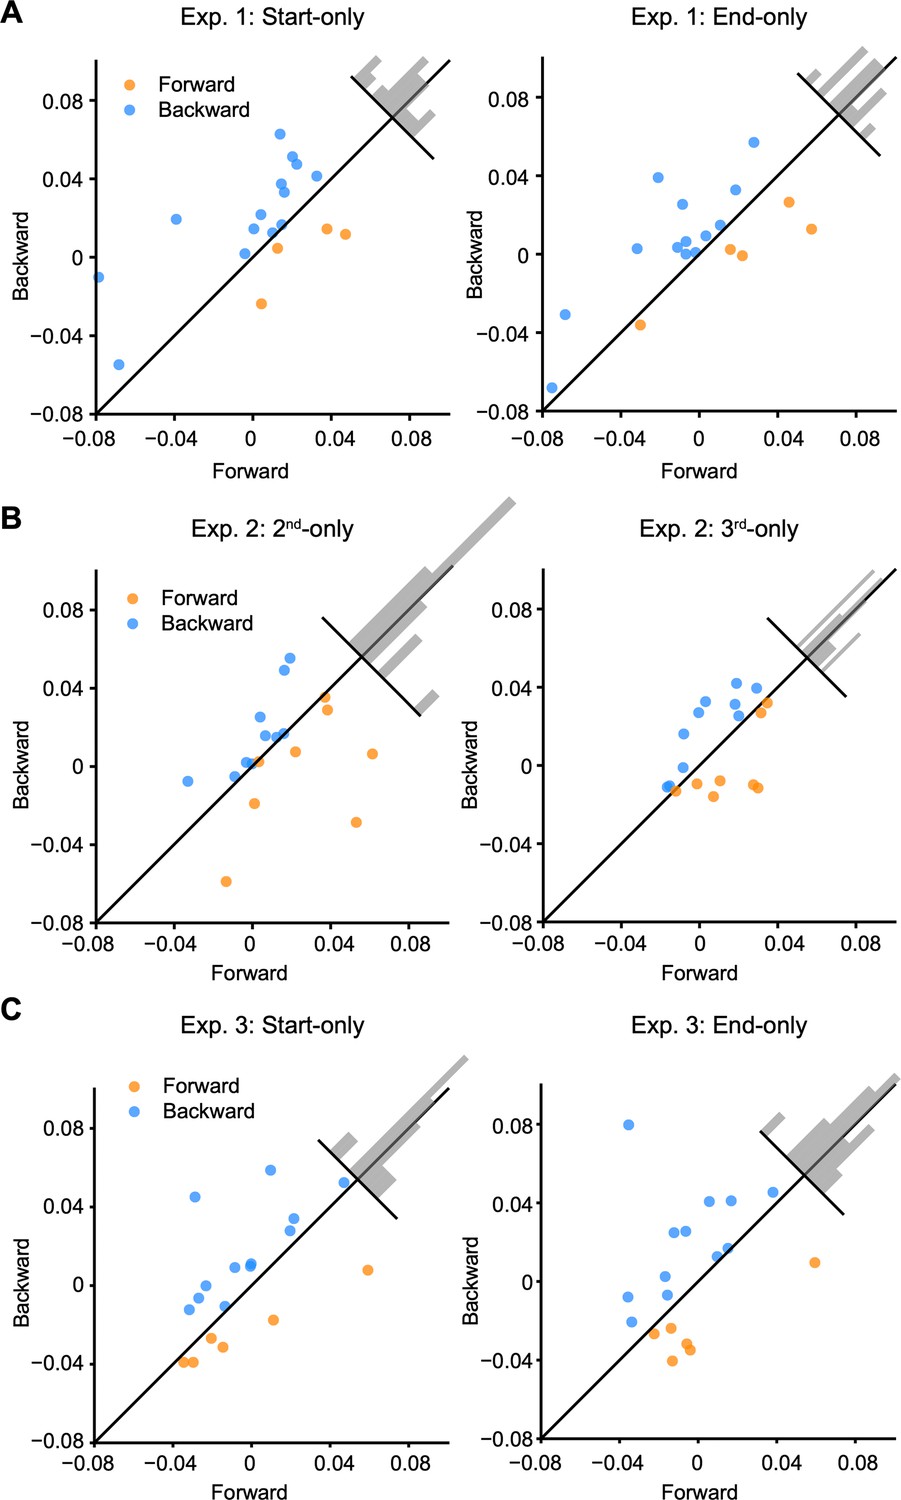
Sequenceness distribution across participants.
(A) In Experiment 1, of the 18 participants, 14 showed backward replay at 32 ms-lag for the start-only condition (left), and 13 showed backward replay at 32 ms-lag for the end-only condition (right). Each dot represents an individual participant. Backward and forward sequenceness is denoted by blue and yellow dots, respectively. The inset histogram shows the distribution of deviations from the unity line. (B) Same as described in (A), but for the results of Experiment 2 in the second-only (left) and third-only (right) conditions, respectively. (C) Same as described in (A) but for the results of Experiment 3 in the start- (left) and end-only (right) conditions, respectively.
Figure 4—figure supplement 2
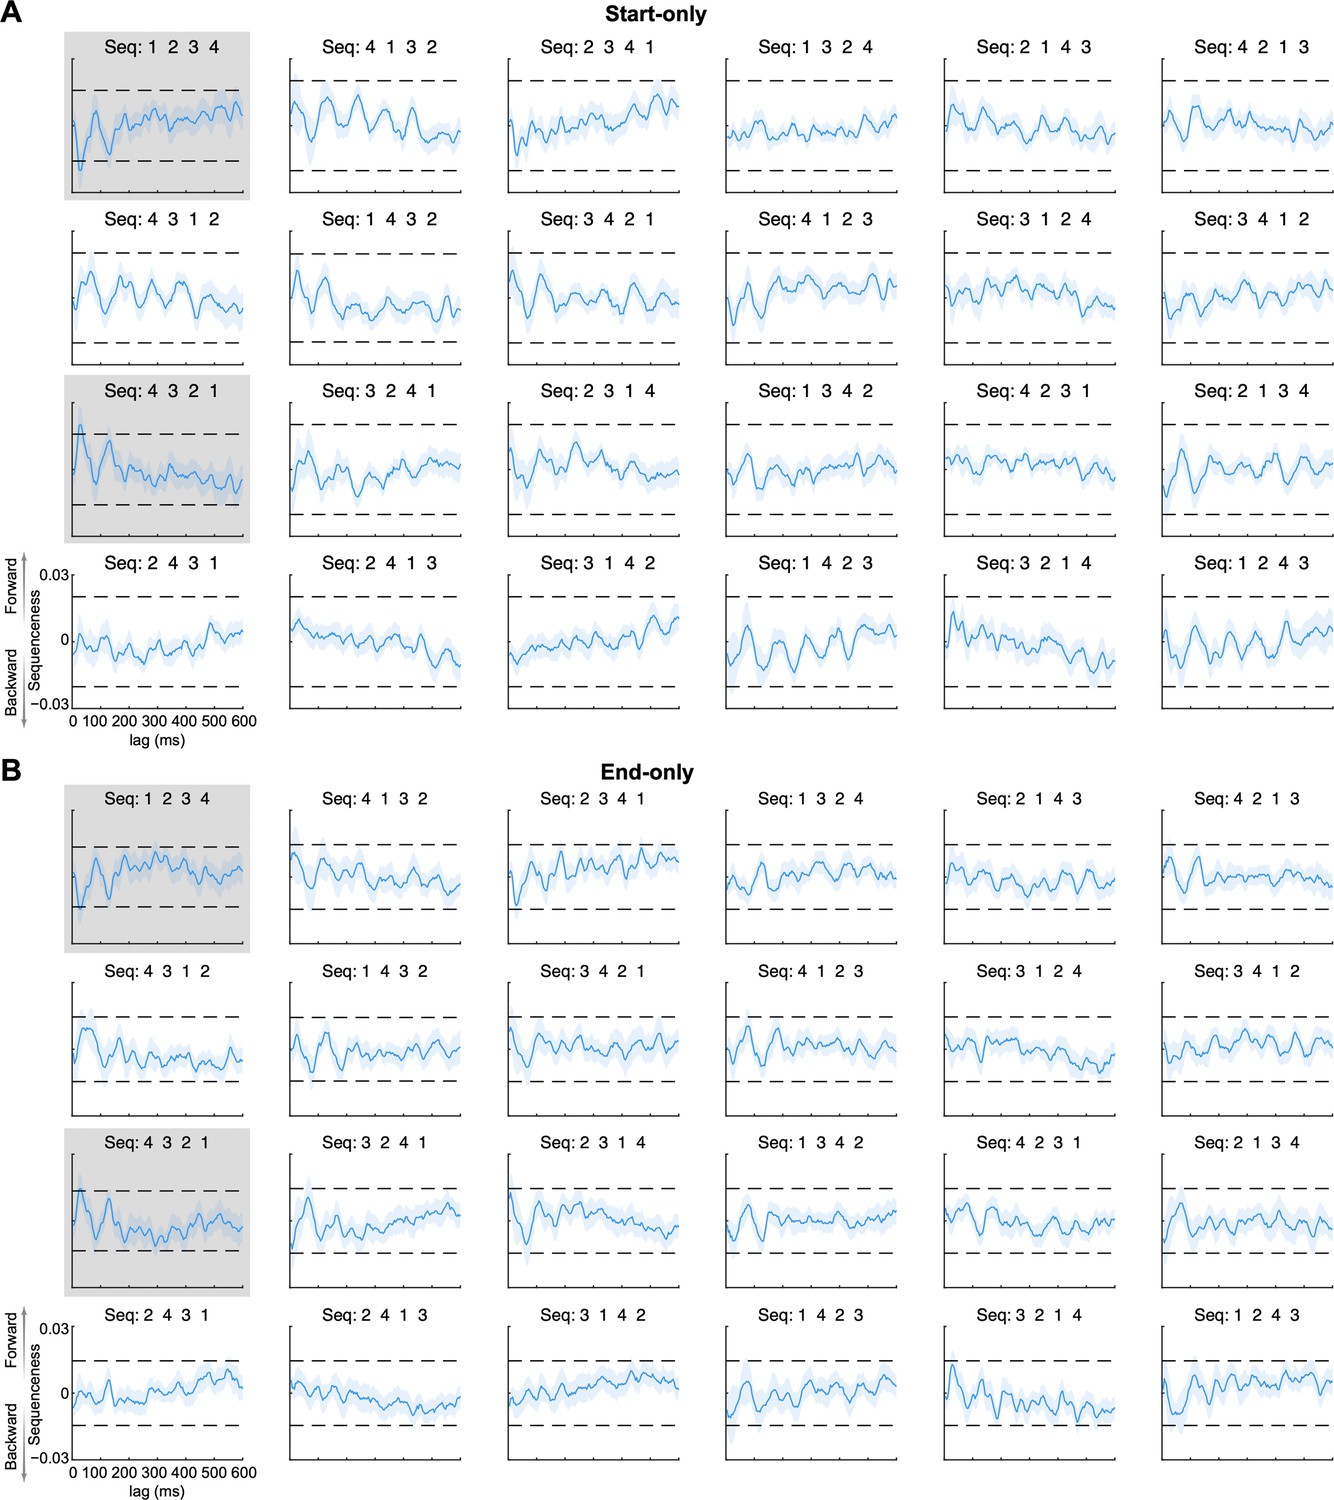
Sequenceness for each of the 24 possible orders.
(A) In the start-only condition of Experiment 1, only the backward sequence [4 → 3 → 2 → 1] with lags at 28–40 ms was significantly different (gray panels). The horizontal dashed lines represent significance thresholds derived from state label permutation at the second-level GLM matrix of temporally delayed linear modeling. (B) Same as described in (A) but for the end-only condition in Experiment 1.
Figure 5 with 1 supplement
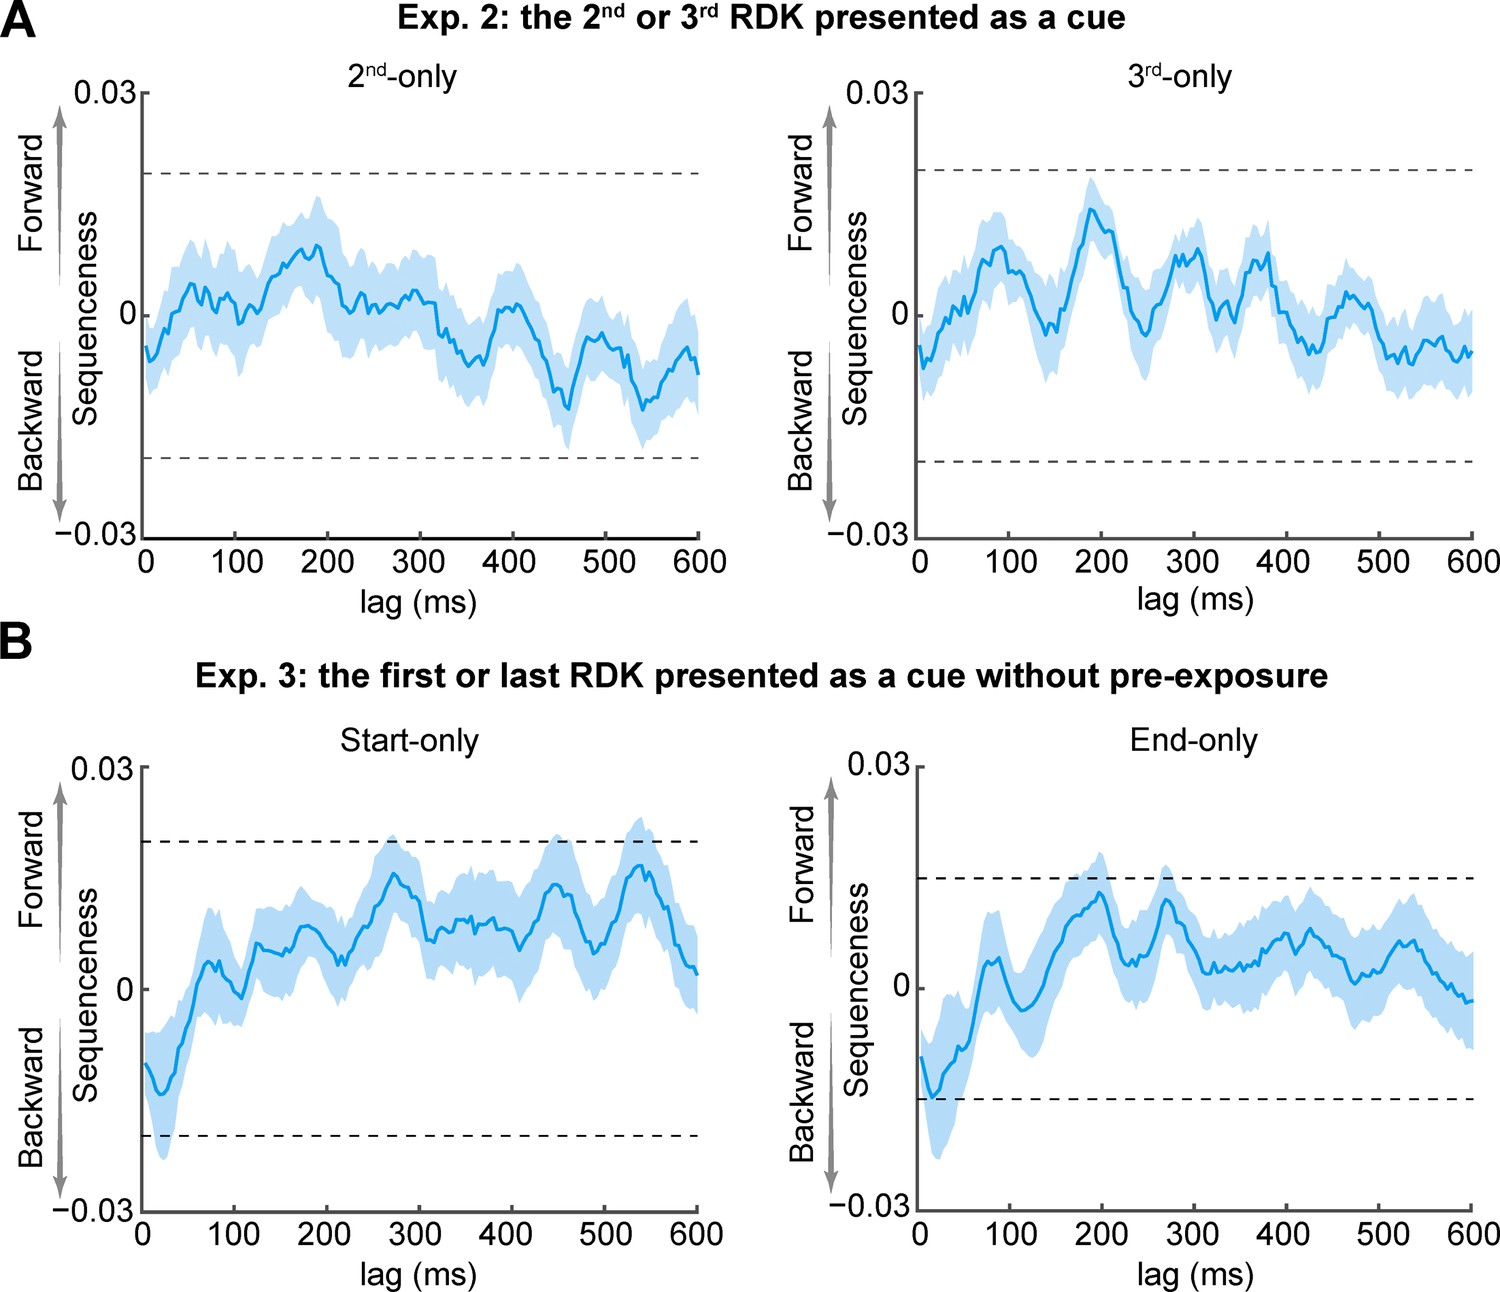
Backward replay is cue-dependent and depends on the amount of exposure.
(A) No evidence for replay was found in either the second-only (left) or third-only (right) condition in Experiment 2. Horizontal dashed lines have the same meaning as those in Figure 4B and E. (B) In Experiment 3, immediately after the functional localizer phase, participants entered the main phase without the exposure phase. In the end-only condition, backward replay was observed; however, in the start-only condition, no such replay was observed.
Figure 5—figure supplement 1

Stimuli and experimental procedures in Experiments 2 and 3.
(A) We presented the second (second-only condition) or third random-dot kinematogram (RDK) (third-only condition) as a cue in Experiment 2. (B) The procedure of Experiment 3 was identical to that of Experiment 1 except for removing the exposure phase.
Figure 6
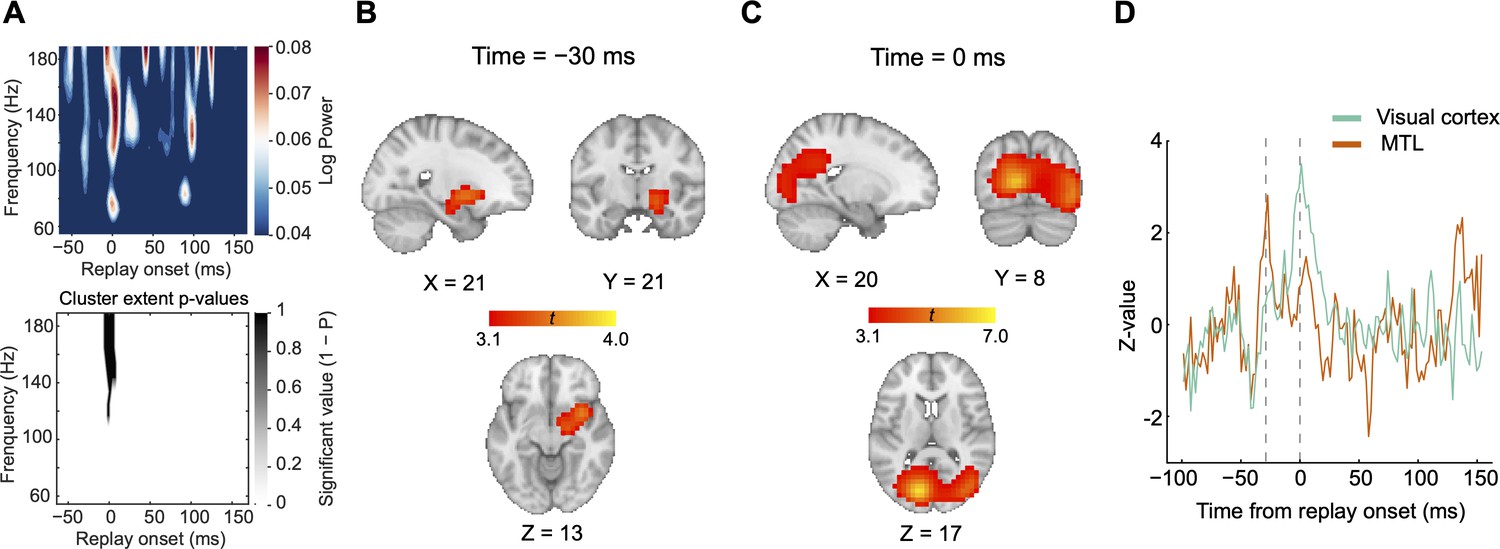
Replay events align with ripple power, with source activation in the medial temporal lobe (MTL) preceding activation in visual cortex.
(A) Top: In Experiment 1, a time-frequency decomposition of sensor-level data revealing a brief increase in high-frequency oscillatory power at replay onset. Bottom: A cluster-based permutation test (cluster forming threshold, t>3.1; number of permutations = 5000) could identify a significant cluster around 140 Hz (n = 18). (B) Source localization of ripple-band power 30 ms before replay onset showing significant activation in the MTL (peak Montreal Neurological Institute [MNI] coordinates: X=21, Y=21, Z=13, neurological orientation). (C) Source localization of ripple-band power at replay onset showing significant activation in visual cortex (peak MNI coordinates: X=20, Y=8, Z=17). (D) The activation time course of the MTL at its peak MNI coordinate is shown in red, whereas that of visual cortex at its peak MNI coordinate is displayed in green. The MTL reached its peak activation before visual cortex.
Additional files
Download links
A two-part list of links to download the article, or parts of the article, in various formats.
Downloads (link to download the article as PDF)
Open citations (links to open the citations from this article in various online reference manager services)
Cite this article (links to download the citations from this article in formats compatible with various reference manager tools)
Non-feature-specific elevated responses and feature-specific backward replay in human brain induced by visual sequence exposure
eLife 13:RP101511.
https://doi.org/10.7554/eLife.101511.4


