No effect of additional education on long-term brain structure, a preregistered natural experiment in thousands of individuals
- Cognitive Neuroscience Department, Donders Institute for Brain, Cognition, and Behavior, Radboud University Medical Center, Netherlands
- Department of Psychology, Stockholm University, Sweden
- Swedish Collegium for Advanced Study, Sweden
Figures
Figure 1 with 4 supplements
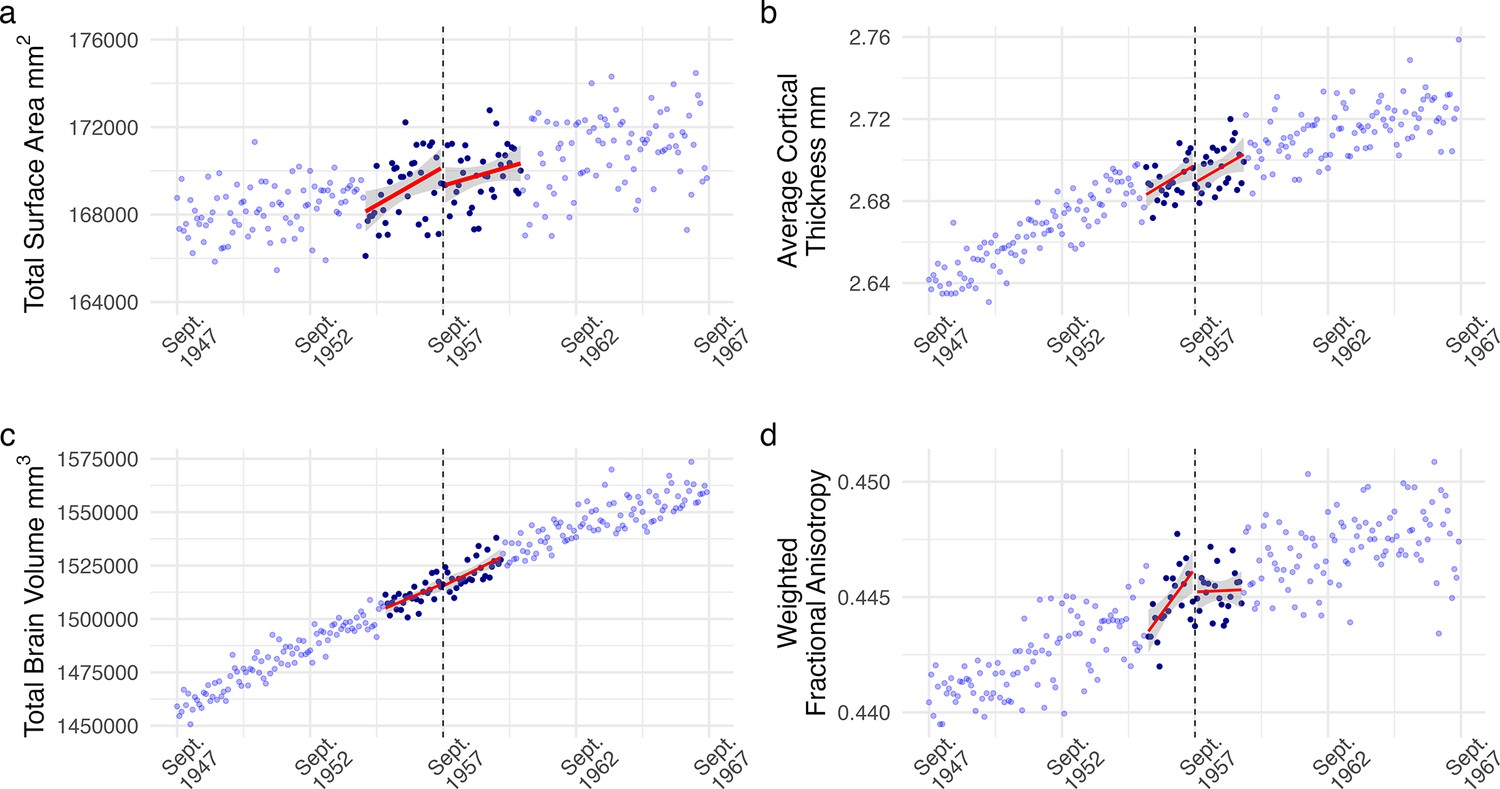
Regression discontinuity (RD) plot of monthly averaged (a) total surface area, (b) average cortical thickness, (c) total brain volume, and (d) weighted fractional anisotropy plotted by the participant’s date of birth in months (our running variable).
Each dot reflects the average value for individuals born in that month. The dashed line corresponds to September 1957, the date of birth inclusion cutoff for an additional year of mandatory education from ROSLA. Dark blue dots represent all individuals within the mean-squared error-optimized bandwidths, reflecting participants used for analysis with a local-linear fuzzy RD approach. We found no evidence of an effect from an additional year of education on any of the preregistered structural neuroimaging measures across various analysis specifications (Supplementary file 2–4 and 6).
Figure 1—figure supplement 1

Raincloud plots illustrating the distribution of participants (a) date of visit, (b) date of birth (DOB), and (c) of the participant’s age at neuroimaging (mean = 61.89).
For anonymity reasons, DOB is measured in months, yet the scan date was measured to the day. To derive age at neuroimaging, we subtracted the number of months between DOB and the scan date, setting each participant’s day of birth to the first of the month.
Figure 1—figure supplement 2

This regression discontinuity plot shows the effect of the law on the percentage of students staying an additional year in school (Y) by date of birth monthly averaged bins.
This is the first stage in the two-stage fuzzy regression discontinuity analysis. This increased attendance by roughly 10%. See ‘first stage’ in Supplementary file 2 for coefficient estimates.
Figure 1—figure supplement 3

Regression discontinuity plots of monthly averaged.
(a) cerebrospinal fluid volume and, (b) white matter hyperintensities plotted by the participant’s date of birth in months (X; our running variable). The dashed line corresponds to September 1957 when ROSLA came into effect. Dark blue dots represent the mean-squared error-optimized bandwidths. Linear model fits (in red) on either side of the cutoff are added for illustration purposes. We found no effect of an additional year from ROSLA on any of our global neuroimaging outcomes (Supplementary files 2 and 3).
Figure 1—figure supplement 4

Regression discontinuity plots of monthly averaged (a) total surface area, (b) cerebrospinal fluid volume, (c) average cortical thickness, (d) white matter hyperintensities, (e) total brain volume, and (f) weighted fractional anisotropy, plotted by the participant’s date of birth in months (X; our running variable).
The dashed line corresponds to September 1957, the date of birth inclusion criteria of ROSLA. This plot is the same as Figure 1 and Figure 1—figure supplement 3, yet with third-order global polynomial fits; a common illustration in the RD literature.
Figure 2 with 1 supplement
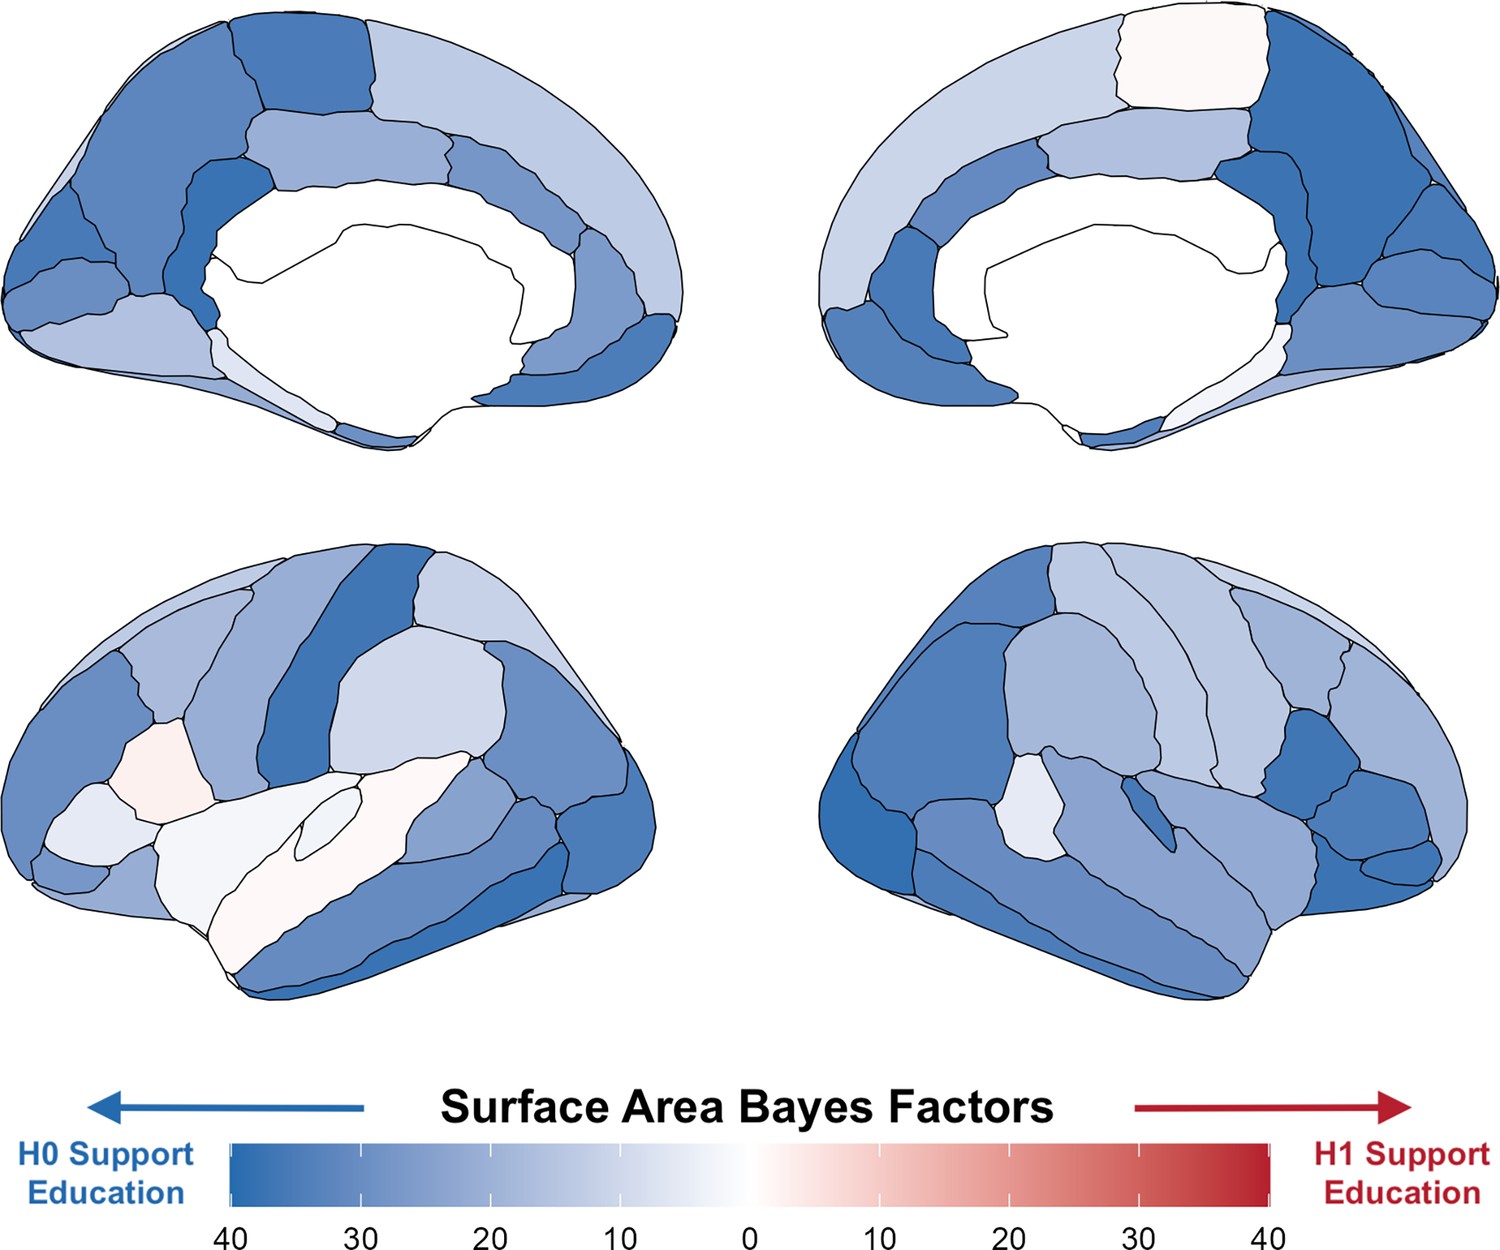
Bayes factors for surface area per region using a local randomization analysis with a 5-month window around the onset of ROSLA (September 1, 1957).
Illustrating widespread evidence against the effect of a year of education on total surface area. The regionally specific analysis of these Bayes factors [reported prior: normal(0, 1)] was not preregistered and serves to illustrate our global neural findings.
Figure 2—figure supplement 1

Raincloud plots of (A) the effective number of observations and (B) uncorrected p-value of a local-linear fuzzy RD per region per modality [cortical thickness (CT), Surface Area (SA), Subcortical regions, and weighted mean fractional anisotropy (wFA)].
No regions were significant (P<.05) following FDR correction per modality.
Figure 3 with 3 supplements
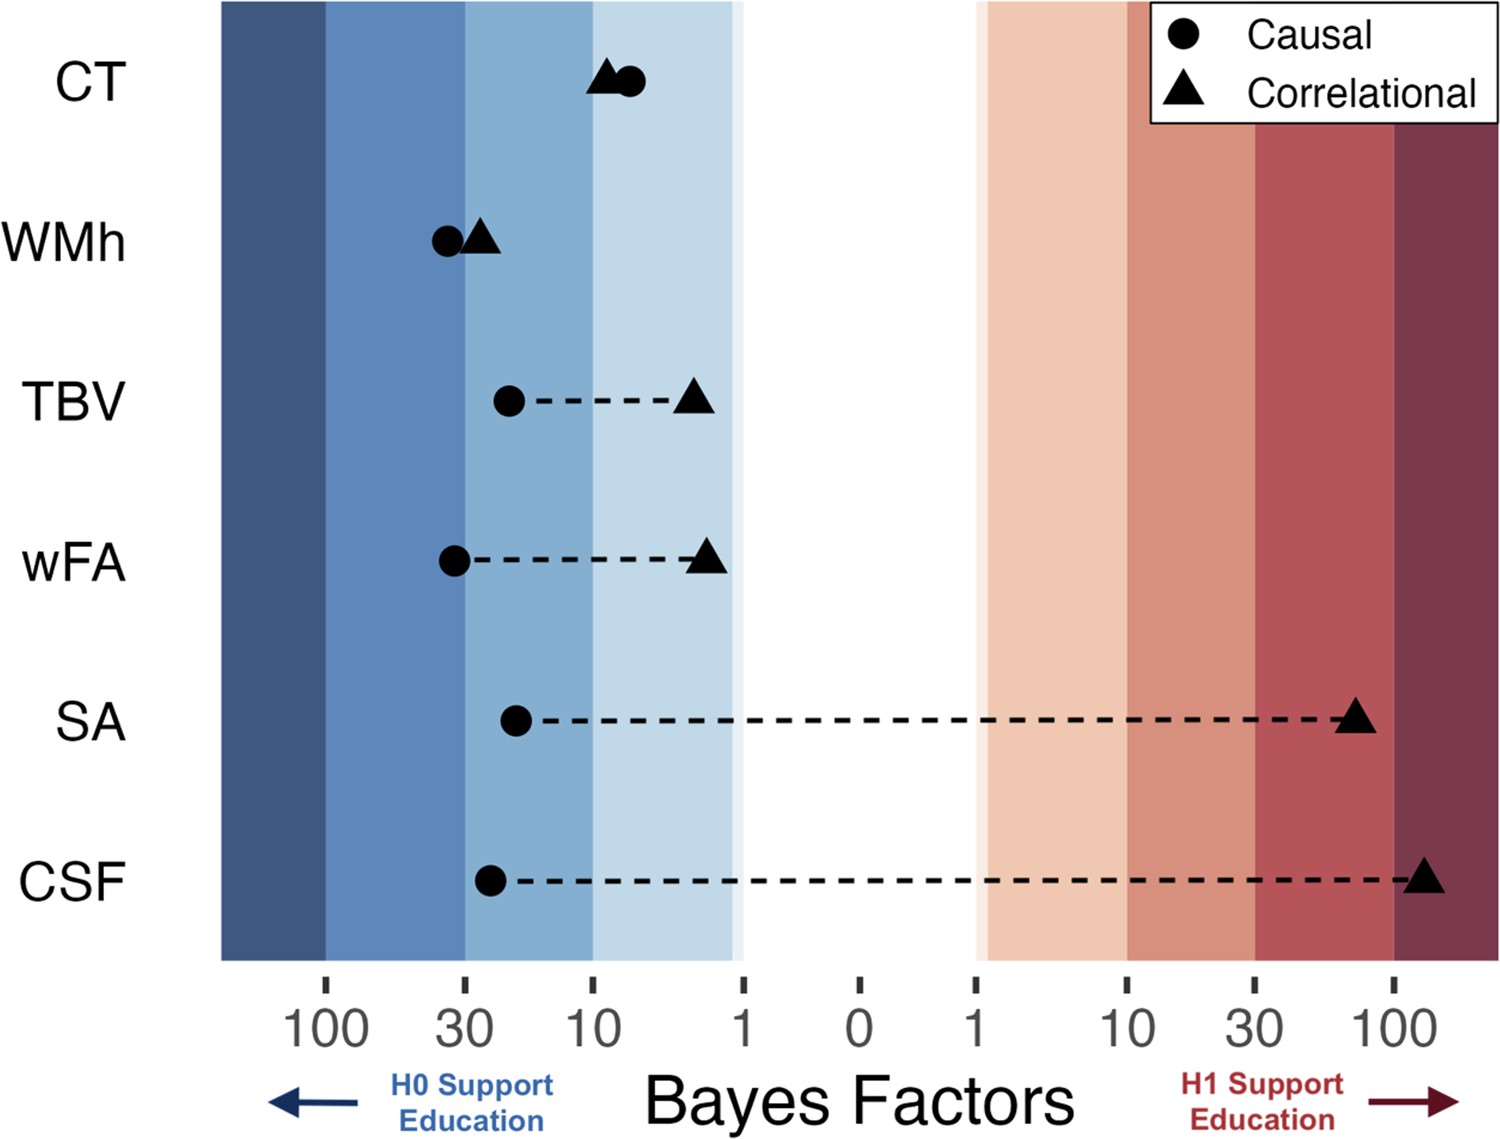
Bayesian Heat Plot: Bayesian evidentiary strength (x-axis) for causal (circles) and correlational (triangles) estimates reflecting the impact of one additional year of education on global neuroimaging measures (y-axis; average cortical thickness [CT], white matter hyperintensities [WMh], total brain volume normalized for head size [TBV], mean weighted fractional anisotropy [wFA], total surface area [SA], and cerebral spinal fluid volume normalized for head size [CSF]).
Stripped bands reflect the strength of evidence using Jeffrey’s criteria 1961. For the causal estimates, positive Bayes Factors indicated support for the alternative hypothesis that an additional year of education affects the brain, while negative values indicate support for the null hypothesis of no effect. The causal and correlational parameters come from the same set of participants (n ≈ 1200) born from April 1957 until Jan 1958. The causal parameter is an estimate of the effect of ROSLA with a 5-month window local-randomization analysis. The correlational parameter is an estimate of the association between a participant’s self-reported educational attainment in years and (global) neuroimaging measures. Note: The association between educational attainment and CSF did not hold across eight replication sub-cohorts, yet surface area demonstrated a robust association (Figure 3—figure supplements 2 and 3).
Figure 3—figure supplement 1

An overview of the Bayesian priors used in our Bayesian local-randomization analysis.
All priors have a location of zero yet vary in their scale parameter. The blue priors represent our reported (not preregistered priors). In text, we report the normal distribution with a standard deviation of one. The orange Normal distribution (sd = 2.5) is the default, ‘weakly informative’ prior from STAN (our initial preregistered prior; which is too wide; thereby offering excessive support for the null hypothesis). The magenta Cauchy distribution is the default ‘wide’ prior used in the BayesFactor package. Point null Bayes Factors are particularly sensitive to the prior used – yet across all tested specifications (Supplementary files 4 and 6) – we find evidence in support of the null hypothesis.
Figure 3—figure supplement 2

An overview of eight cohorts/subsets (plus the original 5-month local randomization cohort; s1957) spaced 2 years apart with 10-month windows of included subjects in panel a.
The running variable is the date of birth centered around the start of the ROSLA natural experiment (0 = September 1957) indicated by the dashed line. Panel b illustrates educational attainment distributions for the nine cohorts; note the lack of individuals with only 15 years of education after 1957 due to ROSLA.
Figure 3—figure supplement 3

Illustrates the posterior of the associational effect of educational attainment on neuroimaging measures across nine 10-month subcohorts of UK Biobank data spaced 2 years apart.
For this post hoc analysis, a normally distributed prior with a mean of zero and an SD of one was used. The cohort’s 1957’ is our initial preregistered associational analysis, which is centered on the ROSLA cutoff allowing us to compare and contrast a causal parameter to an associational one (Figure 3). Crucially, we found evidence in support of an associational effect of education on CSF and Surface Area, along with evidence in support of the null hypothesis for the other global neuroimaging covariates. Upon a reviewer-initiated comment (see Elife v1 Reviewer 1 Recommendation 7), we made additional subcohorts (see Supplementary file 7) as the placement of our associational analysis should not matter. This additional post hoc analysis seems to indicate the effect of educational attainment on CSF to be a false positive – illustrated by the additional eight posterior distributions crossing (or being near) zero. In contrast, these replication cohorts offer increased evidence in support of an associational effect on SA (all posterior distributions above or nearly above zero) and offer increased support for the null hypothesis for the additional four global neuroimaging measures (CT, TBV, wFA, WM_hyper).
Additional files
-
Supplementary file 1
Fuzzy RD Placebo Outcome results.
- https://cdn.elifesciences.org/articles/101526/elife-101526-supp1-v1.docx
-
Supplementary file 2
Fuzzy RD Global Neuroimaging Results.
- https://cdn.elifesciences.org/articles/101526/elife-101526-supp2-v1.docx
-
Supplementary file 3
Fuzzy RD Uncorrected Global Neuroimaging Results.
- https://cdn.elifesciences.org/articles/101526/elife-101526-supp3-v1.docx
-
Supplementary file 4
One month window Bayesian Analysis.
- https://cdn.elifesciences.org/articles/101526/elife-101526-supp4-v1.docx
-
Supplementary file 5
One Month window Test of Covariates.
- https://cdn.elifesciences.org/articles/101526/elife-101526-supp5-v1.docx
-
Supplementary file 6
Five Month window Bayesian Analysis.
- https://cdn.elifesciences.org/articles/101526/elife-101526-supp6-v1.docx
-
Supplementary file 7
Five Month window Test of Covariates.
- https://cdn.elifesciences.org/articles/101526/elife-101526-supp7-v1.docx
-
MDAR checklist
- https://cdn.elifesciences.org/articles/101526/elife-101526-mdarchecklist1-v1.docx
Download links
A two-part list of links to download the article, or parts of the article, in various formats.
Downloads (link to download the article as PDF)
Open citations (links to open the citations from this article in various online reference manager services)
Cite this article (links to download the citations from this article in formats compatible with various reference manager tools)
No effect of additional education on long-term brain structure, a preregistered natural experiment in thousands of individuals
eLife 13:RP101526.
https://doi.org/10.7554/eLife.101526.3


