The triad interaction of ULK1, ATG13, and FIP200 is required for ULK complex formation and autophagy
- Institute for Genetic Medicine, Hokkaido University, Japan
- Institute of Microbial Chemistry, Japan
- Department of Biochemistry and Molecular Biology, Graduate School of Medicine, The University of Tokyo, Japan
- Department of Molecular Oncology, Nippon Medical School, Institute for Advanced Medical Sciences, Japan
Figures
Figure 1 with 2 supplements
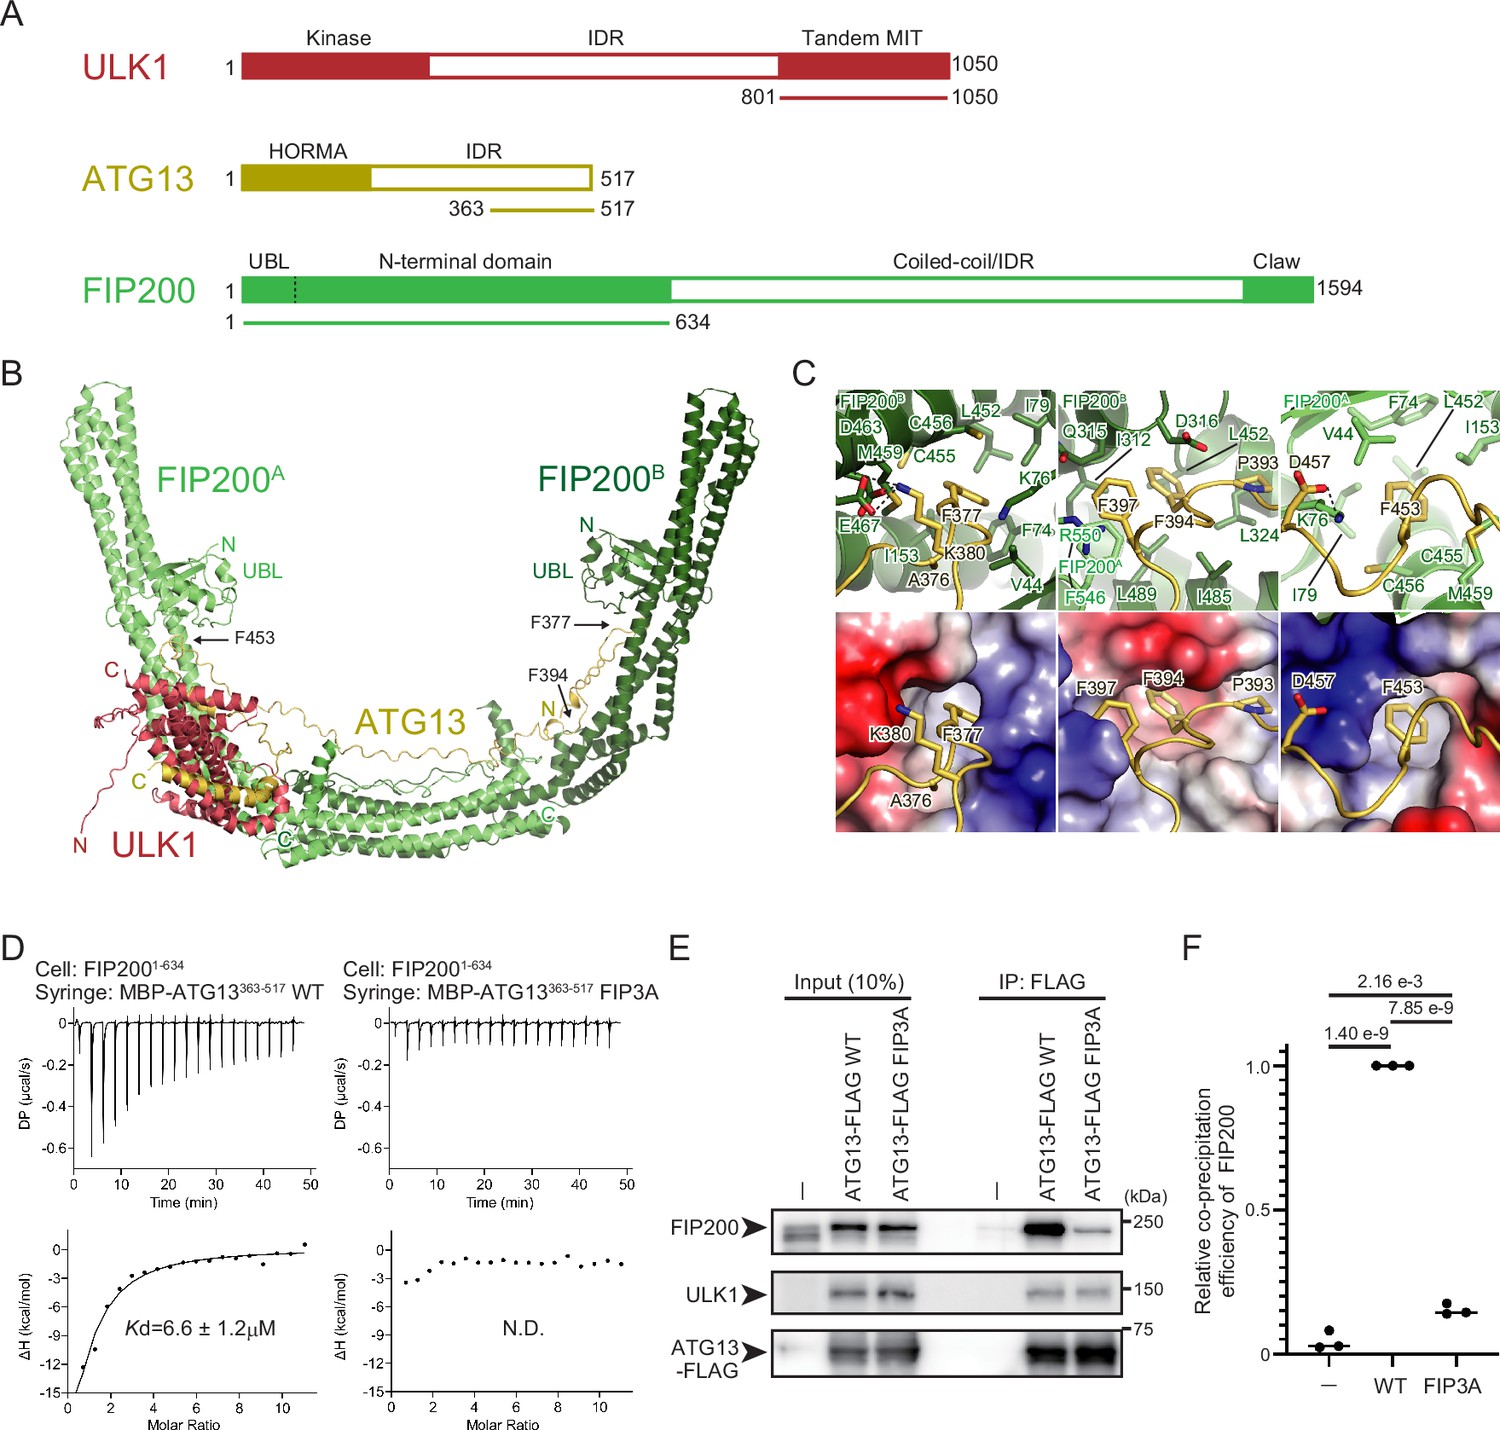
Structural basis of the ATG13–FIP200 interaction.
(A) Domain architecture of ULK1, ATG13, and FIP200. Regions used for the AlphaFold2 complex prediction are underlined. (B) Structure of the ULK1–ATG13–FIP200 core complex predicted by AlphaFold2. Flexible loop regions in FIP200 were removed from the figure for clarity. N and C indicate N- and C-terminal regions, respectively. (C) Close-up view of the interactions between ATG13 and FIP200. The bottom panels represent the surface model of FIP200 with the coloring based on the electrostatic potentials (blue and red indicate positive and negative potentials, respectively). (D) Isothermal titration calorimetry (ITC) results obtained by titration of MBP-ATG13 (363–517 aa) WT or FIP3A mutant into an FIP200 (1–634 aa) solution. (E) Effect of the ATG13 FIP3A mutation on the FIP200 interaction in vivo. ATG13 KO HeLa cells stably expressing FLAG-tagged ATG13 WT or FIP3A were immunoprecipitated with an anti-FLAG antibody and detected with anti-FIP200, anti-ULK1, and anti-FLAG antibodies. (F) Relative amounts of precipitated FIP200 in (E) were calculated. Solid bars indicate the means, and dots indicate the data from three independent experiments. Differences were statistically analyzed using Tukey’s multiple comparisons test.
-
Figure 1—source data 1
PDF file containing original western blots for Figure 1E.
- https://cdn.elifesciences.org/articles/101531/elife-101531-fig1-data1-v1.pdf
-
Figure 1—source data 2
Original files for western blot analysis displayed in Figure 1E.
- https://cdn.elifesciences.org/articles/101531/elife-101531-fig1-data2-v1.zip
-
Figure 1—source data 3
Values used for preparation of the graph in Figure 1F.
- https://cdn.elifesciences.org/articles/101531/elife-101531-fig1-data3-v1.xlsx
Figure 1—figure supplement 1
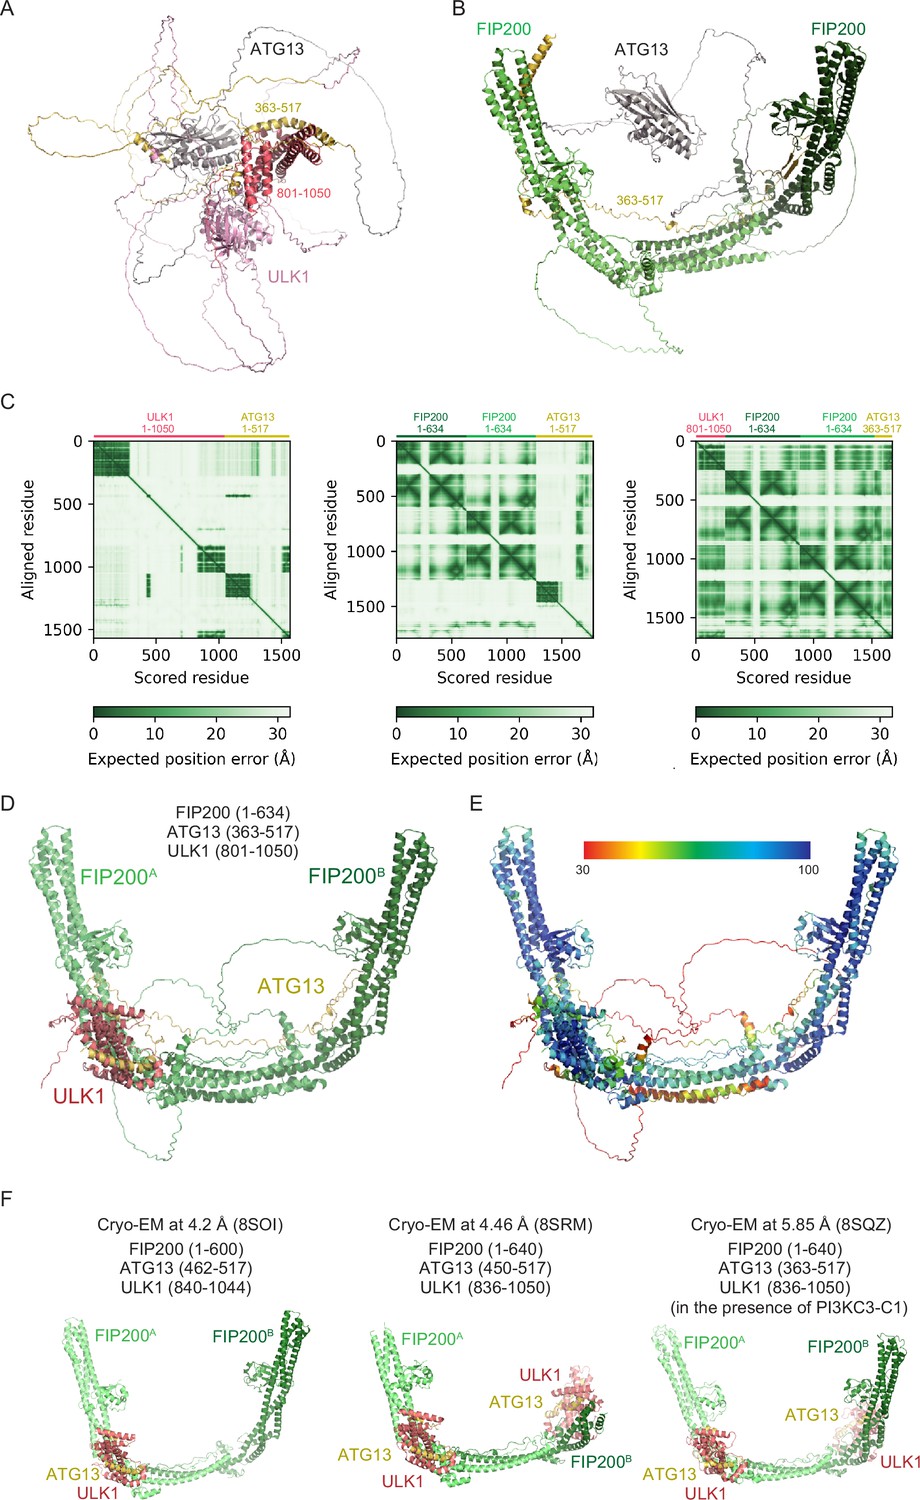
AlphaFold2 prediction of the ULK1–ATG13–FIP200 core complex.
(A) AlphaFold2 model of the full-length ULK1–ATG13 complex. (B) AlphaFold2 model of the full-length ATG13 complexed with the homodimer of FIP200 (1–634). (C) Predicted aligned error (PAE) plot of (A) (left), (B) (middle), and (D) (right). (D) Structure of the ULK1–ATG13–FIP200 core complex with flexible loops. (E) The structure in (D), color-coded by pLDDT values. (F) Cryo-EM structures of the ULK1–ATG13–FIP200 core complex.
Figure 1—figure supplement 2

Purification of recombinant proteins.
SDS–PAGE of recombinant proteins used for isothermal titration calorimetry (ITC) and in vitro pull-down experiments. Protein bands were stained with Coomassie Brilliant Blue.
-
Figure 1—figure supplement 2—source data 1
PDF file containing original western blots for Figure 1—figure supplement 2.
- https://cdn.elifesciences.org/articles/101531/elife-101531-fig1-figsupp2-data1-v1.pdf
-
Figure 1—figure supplement 2—source data 2
Original file for SDS–PAGE analysis displayed in Figure 1—figure supplement 2.
- https://cdn.elifesciences.org/articles/101531/elife-101531-fig1-figsupp2-data2-v1.zip
Figure 2
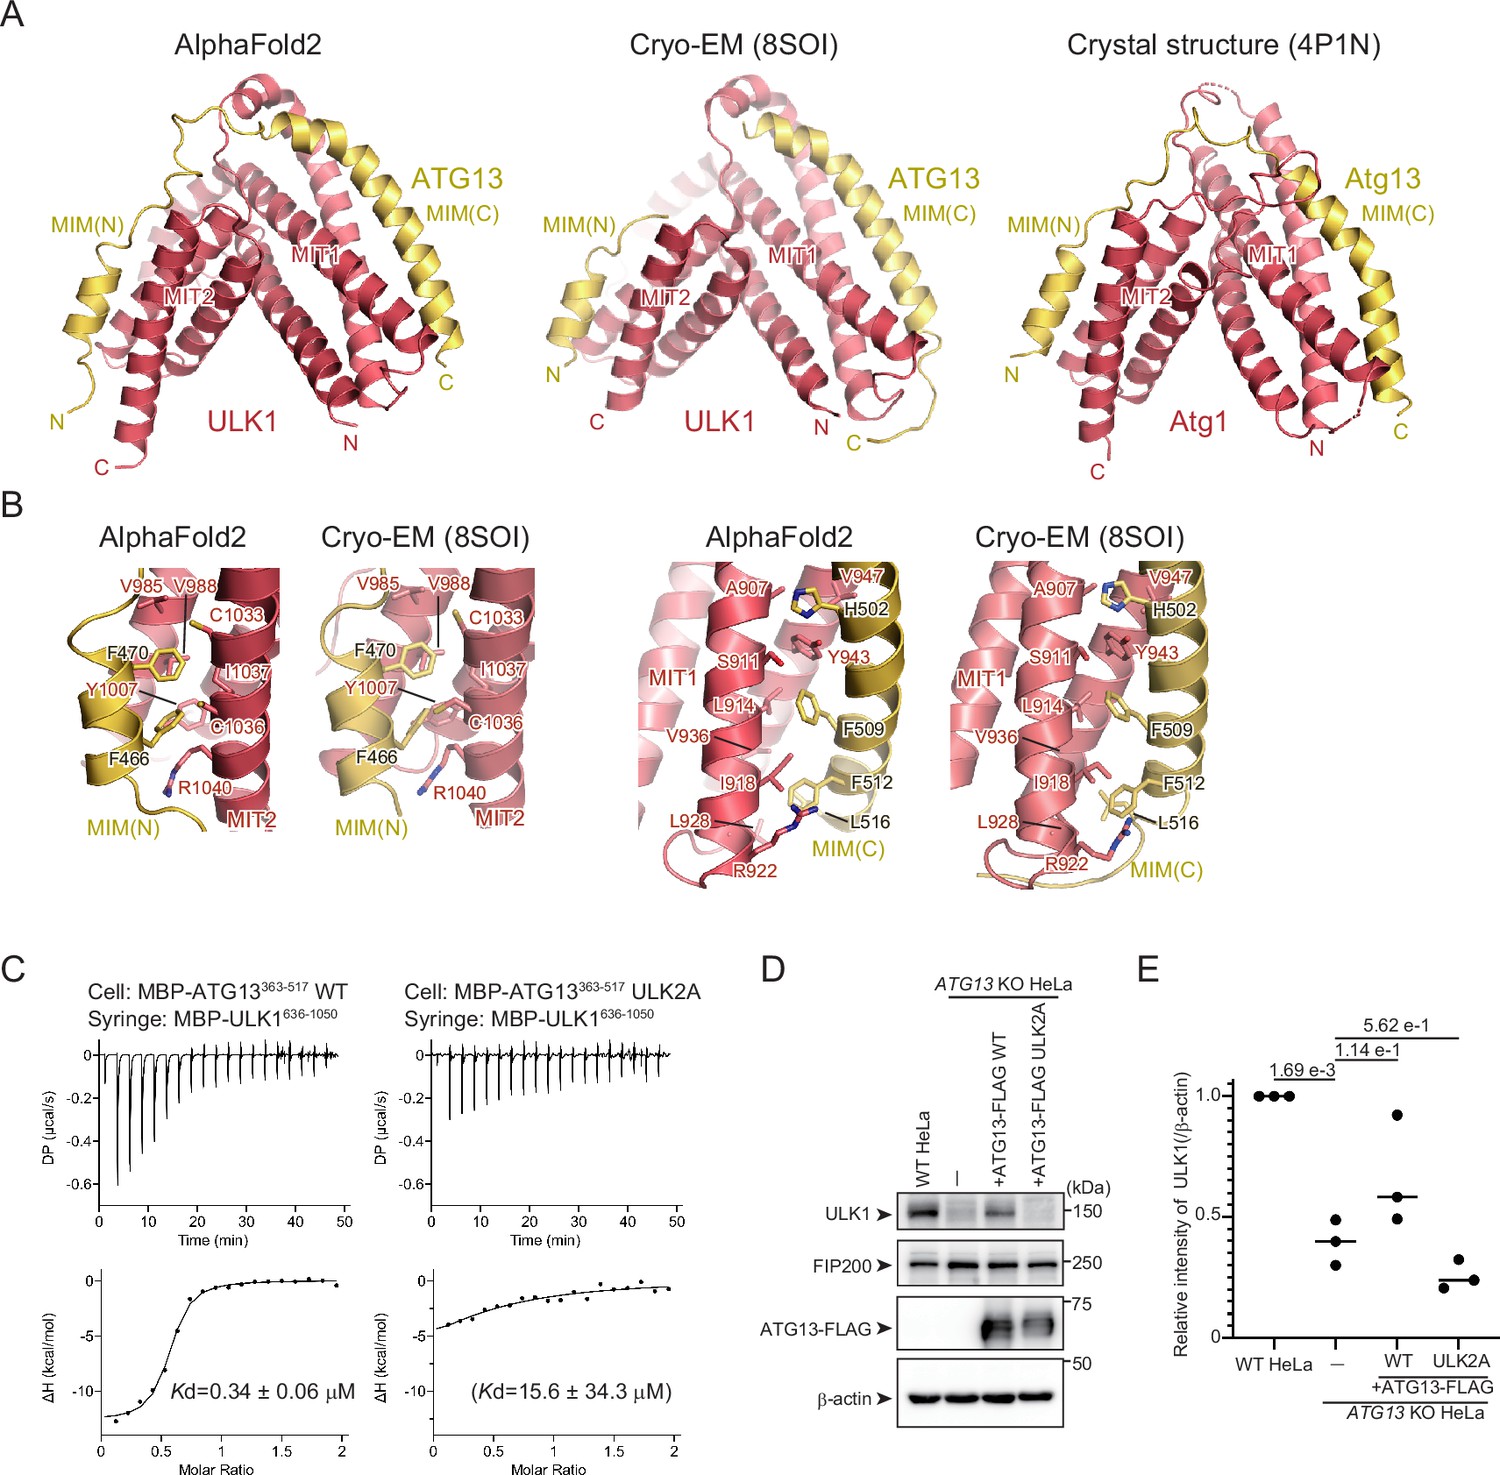
Structural basis of the ULK1–ATG13 interaction.
(A) AlphaFold2 model of the ULK1–ATG13 moiety of the ULK1–ATG13–FIP200 core complex in Figure 1B (left), Cryo-EM structure of the ULK1–ATG13 moiety of the ULK1–ATG13–FIP200 core complex (PDB 8SOI), and crystal structure of the yeast Atg1–Atg13 complex (right, PDB 4P1N). (B) Close-up view of the interactions between ATG13MIM(N) and ULK1MIT2 and between ATG13MIM(C) and ULK1MIT1 (right). (C) Isothermal titration calorimetry (ITC) results obtained by titration of MBP-ULK1 (636–1050 aa) into a solution of WT or ULK2A mutant of MBP-ATG13 (363–517 aa). Due to weak binding, the KD value for the ULK2A mutant was not accurately determined. (D) Effect of the ATG13–FIP3A mutation on endogenous ULK1 levels in vivo. WT or ATG13 KO HeLa cells stably expressing FLAG-tagged ATG13 WT or ULK2A mutant were lysed, and indicated proteins were detected by immunoblotting using anti-FIP200, anti-ULK1, and anti-FLAG antibodies. (E) Relative amounts of ULK1 in (D) were normalized with β-actin and calculated. Solid bars indicate the means, and dots indicate the data from three independent experiments. Differences were statistically analyzed using Tukey’s multiple comparisons test.
-
Figure 2—source data 1
PDF file containing original western blots for Figure 2D.
- https://cdn.elifesciences.org/articles/101531/elife-101531-fig2-data1-v1.pdf
-
Figure 2—source data 2
Original files for western blot analysis displayed in Figure 2D.
- https://cdn.elifesciences.org/articles/101531/elife-101531-fig2-data2-v1.zip
-
Figure 2—source data 3
Values used for preparation of the graph in Figure 2E.
- https://cdn.elifesciences.org/articles/101531/elife-101531-fig2-data3-v1.xlsx
Figure 3 with 1 supplement
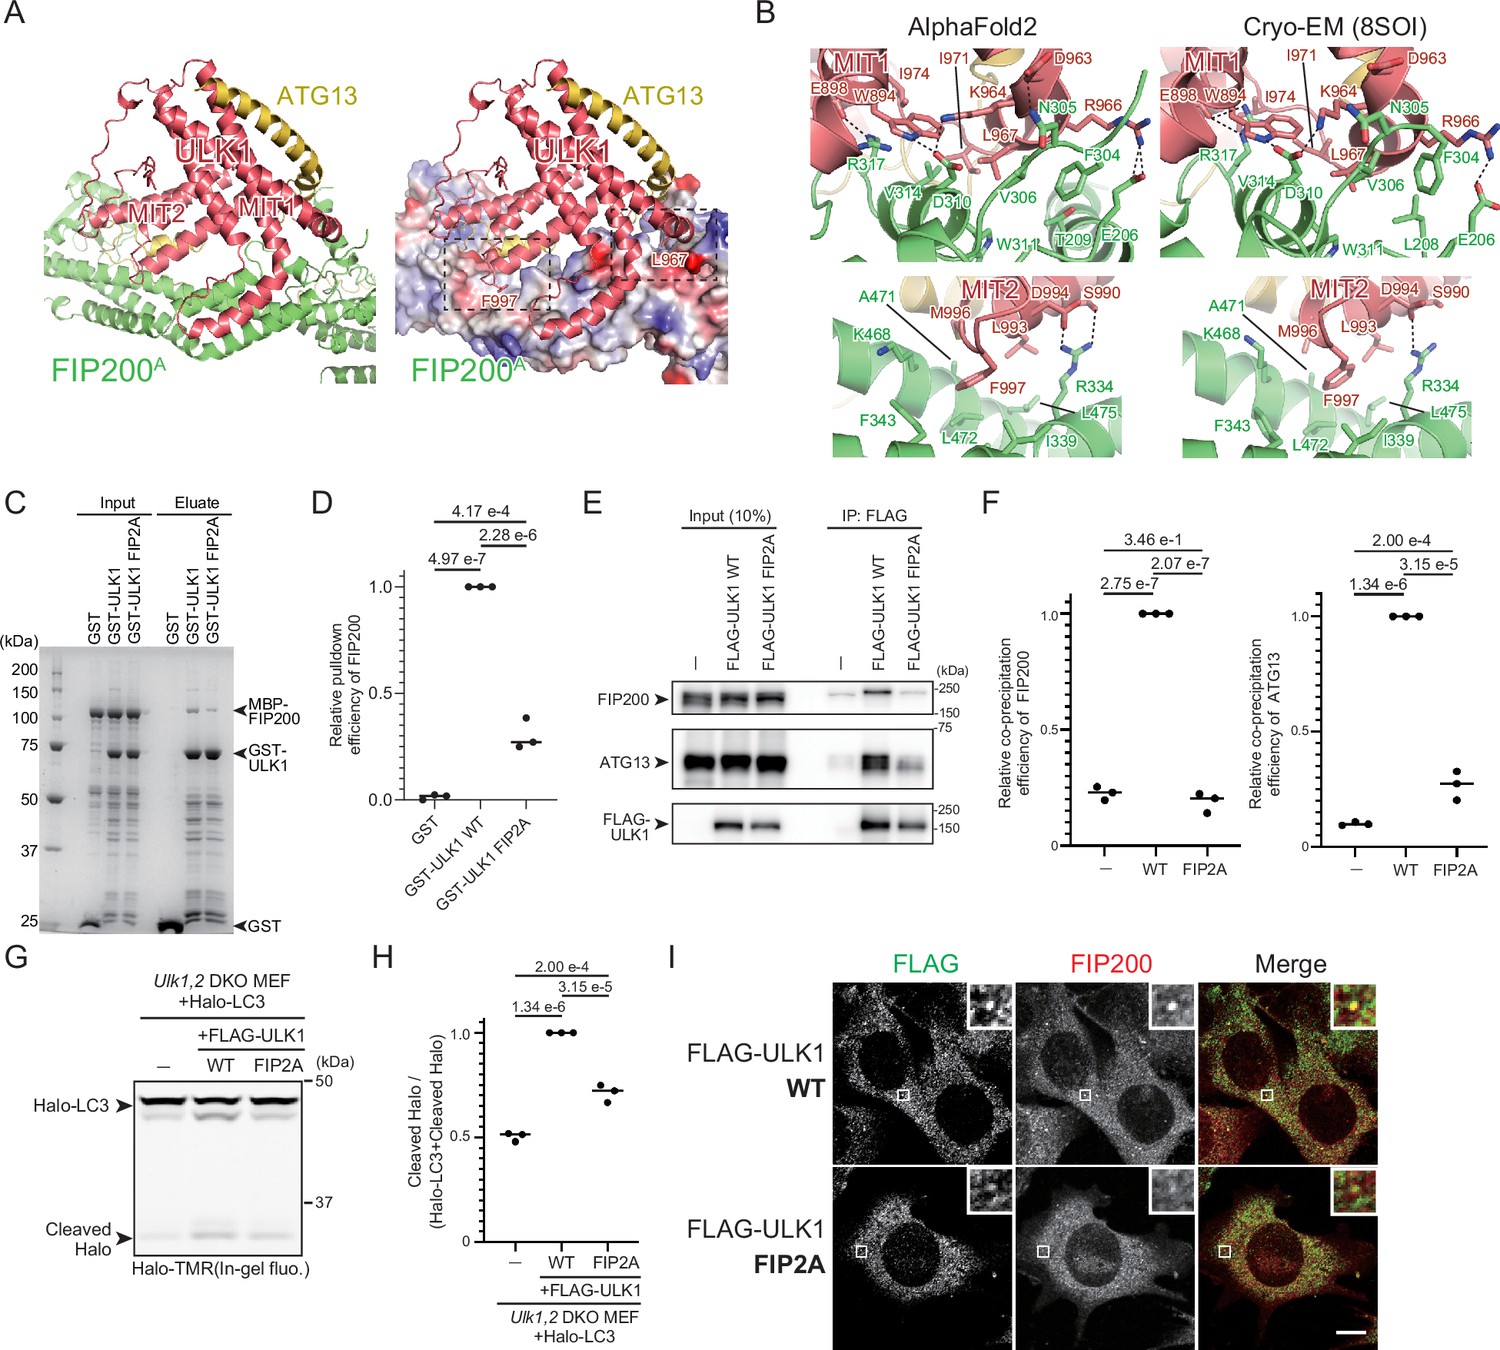
Structural basis of the ULK1–FIP200 interaction.
(A) Structure of the ULK1–FIP200 moiety of the ULK1–ATG13–FIP200 core complex in Figure 1B. The right panel represents the surface model of FIP200 with coloring based on the electrostatic potentials (blue and red indicate positive and negative potentials, respectively). Dotted squares indicate the regions displayed in (B). (B) Close-up view of the interactions between ULK1MIT1 and FIP200 (top) and between ULK1MIT2 and FIP200 (bottom). Left and right indicate AlphaFold2 and cryo-EM (PDB 8SOI) models. (C) In vitro pull-down assay between GST-ULK1 (636–1050 aa) WT or FIP2A mutant with MBP-FIP200 (1–634 aa). (D) Relative amounts of precipitated MBP-FIP200 in (C) were calculated. Solid bars indicate the means, and dots indicate the data from three independent experiments. Differences were statistically analyzed using Tukey’s multiple comparisons test. (E) Effect of the ULK1 FIP2A mutation on the FIP200 interaction in vivo. Ulk1,2 DKO mouse embryonic fibroblasts (MEFs) stably expressing FLAG-tagged ULK1 WT or FIP2A mutant were immunoprecipitated with an anti-FLAG antibody and detected with anti-FIP200, anti-ATG13, and anti-FLAG antibodies. (F) Relative amounts of precipitated FIP200 (left) and ATG13 (right) in (E) were calculated. Solid bars indicate the means, and dots indicate the data from three independent experiments. Differences were statistically analyzed using Tukey’s multiple comparisons test. (G) Halo-LC3 processing assay of ULK1 FIP2A-expressing cells. Ulk1,2 DKO MEFs stably expressing Halo-LC3 and FLAG-tagged ULK1 WT or FIP2A mutant were labeled for 15 min with 100 nm tetramethylrhodamine (TMR)-conjugated Halo ligand and incubated in starvation medium for 1 hr. Cell lysates were subjected to in-gel fluorescence detection. (H) Halo processing rate in (G). The band intensity of processed Halo and Halo-LC3 in each cell line was quantified, and the relative cleavage rate was calculated as FLAG-ULK1 WT-expressing cells as 1. Solid bars indicate the means, and dots indicate the data from three independent experiments. Data were statistically analyzed using Tukey’s multiple comparisons test. (I) Colocalization of FLAG-ULK1 WT or FIP2A mutant with FIP200. Ulk1,2 DKO MEFs stably expressing FLAG-tagged ULK1 WT or FIP2A mutant were immunostained with anti-FLAG and anti-FIP200 antibodies. Scale bar, 10 μm.
-
Figure 3—source data 1
PDF file containing original western blots or SDS–PAGE for Figure 3C, E, G.
- https://cdn.elifesciences.org/articles/101531/elife-101531-fig3-data1-v1.pdf
-
Figure 3—source data 2
Original files for western blot or SDS–PAGE analysis displayed in Figure 3C, E, G.
- https://cdn.elifesciences.org/articles/101531/elife-101531-fig3-data2-v1.zip
-
Figure 3—source data 3
Values used for preparation of the graph in Figure 3D, F, H.
- https://cdn.elifesciences.org/articles/101531/elife-101531-fig3-data3-v1.xlsx
Figure 3—figure supplement 1

Isothermal titration calorimetry (ITC) analysis between ULK1 and ATG13.
ITC results obtained by titration of MBP-ULK1 (636–1050 aa) FIP2A mutant into a solution of WT MBP-ATG13 (363–517 aa). Although the KD value for the ULK2A mutant was not determined precisely; these data indicate that the mutant retains substantial affinity for ATG13.
Figure 4 with 1 supplement
ATG13–ULK1 and ATG13–FIP200 interactions complement each other in autophagy function.
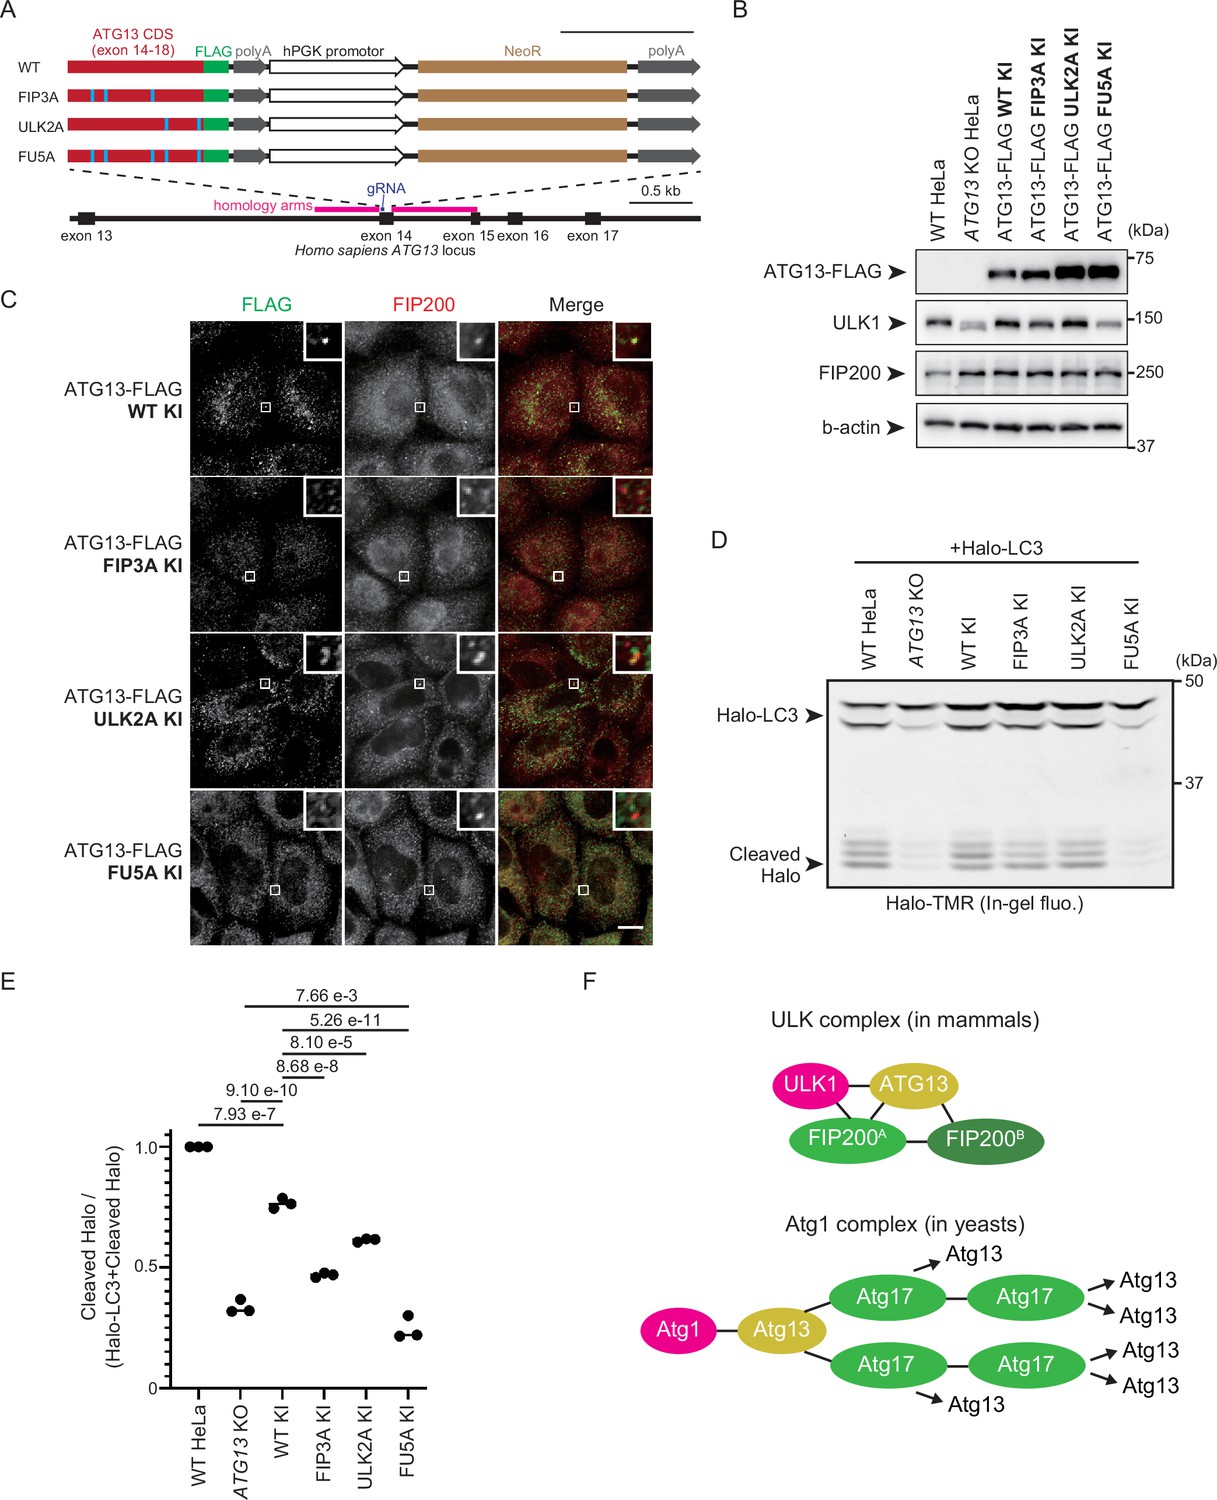
(A) Schematic representation of the CRISPR–Cas9-mediated KI strategy of ATG13 mutations with FLAG tag. The C-terminally FLAG-tagged coding sequence after exon 14 of ATG13 with or without FIP3A, ULK2A, or FU5A mutations were knocked in exon 14 of the Homo sapiens ATG13 locus. As the KI cassette expresses NeoR under the hPGK1 promoter, clones that were successfully knocked in were selected by G418. Cas9-gRNA-targeted sites in the exon 14 of H. sapiens ATG13 locus are displayed in dark blue. The homology arm for KI is presented in magenta, and the ATG13 CDS and mutations in red and cyan, respectively. NeoR is displayed in brown. Scale bar, 0.5 kilobase pair (kb). (B) Immunoblot of ATG13-FLAG KI cell lines. WT, ATG13 KO, and indicated KI HeLa cells were lysed, and indicated proteins were detected by immunoblotting using anti-FIP200, anti-ULK1, and anti-FLAG antibodies. (C) Colocalization of endogenous levels of ATG13-FLAG mutants with FIP200. Indicated KI cell lines were cultured in the starvation medium for 1 hr and immunostained with anti-FLAG and anti-FIP200 antibodies. Scale bar, 10 μm. (D) Halo-LC3 processing assay of ATG13-FLAG KI cell lines. WT, ATG13 KO and KI HeLa cell lines were labeled for 15 min with 100 nm tetramethylrhodamine (TMR)-conjugated Halo ligand and incubated in starvation medium for 1 hr. Cell lysates were subjected to in-gel fluorescence detection. (E) Halo processing rate in (D). The band intensity of processed Halo and Halo-LC3 in each cell line was quantified, and the relative cleavage rate was calculated as WT HeLa cells as 1. Solid bars indicate the means, and dots indicate the data from three independent experiments. Data were statistically analyzed using Tukey’s multiple comparisons test. (F) Schematic depiction of the difference between the mammalian ULK complex and the yeast Atg1 complex. Mammalian ATG13 binds to two FIP200s within the same FIP200 dimer, contributing to the stability of one ULK complex. Conversely, budding yeast Atg13 binds to two Atg17s within a different Atg17 dimer, allowing for endlessly repeated Atg13–Atg17 interactions. ATG101 in the ULK complex and Atg31-29 in the Atg1 complex are omitted for simplicity. ATG13/Atg13 is shown in yellow, ULK1/Atg1 in magenta, and FIP200/Atg17 in green. Black lines represent interactions.
-
Figure 4—source data 1
PDF file containing original western blots for Figure 4B, D.
- https://cdn.elifesciences.org/articles/101531/elife-101531-fig4-data1-v1.pdf
-
Figure 4—source data 2
Original files for western blot analysis displayed in Figure 4B, D.
- https://cdn.elifesciences.org/articles/101531/elife-101531-fig4-data2-v1.zip
-
Figure 4—source data 3
Values used for preparation of the graph in Figure 4E.
- https://cdn.elifesciences.org/articles/101531/elife-101531-fig4-data3-v1.xlsx
Figure 4—figure supplement 1
Stable overexpression of ATG13 results in 10-fold higher protein expression than the endogenous version.
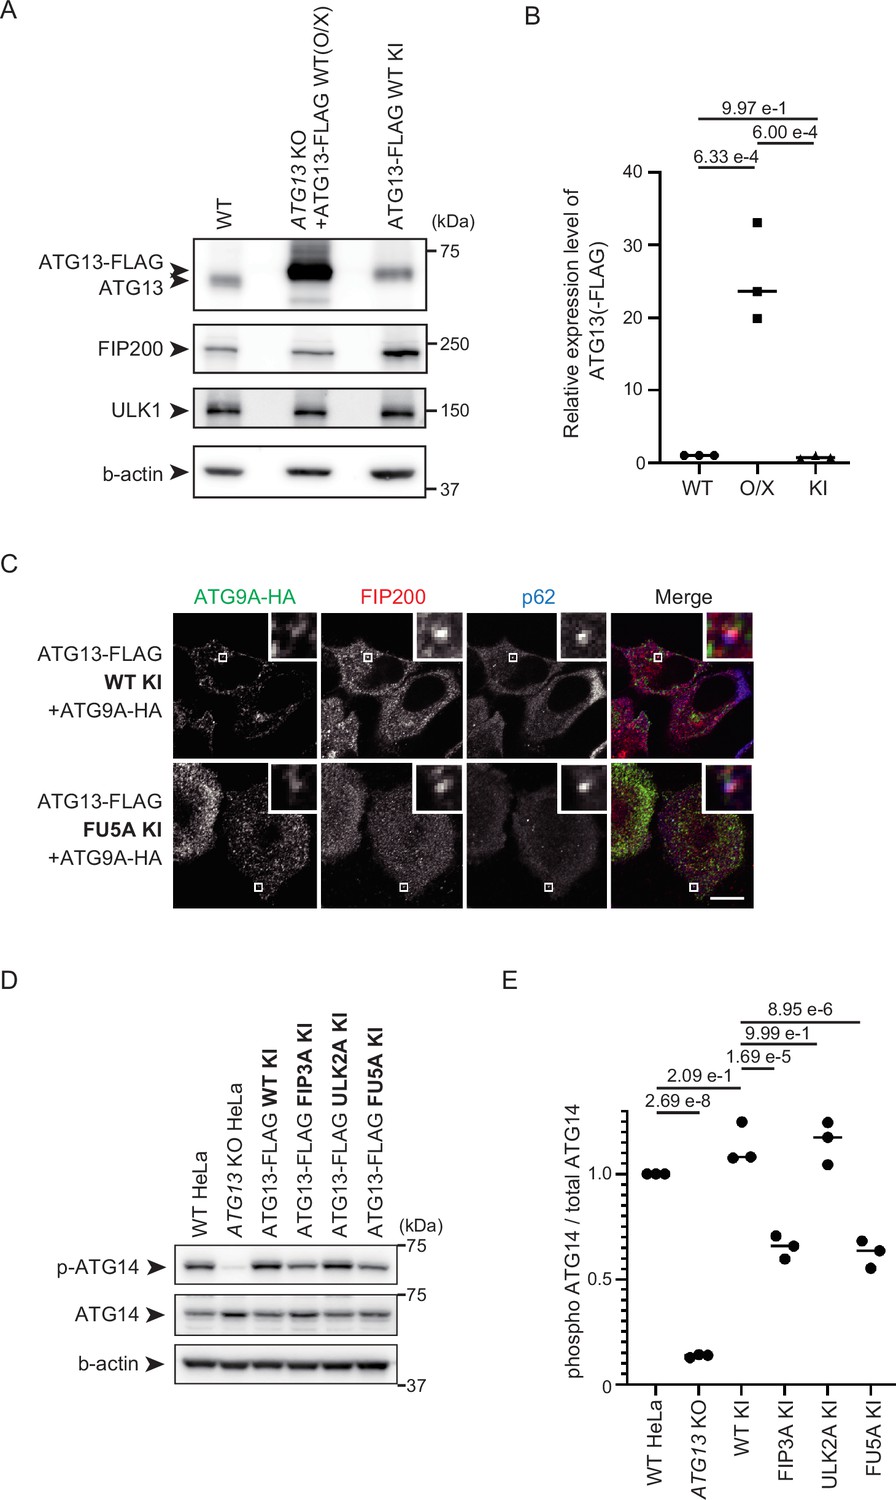
(A) Comparison of ATG13 expression level. WT, ATG13 KO stably expressing ATG13-FLAG, and ATG13-FLAG KI HeLa cells were lysed, and indicated proteins were detected by immunoblotting using anti-ATG13, anti-FIP200, anti-ULK1, and anti-β-actin antibodies. (B) Relative amounts of ATG13 in (A) were calculated as WT HeLa cells as 1. Solid bars indicate the means, and dots indicate the data from three independent experiments. Differences were statistically analyzed using Tukey’s multiple comparisons test. (C) Colocalization of ATG9A and FIP200 in ATG13-FLAG KI cells. Indicated KI cell lines expressing ATG9A-HA were cultured in the starvation medium for 1 hr and immunostained with anti-FLAG, anti-FIP200, and anti-p62 antibodies. Scale bar, 10 μm. (D) ULK1-dependent phosphorylation of ATG14 in ATG13-FLAG KI cell lines. WT, ATG13 KO and KI HeLa cell lines cultured in the starvation medium for 1 hr. Indicated proteins were detected by immunoblotting using anti-ATG14 phospho-S29, anti-ATG14, and anti-β-actin antibodies. (E) ATG14 phosphorylation rate in (D). The band intensity of p-ATG14 and ATG14 in each cell line was quantified, and the phosphorylation rate was calculated as WT HeLa cells as 1. Solid bars indicate the means, and dots indicate the data from three independent experiments. Data were statistically analyzed using Tukey’ s multiple comparisons test.
-
Figure 4—figure supplement 1—source data 1
PDF file containing original western blots for Figure 4—figure supplement 1A, D.
- https://cdn.elifesciences.org/articles/101531/elife-101531-fig4-figsupp1-data1-v1.pdf
-
Figure 4—figure supplement 1—source data 2
Original files for western blot analysis displayed in Figure 4—figure supplement 1A, D.
- https://cdn.elifesciences.org/articles/101531/elife-101531-fig4-figsupp1-data2-v1.zip
-
Figure 4—figure supplement 1—source data 3
Values used for preparation of the graph in Figure 4—figure supplement 1B, E.
- https://cdn.elifesciences.org/articles/101531/elife-101531-fig4-figsupp1-data3-v1.xlsx
Tables
Key resources table
| Reagent type (species) or resource | Designation | Source or reference | Identifiers | Additional information |
|---|---|---|---|---|
| Gene (Homo sapiens) | ULK1 | NCBI Reference Sequence | NM_003565.4 | |
| Gene (H. sapiens) | ATG13 (isoform c) | Hosokawa et al., 2009 | NM_001142673.3 | |
| Gene (H. sapiens) | RB1CC1/FIP200 (isoform 2) | Hara et al., 2008 | NM_001083617.2 | |
| Gene (H. sapiens) | ATG9A | Kishi-Itakura et al., 2014 | NM_001077198.3 | |
| Gene (Rattus norvegicus) | MAP1LC3B | Yim et al., 2022 | NM_022867.2 | |
| Strain (Escherichia coli) | BL21 (DE3) | Novagen | 69450 | |
| Cell line (H. sapiens) | HEK293T | RIKEN | RCB2202 | |
| Cell line (H. sapiens) | HeLa | RIKEN | RCB0007 | |
| Cell line (M. musculus) | Ulk1 Ulk2 DKO MEF | Cheong et al., 2011 | Kindly provided by Craig B, Thompson | Established from C57BL/6 mice |
| Cell line (H. sapiens) | ATG13 KO HeLa | Hama et al., 2023 | WM1 | |
| Cell line (H. sapiens) | ATG13-3xFLAG KI HeLa | This study | 13FWTKI14 | |
| Cell line (H. sapiens) | ATG13-3xFLAG FIP3A KI HeLa | This study | 13FF3AKI12 | |
| Cell line (H. sapiens) | ATG13-3xFLAG ULK2A KI HeLa | This study | 13FU2AKI12 | |
| Cell line (H. sapiens) | ATG13-3xFLAG FU5A KI HeLa | This study | 13FFU5AKI24 | |
| Antibody | Rabbit polyclonal anti-FIP200 | Proteintech | 17250-1-AP | 1:1000 for WB, 1:500 for IF |
| Antibody | Rabbit monoclonal anti-ATG13 | Cell Signaling Technology | #13273 | 1:1000 for WB |
| Antibody | Rabbit polyclonal anti-ULK1 | Cell Signaling Technology | #8054S | 1:500 for WB |
| Antibody | Rabbit polyclonal anti-ATG14 p-Ser29 | Cell Signaling Technology | #92340 | 1:1000 for WB |
| Antibody | Rabbit polyclonal anti-ATG14 | Proteintech | 24412-1-AP | 1:1000 for WB |
| Antibody | Guinea pig polyclonal anti-p62 | PROGEN | GP62-C | 1:500 for IF |
| Antibody | Mouse monoclonal anti-FLAG | MBL | M185-7 | 1:1000 for WB, 1:500 for IF |
| Antibody | Mouse monoclonal anti-HA | MBL | M180-3 | 1:500 for IF |
| Antibody | Mouse monoclonal anti-β-actin | Sigma-Aldrich | A2228 | 1:10,000 for WB |
| Antibody | HRP-conjugated mouse monoclonal anti-DDDDK tag | MBL | M185-7 | 1:2000 for WB |
| Antibody | HRP-conjugated mouse monoclonal anti-rabbit IgG | Jackson ImmunoResearch | 111-035-144 | 1:10,000 for WB |
| Antibody | HRP-conjugated mouse monoclonal anti-mouse IgG | Jackson ImmunoResearch | 111-035-003 | 1:10,000 for WB |
| Antibody | Alexa Fluor 488-conjugated polyclonal anti-mouse IgG | Thermo Fisher Scientific | A-11029 | 1:2000 for IF |
| Antibody | Alexa Fluor 555-conjugated polyclonal anti-rabbit IgG | Thermo Fisher Scientific | A-31572 | 1:2000 for IF |
| Antibody | Alexa Fluor 647-conjugated polyclonal anti-pig IgG | Thermo Fisher Scientific | A-21450 | 1:2000 for IF |
| Recombinant DNA reagent | pET15b | Novagen | 69661 | |
| Recombinant DNA reagent | pGEX-6P-1 | Cytiva | 28954648 | Figure 3C |
| Recombinant DNA reagent | pET15b-MBP-ULK1 (636–1050 aa) | This study | Figure 2C | |
| Recombinant DNA reagent | pET15b-MBP-ULK1FIP2A (636–1050 aa) | This study | Figure 3—figure supplement 1 | |
| Recombinant DNA reagent | pET15b-MBP-ATG13 (363–517 aa) | This study | Figures 1D, 2C, Figure 1—figure supplement 2 | |
| Recombinant DNA reagent | pET15b-MBP-ATG13FIP3A (363–517 aa) | This study | Figure 1D | |
| Recombinant DNA reagent | pET15b-MBP-ATG13ULK2A (363–517 aa) | This study | Figure 2C | |
| Recombinant DNA reagent | pET15b-MBP-FIP200 (1–634 aa) | This study | Figures 1D and 3C | |
| Recombinant DNA reagent | pGEX6p-1-GST-ULK1 (636–1050 aa) | This study | Figure 3C | |
| Recombinant DNA reagent | pGEX6p-1-GST-ULK1FIP2A (636–1050 aa) | This study | Figure 3C | |
| Recombinant DNA reagent | pMRX-IP-3xFLAG-ULK1 | This study | YHE134 | Figure 3E, G |
| Recombinant DNA reagent | pMRX-IP-3xFLAG-ULK1FIP2A | This study | YHE141 | Figure 3E, G |
| Recombinant DNA reagent | pMRX-IP-ATG13-3xFLAG | This study | YHE103 | Figures 1D, 2D, Figure 4—figure supplement 1A |
| Recombinant DNA reagent | pMRX-IP-ATG13FIP3A-3xFLAG | This study | YHE116 | Figure 1D |
| Recombinant DNA reagent | pMRX-IP-ATG13ULK2A-3xFLAG | This study | YHE144 | Figure 2D |
| Recombinant DNA reagent | pMRX-IP-ATG13FU5A-3xFLAG | This study | YHE180 | Figure 4 |
| Recombinant DNA reagent | pMRX-IP-ATG9A-3xHA | This study | YHE218 | Figure 4—figure supplement 1C |
| Recombinant DNA reagent | pCG-gag-pol | Kindly provided by Teruhiko Yasui | For packaging retrovirus for stable gene expression | |
| Recombinant DNA reagent | pCG-VSV-G | Kindly provided by Teruhiko Yasui | For packaging retrovirus for stable gene expression | |
| Recombinant DNA reagent | PX458-gATG13 exon14 | This study | YHC49 | Figure 4 |
| Recombinant DNA reagent | pKnockIn | This study | YHC3 | Figure 4 |
| Recombinant DNA reagent | pKnockIn-ATG13 exon14-ATG13 (347–517 aa)–3xFLAG | This study | YHC50 | Figure 4 |
| Recombinant DNA reagent | pKnockIn-ATG13 exon14-ATG13FIP3A (347–517 aa)–3xFLAG | This study | YHC51 | Figure 4 |
| Recombinant DNA reagent | pKnockIn-ATG13 exon14-ATG13ULK2A (347–517 aa)–3xFLAG | This study | YHC52 | Figure 4 |
| Recombinant DNA reagent | pKnockIn-ATG13 exon14-ATG13FU5A (347–517 aa)–3xFLAG | This study | YHC53 | Figure 4 |
| Peptide, recombinant protein | PrimeSTAR Max DNA Polymerase | Takara Bio | R045A | |
| Peptide, recombinant protein | NEBuilder HiFi DNA Assembly Master Mix | New England Biolabs | E2621X | |
| Chemical compound, drug | FuGENE HD | Promega | VPE2311 | |
| Chemical compound, drug | HaloTag TMR Ligand | Promega | G8251 | |
| Chemical compound, drug | Digitonin | Sigma-Aldrich | D141 | |
| Chemical compound, drug | Polybrane | Sigma-Aldrich | H9268 | |
| Chemical compound, drug | Puromycin | Sigma-Aldrich | P8833 | |
| Chemical compound, drug | Blasticidin | Fujifilm Wako Pure Chemical Corporation | 022-18713 | |
| Chemical compound, drug | G-418 | Fujifilm Wako Pure Chemical Corporation | 074-06801 | |
| Chemical compound, drug | Anti-FLAG M2 affinity gel | Sigma-Aldrich | A2220 | |
| Chemical compound, drug | 4% paraformaldehyde | Fujifilm Wako Pure Chemical Corporation | 163-20145 | |
| Chemical compound, drug | Amylose Resin High Flow | New England Biolabs | E8022L | |
| Chemical compound, drug | Bio-Scale Mini Bio-Gel P-6 desalting column | Bio-Rad Laboratories | 7325304 | |
| Chemical compound, drug | COSMOGEL GST-Accept | NACALAI TESQUE | 09277-14 | |
| Chemical compound, drug | HiLoad 26/600 Superdex 200 pg | Cytiva | 28989336 | |
| Chemical compound, drug | One Step CBB | BIO CRAFT | CBB-1000 | |
| Software, algorithm | AlphaFold2 v2.3 | Jumper et al., 2021 | Structural prediction was done using AlphaFold2 v2.3 | |
| Software, algorithm | MicroCal PEAQ-ITC analysis software | Malvern Panalytical Ltd | Integration and fitting of ITC were done using MicroCal PEAQ-ITC analysis software | |
| Software, algorithm | Fiji-ImageJ | https://imagej.net/Fiji/Downloads | Image analysis was done using Fiji-ImageJ and plugins | |
| Software, algorithm | Illustrator | Adobe | Images were mounted using these softwares | |
| Software, algorithm | GraphPad Prism 9 | GraphPad Prism | Graphs and statistical tests were done using GraphPad Prism |
Additional files
Download links
A two-part list of links to download the article, or parts of the article, in various formats.
Downloads (link to download the article as PDF)
Open citations (links to open the citations from this article in various online reference manager services)
Cite this article (links to download the citations from this article in formats compatible with various reference manager tools)
The triad interaction of ULK1, ATG13, and FIP200 is required for ULK complex formation and autophagy
eLife 13:RP101531.
https://doi.org/10.7554/eLife.101531.3


