Efficacy and safety of neoadjuvant stereotactic body radiation therapy plus dalpiciclib and exemestane for hormone receptor-positive, HER2-negative breast cancer: A prospective pilot study
- Department of Oncology, Shengjing Hospital of China Medical University, China
- Cancer Stem Cell and Translational Medicine Laboratory, Shengjing Hospital of China Medical University, China
- Innovative Cancer Drug Research and Development Engineering Center of Liaoning Province, China
- Department of Gastrointestinal Surgery, Yantai Affiliated Hospital of Binzhou Medical University, China
- Department of Pathology, the First Affiliated Hospital and College of Basic Medical Sciences of China Medical University, China
- Jiangsu Hengrui Pharmaceuticals, China
- School of Bioengineering, Dalian University of Technology, China
Figures
Figure 1
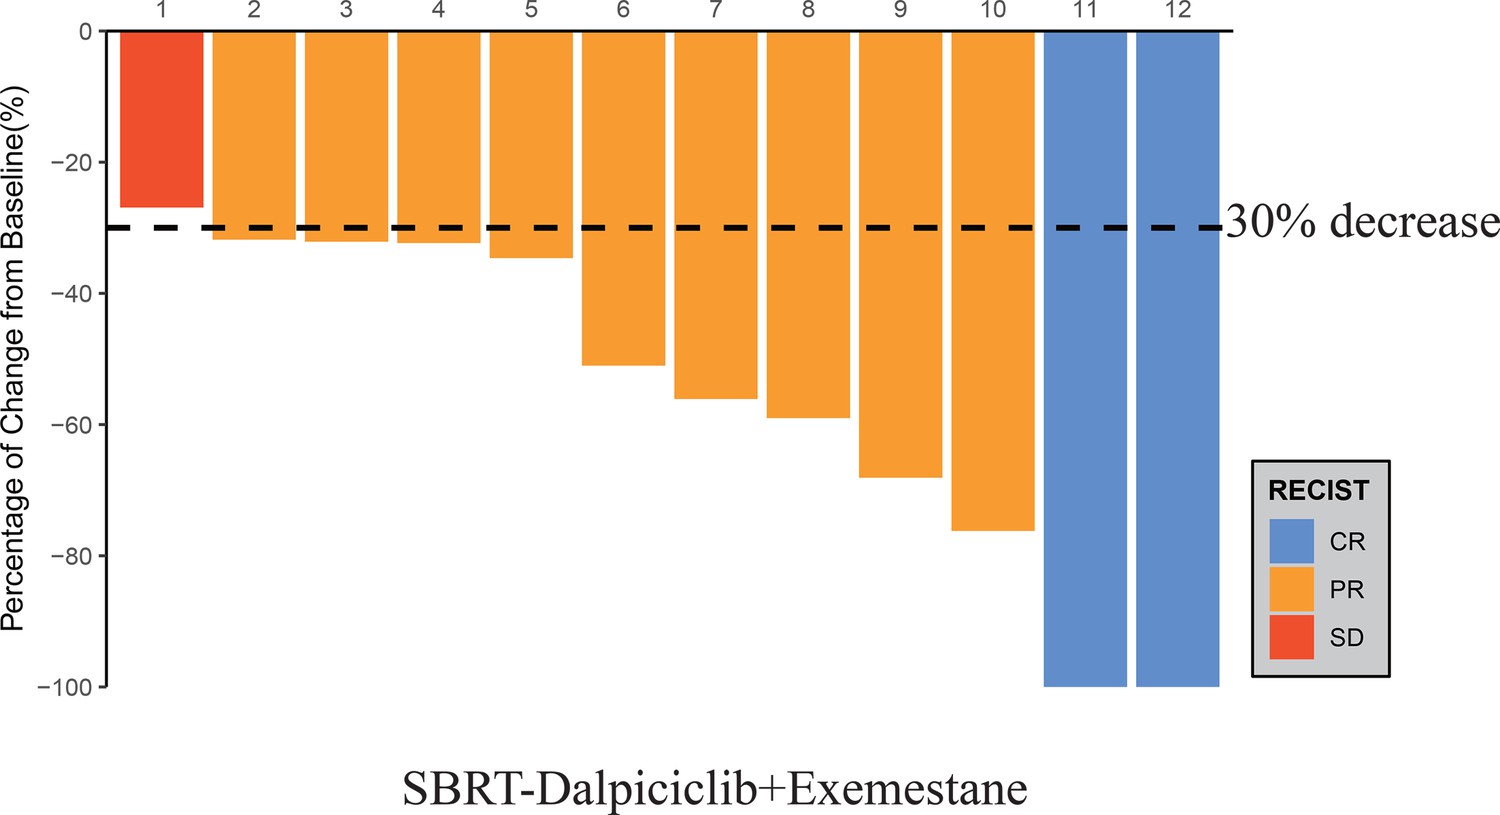
Waterfall plot of best reduction in tumor measurement from baseline.
-
Figure 1—source data 1
Source data for waterfall plot of best reduction in tumor measurement from baseline.
- https://cdn.elifesciences.org/articles/101583/elife-101583-fig1-data1-v1.xlsx
Figure 2
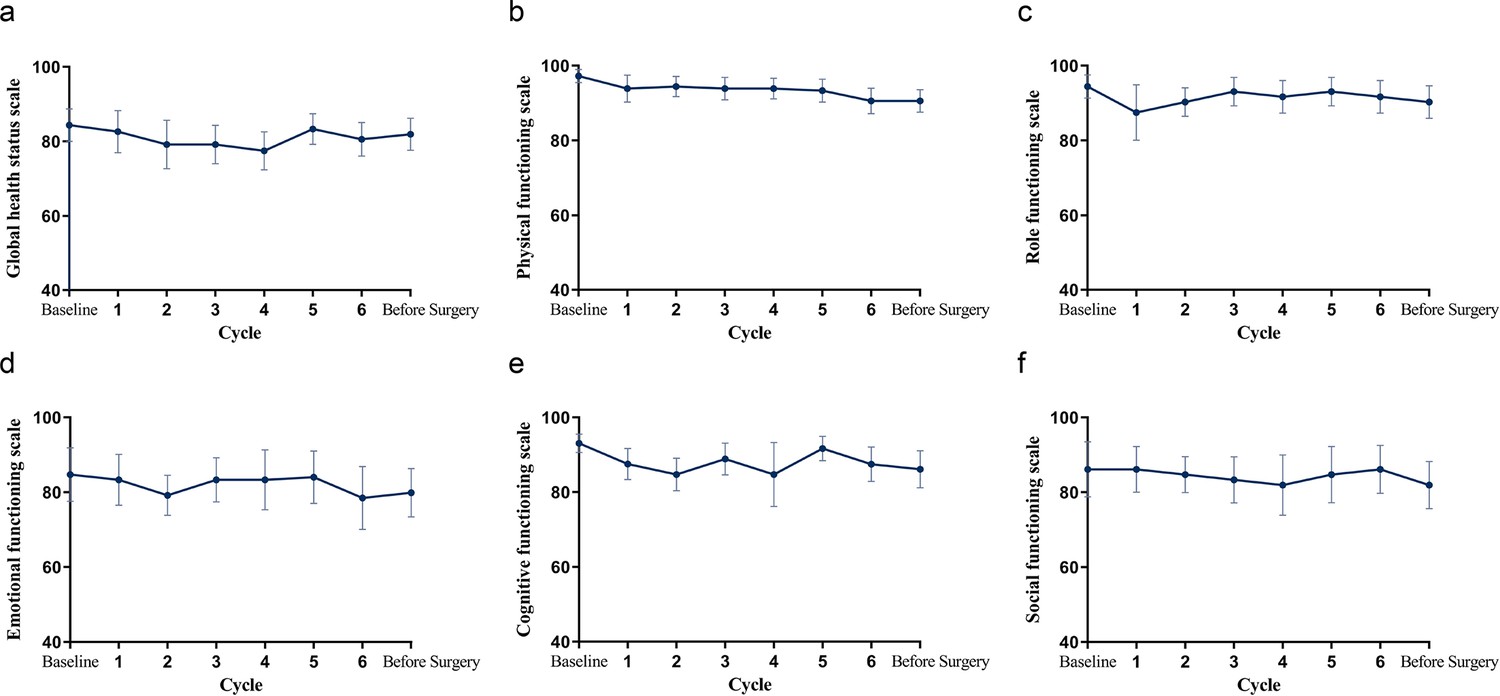
Mean change from baseline in QLQ-C30 over time.
(a) Global health status. (b–f) Physical, role, emotional, cognitive, and social functioning.
-
Figure 2—source data 1
Source data for mean change from baseline in QLQ-C30 over time.
- https://cdn.elifesciences.org/articles/101583/elife-101583-fig2-data1-v1.xlsx
Figure 3
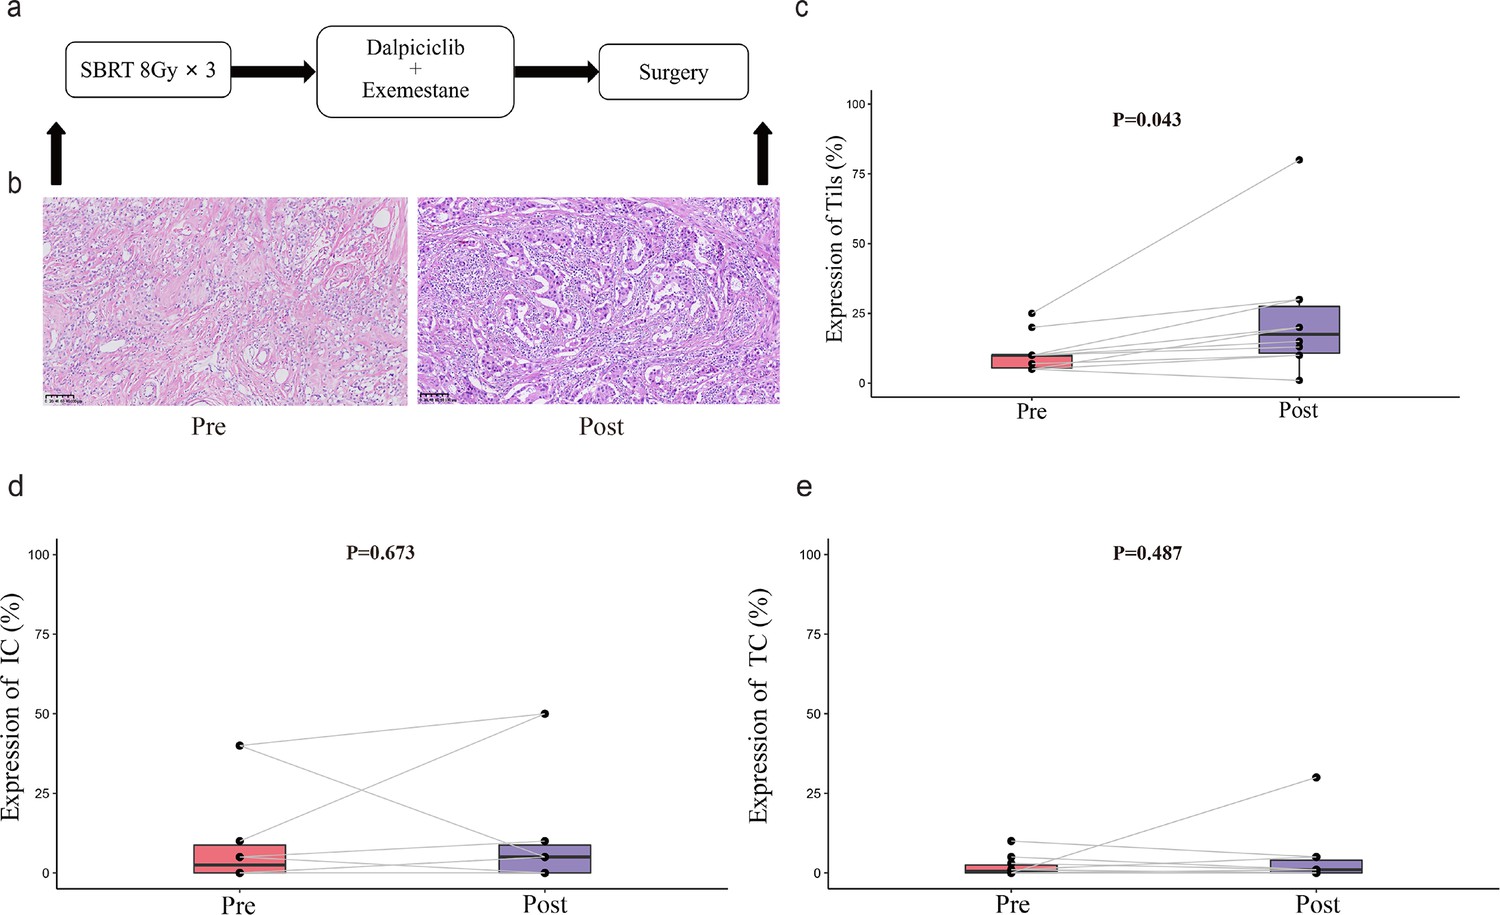
TILs and PD-L1 changes before and after treatment.
(a) Study schema. (b) Representative TILs. Scale bar, 100 μM. (c–e) Percentage of TILs, PD-L1 expression in immune cell and tumor cell in paired specimens (n=10, pre- and post-treatment). Bars, boxes, and whiskers represent median, interquartile range, and range, respectively. Statistical analysis performed using paired t-test, statistical significance was defined as p<0.05.
-
Figure 3—source data 1
Source data for percentage of TILs in paired specimens.
- https://cdn.elifesciences.org/articles/101583/elife-101583-fig3-data1-v1.xlsx
-
Figure 3—source data 2
Source data for PD-L1 expression in immune cell in paired specimens.
- https://cdn.elifesciences.org/articles/101583/elife-101583-fig3-data2-v1.xlsx
-
Figure 3—source data 3
Source data for PD-L1 expression in tumor cell in paired specimens.
- https://cdn.elifesciences.org/articles/101583/elife-101583-fig3-data3-v1.xlsx
Appendix 1—figure 1
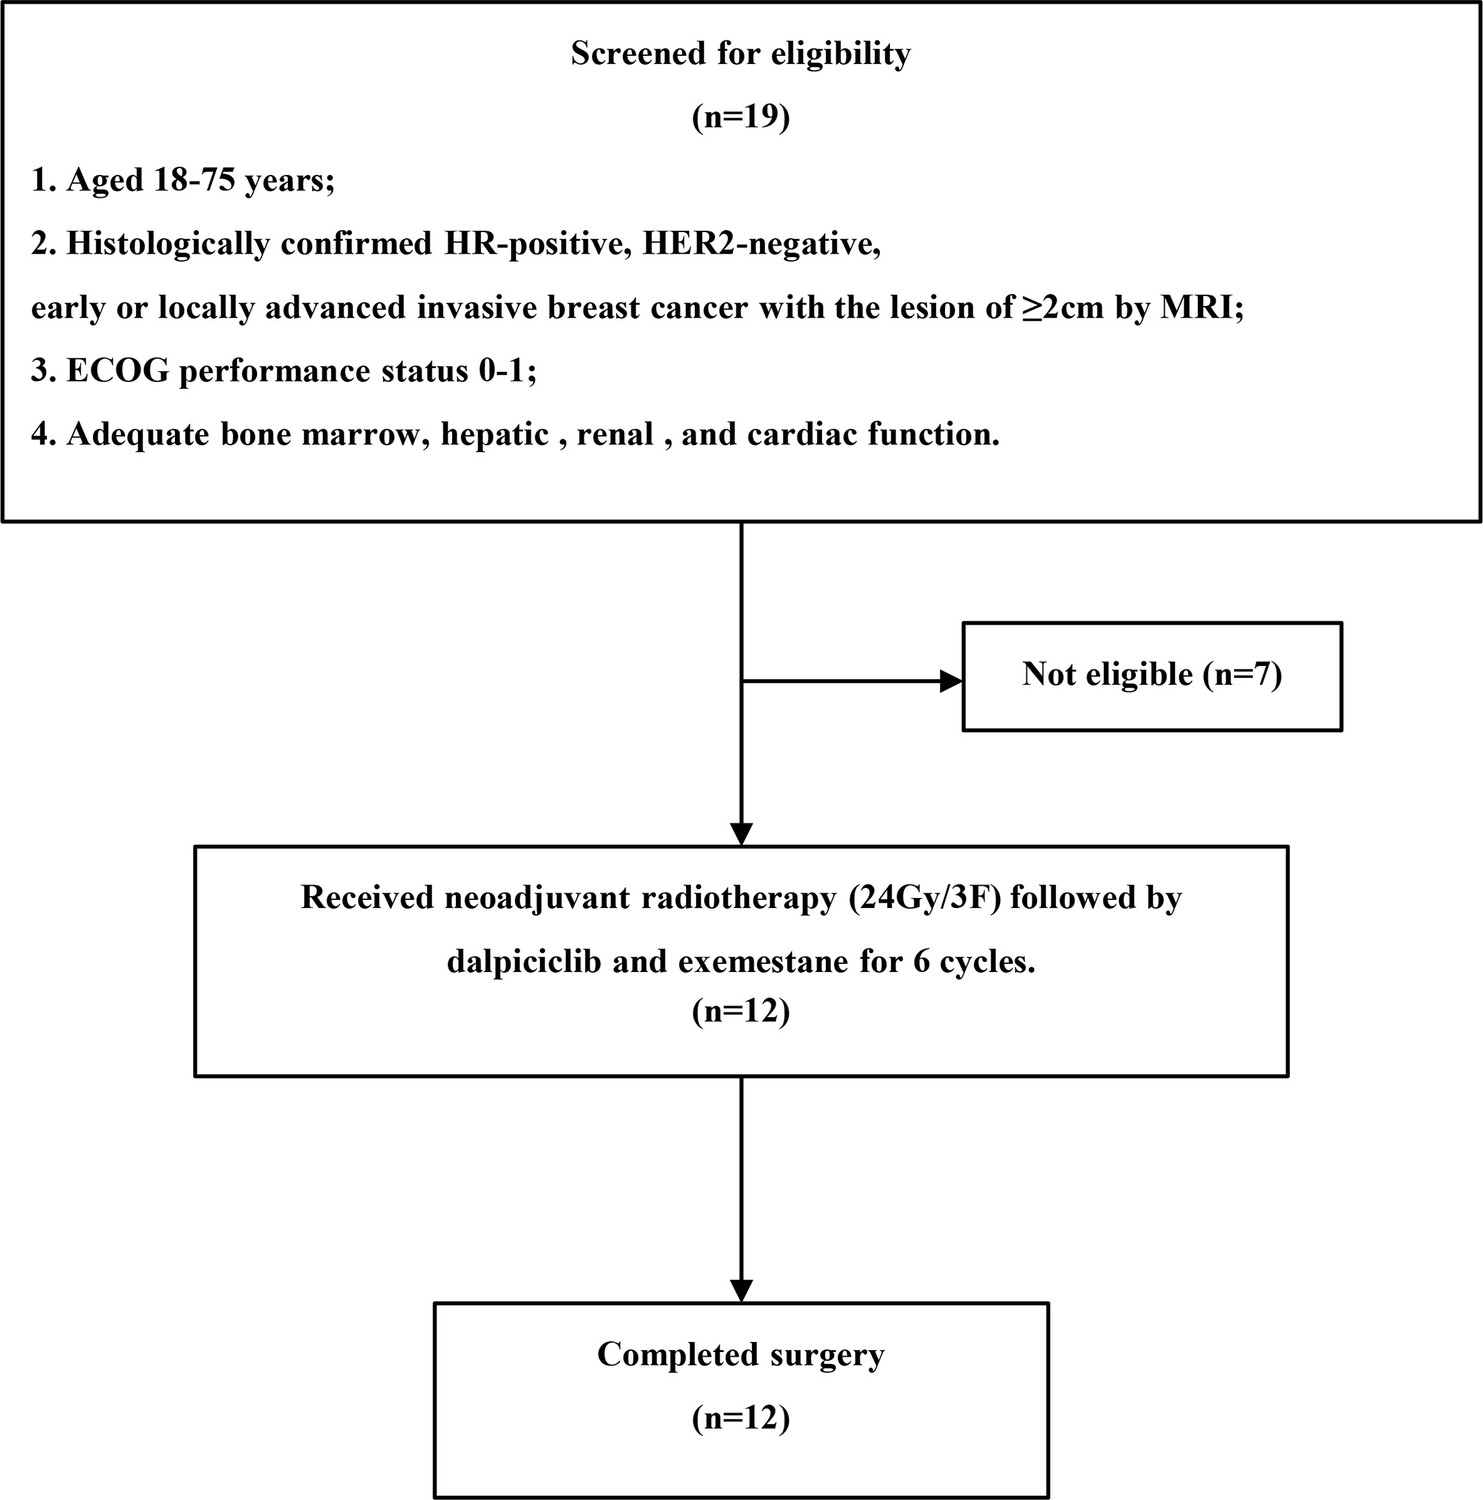
Flowchart of the trial.
Tables
Table 1
Baseline characteristics of the patients.
| Patients (n=12) | |
|---|---|
| Median age (range), years | 48.5 (36-56) |
| ≤50 | 6 (50.0%) |
| >50 | 6 (50.0%) |
| Menopausal status | |
| Premenopausal | 6 (50.0%) |
| Postmenopausal | 6 (50.0%) |
| Tumor size | |
| T2 | 11 (91.7%) |
| T3 | 1 (8.3%) |
| Lymph node status | |
| N0 | 5 (41.7%) |
| N1 | 2 (16.7%) |
| N2 | 5 (41.7%) |
| Clinical stage | |
| IIA | 4 (33.3%) |
| IIB | 3 (25.0%) |
| IIIA | 5 (41.7%) |
| Tumor grade | |
| II | 11 (91.7%) |
| III | 1 (8.3%) |
| ER expression | |
| >10% | 12 (100.0%) |
| PgR expression | |
| <20% | 3 (25.0%) |
| ≥20% | 9 (75.0%) |
| HER2 expression | |
| 0 | 7 (58.3%) |
| 1+ | 1 (8.3%) |
| 2+, FISH | 4 (33.3%) |
| Median baseline Ki67 (range), % | 35 (15–70) |
| ≤14% | 3 (25.0%) |
| >14% | 9 (75.0%) |
-
Data are n (%) or median (range).
-
ER: estrogen receptor; PgR: progesterone receptor; HER2: human epidermal growth factor receptor 2; FISH: fluorescence in situ hybridization.
Table 2
Pathological and clinical response (n=12).
| n (%) | |
|---|---|
| Total pathological complete response | 2 (16.7%) |
| Breast pathological complete response | 3 (25.0%) |
| Residual cancer burden score | |
| 0 | 2 (16.7%) |
| I | 0 |
| II | 6 (50.0%) |
| III | 4 (33.3%) |
| Radiological response | |
| Complete response | 2 (16.7%) |
| Partial response | 9 (75.0%) |
| Stable disease | 1 (8.3%) |
| Objective response rate | 11 (91.7%) |
| Preoperative endocrine prognostic index | |
| 0 | 2 (16.7%) |
| 1–3 | 0 |
| ≥4 | 10 (83.3%) |
-
Data are presented as n (%).
Table 3
Treatment-emergent adverse events (n=12).
| n (%) | |||
|---|---|---|---|
| Grade 1 or 2 | Grade 3 | Grade 4 | |
| Neutropenia | 3 (25.0%) | 8 (66.7%) | 0 |
| Leukopenia | 7 (58.3%) | 3 (25.0%) | 0 |
| Hot flushes | 6 (50.0%) | 0 | 0 |
| Lymphopenia | 6 (50.0%) | 0 | 0 |
| Insomnia | 4 (33.3%) | 0 | 0 |
| Alopecia | 4 (33.3%) | 0 | 0 |
| Anemia | 4 (33.3%) | 0 | 0 |
| Hyperuricemia | 4 (33.3%) | 0 | 0 |
| Blood urea increased | 4 (33.3%) | 0 | 0 |
| Rash | 3 (25.0%) | 0 | 0 |
| Thrombocytopenia | 3 (25.0%) | 0 | 0 |
| Hyperglycemia | 3 (25.0%) | 0 | 0 |
| Creatinine increased | 3 (25.0%) | 0 | 0 |
| Fatigue | 3 (25.0%) | 0 | 0 |
| Arthralgia | 2 (16.7%) | 0 | 0 |
| γ-glutamyl transferase increased | 2 (16.7%) | 0 | 0 |
| Hypocalcemia | 2 (16.7%) | 0 | 0 |
| Abnormal T wave of electrocardiogram | 2 (16.7%) | 0 | 0 |
| Hyponatremia | 2 (16.7%) | 0 | 0 |
| Lactate dehydrogenase increased | 2 (16.7%) | 0 | 0 |
| Diarrhea | 1 (8.3%) | 0 | 0 |
| Headache | 1 (8.3%) | 0 | 0 |
| Mucosal inflammation Constipation | 1 (8.3%) | 0 | 0 |
| Proteinuria | 1 (8.3%) | 0 | 0 |
| Hypertriglyceridemia | 1 (8.3%) | 0 | 0 |
| Alanine aminotransferase increased | 1 (8.3%) | 0 | 0 |
-
Data are presented as n (%).
Additional files
Download links
A two-part list of links to download the article, or parts of the article, in various formats.
Downloads (link to download the article as PDF)
Open citations (links to open the citations from this article in various online reference manager services)
Cite this article (links to download the citations from this article in formats compatible with various reference manager tools)
Efficacy and safety of neoadjuvant stereotactic body radiation therapy plus dalpiciclib and exemestane for hormone receptor-positive, HER2-negative breast cancer: A prospective pilot study
eLife 14:RP101583.
https://doi.org/10.7554/eLife.101583.3


