GPRC6A as a novel kokumi receptor responsible for enhanced taste preferences by ornithine
- Department of Nutrition, Faculty of Human Sciences, Kio University, Japan
- Department of Oral Anatomy and Developmental Biology, Osaka University Graduate School of Dentistry, Japan
- Department of Anatomy and Neuroscience, Graduate School of Medical Sciences, Nagoya City University, Japan
Figures
Figure 1
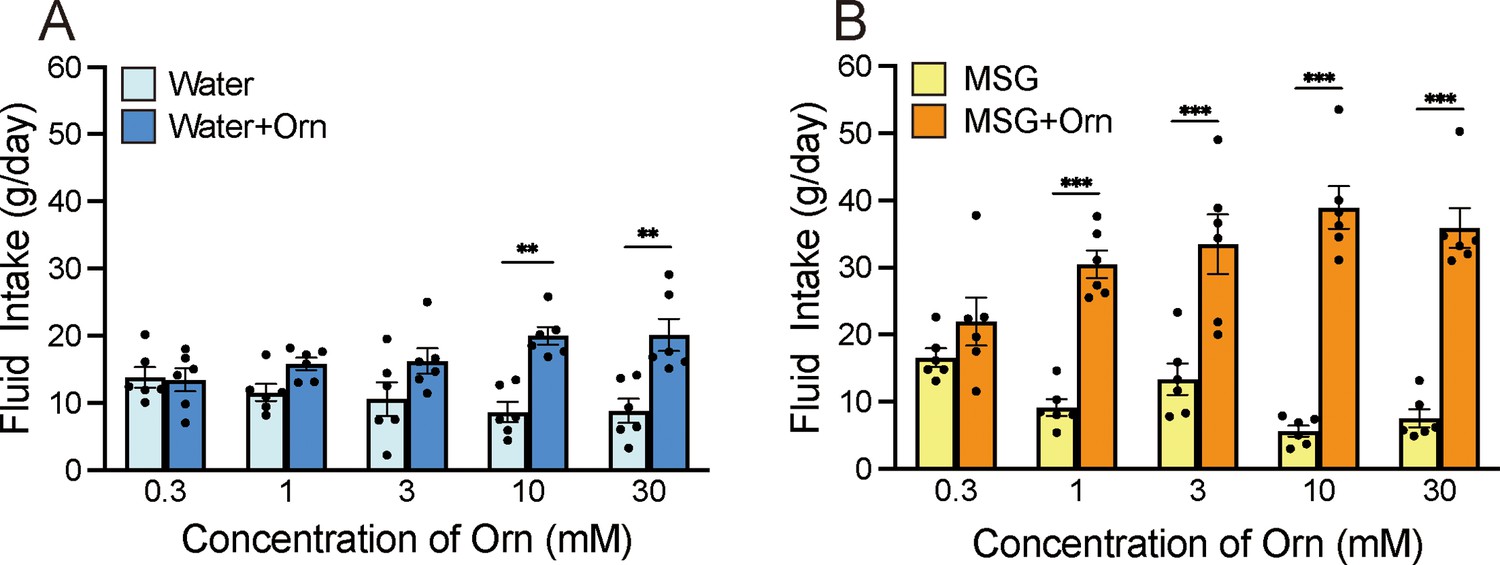
Additive effects of ornithine (Orn) at different concentrations.
(A) Water intake with and without five Orn concentrations. (B) Intake of 0.03 M MSG with and without Orn. Each value represents the mean ± SEM; n=6. **p<0.01, ***p<0.001 (Bonferroni correction). MSG, monosodium glutamate; SEM, standard error of the mean.
-
Figure 1—source data 1
Two-bottle preference test.
- https://cdn.elifesciences.org/articles/101629/elife-101629-fig1-data1-v1.xlsx
Figure 2 with 1 supplement

Additive effects of 1 mM ornithine (Orn) on fluid intake for eight different taste solutions.
Fluid intake with and without Orn is shown for IMP (A), MSG (B), MPG (C), Intralipos (D), sucrose (E), NaCl (F), citric acid (G), and QHCl (H). Each value represents the mean ± SEM; n=8. *p<0.05, **p<0.01, ***p<0.001 (Bonferroni correction). IMP, inosine monophosphate; MSG, monosodium glutamate; MPG, monopotassium phosphate; QHCl, quinine hydrochloride; SEM, standard error of the mean.
-
Figure 2—source data 1
Two-bottle preference test.
- https://cdn.elifesciences.org/articles/101629/elife-101629-fig2-data1-v1.xlsx
Figure 2—figure supplement 1

Effects of ornithine (L-ornithine, Orn) supplementation of low-sodium (0.7%) miso soup on three kokumi attributes in humans: intensity, mouthfulness, and persistence of taste.
The addition of three concentrations of Orn (1, 3, and 10 mM, labeled T-1, T-2, and T-3, respectively) increased these three attributes along with palatability in a dose-dependent manner. All values for the kokumi attributes and palatability were set to 0 for the control miso soup without Orn (C). Each value represents the mean ± SEM; n=22. *p<0.05, **p<0.01, ***p<0.001 (paired t-test, two-tailed, comparison between control and test stimuli). SEM, standard error of the mean.
-
Figure 2—figure supplement 1—source data 1
Human sensory test.
- https://cdn.elifesciences.org/articles/101629/elife-101629-fig2-figsupp1-data1-v1.xlsx
Figure 3 with 1 supplement
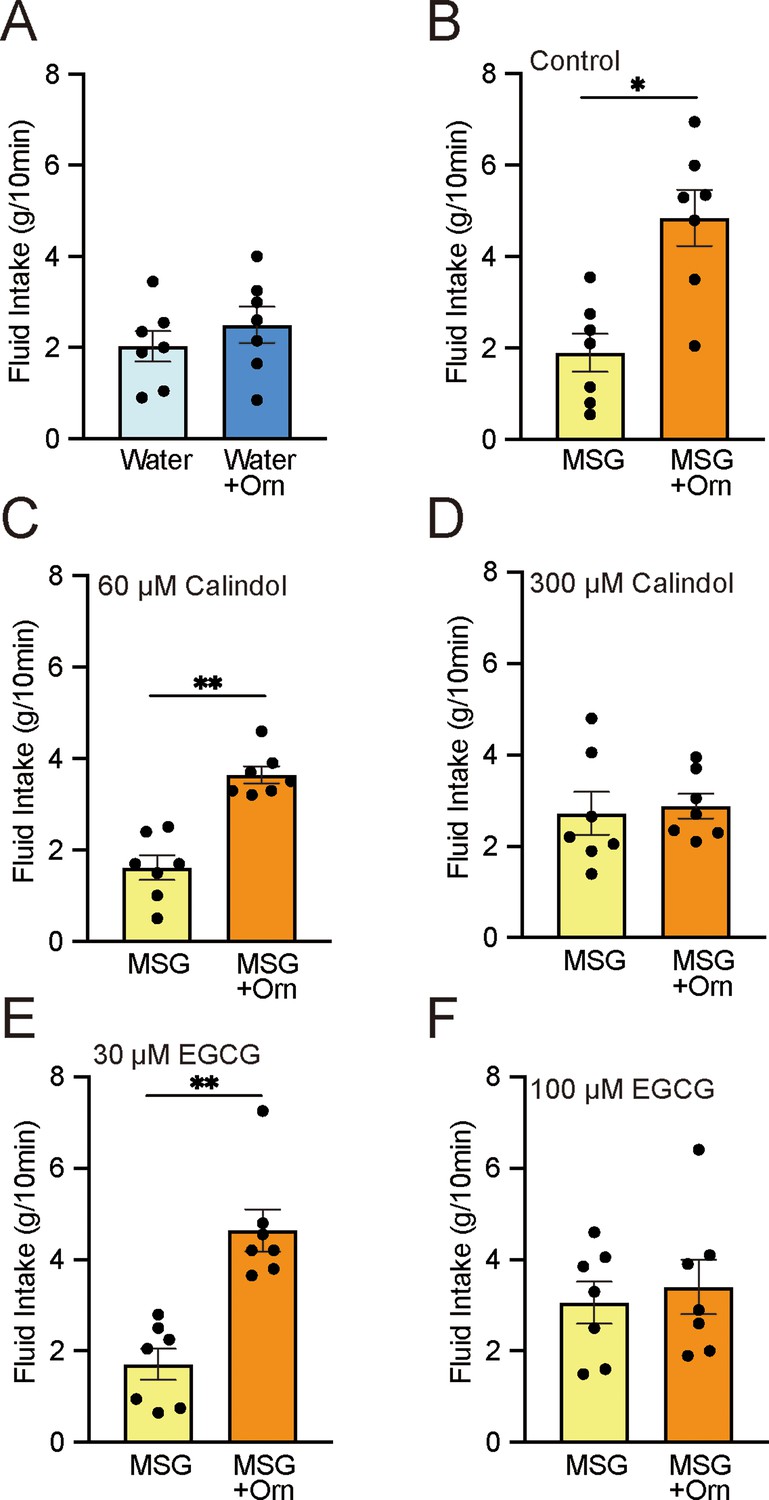
Brief-exposure (10 min) two-bottle preference test results for solutions with and without 1 mM ornithine (Orn) and effects of GPRC6A antagonists calindol and EGCG.
(A) Intake of water with and without Orn. (B) Intake of 0.03 M MSG with and without Orn. (C) Intake of MSG with and without Orn in 60 µM calindol. (D) Intake of MSG with and without Orn in 300 µM calindol. (E) Intake of MSG with and without Orn in 30 µM EGCG. (F) Intake of MSG with and without Orn in 100 µM EGCG. Each value represents the mean ± SEM; n=7. *p<0.05, **p<0.01 (paired t-test, two-tailed). MSG, monosodium glutamate; EGCG, epigallocatechin gallate; GPRC6A, G-protein-coupled receptor family C group 6 subtype A; SEM, standard error of the mean.
-
Figure 3—source data 1
Brief-exposure two-bottle preference test.
- https://cdn.elifesciences.org/articles/101629/elife-101629-fig3-data1-v1.xlsx
Figure 3—figure supplement 1

Long-term exposure (1 day) two-bottle preference test results for solutions with and without 1 mM ethyl gallate, a GPRC6A agonist, and effects of 100 µM EGCG, a GPRC6A antagonist.
(A) Intake of water (W) with and without gallate (G). (B) Intake of 0.03 M MSG (M) with and without gallate. (C) Intake of MSG and EGCG (E) with and without gallate. (D) Intake of 0.01 mM QHCl (Q) with and without gallate. (E) Intake of QHCl and EGCG with and without gallate. Each value represents the mean ± SEM; n=8. *p<0.05, **p<0.01 (paired t-test, two-tailed). These results show that gallate itself is not palatable; however, it increases preference for MSG and QHCl, and a GPRC6A antagonist eliminates these preferences. GPRC6A, G-protein-coupled receptor family C group 6 subtype A; EGCG, epigallocatechin gallate; MSG, monosodium glutamate; QHCl, quinine hydrochloride; SEM, standard error of the mean.
-
Figure 3—figure supplement 1—source data 1
Two-bottle preference test with and without gallate.
- https://cdn.elifesciences.org/articles/101629/elife-101629-fig3-figsupp1-data1-v1.xlsx
Figure 4
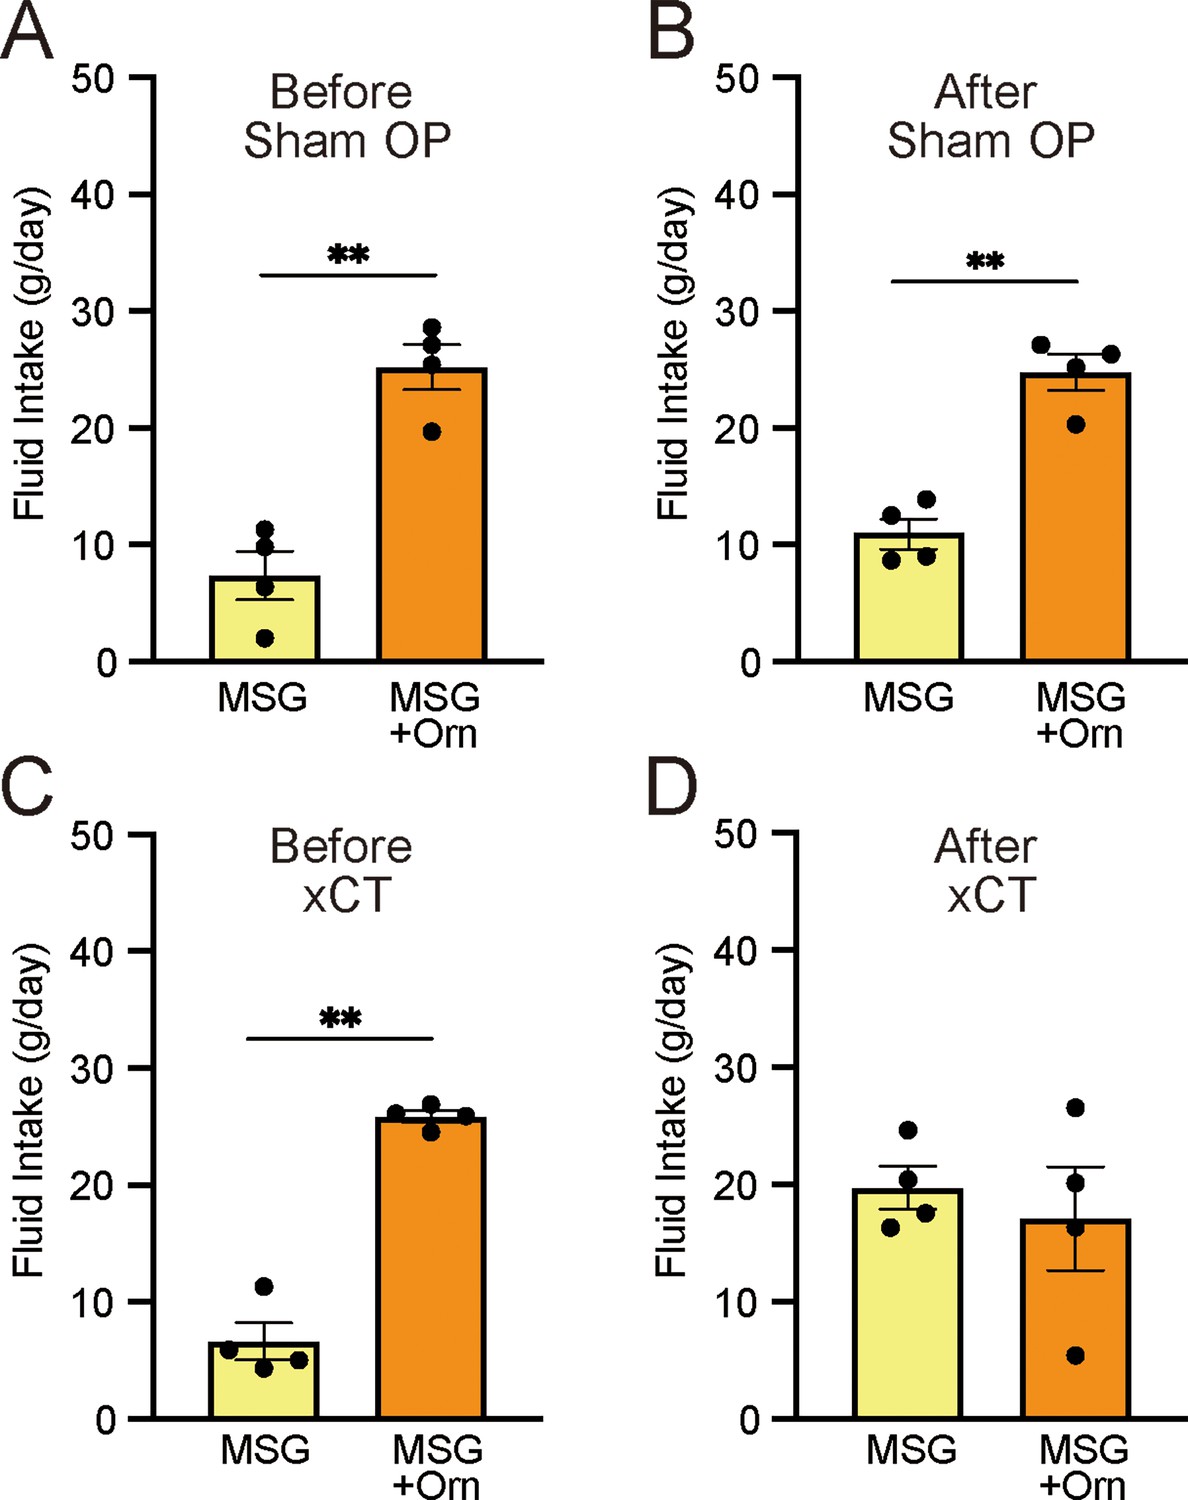
Effects of bilateral chorda tympani transection (xCT) and control sham operations (Sham OP) on intake of 0.03 M MSG with and without 1 mM ornithine (Orn).
Fluid intake before (A, C) and after (B, D) the operations. Each value represents the mean ± SEM; n=4. **p<0.01 (paired t-test, two-tailed). MSG, monosodium glutamate; SEM, standard error of the mean.
-
Figure 4—source data 1
Two-bottle preference test after CT transection.
- https://cdn.elifesciences.org/articles/101629/elife-101629-fig4-data1-v1.xlsx
Figure 5
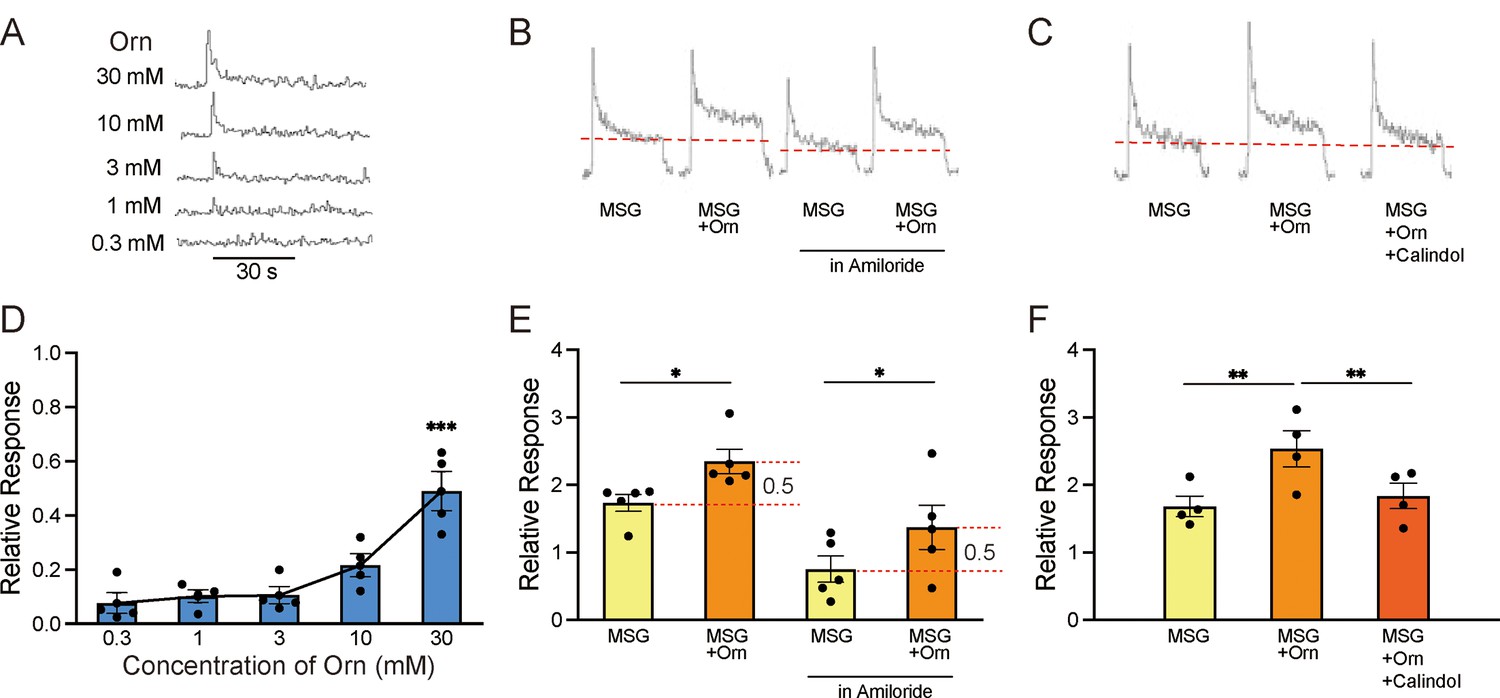
Sample recordings of chorda tympani (CT) responses and quantitative representations of mean response magnitudes.
(A) Nerve responses to five concentrations of ornithine (Orn). (B) Nerve responses to 0.03 M MSG with and without 1 mM Orn in water and in 0.01 mM amiloride (sodium-channel blocker). (C) Nerve responses to MSG, MSG with Orn, and MSG with Orn in 300 µM calindol. (D–F) Graphical representations of the mean magnitudes of CT responses corresponding to (A), (B), and (C), respectively. Each value represents the mean ± SEM normalized to the response to 0.1 M NH4Cl = 1.0; n=4 or 5. Note the different scaling of the ordinate in (D) and (E). *p<0.05, **p<0.01, ***p<0.001 (D and F, Bonferroni correction; E, two-tailed paired t-test). MSG, monosodium glutamate; SEM, standard error of the mean.
-
Figure 5—source data 1
Taste nerve responses.
- https://cdn.elifesciences.org/articles/101629/elife-101629-fig5-data1-v1.xlsx
Figure 6
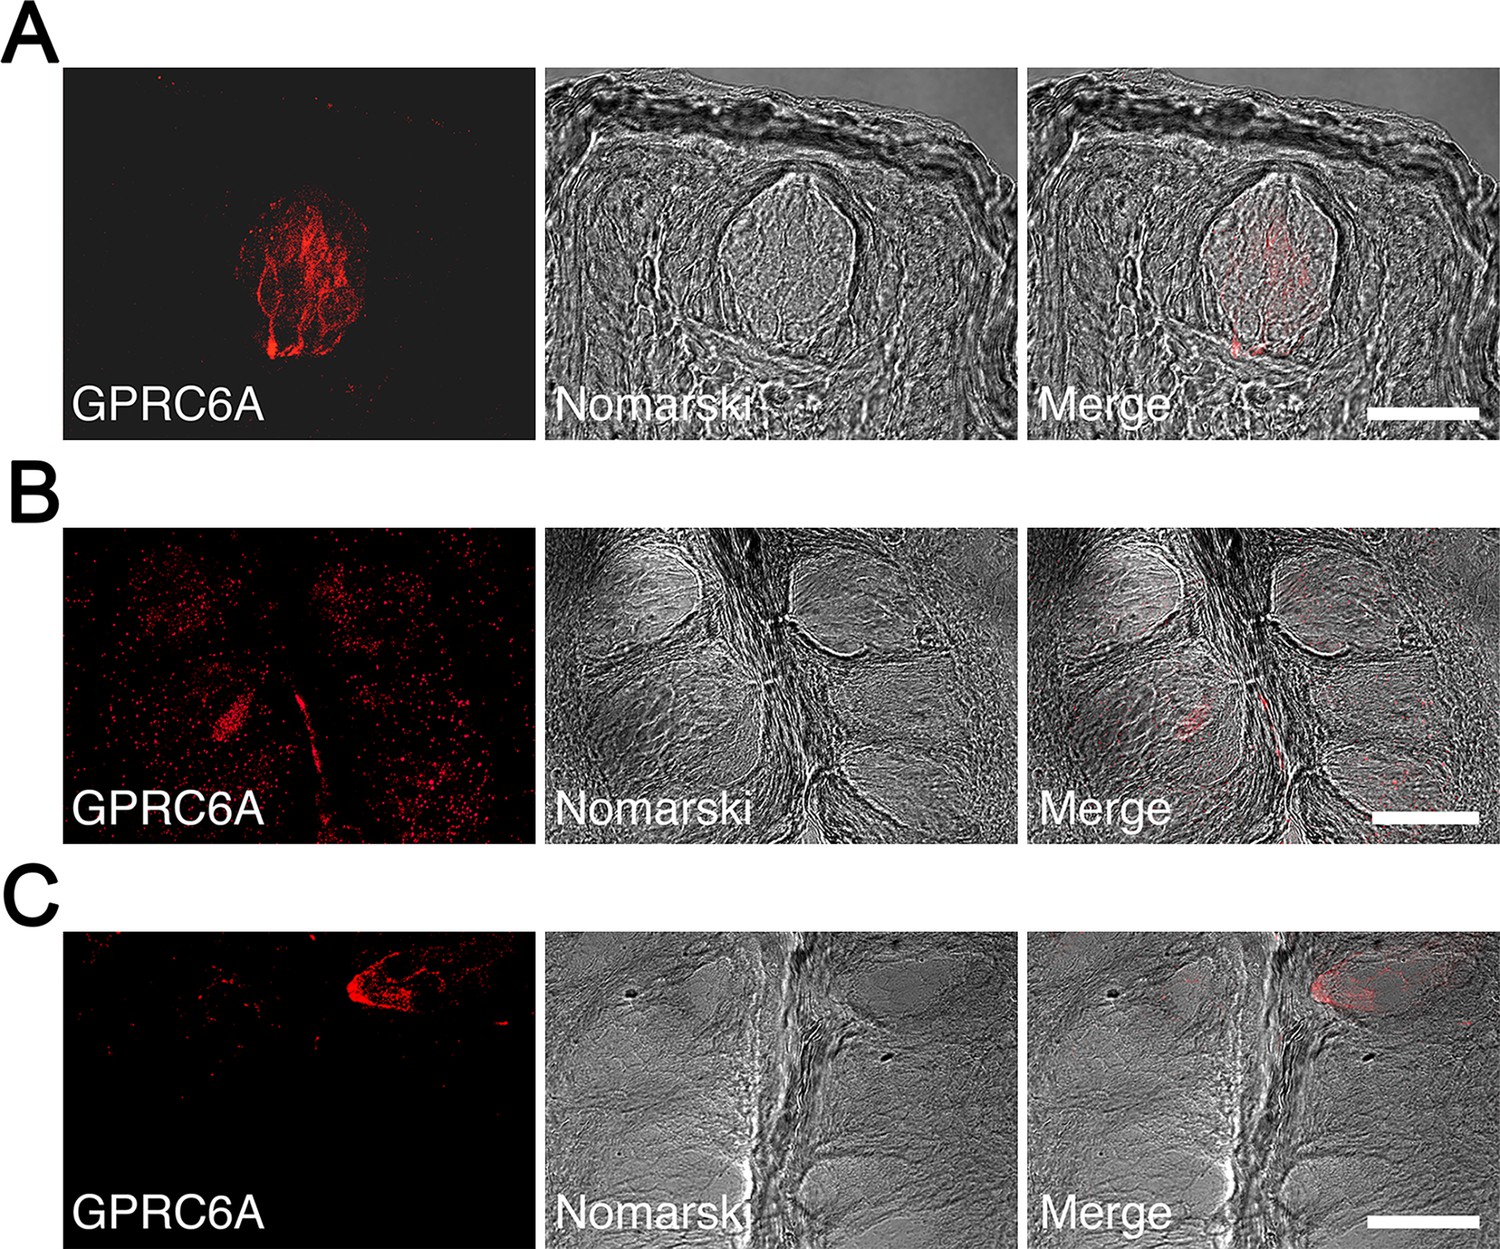
Immunohistochemical localization of GPRC6A in rat taste papillae.
(A) A significant number of spindle-shaped taste cells exhibited intense GPRC6A immunoreactivity in the fungiform papillae. (B, C) GPRC6A-immunopositive taste cells were barely detectable in the foliate (B) or circumvallate (C) papillae. Left panels show GPRC6A in red, middle panels show Nomarski images of the left panels, and right panels show merged images of respective left and middle panels. Scale bars, 50 µm. GPRC6A, G-protein-coupled receptor family C group 6 subtype A.
Figure 7 with 1 supplement
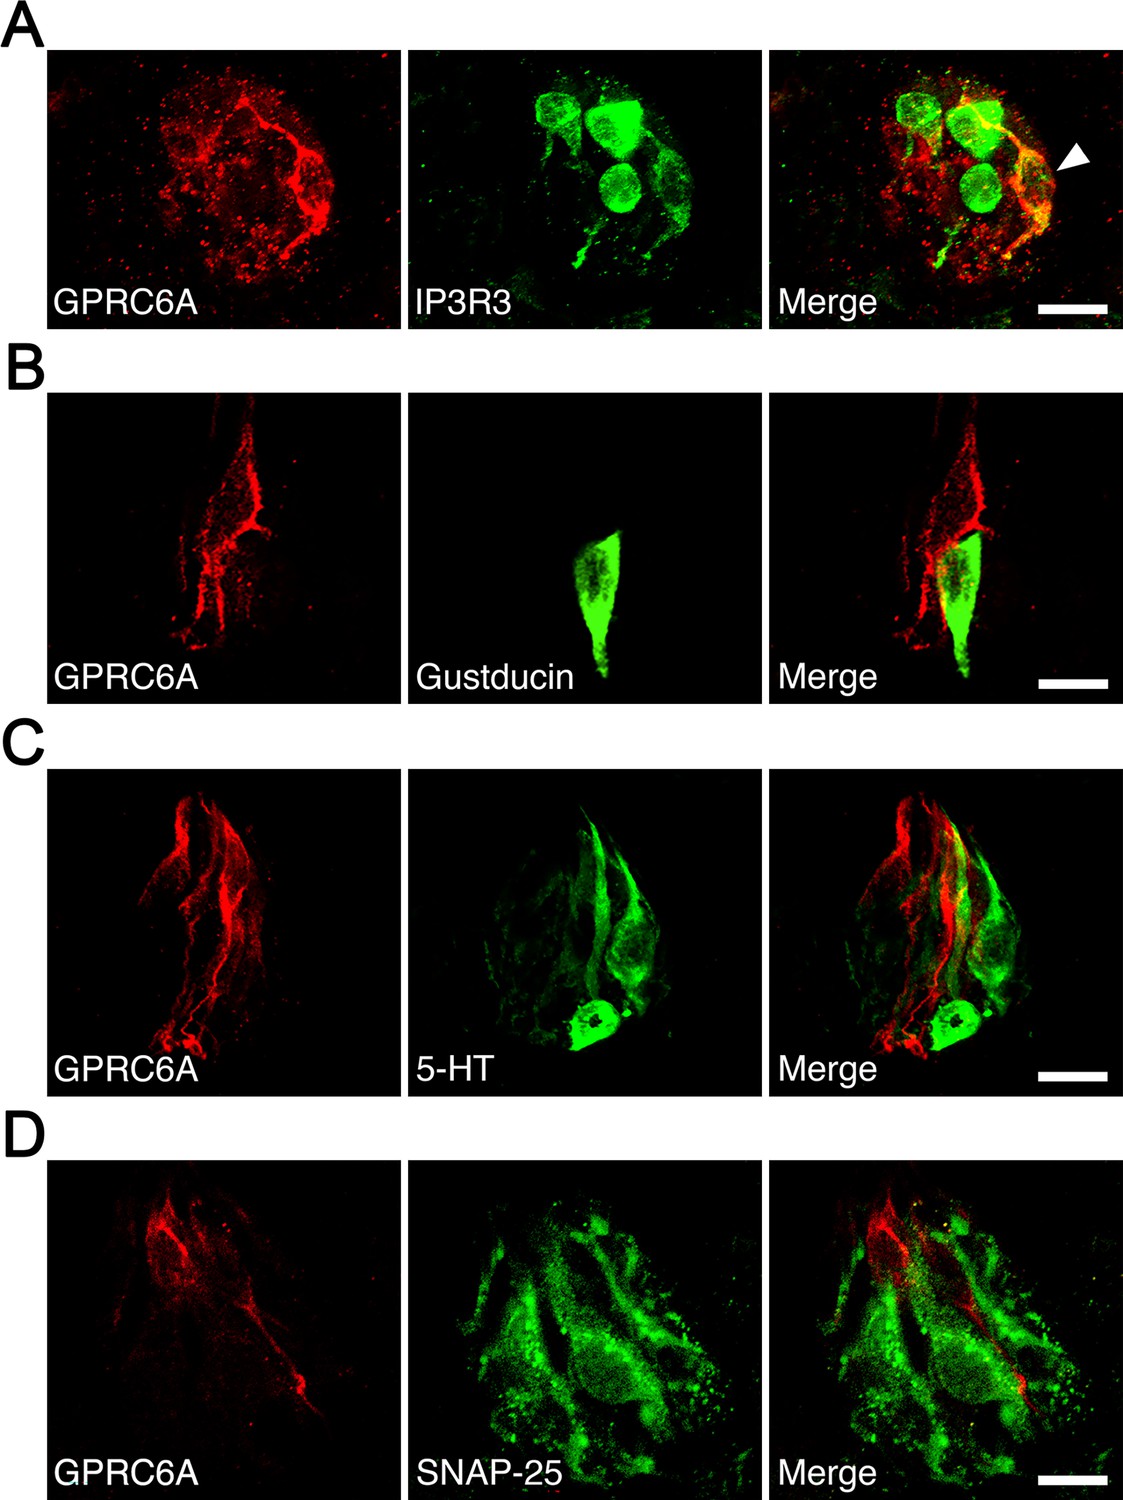
Immunohistochemical analysis of colocalization of GPRC6A and cell type-specific markers in taste cells of rat fungiform papilla taste buds.
(A) Some but not all GPRC6A-immunopositive cells exhibited immunoreactivity for IP3R3, a marker of most type II cells. White arrow indicates GPRC6A/IP3R3 double-positive taste cell. (B) α-Gustducin, another marker of a subset of type II cells, was unlikely to colocalize with GPRC6A in single taste cells. (C, D) Neither 5-HT (C) nor SNAP25 (D), specific markers of type III taste cells, were likely to colocalize with GPRC6A in single taste cells. Scale bars, 10 µm. GPRC6A, G-protein-coupled receptor family C group 6 subtype A; IP3R3, inositol 1,4,5-trisphosphate receptor type 3; 5-HT, 5-hydroxytryptamine; SNAP25, synaptosomal-associated protein 25 kDa.
Figure 7—figure supplement 1
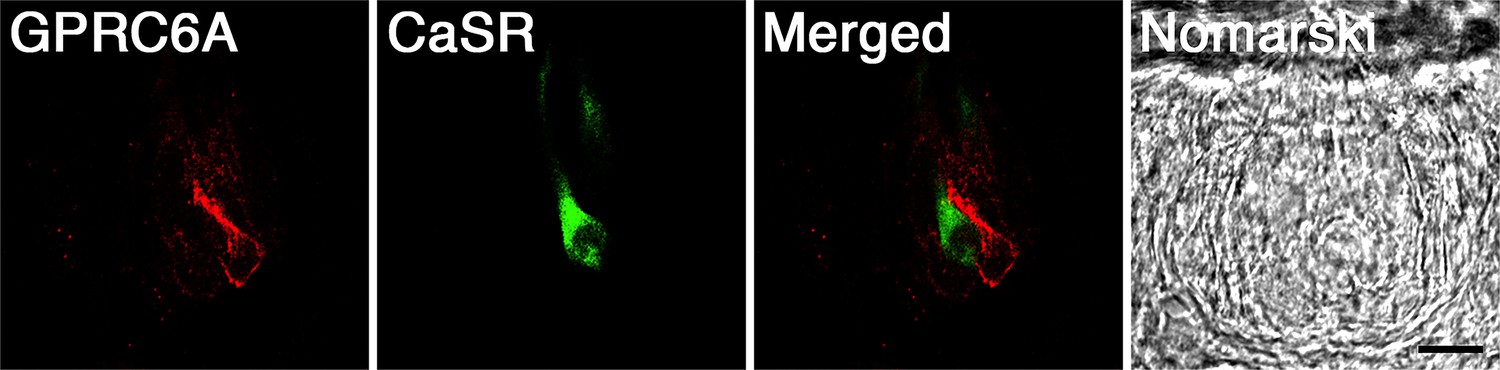
Immunohistochemical colocalization of GPRC6A and CaSR in rat fungiform taste papillae.
GPRC6A and CaSR are expressed in distinct subpopulations of fungiform taste cells. The right panel shows the Nomarski image of the examined tissue section. Scale bar, 10 µm. GPRC6A, G-protein-coupled receptor family C group 6 subtype A; CaSR, calcium-sensing receptor.
Additional files
Download links
A two-part list of links to download the article, or parts of the article, in various formats.
Downloads (link to download the article as PDF)
Open citations (links to open the citations from this article in various online reference manager services)
Cite this article (links to download the citations from this article in formats compatible with various reference manager tools)
GPRC6A as a novel kokumi receptor responsible for enhanced taste preferences by ornithine
eLife 13:RP101629.
https://doi.org/10.7554/eLife.101629.4


