Mouse V1 population correlates of visual detection rely on heterogeneity within neuronal response patterns
- University of Amsterdam, Netherlands
- Max Planck Institute of Neurobiology, Germany
Figures
Figure 1 with 1 supplement
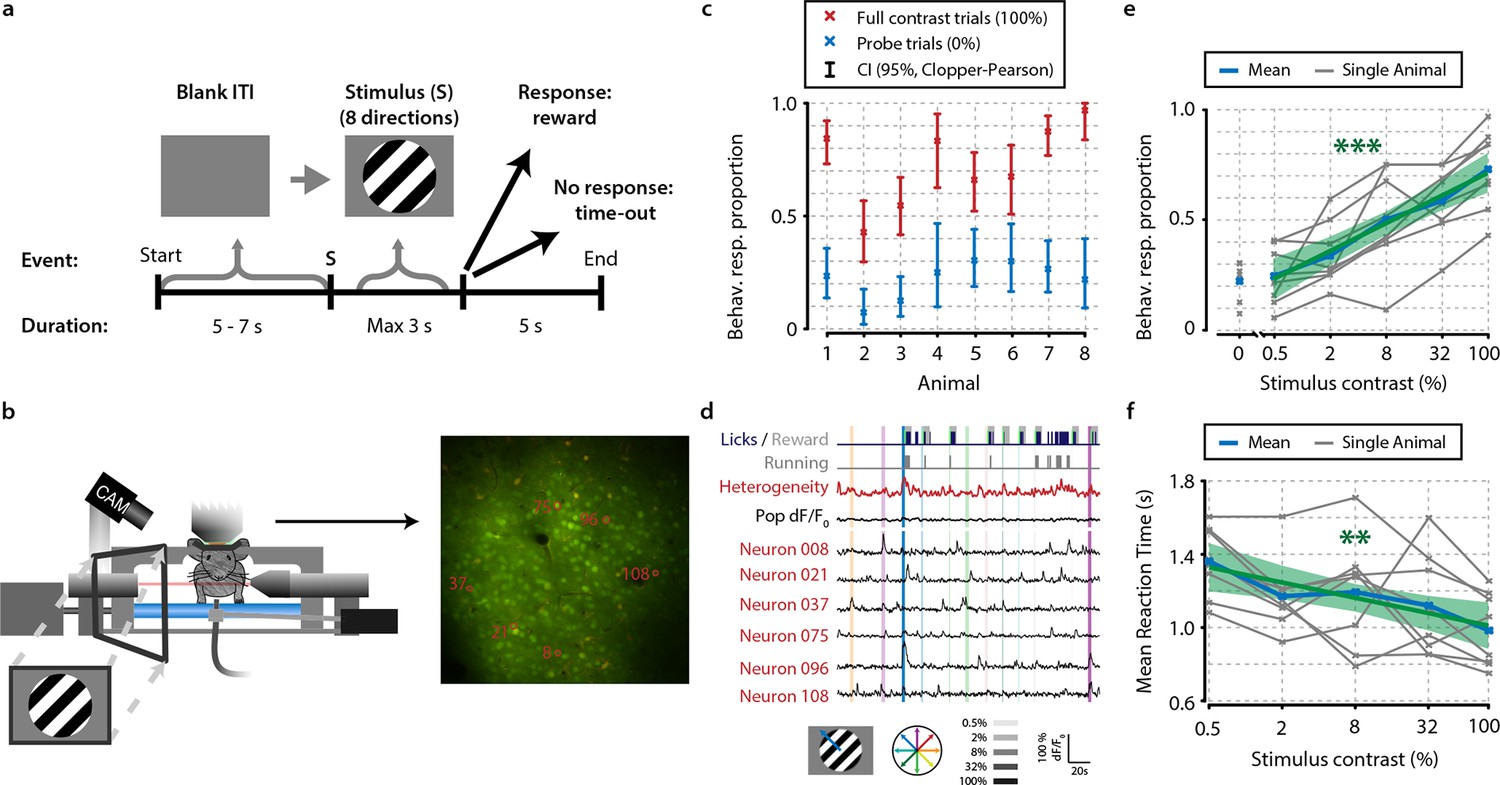
Mice perform a go/no-go task during in vivo calcium imaging.
(a) Task schematic showing the time course of a single trial. In each trial, one of a combination of eight different directions and five contrasts, or a 0% contrast probe trial (isoluminant gray blank screen) was presented (ratio 1:5 of 0%-contrast-probe:stimulus trials). When mice made a licking response during stimulus presentation, the visual stimulus was turned off and sugar water was presented. (b) Schematic of experimental setup. During task performance, we recorded eye movements with an infrared-sensitive camera, licking responses, and running on a treadmill. (c) All eight animals performed statistically significant stimulus detection during neural recordings, as quantified by non-overlapping 2.5th–97.5th Clopper–Pearson (CP) percentile confidence intervals (95% CI) (p<0.05) of behavioral response proportions for 0% and 100% contrast probe trials. (d) Example of simultaneously recorded behavioral measures, population heterogeneity, mean population dF/F0, and traces of neurons labeled in panel (b) Vertical colored bars represent stimulus presentations; width, color, and saturation represent duration, orientation, and contrast, respectively. (e, f) Animals showed significant increases in behavioral response (behav. resp.) proportion (linear regression analysis, see ‘Materials and methods’, p<0.001) (e) and reductions in reaction time (p<0.01); (f) with higher stimulus contrasts. Shaded areas show the standard error of the mean. Statistical significance: **p<0.01; ***p<0.001.
Figure 1—figure supplement 1
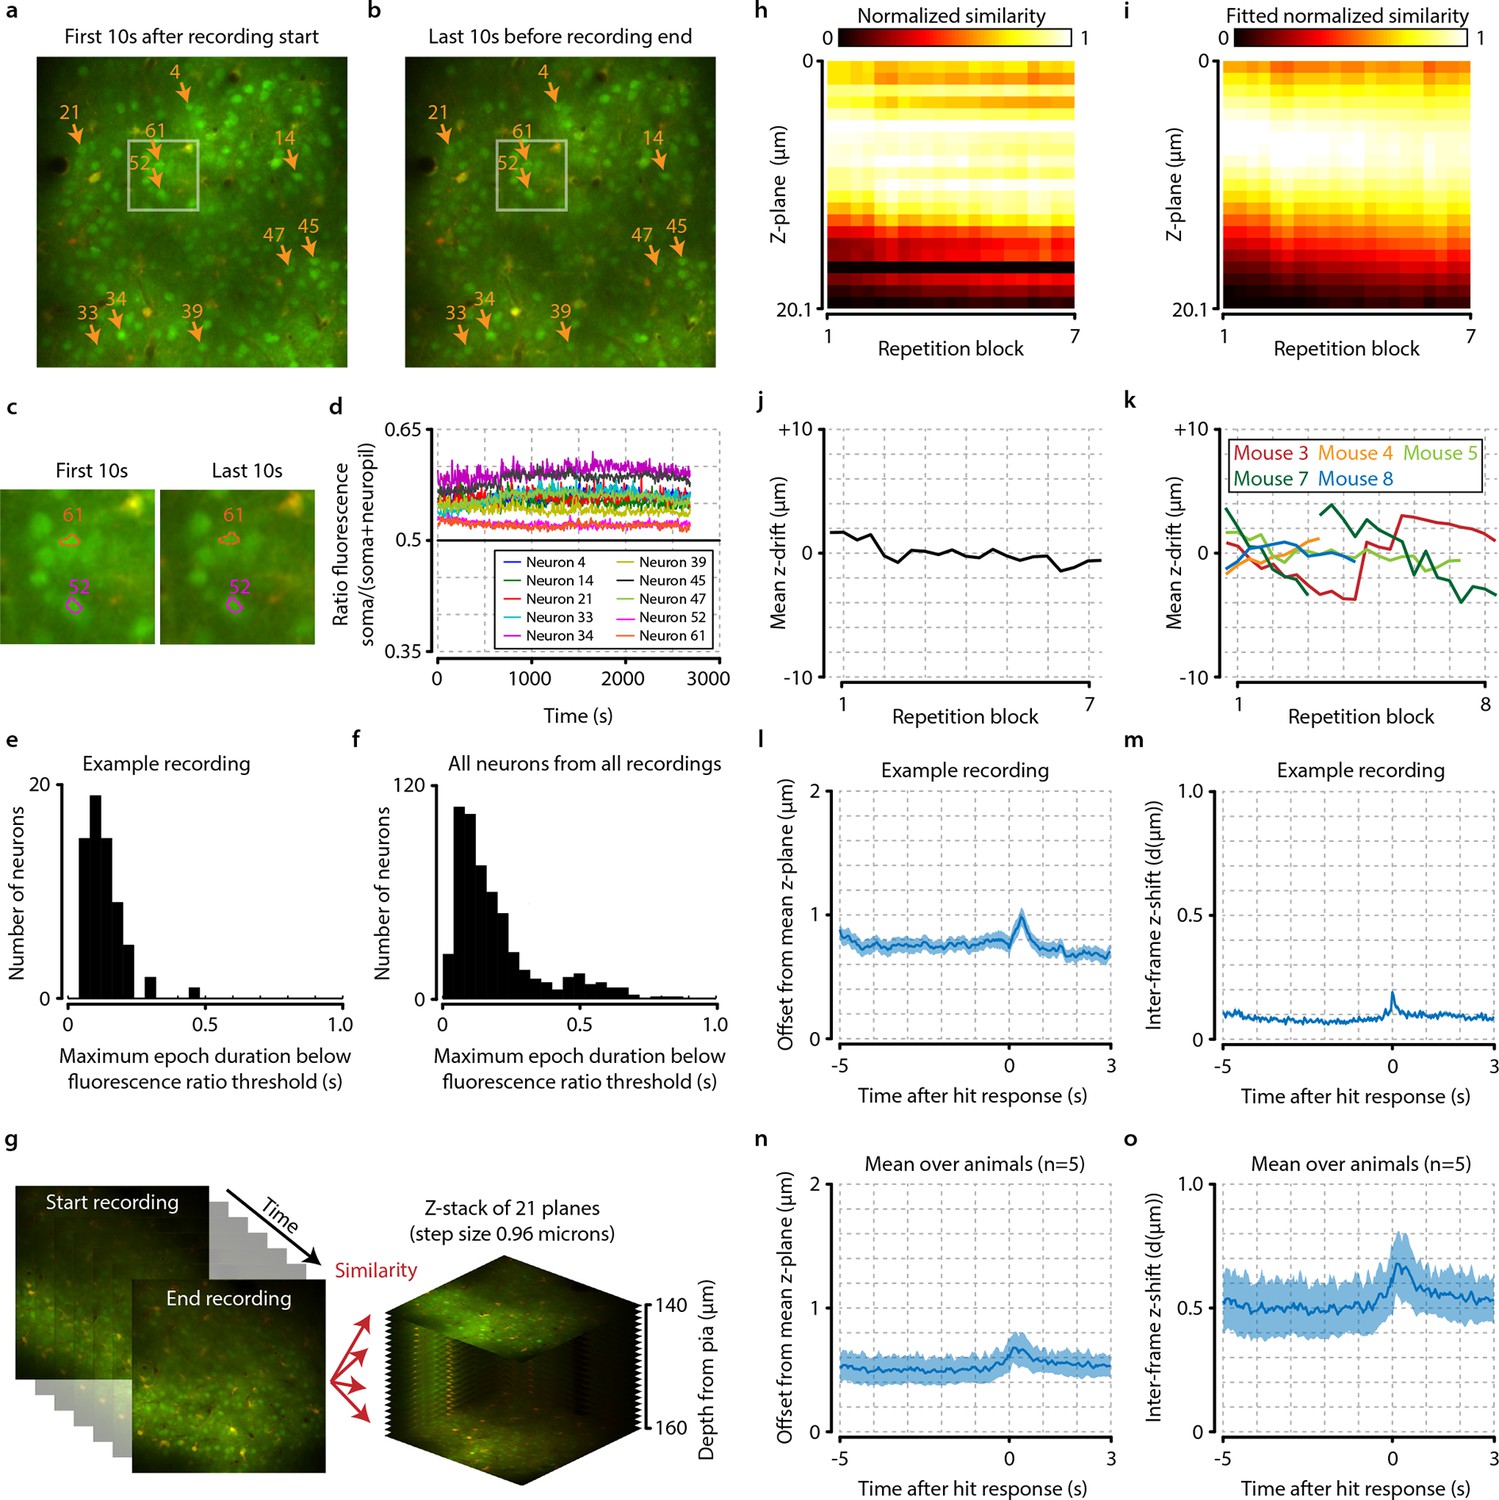
Neuronal signals are stable over time.
(a, b) Example from one animal showing the average of all recorded frames during the first 10 s after imaging onset (a) and during the last 10 s before the end of the recording (b). The locations of 10 randomly selected neurons are marked by orange arrows, and the white-colored rectangles depict the area enlarged in panel (c). (c) Enlarged subsection of the images shown in (a) and (b) showing the outlines of cells 52 and 61. Note the similarity of the cell bodies and their outlines. (d) Down-sampled traces showing the ratio of soma versus neuropil fluorescence of the 10 randomly selected neurons shown in panels (a) and (b) over duration of the entire recording (see ‘Materials and methods’). All traces remain above the equiluminance threshold of 0.5, indicating that these neurons’ somata remain visible and do not disappear due to bleaching or slow z-drift. (e) Histogram showing the maximum epoch duration of dropping below the equiluminance threshold of 0.5 for all neurons from the example session of (a–d). None of the cells remain undetectable for longer than 0.5 s. (f) as (e) but for all cells from all recordings. None of the cells have a prolonged period (>1.0 s) of being undetectable, indicating stability of the neuronal signals over time. (g) Schematic showing procedure of z-drift calculation for example animal. For each repetition block of 48 trials, we compared the similarity of 100 frames (~4 s) in the beginning, middle, and end of each stimulus repetition set to slices recorded at different cortical depths (step size 0.96 µm). (h) Similarity values normalized between [0-1] for each time point show a small and slow z-drift over the entirety of the recording. (i) To quantify this drift, we fitted each time point with a Gaussian. (j) The mean of the fitted Gaussian shows that maximum drift in z-direction for this animal did not exceed 4 µm. (k) Data for all animals of which we recorded z-stacks (n=5/8). Animals 2 (not shown) and 7 showed excessive z-drift, so we split their recordings into two populations (see ‘Materials and methods’). Within a single recorded population, z-drift never exceeded 8 µm for any animal. (l–o) Frame-by-frame analysis of fast z-shifts during entire recordings show that z movement rarely exceeds more than a couple of microns. (l) Example recording showing mean ± standard error across trials in offset from mean z-plane as a function of time after hit response (licking). Shortly after the behavioral response, a peak in variability can be observed. However, note that for all analyses we only included epochs before the licking response; the period of neural responses with potential contamination from z-shifts will, therefore, not influence our results. (m) Example frame-by-frame shift in microns (mean ± standard error across trials) shows a similar time course as the mean z-offset. (n, o) Same as panels (l) and (m), but showing mean ± standard error across animals (n=5).
Figure 2 with 1 supplement
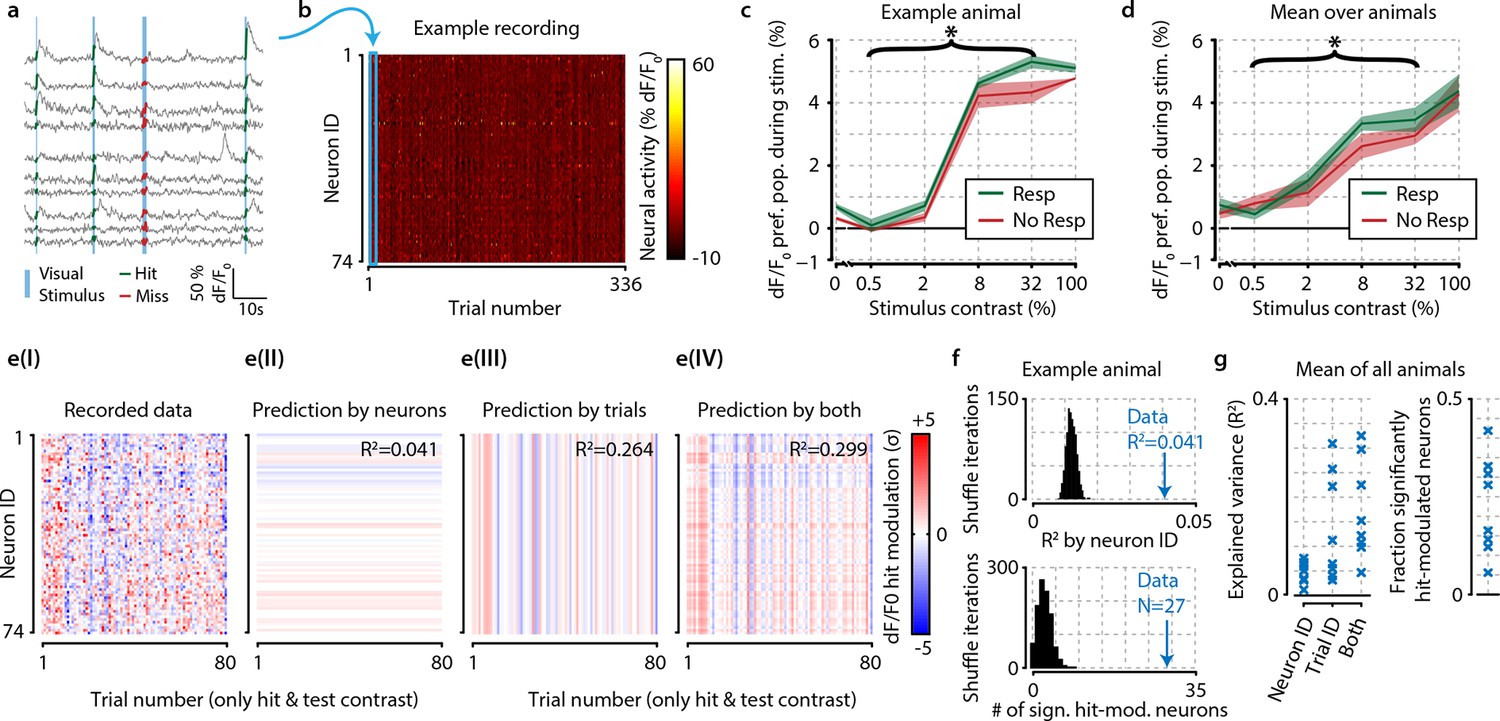
The difference in neural activity between hit and miss trials can be partly explained by consistent hit-associated increases in activity of specific neurons, and somewhat better by trial-by-trial population-wide fluctuations, but these mean-based approaches fall short of being fully descriptive.
(a) Recorded traces from 10 randomly selected neurons over four subsequent trials. For further analysis, we took the mean dF/F0 per neuron over the visual stimulation period (thick colored lines) as single mean neural activity measure per trial. (b) Data of one entire recording block consisting of 74 tuned and simultaneously recorded neurons over 336 trials. Blue rectangle shows the four trials depicted in panel (a). (c) In an example animal, the detection of stimuli (green) with test contrasts (0.5–32%) correlated with a modest increase in preferred population dF/F0 over undetected stimuli (red) (two-sample t-test, p<0.05) but none of the individual contrasts reached statistical significance (resp. vs. no resp., two-sample t-tests, FDR-corrected p>0.05). (d) As (c), but for mean over all animals the graph shows a small, but consistent overall difference of dF/F0 with visual detection (test contrasts 0.5–32%, n=8 animals, p<0.05). (c, d) Shaded areas show the standard error of the mean. (e) The hit-associated increase in neural activity per neuron for all hit trials of test contrast stimuli (panel I) can be partly explained by specific neurons showing consistent dF/F0 increases or decreases across trials (panel II) partly by trial-by-trial population-wide fluctuations regardless of neuronal identity (panel III) and somewhat better by both (panel IV). (f) Control analysis by shuffling neuronal identities (IDs) per trial (n=1000 iterations, black distribution) shows that the population activity is more predictable based on consistent hit modulations per neuron (top panel) and more neurons are significantly hit-modulated (bottom panel) than can be expected by chance. (g) Analyses as in (f), but across animals; comparison versus shuffle-based R2-expectation showed above-chance (at α=0.05) predictability of hit modulations using neuron ID, trial ID or both for respectively 7/8, 8/8, and 8/8 animals (left panel). The fraction of significantly hit-modulated neurons was above chance (at α=0.05) for 7/8 animals (right panel).
Figure 2—figure supplement 1
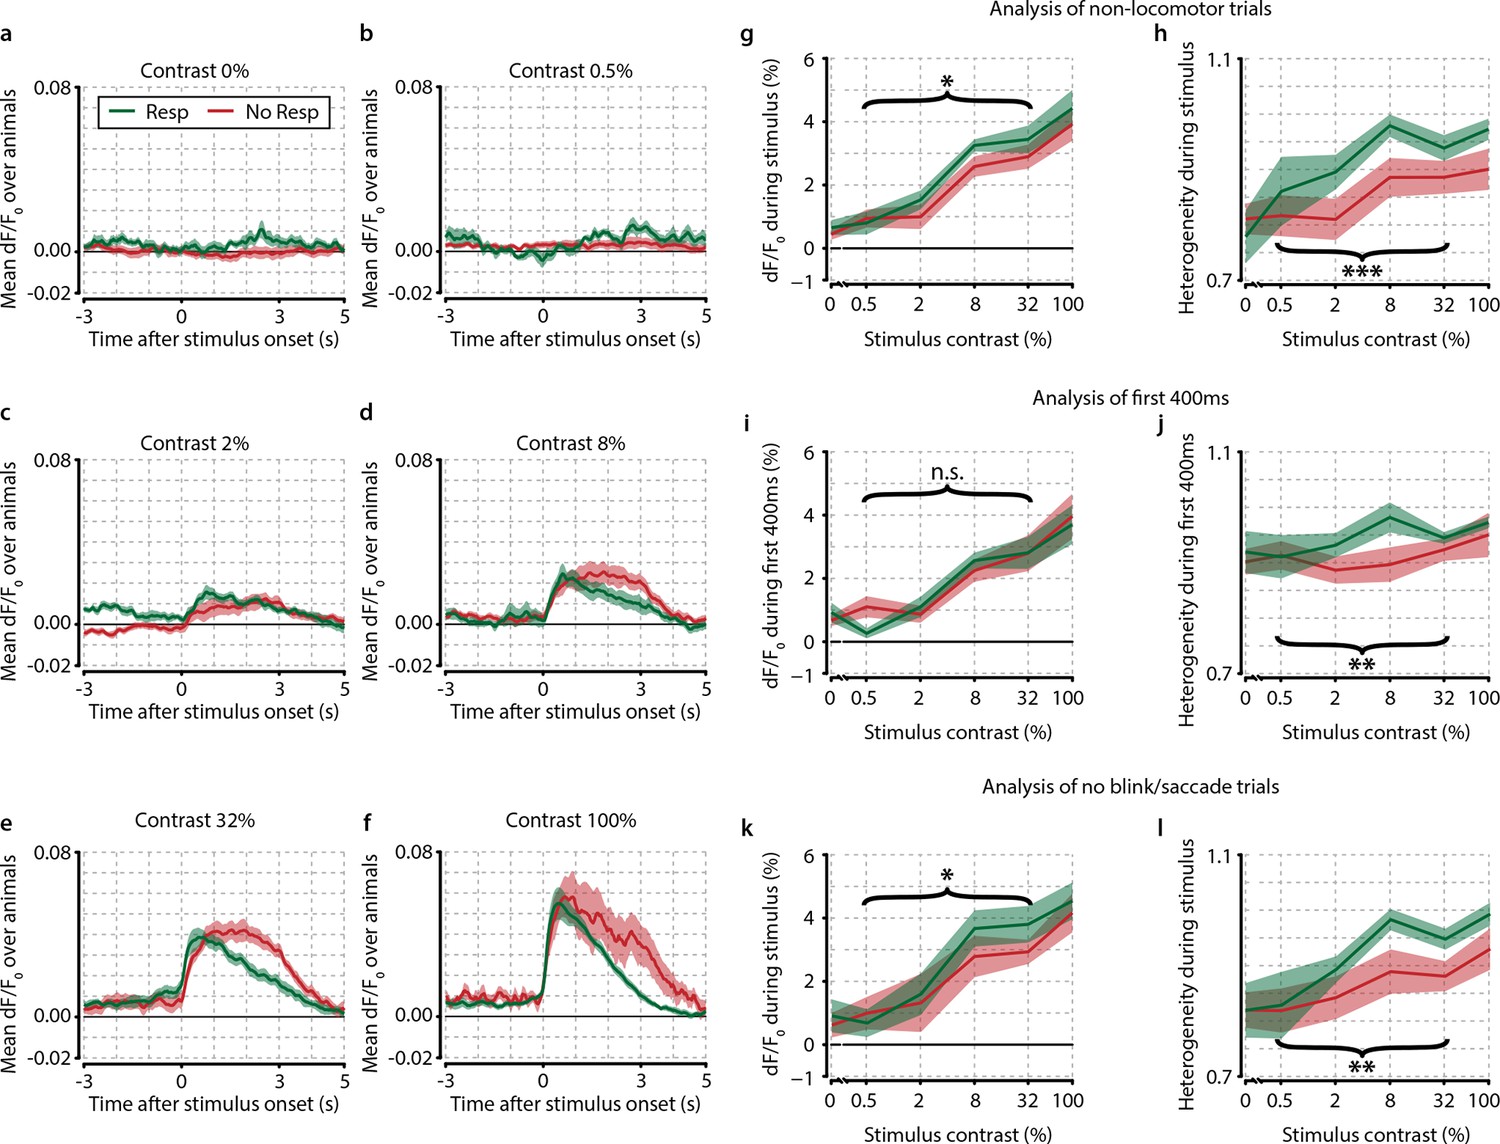
Several control analyses reveal no confounding effects of motor preparation, modulatory feedback, and eye movements.
(a–f) Traces of population dF/F0 averaged over animals (n=8) for different contrasts show the difference between response and no-response trials over time. (a) Probe trials (0% stimulus contrast). Note the absence of any neuronal activity during responses to 0% contrast probe trials (green line, t-test vs. 0, p=0.549) and (b) 0.5% contrast, (c) 2% contrast, (d) 8% contrast, (e) 32% contrast, and (f) 100% contrast. (a–f) Response trials (green) show quicker offsets because the stimulus turns off when the animal makes a licking response. Also note the absence of any motor-related neural activity in panel (a) supporting the interpretation that the observed correlates are unrelated to motor activity, preparation or reward expectancy. (g, h) Removal of locomotion trials does not qualitatively affect neural correlates of stimulus detection. (g) When computed only on trials where animals were not moving (89.9% of trials), the mean population dF/F0 as a function of stimulus contrast shows little difference with the original analysis (compare to Figure 2d). Paired t-test over test contrasts (0.5–32%) showed a significant difference between response and no-response trials (p<0.05). Our original results are very similar to the current analyses and are therefore not dependent on movement-induced modulations. (h) As (g) but for heterogeneity (still trials only); the overall paired t-test for hit/miss differences grouping 0.5–32% contrasts was highly significant (p<0.001), suggesting that our main results are not due to locomotion-related artifacts. (i, j) Population correlates of visual detection are not dependent on motor-related and/or feedback signals. (I) As Figure 2d; mean population dF/F0 as a function of contrast, now using only the first ~400 ms (394 ms; 10 frames) after stimulus onset. Mean reaction time over animals and contrasts was ~1.2 s (see Figure 1f) leaving on average about 0.8 s between the last data point included in this analysis and the subsequent licking response.(j) As (i) but for heterogeneity (compare with Figure 3d). Results were qualitatively similar to our original analysis for heterogeneity, but not for dF/F0 (paired t-test over intermediate contrasts for dF/F0, p=0.543, for heterogeneity, p<0.005). (k, l) Population correlates are not explained by eye blinks or saccades. (k) As Figure 2d; mean population dF/F0 as a function of contrast using only trials in which the animal’s eye position remained fixed and no blinks were detected during the entire stimulus period. (l) As (k) but for heterogeneity (compare with Figure 3d). Our results are qualitatively and quantitatively similar for dF/F0 and heterogeneity (hit–miss paired t-test over test contrasts; p<0.05 and p<0.005, respectively). All panels: shaded areas show the standard error of the mean. Asterisks indicate statistical significance: *p<0.05; **p<0.005; ***p<0.001.
Figure 3 with 2 supplements
Neuronal response heterogeneity within populations correlates better with visual detection than mean preferred population (pref. pop.) activity.
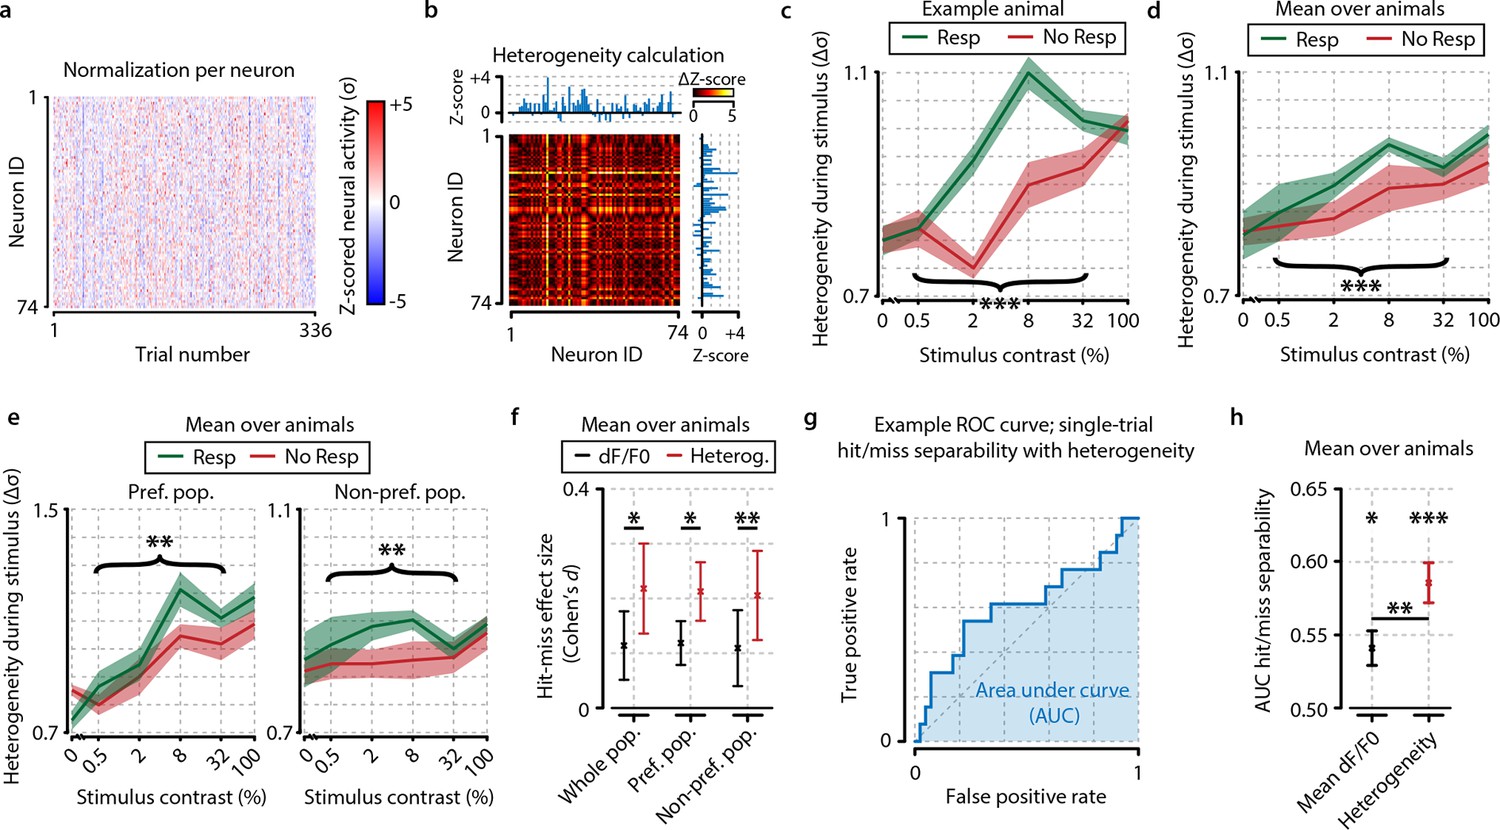
(a) Neuronal activity as in Figure 2d, but presented as z-score normalized per contrast to be able to compare relative changes across contrasts. (b) Schematic representation of the method to compute heterogeneity on an example trial (see also ‘Materials and methods’). The dF/F0 response of each neuron is z-scored per contrast and the distance (absolute difference) in z-scored activity between all pairs of neurons is calculated for each trial (color-coded ΔZ-score). The population heterogeneity in a given trial is defined as the mean ΔZ-score over all neuronal pairs. (c) Population activity heterogeneity in an example animal shows a strong correlation with visual detection. Comparison between detected (resp.) and undetected (no resp.) trials for test contrasts as a group (paired t-test, p<0.001) was highly significant. (d) As (c), but showing mean over all animals (n=8). Stimulus detection correlated with higher heterogeneity; test contrast group hit–miss comparison was highly significant (p<0.001). (e) As (d), but for heterogeneity within the preferred (left panel) and within the nonpreferred (right panel) population only. Hit–miss differences were found in the preferred population (test contrast group, p<0.01) and nonpreferred population (test contrast group, p<0.01) similar to the whole population (d). (f) Using a measure of effect size analysis (Cohen’s d), heterogeneity was found to show a stronger correlation with stimulus detection than mean dF/F0 within the whole population (Cohen’s d=0.114 vs. d=0.218); within the preferred population (Cohen’s d=0.119 vs. d=0.213) and within the nonpreferred population (Cohen’s d=0.110 vs. d=0.206) [paired t-tests over animals (n=8) whole population; p<0.05, preferred population; p<0.05, nonpreferred population; p<0.01]. (g) Example receiver operating characteristic (ROC) curve showing the linear separability of single-trial hit and miss trials using population heterogeneity (see ‘Materials and methods’). The separability can be quantified by the area under the curve (AUC; blue shaded area). True positive rate: fraction of hit trials classified as hit. False positive rate: fraction of miss trials classified as hit. (h) Statistical quantification of hit/miss separability using either mean dF/F0 (black) or heterogeneity (red) across animals (n=8). Both measures predict the animal’s response above chance (FDR-corrected paired t-test dF/F0 and heterogeneity AUC vs. 0.5, p<0.05 and p<0.001, respectively) but behavior can be predicted better using heterogeneity (paired t-test, dF/F0 vs. heterogeneity AUC, p<0.01). All panels: shaded areas/error bars show the standard error of the mean. Statistical significance: *p<0.05; **p<0.01; ***p<0.001.
Figure 3—figure supplement 1
Contrast-dependent responses of the preferred, nonpreferred, and whole population show distributed hit-correlated modulations in heterogeneity, but modulations in mean dF/F0 are smaller and only significant for the preferred population.
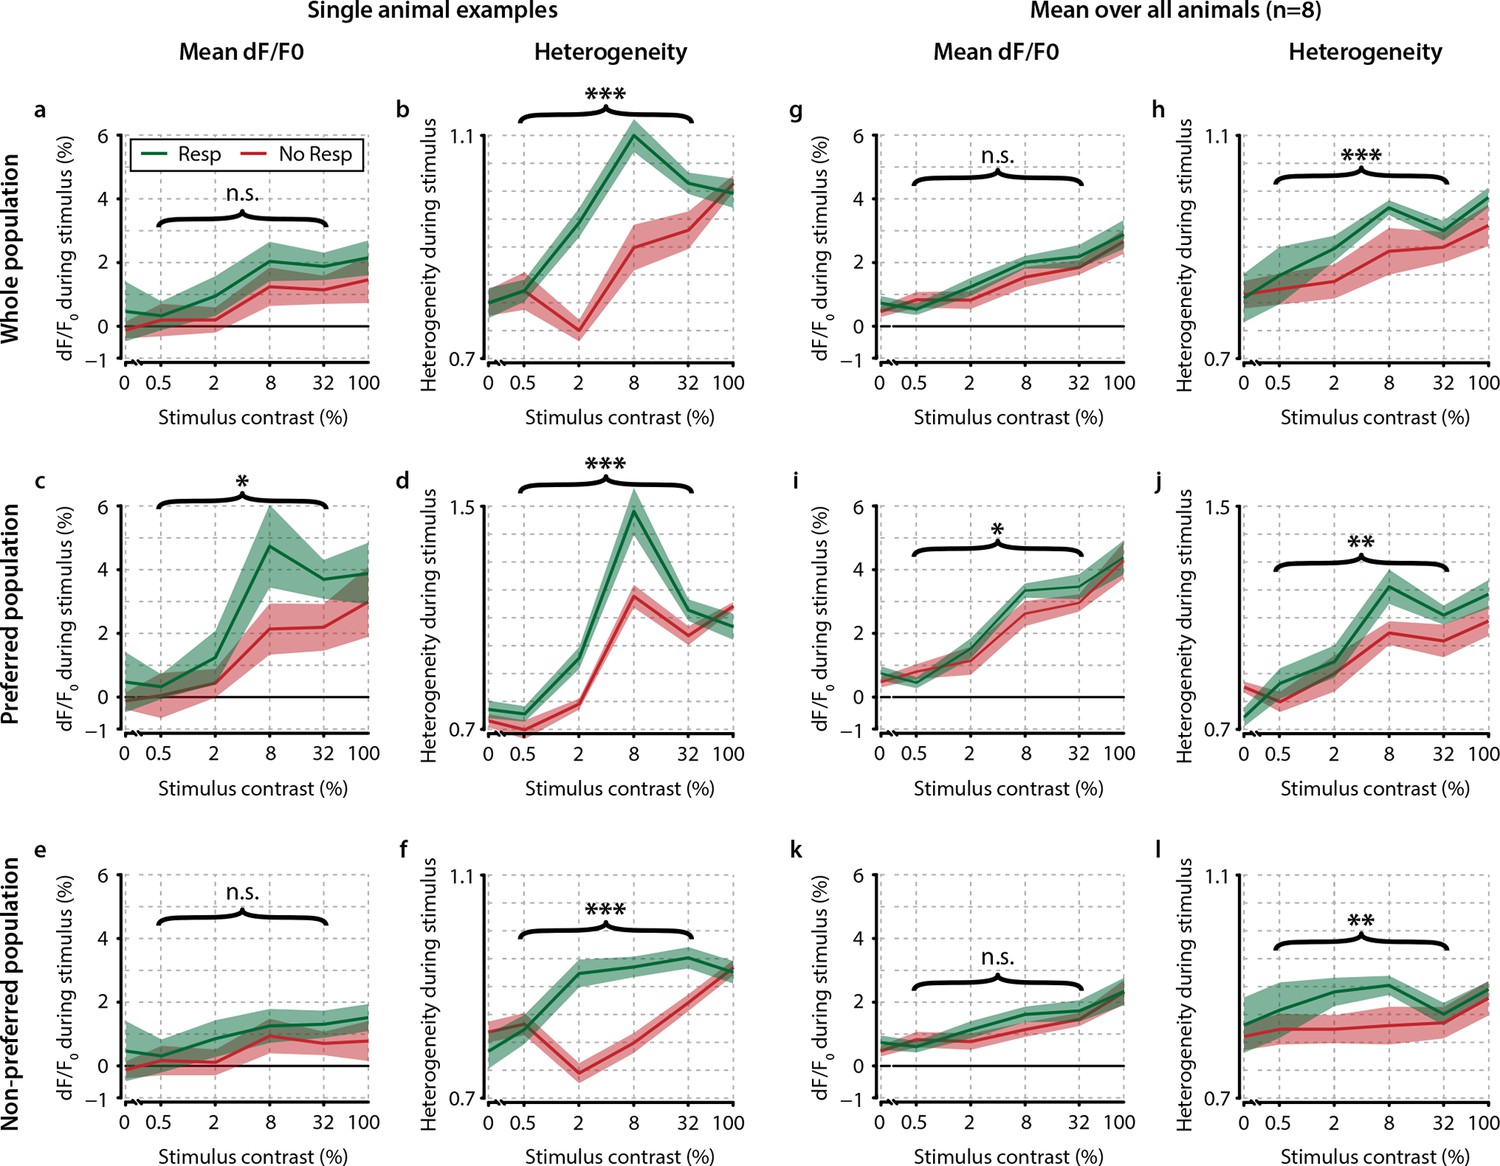
Single animal neural response examples of the whole (a, b) preferred (c, d) and nonpreferred (e, f) population of neurons. Mean dF/F0 shows hit–miss differences only within the preferred population (p<0.05) (c) but not within the population as a whole (a) nor within the nonpreferred population (e) (paired t-tests, n.s.). However, heterogeneity shows significant differences across the whole population (b) as well as within the preferred (d and nonpreferred (f) population (paired t-test, p<0.001 for all comparisons). (g–l) As (a–f) but for across-animal comparison of hit–miss differences. All panels: shaded areas show the standard error of the mean. Asterisks indicate statistical significance: *p<0.05; **p<0.01; ***p<0.001.
Figure 3—figure supplement 2
Analysis of hit/miss effect size (Cohen’s d) shows that simple average perform worst at separating hit from miss responses.
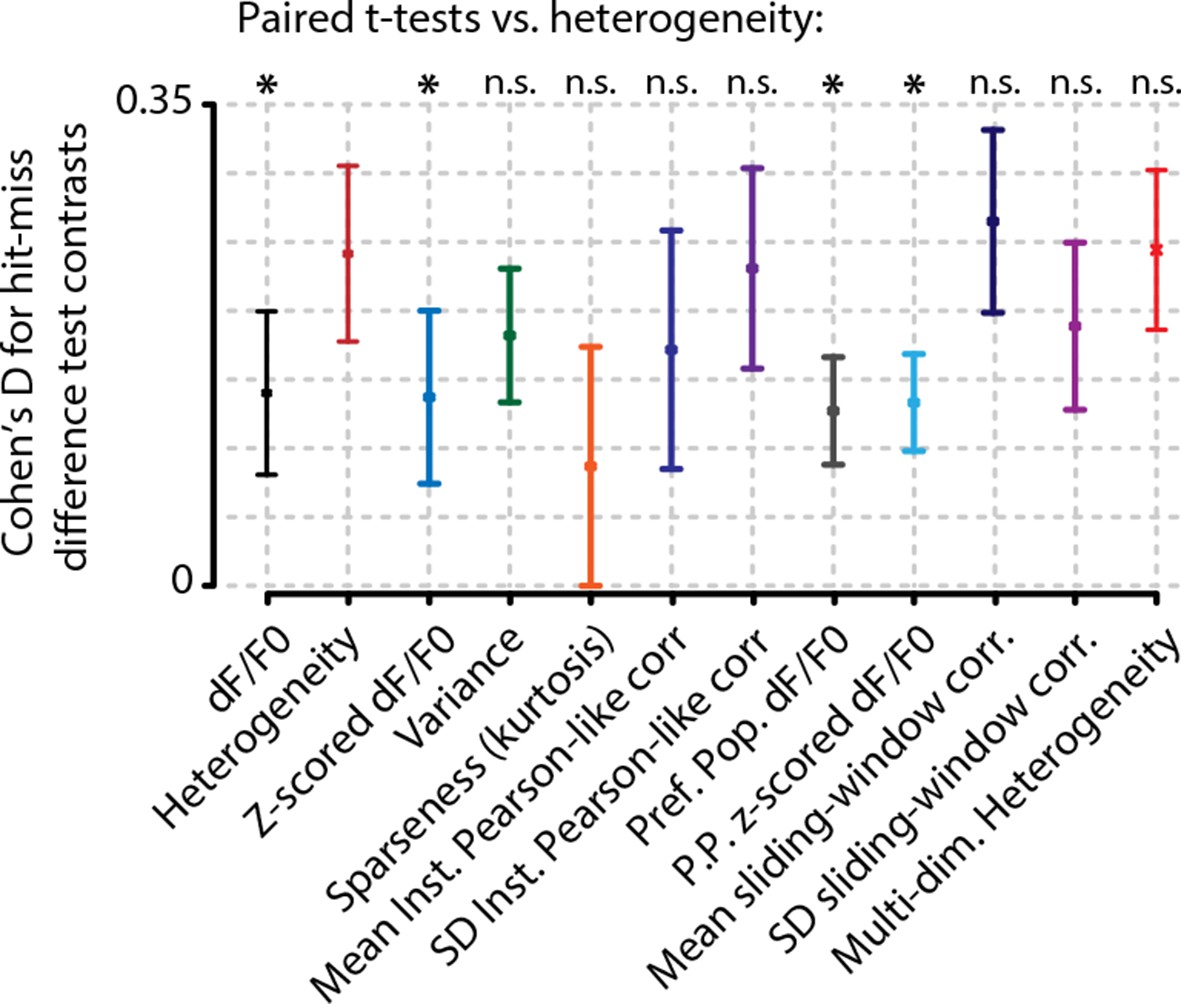
Heterogeneity performed significantly better than mean whole-population (z-scored) dF/F0 (black and blue, FDR-corrected paired t-tests, p<0.05) and mean preferred population (z-scored) dF/F0 (gray and light blue, FDR-corrected paired t-tests, p<0.05). Variance (green) sparseness (orange) mean and SD of instantaneous Pearson-like correlations (dark blue and dark purple) and mean and SD of sliding window correlations (navy blue and light purple) did not differ significantly from heterogeneity. Error bars show the standard error of the mean. Asterisks indicate statistical significance: *p<0.05.
Figure 4 with 2 supplements
Heterogeneity is correlated with reaction time.
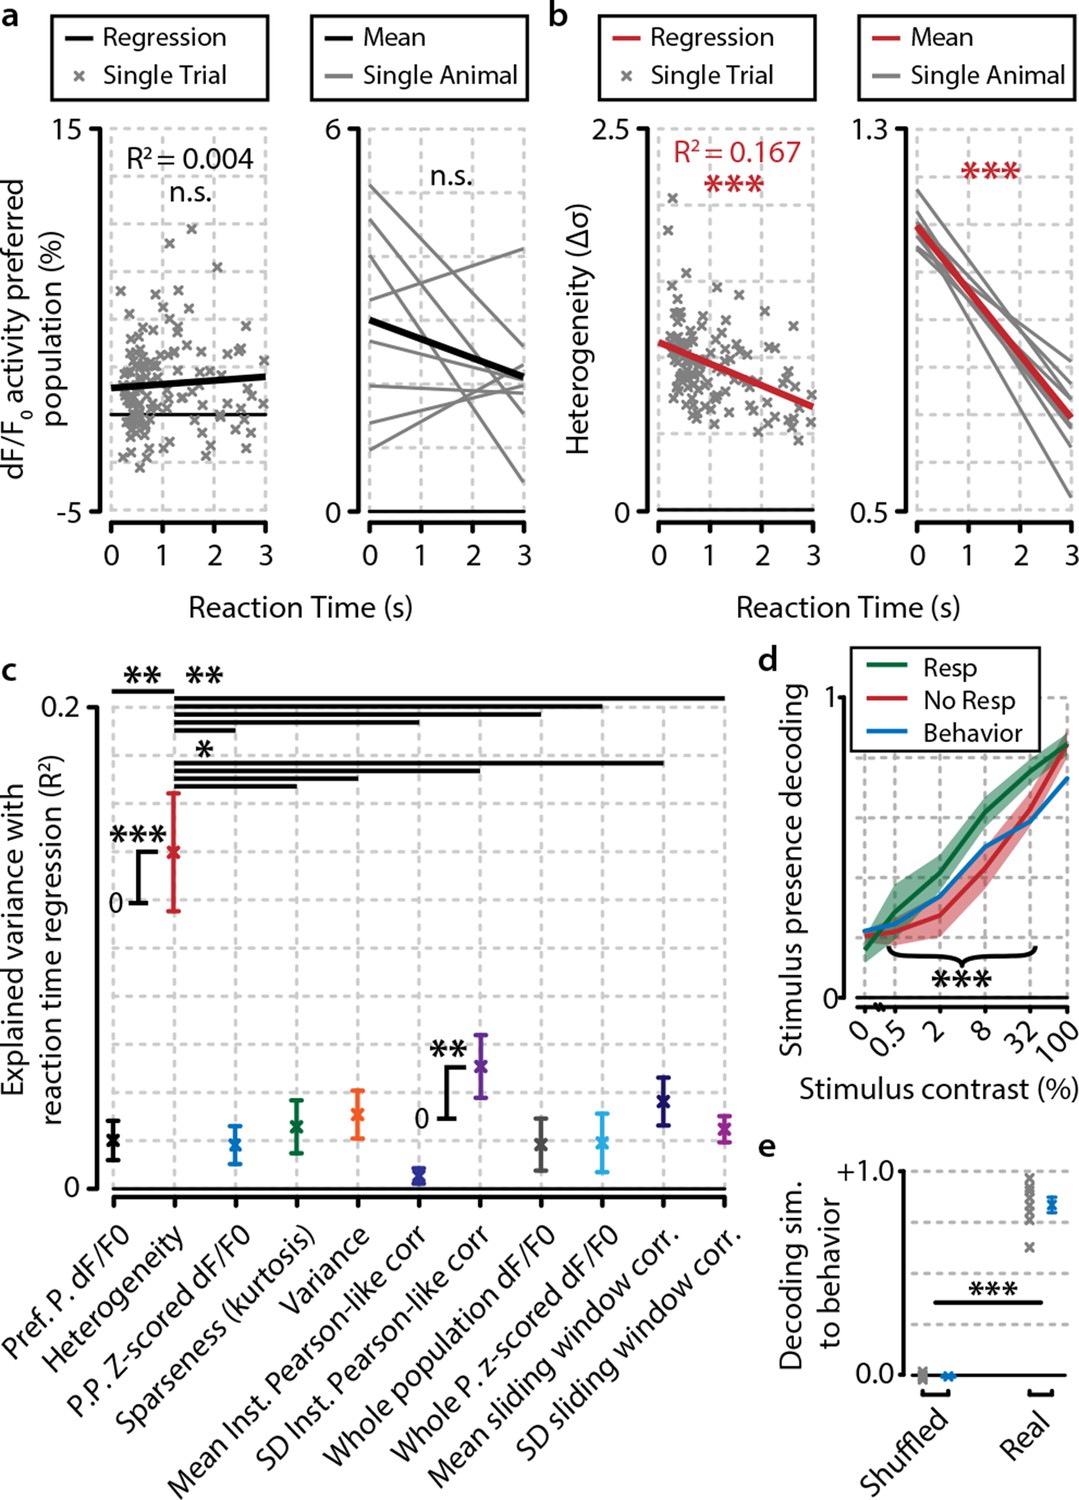
(a) Reaction time shows no correlation with mean preferred population dF/F0 activity during stimulus presentation for any individual animal (left panel; example animal) nor for the meta-analysis over animals (right panel; FDR-corrected one sample t-test over individual regression slopes per animal, n=8, n.s.). (b) Same as (a) but for heterogeneity. Heterogeneity shows a strong correlation with reaction time (left panel; example animal, p<0.001) as well as well for the meta-analysis over animals (p<0.001). (a, b) Note different y-axis scaling per panel for display purposes. (c) Comparison of the explained variance of several neural metrics. Only heterogeneity (FDR-corrected one sample t-test, p<0.001) and spread (SD) in instantaneous Pearson-like correlation (see ‘Materials and methods’) (p<0.01) correlate significantly with reaction time; all other metrics do not [preferred-population (Pref. P.) dF/F0, preferred-population (P.P.) z-scored dF/F0, variance, sparseness (kurtosis) mean instantaneous Pearson-like correlation, whole-population (z-scored) dF/F0, mean and SD of sliding window correlation (width 1.0 s); all n.s.]. Heterogeneity explains more reaction-time-dependent variance than any other metric (FDR-corrected paired t-tests, all p<0.05). (d) Decoding of stimulus presence shows similar accuracy as actual behavioral performance by the animals (Figure 1e). When the animal has detected the stimulus (resp.; green line), the decoder is better able to correctly judge its presence (a value of 1 indicates perfect performance, paired t-test, p<0.001). Shaded areas show the standard error of the mean. (e) Behavioral detection performance is more similar (sim.) to the optimal decoder’s performance than expected by chance (paired t-test, n=8 animals, shuffled vs. real similarity, p<0.001). Gray: single animal; blue: mean across animals. All panels: error bars/shaded regions show standard error of the mean. Statistical significance: *p<0.05; ***p<0.01; ***p<0.001.
Figure 4—figure supplement 1
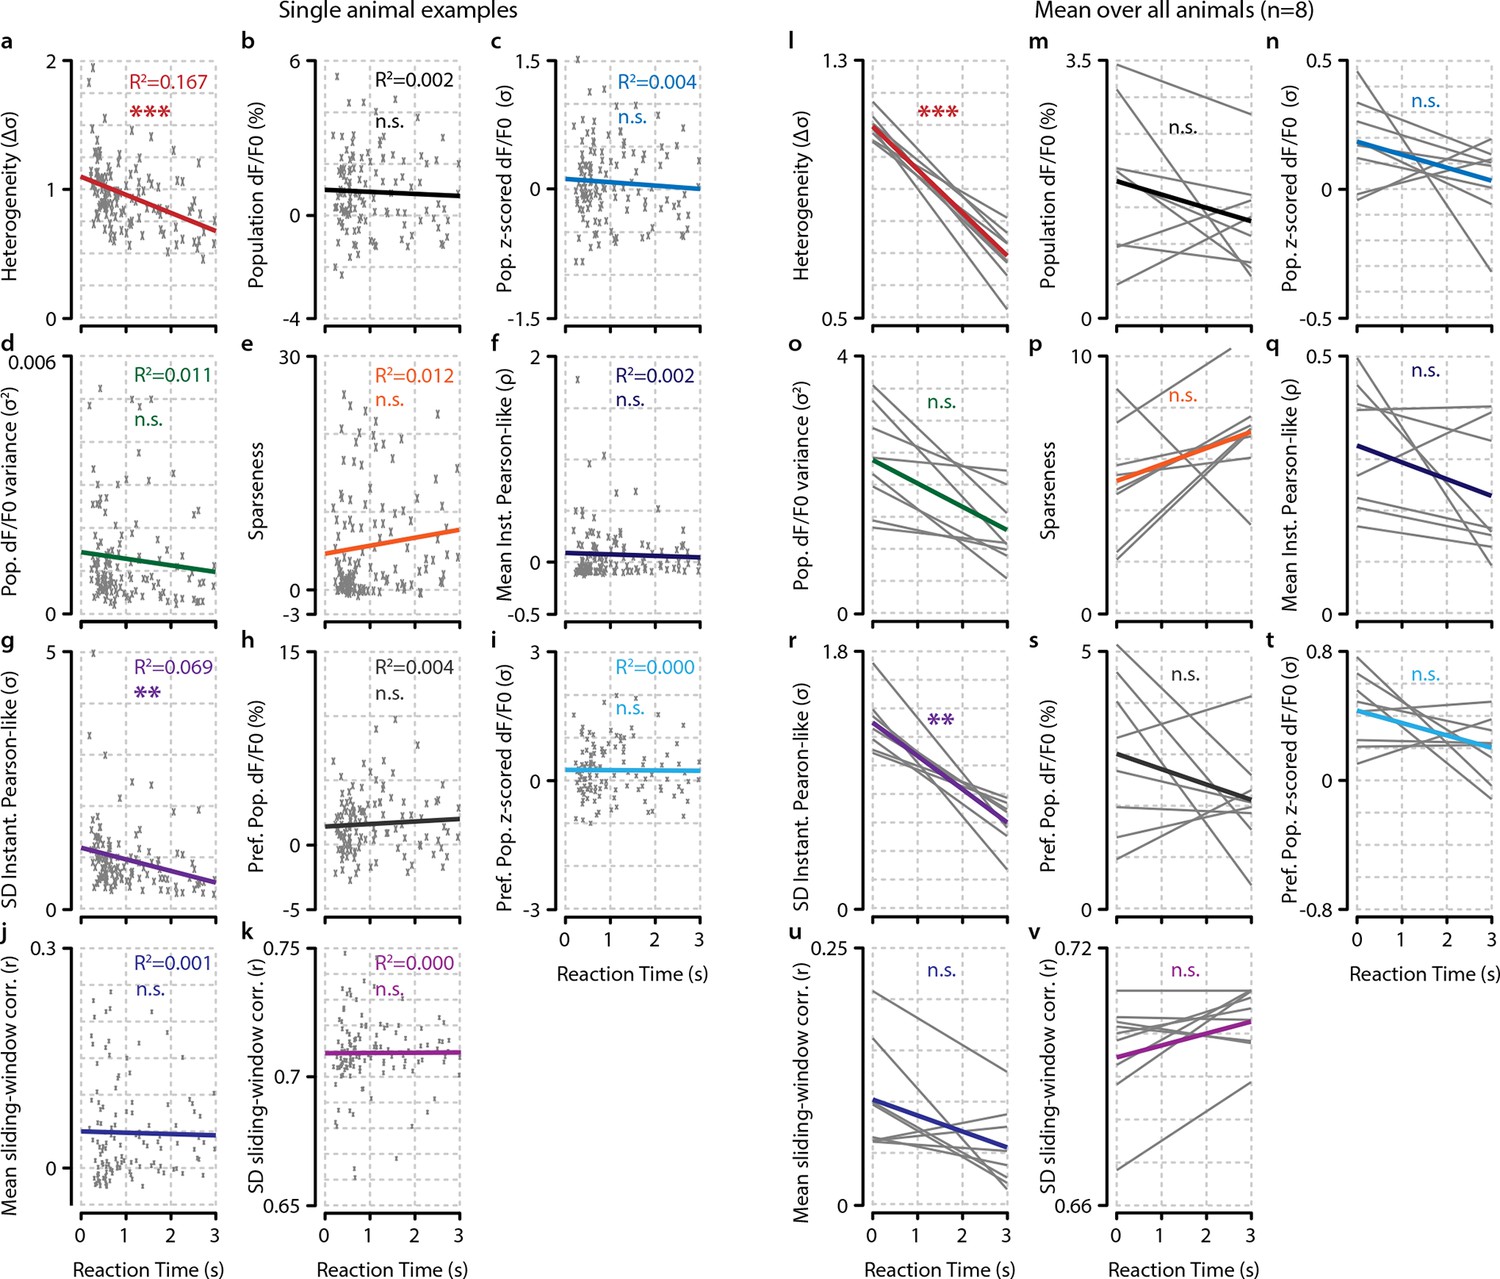
Of several tested neural metrics, only heterogeneity and spread (SD) in instantaneous Pearson’s correlations show a significant relationship with behavioral reaction time (RT).
(a–k) RT relationship of several metrics for example single animal. Each gray point represents a single trial. (a) Heterogeneity plotted as a function of RT (Bonferroni–Holmes corrected regression slope vs. 0, p<0.001). (b) population dF/F0 (n.s.). (c) z-scored dF/F0 (n.s.). (d) variance (n.s.). (e) population sparseness (kurtosis) (n.s.). (f) mean instantaneous Pearson’s correlation (n.s.). (g) spread (SD) in instantaneous Pearson’s correlation (p<0.01). (h) Mean dF/F0 of preferred population (pref. pop.) (n.s.).(i) Mean z-scored dF/F0 of preferred population (P.P.) (n.s.). (j) mean of sliding window correlations (n.s.). (k) Spread (SD) of sliding window correlations (n.s.). (l–v) As (a–k) but for analysis across animals. Each gray line represents the linear regression of a single animal. Nongray lines represent the mean linear regression over all animals. Statistical significance of behavioral reaction time relationship was determined using Bonferroni–Holmes corrected one-sample t-tests of the slopes of all animals versus 0. Heterogeneity (p<0.001) and spread in instantaneous Pearson’s correlation (p<0.01) were significant; all other metrics were not (p>0.3). All panels: shaded areas show the standard error of the mean. Asterisks indicate statistical significance: *p<0.05; **p<0.01; ***p<0.001.
Figure 4—figure supplement 2
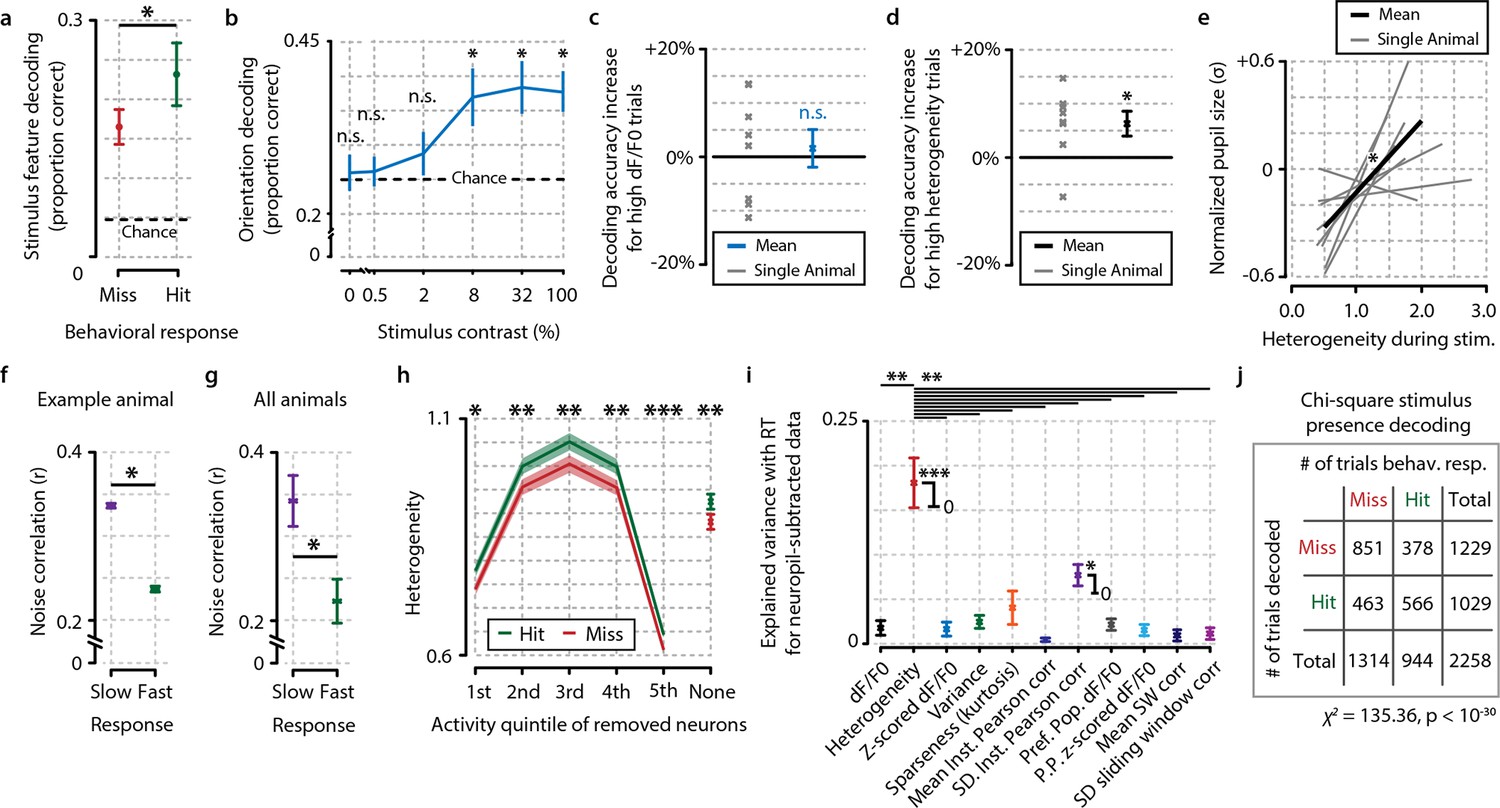
Fidelity of stimulus feature representation and population heterogeneity are correlated with accurate visual detection and are not influenced by neuropil contamination.
(a) Analysis with a maximum-likelihood-naive Bayes decoder shows that during hit trials stimulus features (orientation and contrast) are more accurately represented in the population response pattern than during miss trials (paired t-test, n=8 animals, p<0.05). (b) Orientation decoding as a function of stimulus contrast shows a sigmoid curve. Statistical analysis revealed significantly above-chance orientation decoding for contrasts higher than 2% [post hoc FDR-corrected one-sample t-tests vs. chance level (25%; four orientations were used); 0%, p=0.724; 0.5%, p=0.721; 2%, p=0.410; 8%, p<0.05; 32%, p<0.05, 100%, p<0.05]. (c, d) Orientation decoding accuracy does not increase when only strong responses to stimuli are taken into account (c, one-sample t-test, p=0.669) but does increase for high population heterogeneity (d) (p<0.05). (e) Mean pupil size 1 s preceding stimulus onset is correlated with neuronal population heterogeneity during stimulus presentation, suggesting pre-stimulus arousal is related to heterogeneity (regression analysis per animal, one-sample t-test of slopes vs. 0, p<0.05, n=8 animals). (f) Comparison of noise correlations (NCs) during slow and fast behavioral response trials for an example animal shows a significant reduction in NCs when the animal responds fast (two-sample t-test, p<0.05, n=2211 pairs). (g) Analysis across animals shows that this reduction is consistent (p<0.05, n=8 animals). (h) Difference in heterogeneity between hit and miss trials is a population-distributed process and does not critically depend on selecting the most, or least, active neurons. On a single-trial basis, we removed a single quintile of neurons within a z-scored activity bracket and recalculated the hit/miss difference after removal of this quintile (see ‘Materials and methods’). While removal of the least (1st quintile) or most (5th quintile) active neurons per trial led to a decrease in absolute heterogeneity, the differences between hit and miss trials remained intact (paired t-tests hit vs. miss, n=8, 1st quintile p<0.05, 2nd p<0.005, 3rd <0.005, 4th p<0.005, 5th p<0.001, no removal, p<0.005). Data show mean and standard error over animals (n=8). (i) As Figure 4c, but when computed for neuropil-subtracted data (see ‘Materials and methods’). Explained variance values were quite similar for most measures and the difference between heterogeneity and the other metrics appeared larger than without neuropil subtraction. All panels: error bars and shaded areas indicate the standard error of the mean. Asterisks indicate statistical significance: *p<0.05; **p<0.005; ***p<0.001. (j) Chi-square analysis of stimulus presence decoding versus behavioral response show a strong correspondence at single-trial level between the decoder’s output and the animal’s response (p<10–30).
Figure 5 with 1 supplement
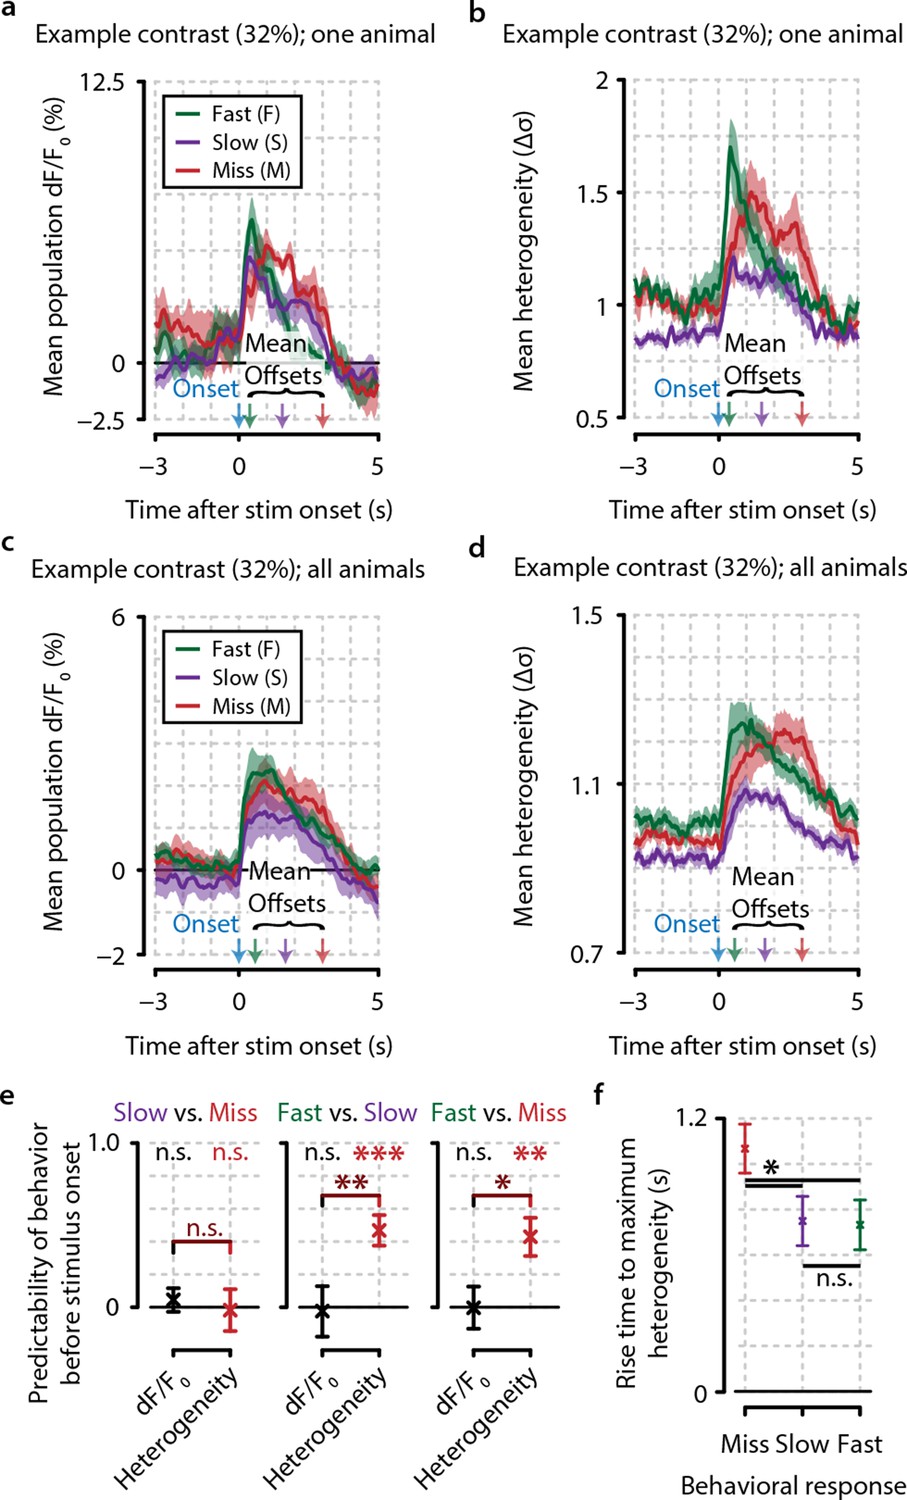
Heterogeneity preceding stimulus onset predicts behavioral reaction time.
(a, b) Example traces from one example animal for population dF/F0 (a) and heterogeneity (b) of fast (F, green), slow (S, purple), and miss (M, red) responses (mean ± standard error over trials) also showing mean stimulus offsets. (c, d) As (a, b) but showing mean ± standard error over animals. (e) Fast behavioral responses are predictable before stimulus onset using heterogeneity [FDR-corrected one-sample t-tests vs. chance level (0); S–M, p=0.799; F–S, p<0.001; F–M, p<0.01] but not using dF/F0 (FDR-corrected one-sample t-tests vs. chance level; S–M, p=0.157; F–S, p=0.811; F–M, p=0.924; FDR-corrected paired t-test for heterogeneity vs. dF/F0; S–M, p=0.477; S–F, p<0.01; F–M, p<0.05). (f) The population heterogeneity during stimulus presentation does not merely reflect a continuation of pre-stimulus neural state; detected stimuli (slow and fast responses) elicit a faster rise to the maximum heterogeneity level than undetected stimuli (miss trials) (paired t-tests, n=8 animals, p<0.05). Slow and fast responses do not differ significantly (p>0.05). All panels: error bars/shaded areas indicate standard error of the mean. Statistical significance: *p<0.05; **p<0.01; ***p<0.001.
Figure 5—figure supplement 1
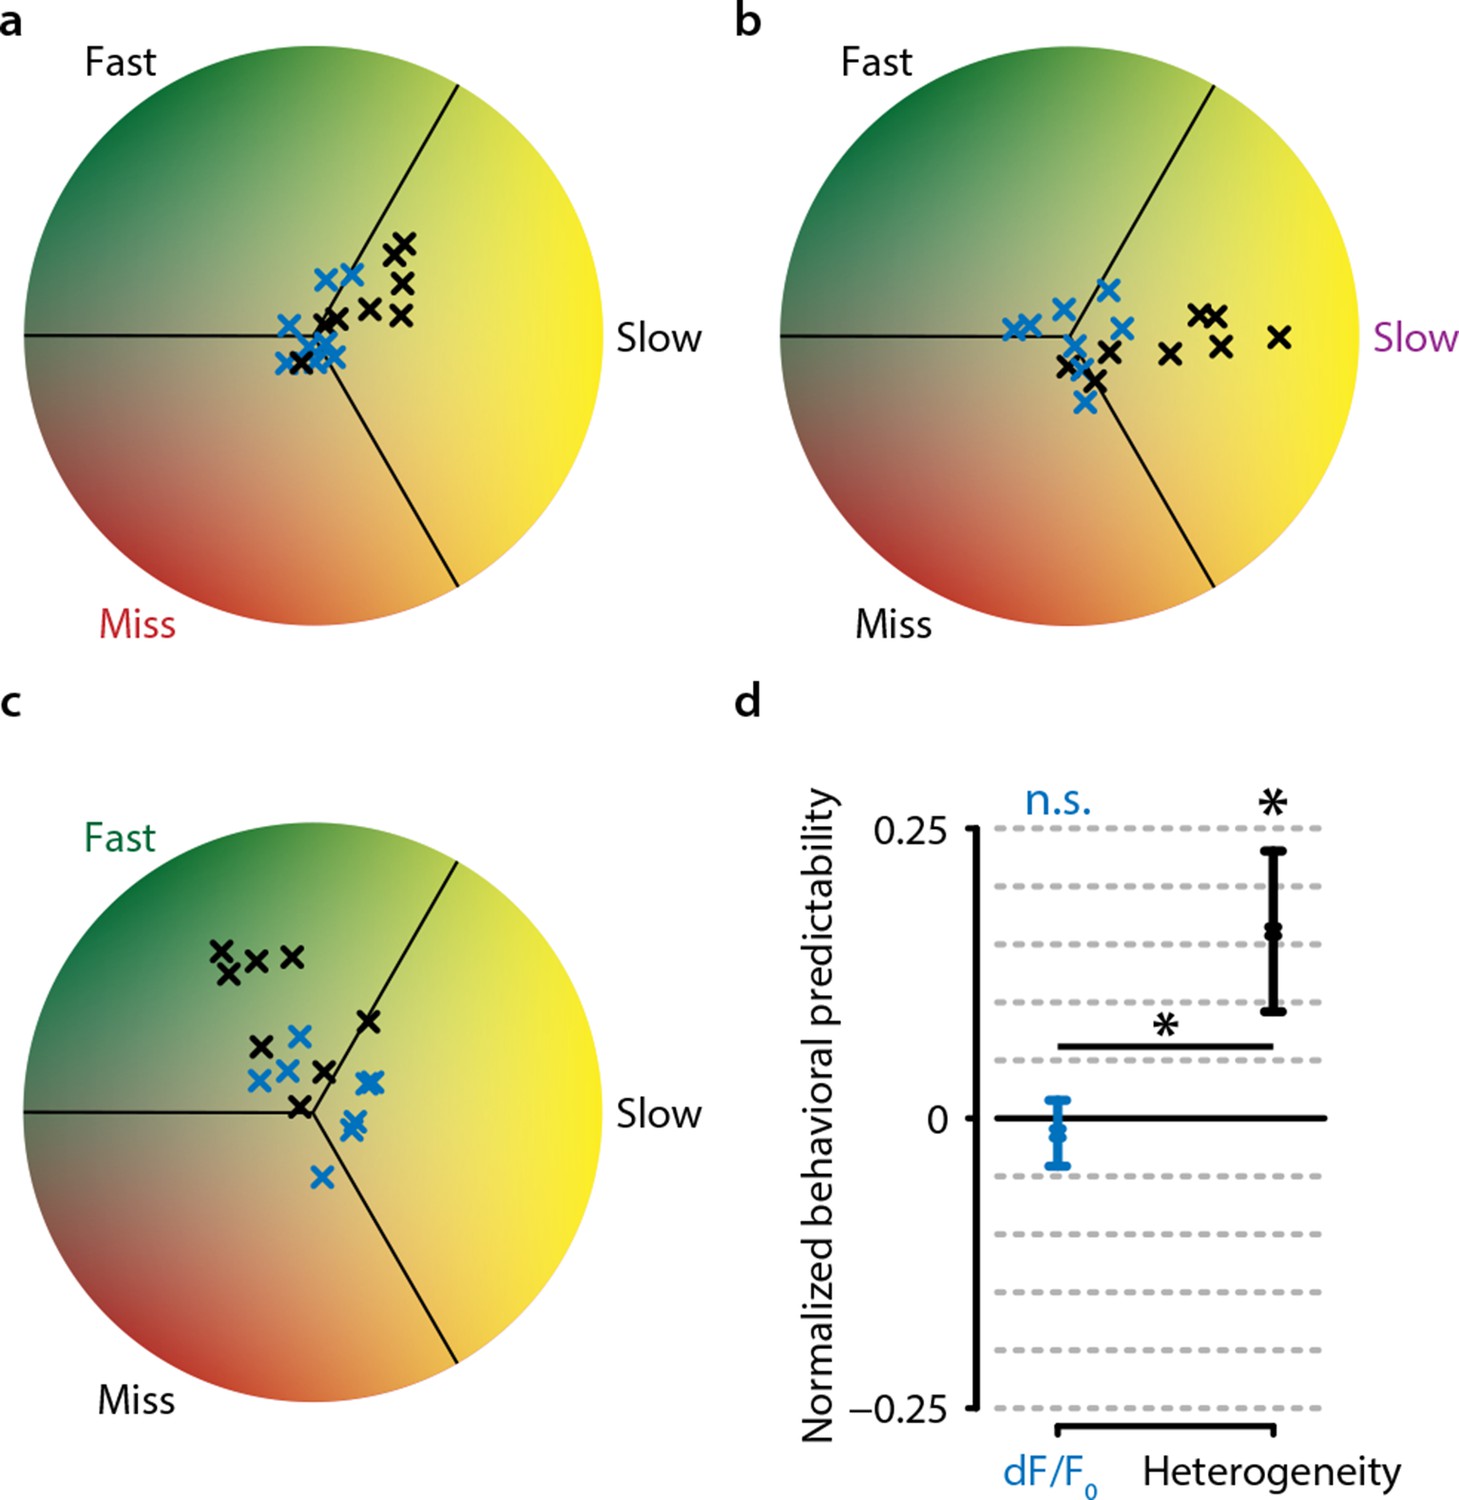
Behavioral response is predictable on single trials when using heterogeneity, but not when using dF/F0.
(a) Predictive decoding of miss trials using mean population dF/F0 (blue) or heterogeneity (black) during 3 s preceding stimulus onset. Each point is the mean prediction for a single animal (see ‘Materials and methods’). (b) same as (a) but for slow trials. (c) same as (a) but for fast trials. (d) Quantification of predictability shows chance-level prediction using dF/F0 (one-sample t-test, p=0.643) but above-chance prediction of behavioral responses using heterogeneity (p<0.05) as well as a significant difference in prediction performance between dF/F0 and heterogeneity (paired t-test, p<0.05). Points with error bars are mean ± standard error (n=24; three points per animal: miss/slow/fast).
Figure 6
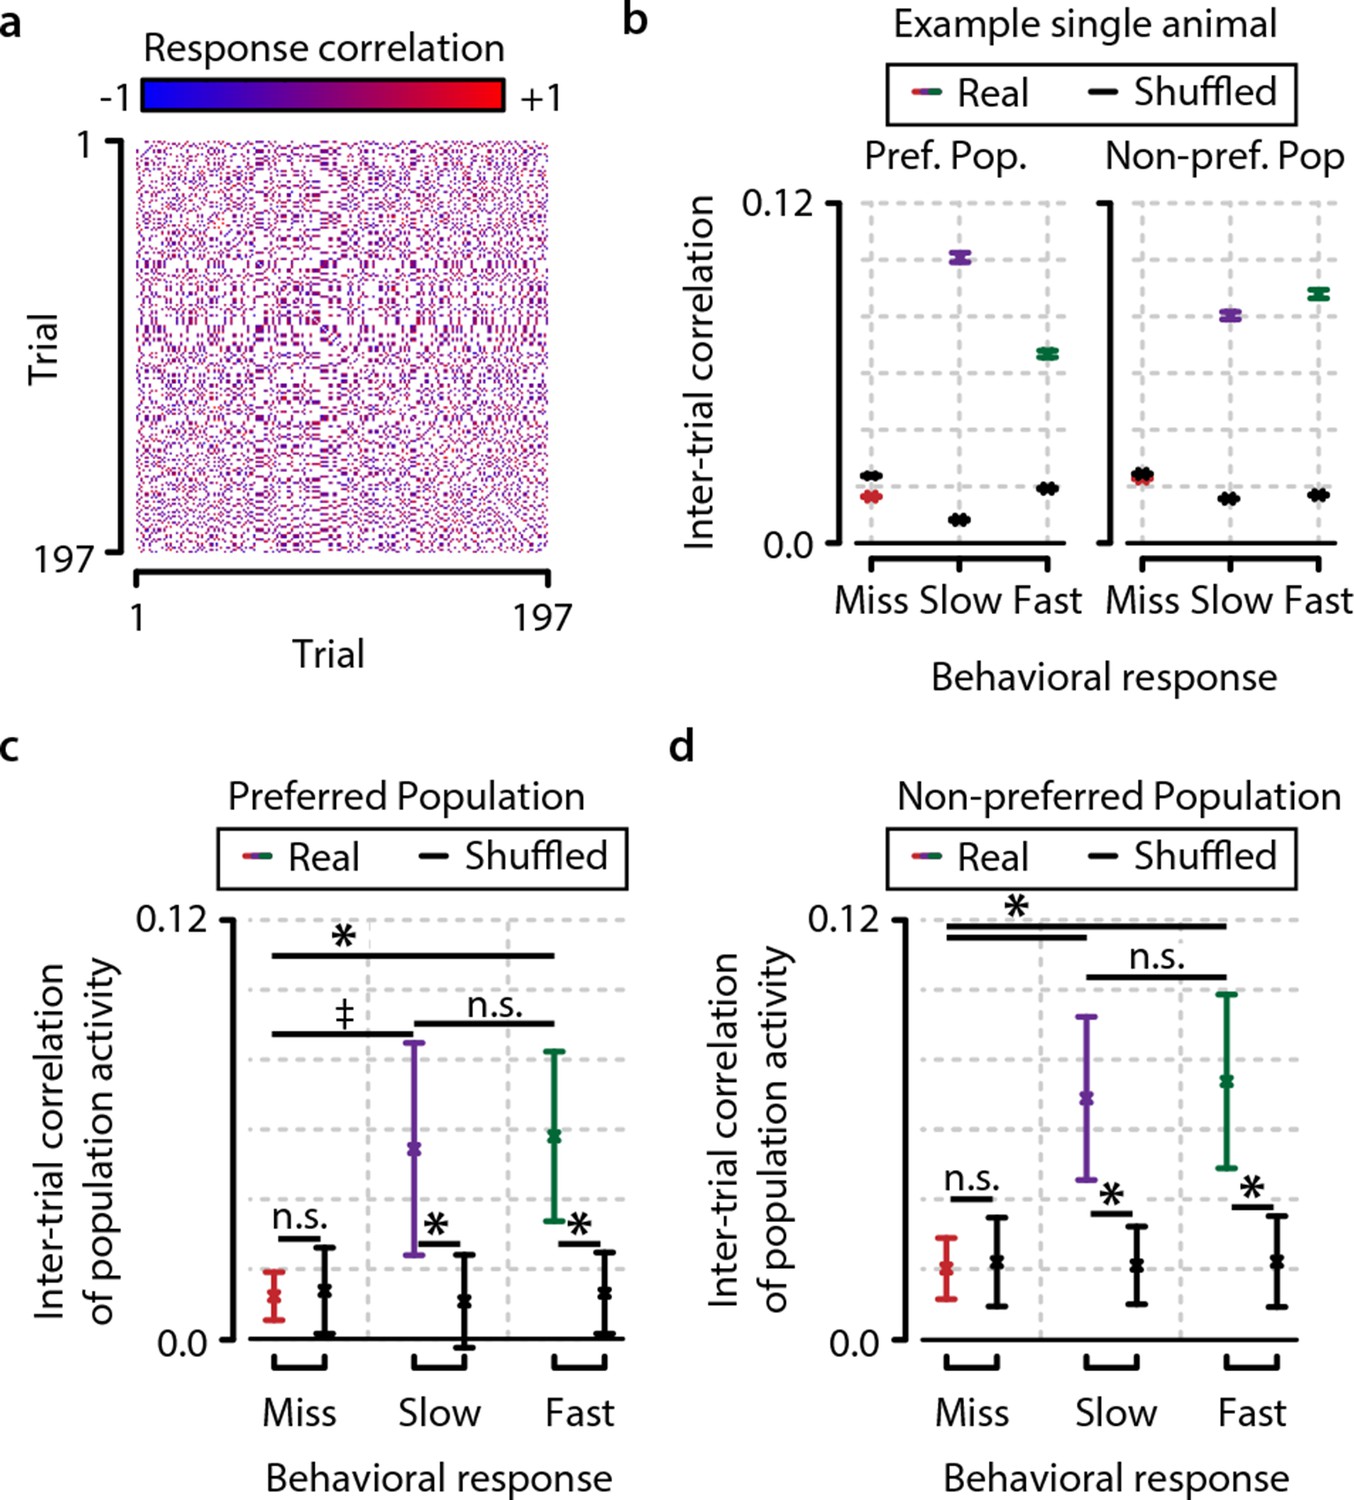
Consistency in population activation patterns across trials is increased during hit trials (fast and slow) compared to miss trials.
(a) Data from example animal showing inter-trial correlations (Pearson’s r) between population responses to same-orientation stimuli (pooled over test contrasts only). (b) Data from same animal as in panel (a), showing population higher activity pattern consistency (mean ± standard error over trial pairs) for fast and slow response trials than miss trials within both the preferred and nonpreferred population. Colored lines show real data, and black lines show shuffled data (see text and ‘Materials and methods’). (c, d) Inter-trial correlations (mean ± standard error over all animals) as quantification of population activation pattern consistency are significantly higher during fast trials (with a trend for slow trials) than during miss trials within the preferred as well as the nonpreferred neuronal population, suggesting that visual stimulus detection is correlated with the occurrence of more stereotyped population responses (FDR-corrected paired t-tests, preferred population; miss-slow, p=0.081; miss-fast, p<0.05; slow-fast, n.s.; nonpreferred population; miss-slow, p<0.05; miss-fast, p<0.05; slow-fast, n.s.). Comparison with correlations of shuffled data yielded similar results (both preferred and nonpreferred populations; paired t-test real vs. shuffled: miss; p>0.2, slow and fast; p<0.05). Error bars indicate standard error. Statistical significance: * p<0.05; ‡ 0.05<p<0.1.
Figure 7
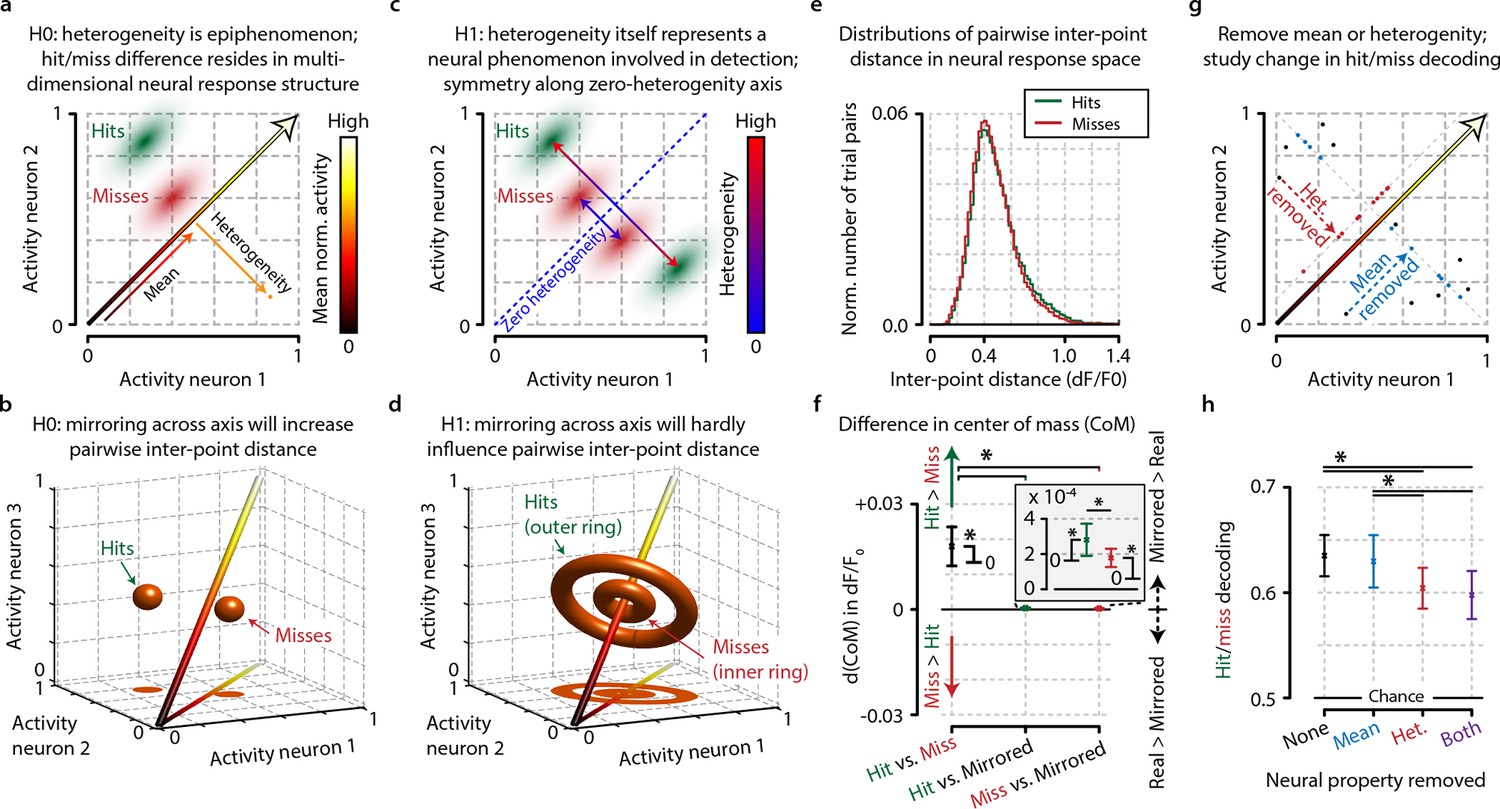
Conceptual interpretation of heterogeneity as neuronal population coding phenomenon.
(a–d) The mean population activity during a certain time epoch can be visualized a single point in multidimensional neural space, where every axis represents the activity of a single neuron. (a) For an example population of two neurons, the main diagonal (arrow) represents the line along which the mean population activity changes. Orthogonal to this line is the gradient along which heterogeneity changes, representing the distance of each point to the main diagonal. The effects of heterogeneity on hit/miss differentiation as reported in this study could be epiphenomenal if the real underlying differentiation depends on localized, segregated clusters of neural activity for hits (green cloud) and misses (red cloud). (b) This principle can be extended to multidimensional space; segregated clusters activity will show asymmetrical distributions of population activity around the diagonal. (c, d) Alternatively, heterogeneity itself could represent a fundamental characteristic of hit/miss differences; in this case, population responses should be distributed symmetrically around the diagonal (see text for more explanation). (e) Calculating the pairwise inter-point distance (each point being the population activity during a single trial) can reveal information about the underlying multidimensional structure of neuronal population activity. Green: distribution of inter-point distances for hit trials; red: same for miss trials. (f) Population responses during hit trials are distributed within a larger volume of neural space, as shown by the on average larger inter-point distance for hits than misses [paired t-test, difference in center of mass (d(CoM) hit vs. miss, p<0.05]. Mirroring point across the diagonal to assess symmetry shows a small, but significant asymmetry for hits and miss (both p<0.05) and larger asymmetry for hits than misses (p<0.05). This suggests that neuronal populations during hit trials show more structured behavior in a more extended neural space than during miss trials. (g) Schematic representation of how the mean, heterogeneity, or both can be removed from population responses to assess the effect they have on hit/miss separability (see also text and ‘Materials and methods’). (h) Removing heterogeneity impairs hit/miss decoding more than removing the mean (paired t-test, p<0.05) but in all cases (including removing both) the hit/miss separability is still well above chance (0.5). This suggests that heterogeneity is more important than population mean activity for differentiating stimulus detection from non-detection, but that other more complex neural phenomena account for most of the population response structure. All panels: error bars indicate standard error. Statistical significance: *p<0.05.
Author response image 1
Videos
Video 1
Typical raw data example showing the first 10,000 recorded frames from animal 5.
The left-hand side shows xy-corrected, but otherwise unaltered, raw fluorescence data. The legend above this raw data video shows the time after start of the experiment in seconds and the number of acquired frames. The top two panels on the right-hand side show (left) a depiction of the stimulation screen (gray isoluminant background or oriented drifting grating during stimulus presentation), and (right) whether the mouse is making a licking response. The two panels below show a live updated summary of mean dF/F0 (left) and heterogeneity (right) during each trial. Green indicates a licking response, and red indicates no response. The two lower panels show a live trace of mean population dF/F0 and heterogeneity. Licking responses are shown as red dotted lines, and stimulus presentations are shown as a gray shaded area. Note that the recording is very stable, except during periods of heavy licking, such as after hit responses, when reward is delivered. Also note that neural data acquired during licking are not used for any of our analyses and do, therefore, not influence our results. The mouse is licking vigorously during the initial period of the recording, but more typical behavior sets in less than 2 min after start of the recording. Near the end of the video, it can be seen that hits and misses are more easily separable using heterogeneity than dF/F0 (although this difference is stronger in the example video than in the entire data set as a whole).
Download links
A two-part list of links to download the article, or parts of the article, in various formats.
Downloads (link to download the article as PDF)
Open citations (links to open the citations from this article in various online reference manager services)
Cite this article (links to download the citations from this article in formats compatible with various reference manager tools)
Mouse V1 population correlates of visual detection rely on heterogeneity within neuronal response patterns
eLife 4:e10163.
https://doi.org/10.7554/eLife.10163


