Exploration of the metabolomic mechanisms of postmenopausal hypertension induced by low estrogen state
- Department of Cardiology, The Affiliated Hospital of Qingdao University, China
- Department of Urology, The Affiliated Hospital of Qingdao University, China
Figures
Figure 1
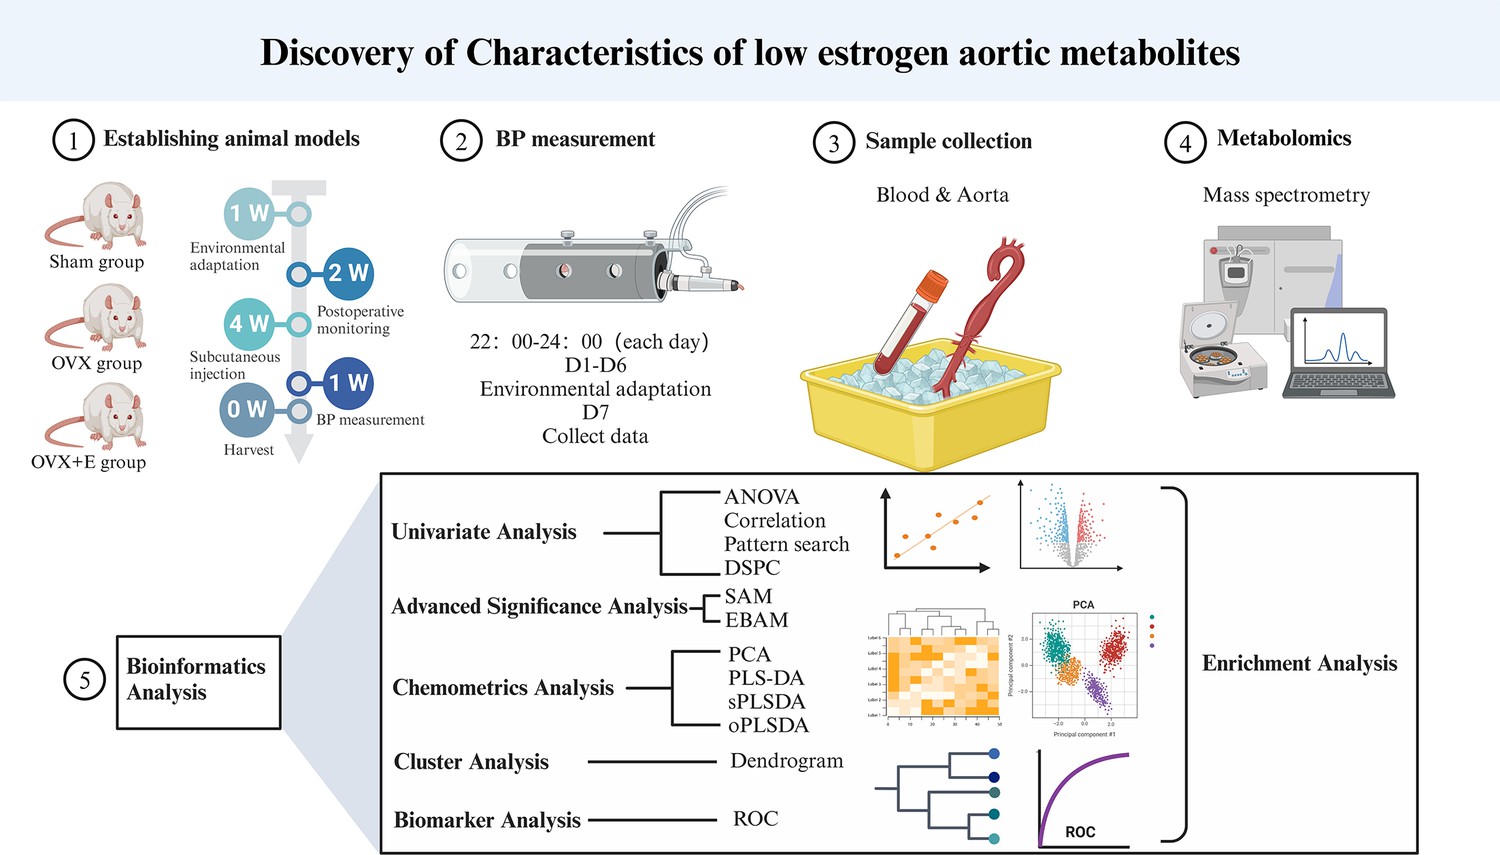
Research flowchart.
Figure 2
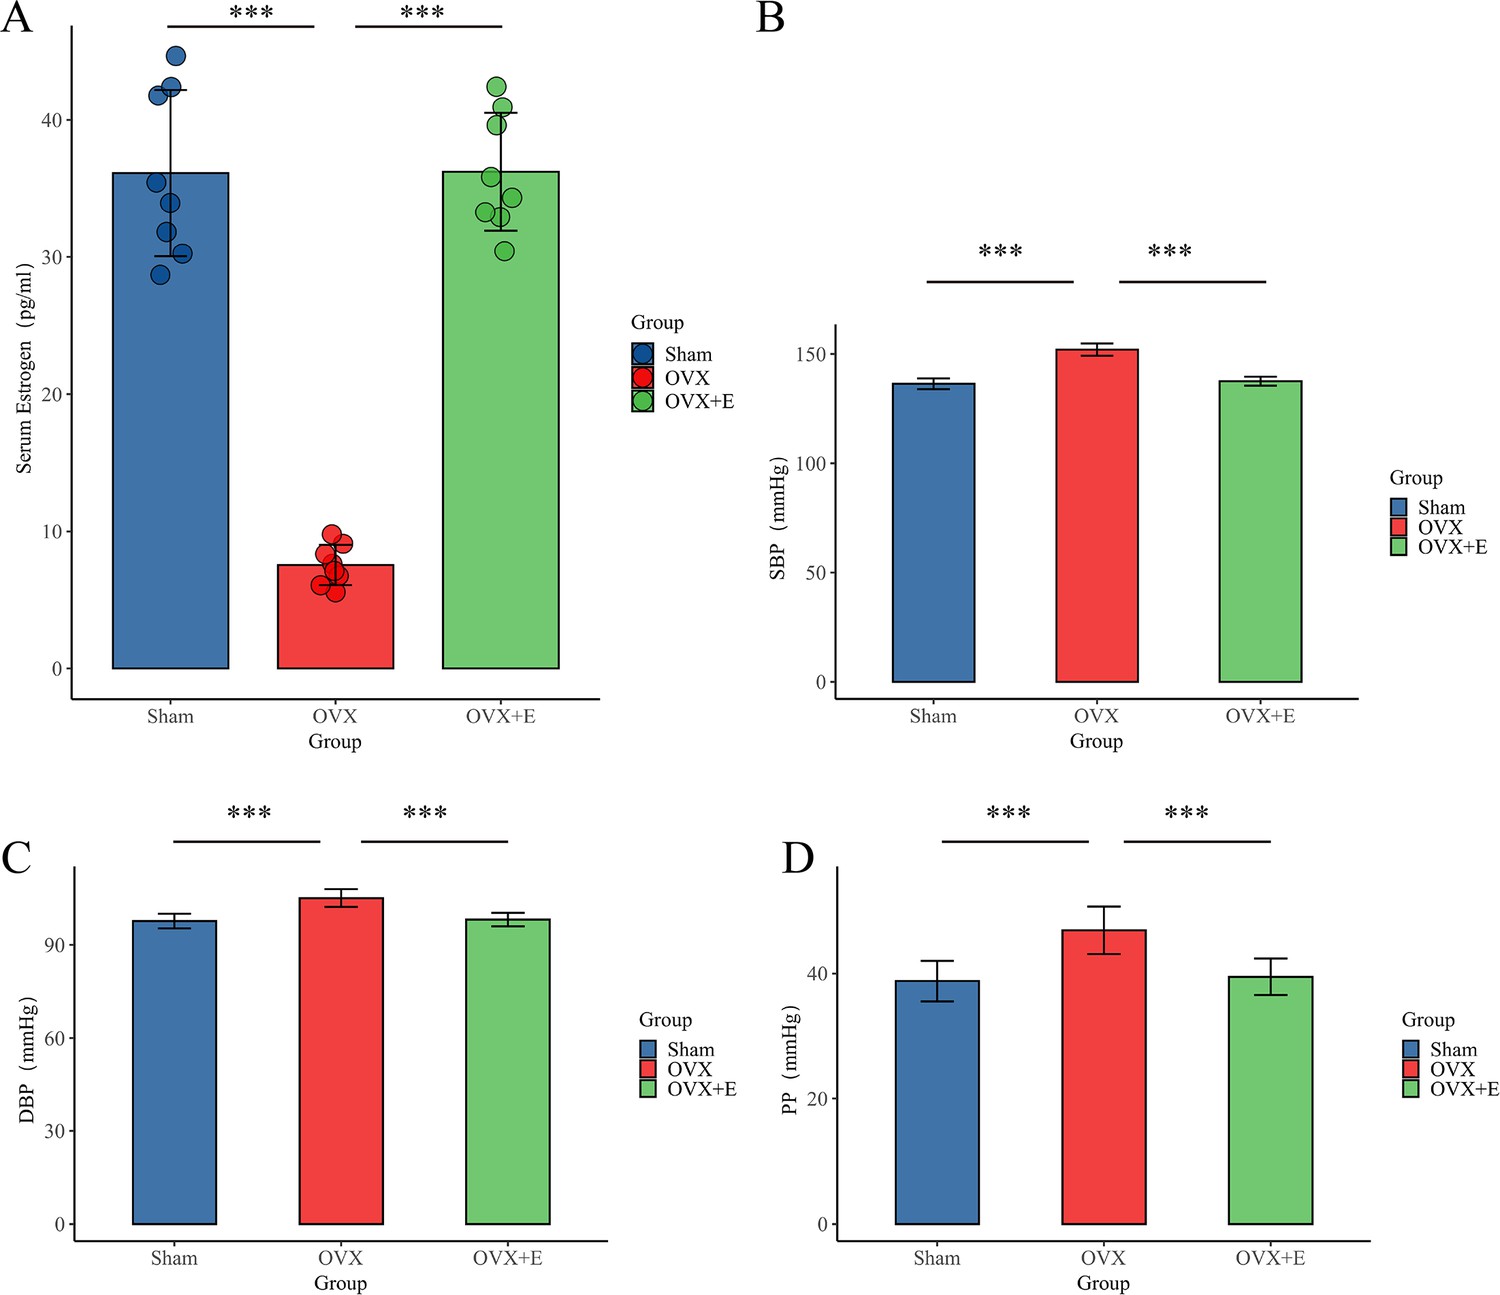
Establishment of animal Models.
(A) Serum estrogen concentration, n=8 per group (B). SBP of animal, n=8 per group (C) DBP, n=8 per group. (D) PP of animal, n=8 per group. ***p<0.001.
Figure 3 with 3 supplements
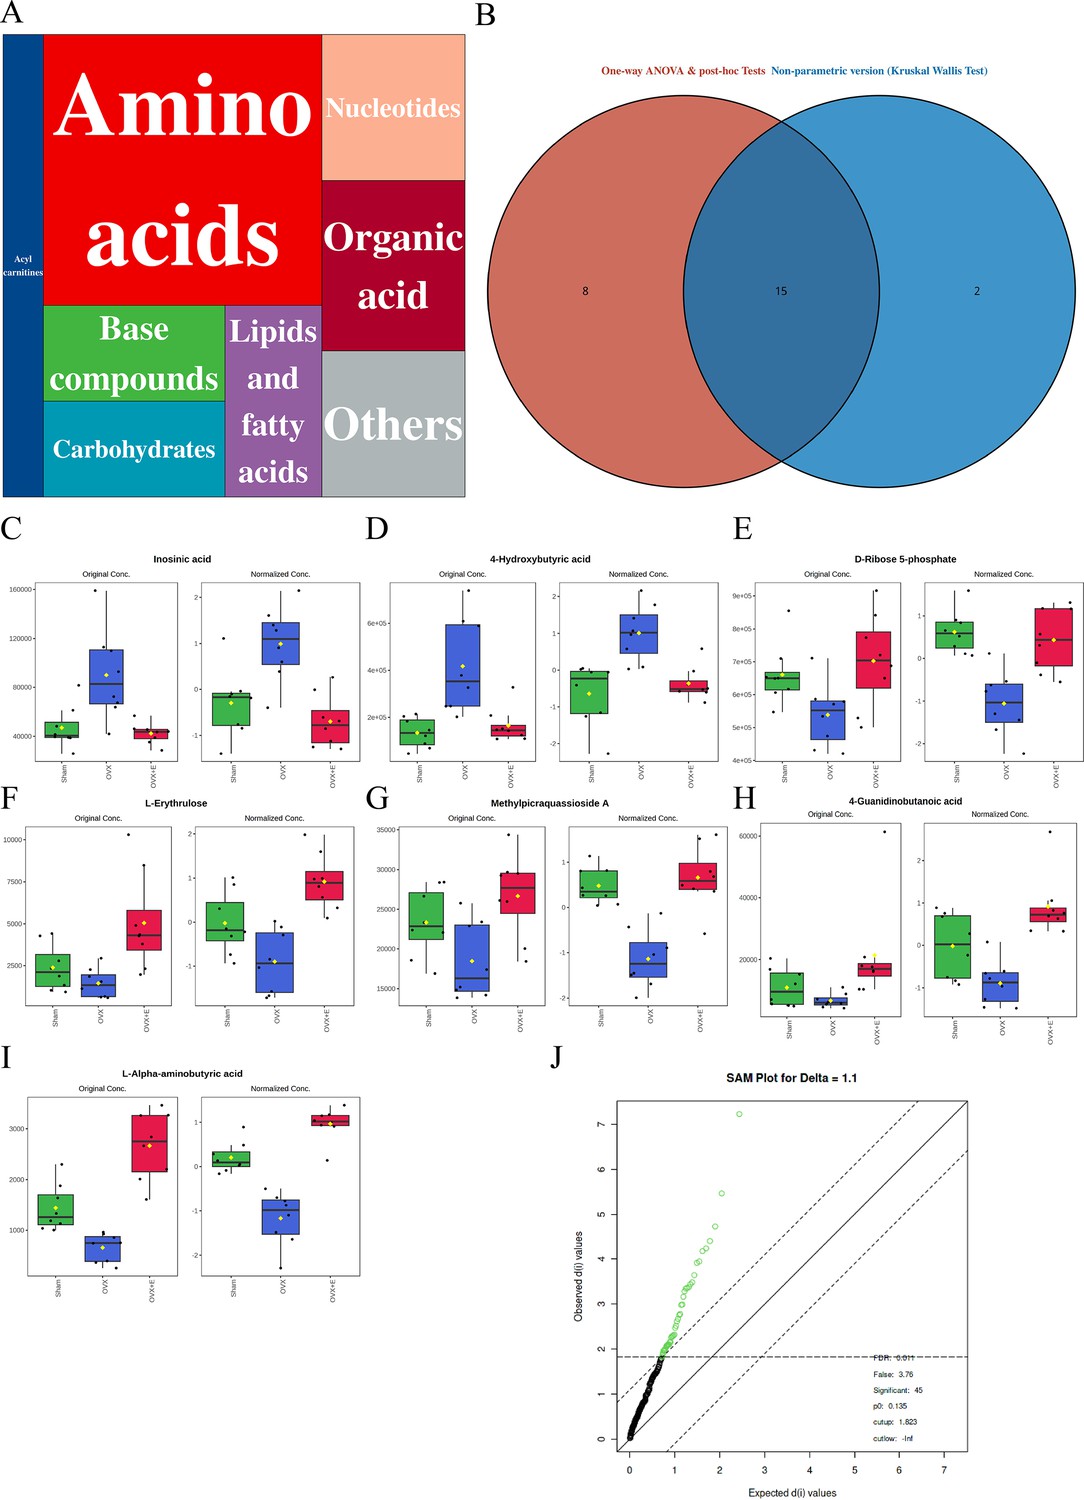
Overview of aorta metabolomics related to estrogen deprivation.
(A) Metabolite classification statistics chart. (B) Venn diagram of differential metabolites. (C–I) Bar chart of the expression levels of the most promising differential metabolites. (J) SAM analysis of differential metabolites.
Figure 3—figure supplement 1
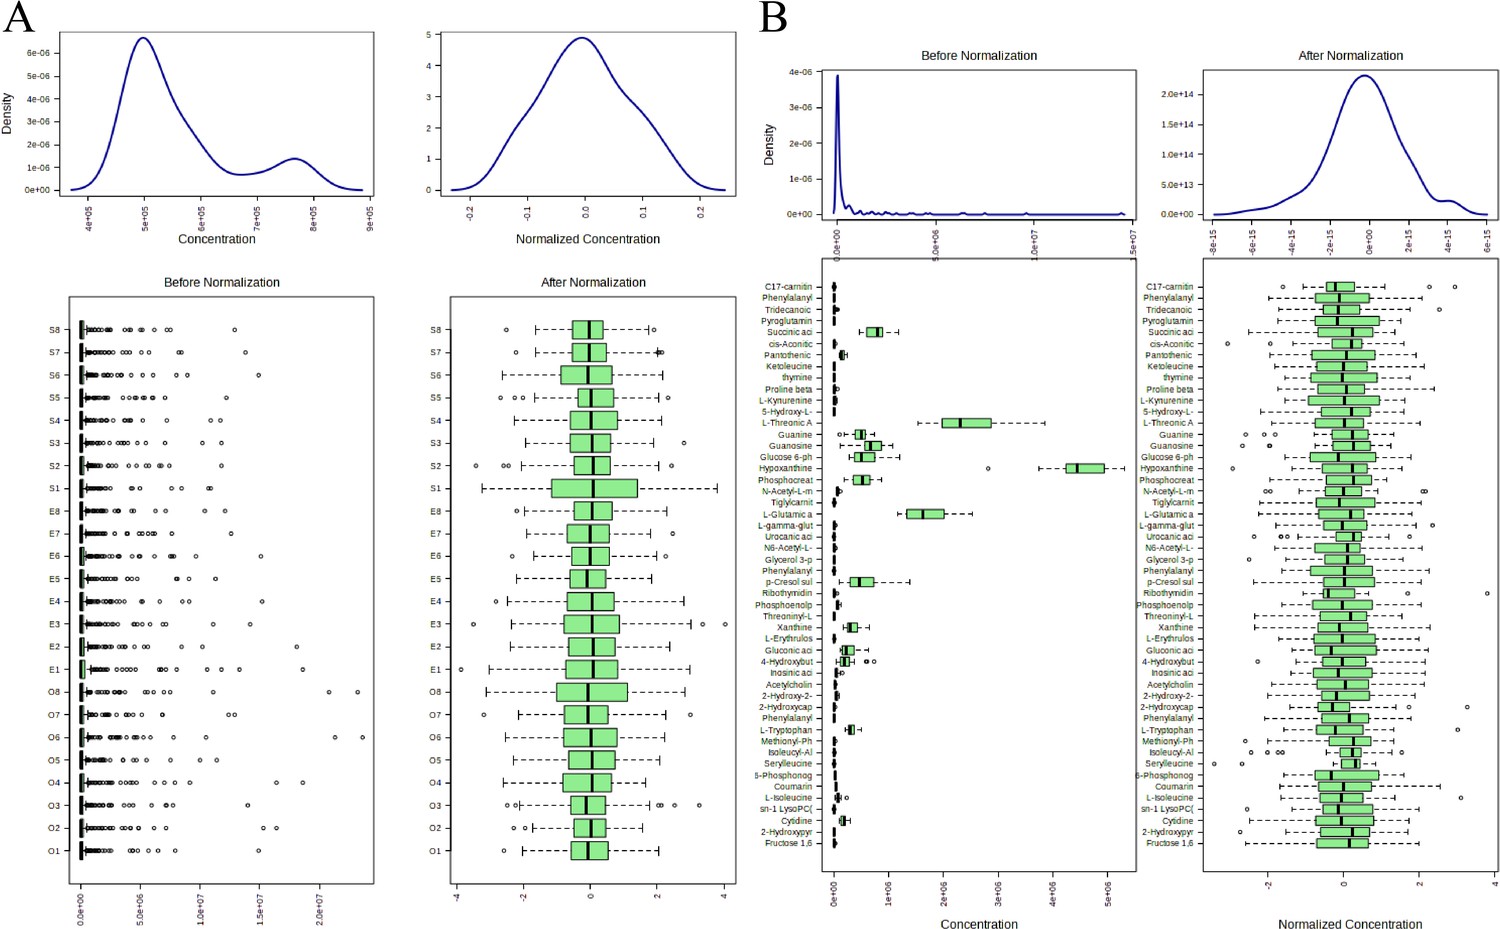
Normalization processing rendering.
(A) Distribution map of samples before and after normalization treatment. (B) Distribution map of metabolites before and after normalization treatment.
Figure 3—figure supplement 2
Multi-class significance analysis model.
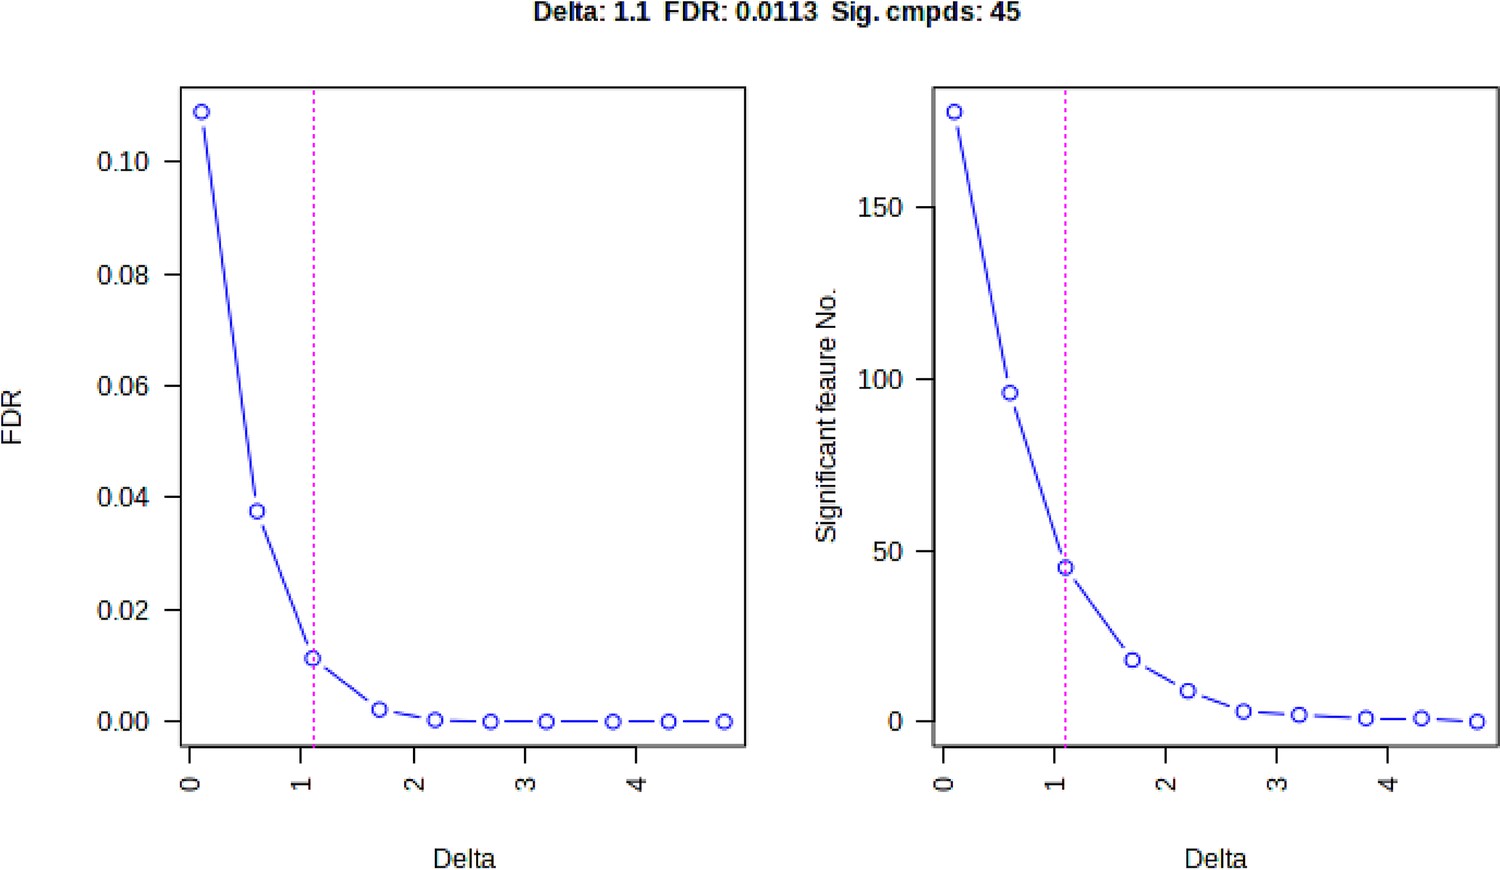
Figure 3—figure supplement 3
A heatmap of metabolite correlations.
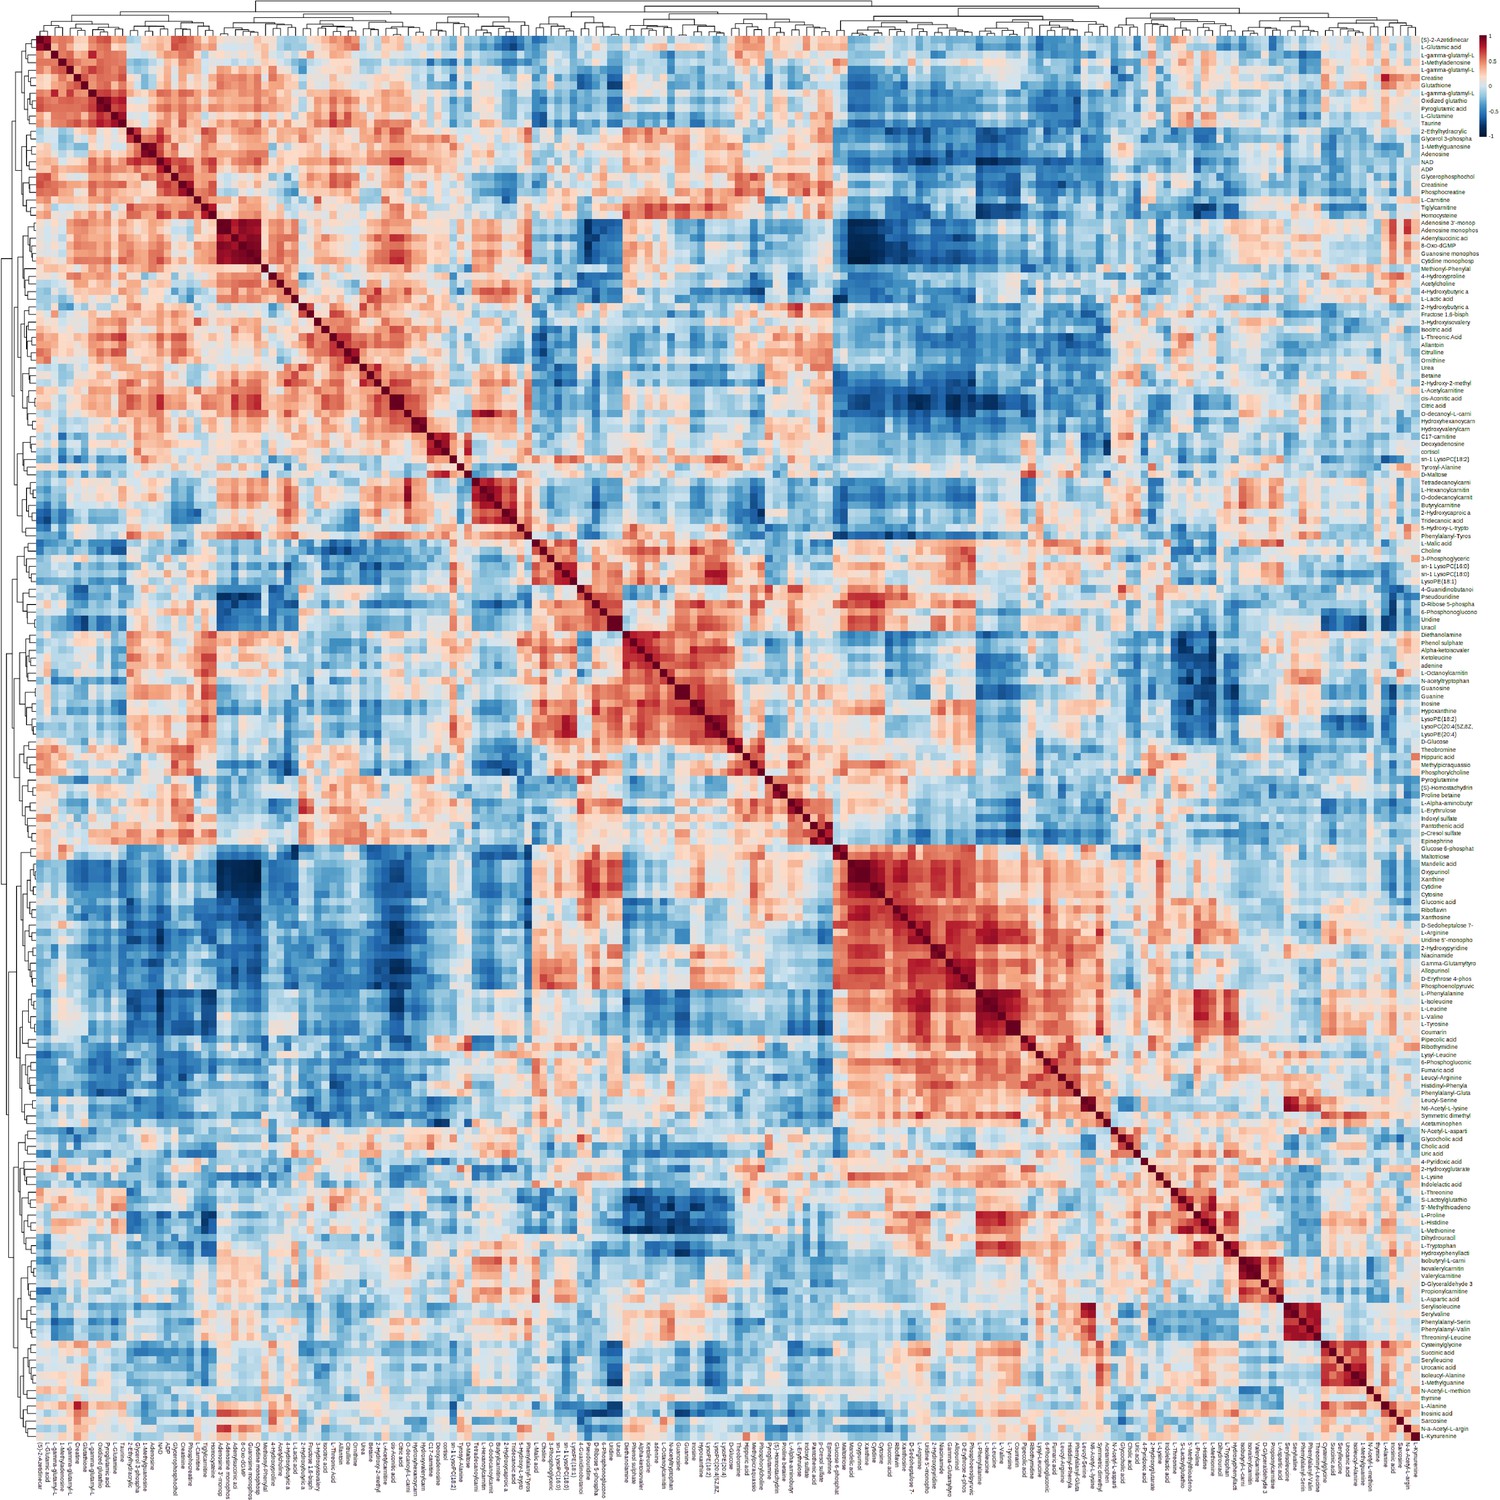
Figure 4
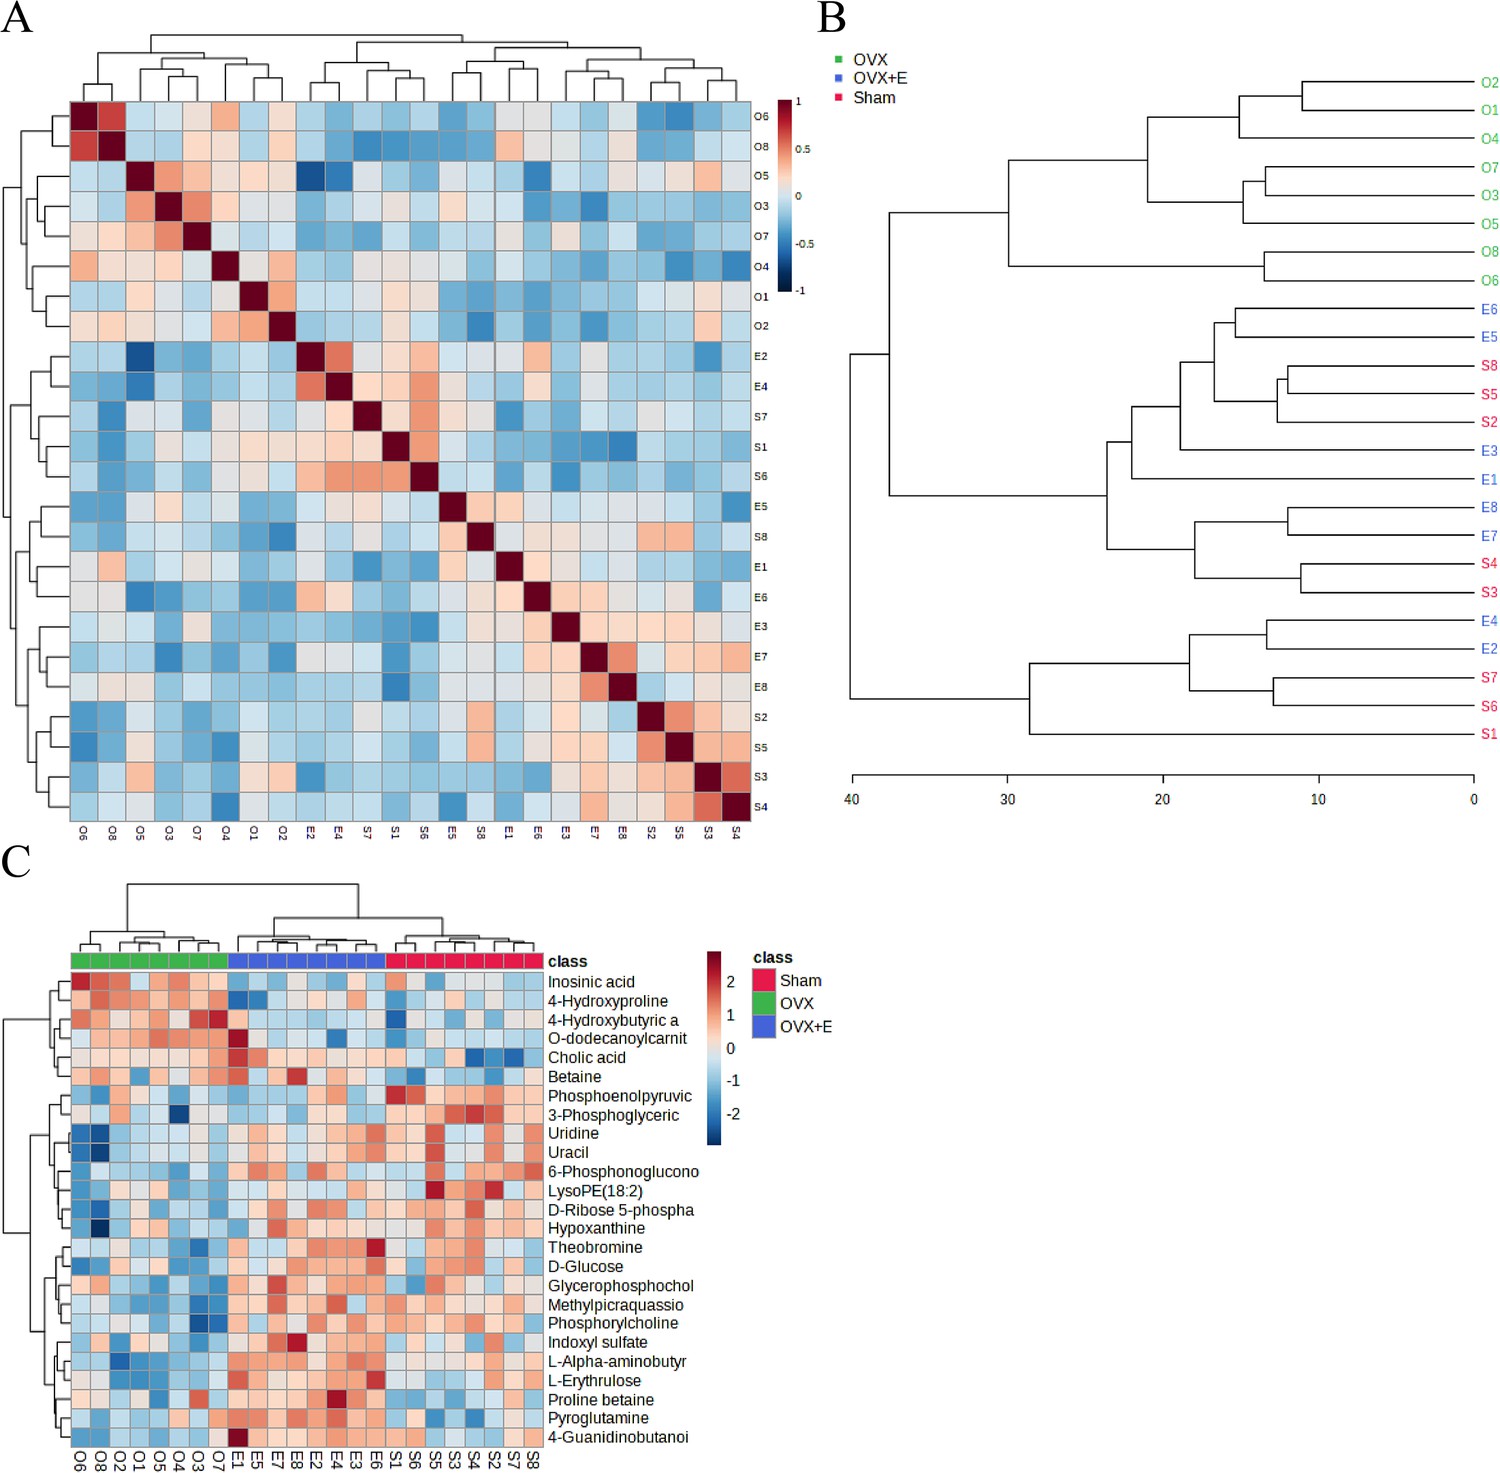
Correlation analysis of samples and differential metabolites.
(A) Pearson correlation analysis heatmap of samples. (B) Hierarchical clustering tree diagram of samples. (C) Hierarchical clustering heatmap of samples and metabolites.
Figure 5 with 1 supplement
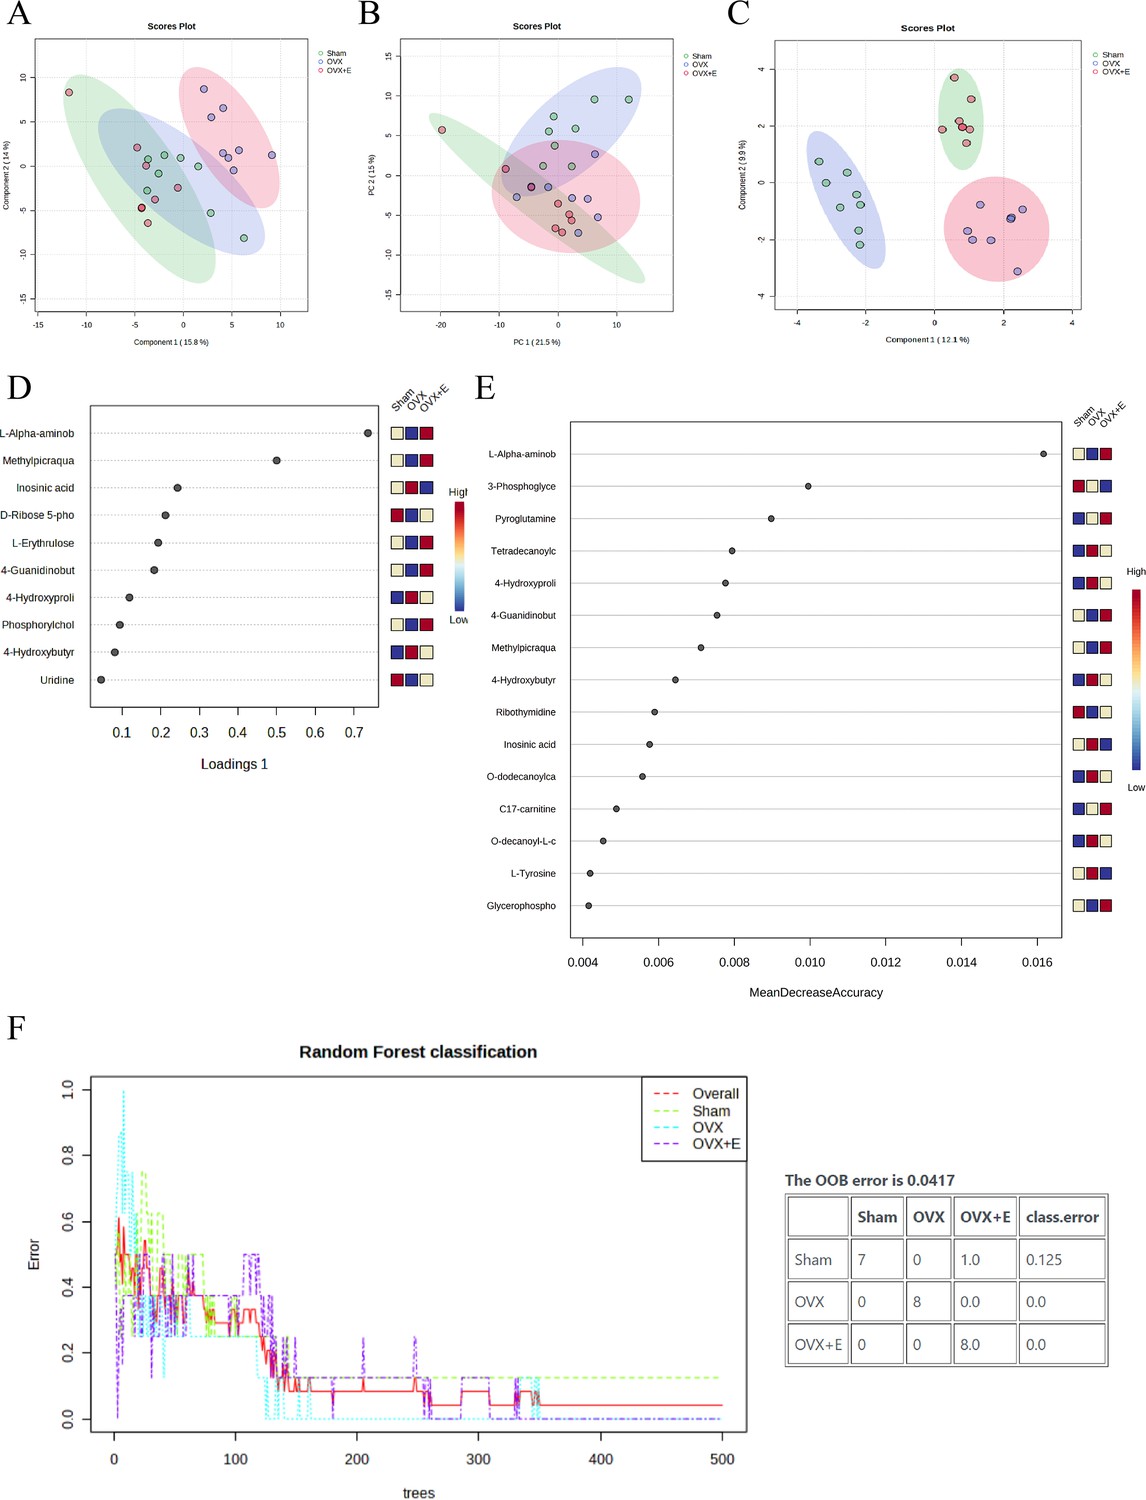
Overview of dimension reduction analysis.
(A) PCA scatter plot. (B) PLS-DA scatter plot. (C) sPLS-DA scatter plot. (D) VIP score of sPLS-DA model. (E) VIP score of RF model (F) OOB error for the random forest tree model.
Figure 5—figure supplement 1
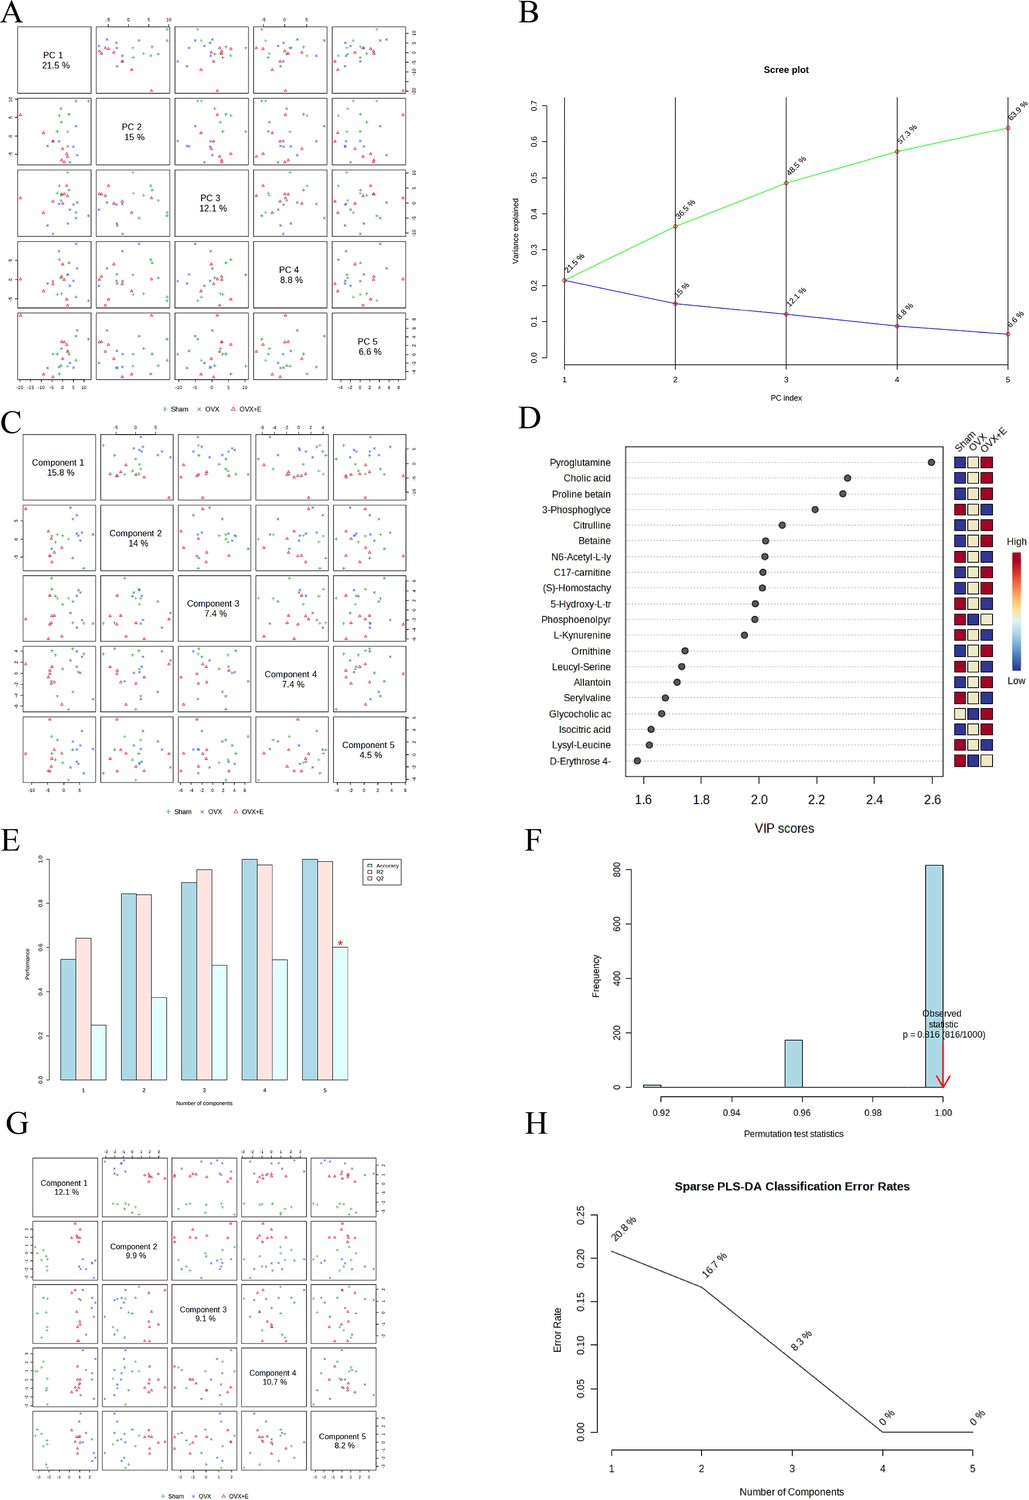
Dimension reduction analysis of the three groups.
(A) PCA plot among the three groups (B) PCA scree plot among the three groups. (C) PLS-DA plot among the three groups. (D) VIP score of OPLS-DA model among the three groups. (E) 5-fold CV of OPLS-DA model among the three groups. (F) OPLS-DA models permutations test among the three groups. (G) sPLS-DA plot among the three groups. (H) sPLS-DA classification error rates plot among the three groups.
Figure 6 with 1 supplement
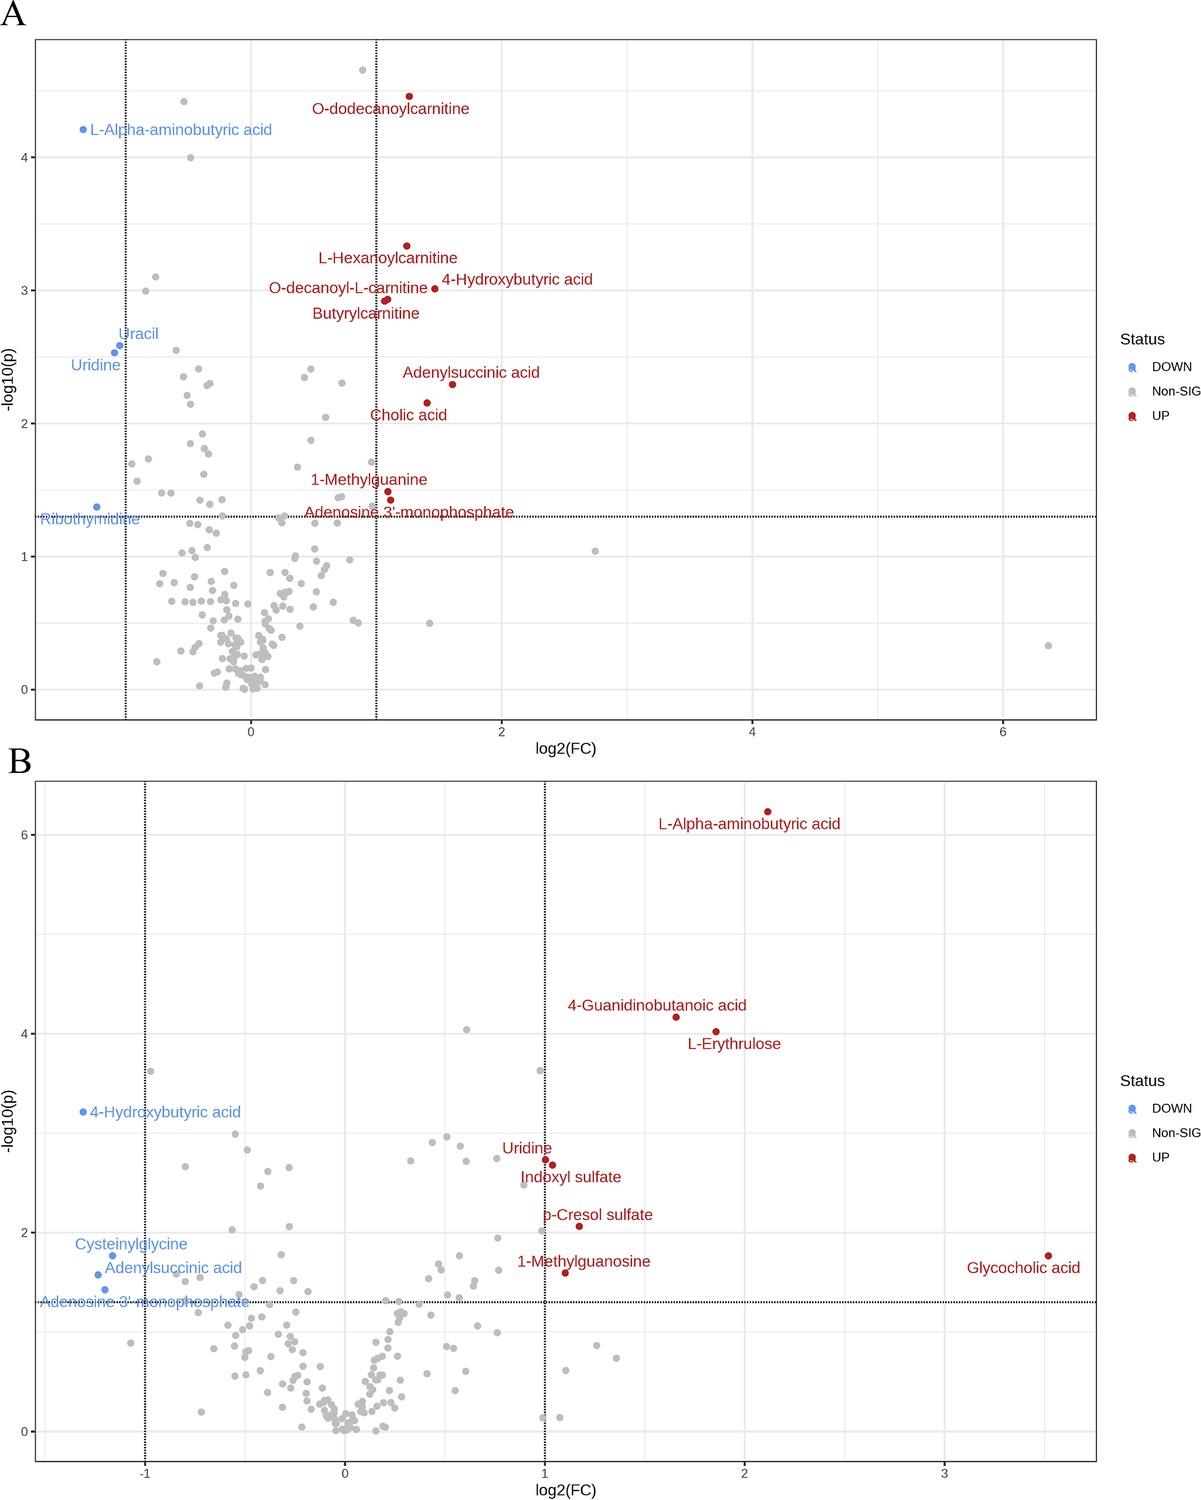
Overview of subgroup dimensionality reduction analysis 1.
(A) Volcano map of differential metabolites between the Sham group and OVX group. (B) Volcano map of differential metabolites between the OVX group and OV +E group.
Figure 6—figure supplement 1
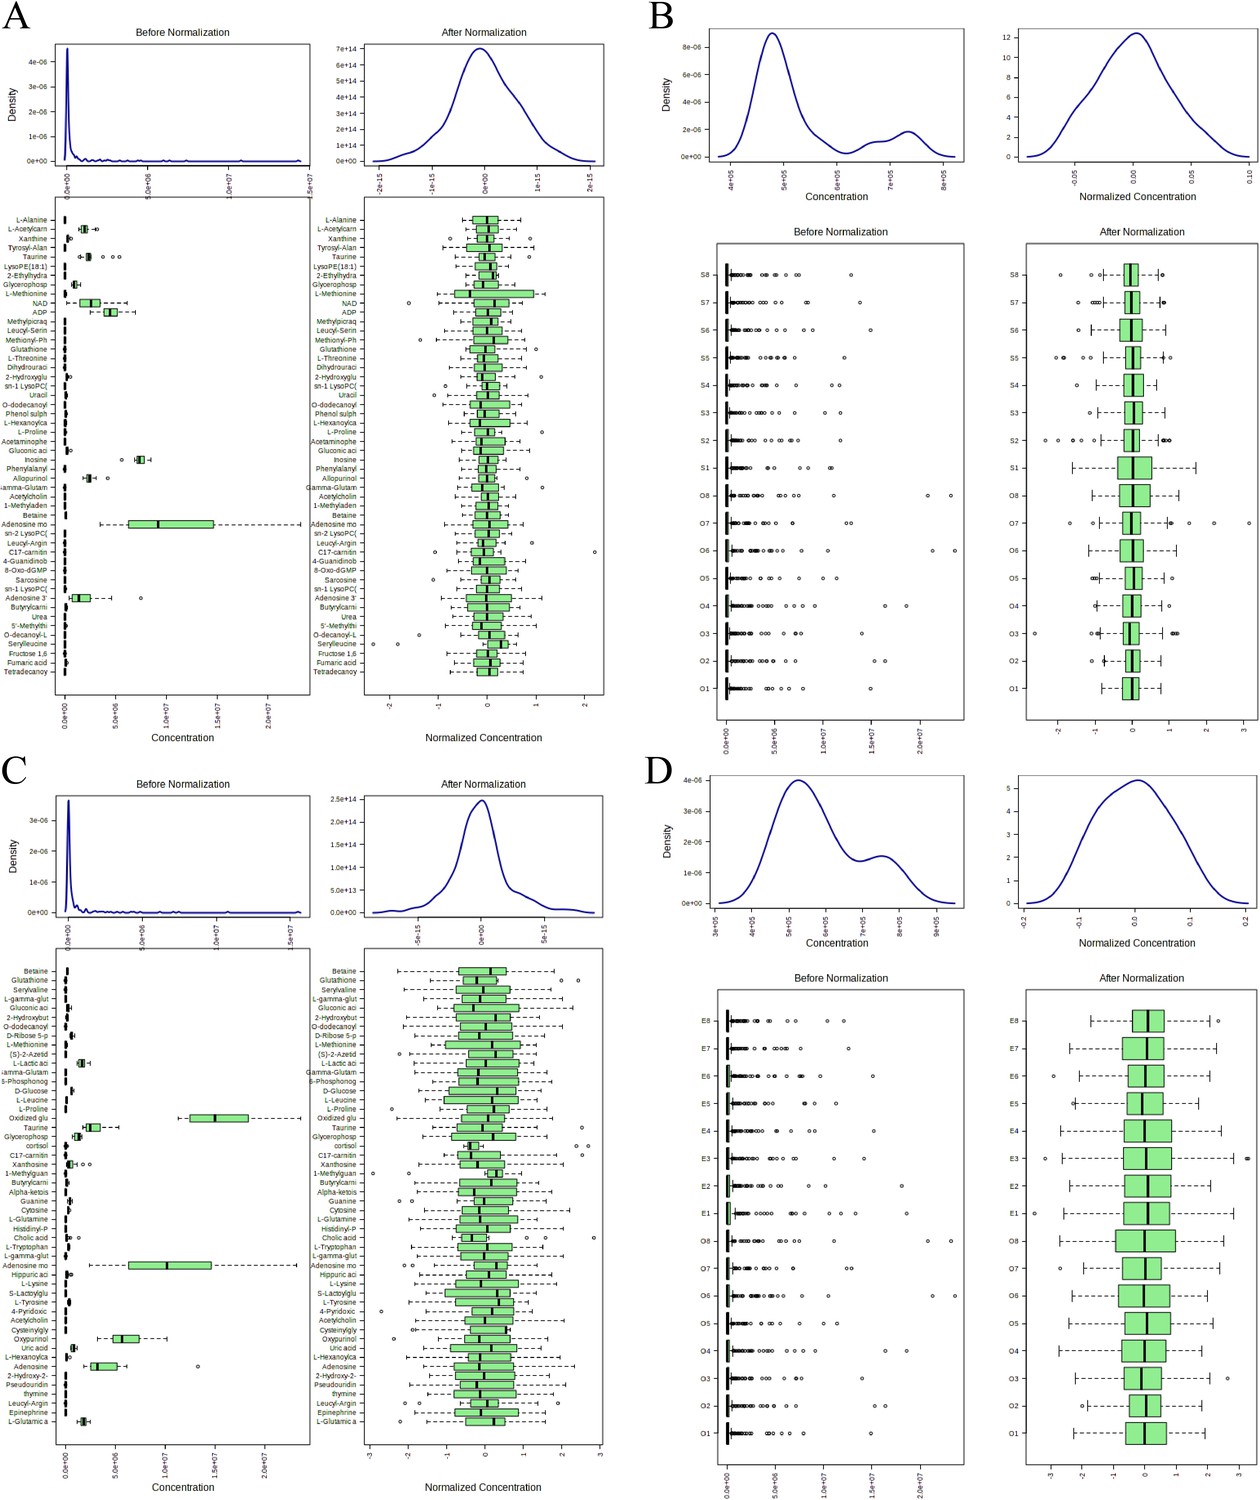
Subgroup normalization processing rendering.
(A) Distribution map of metabolites before and after normalization treatment between the Sham and OVX group. (B) Distribution map of samples before and after normalization treatment between the Sham and OVX group. (C) Distribution map of metabolites before and after normalization treatment between the OVX group and OVX + E group. (D) Distribution map of samples before and after normalization treatment between the OVX group and OVX + E group.
Figure 7
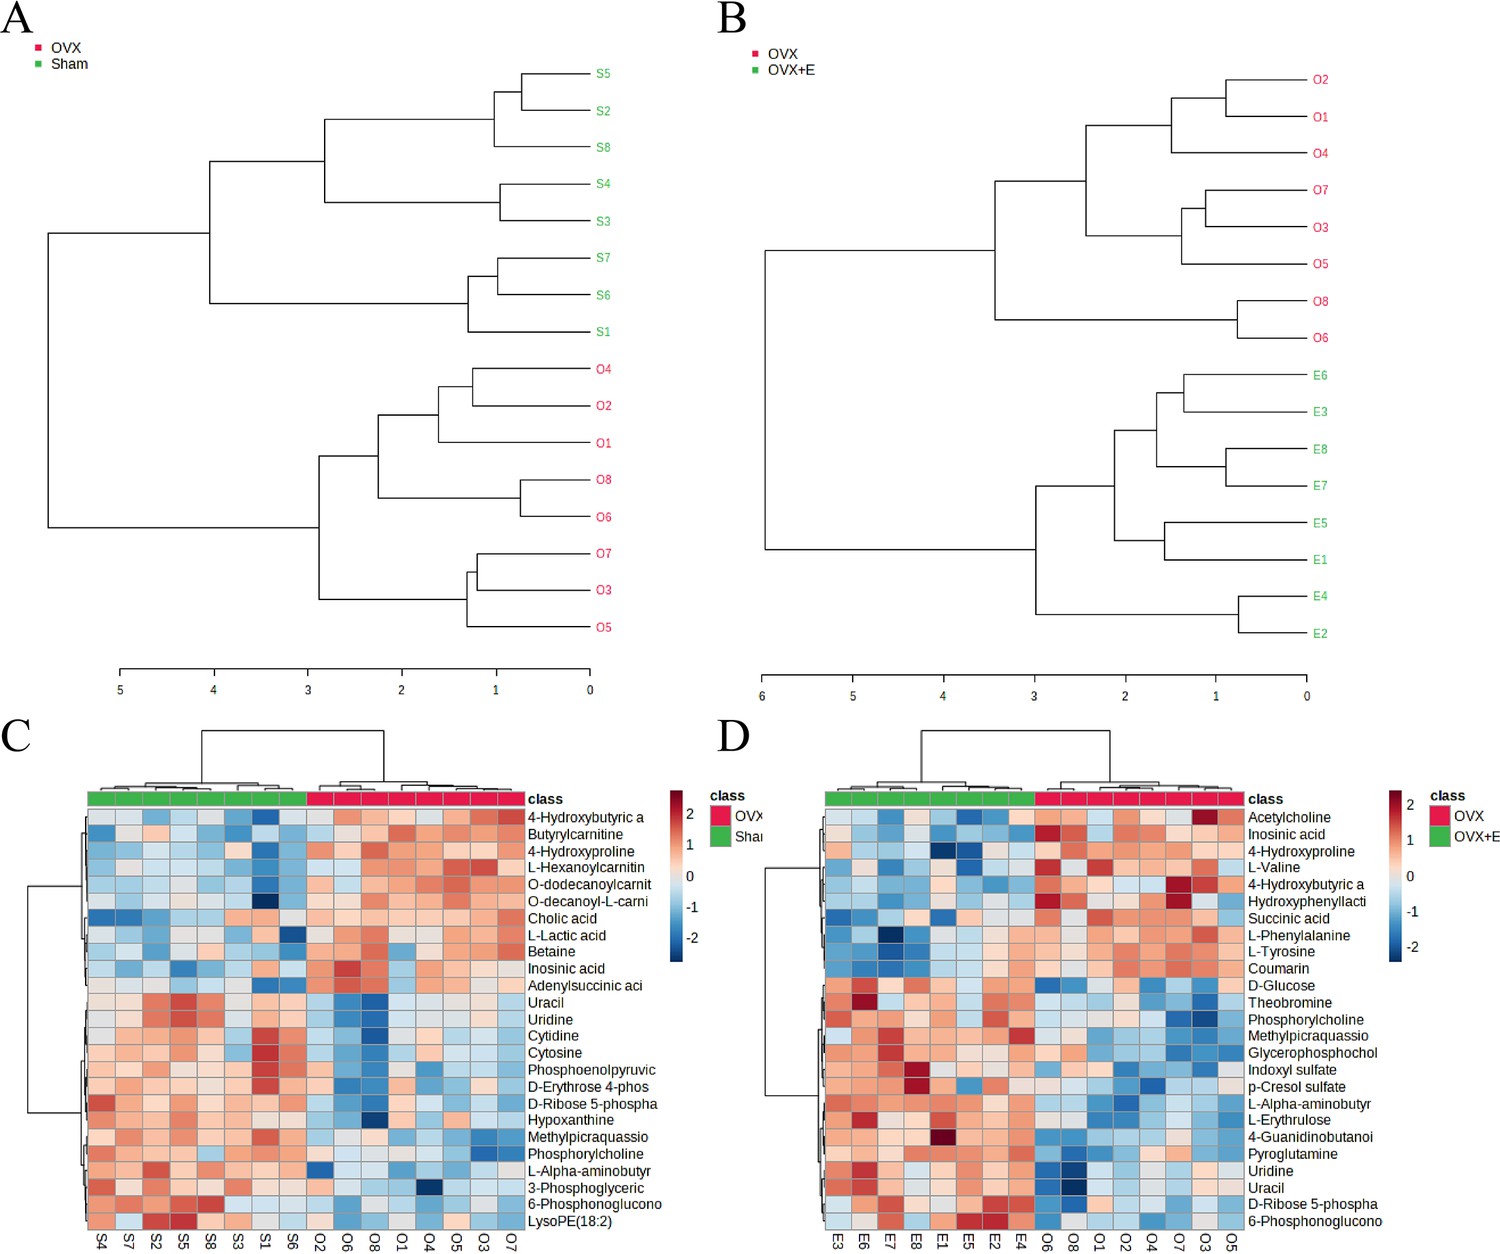
Overview of subgroup dimensionality reduction analysis 2.
(A) Hierarchical clustering dendrogram between the Sham group and OVX group. (B) Hierarchical clustering dendrogram between the OVX group and OVX + E group. (C) Hierarchical clustering heatmap between the Sham group and OVX group. (B) Hierarchical clustering heatmap between the OVX group and OVX + E.
Figure 8 with 2 supplements
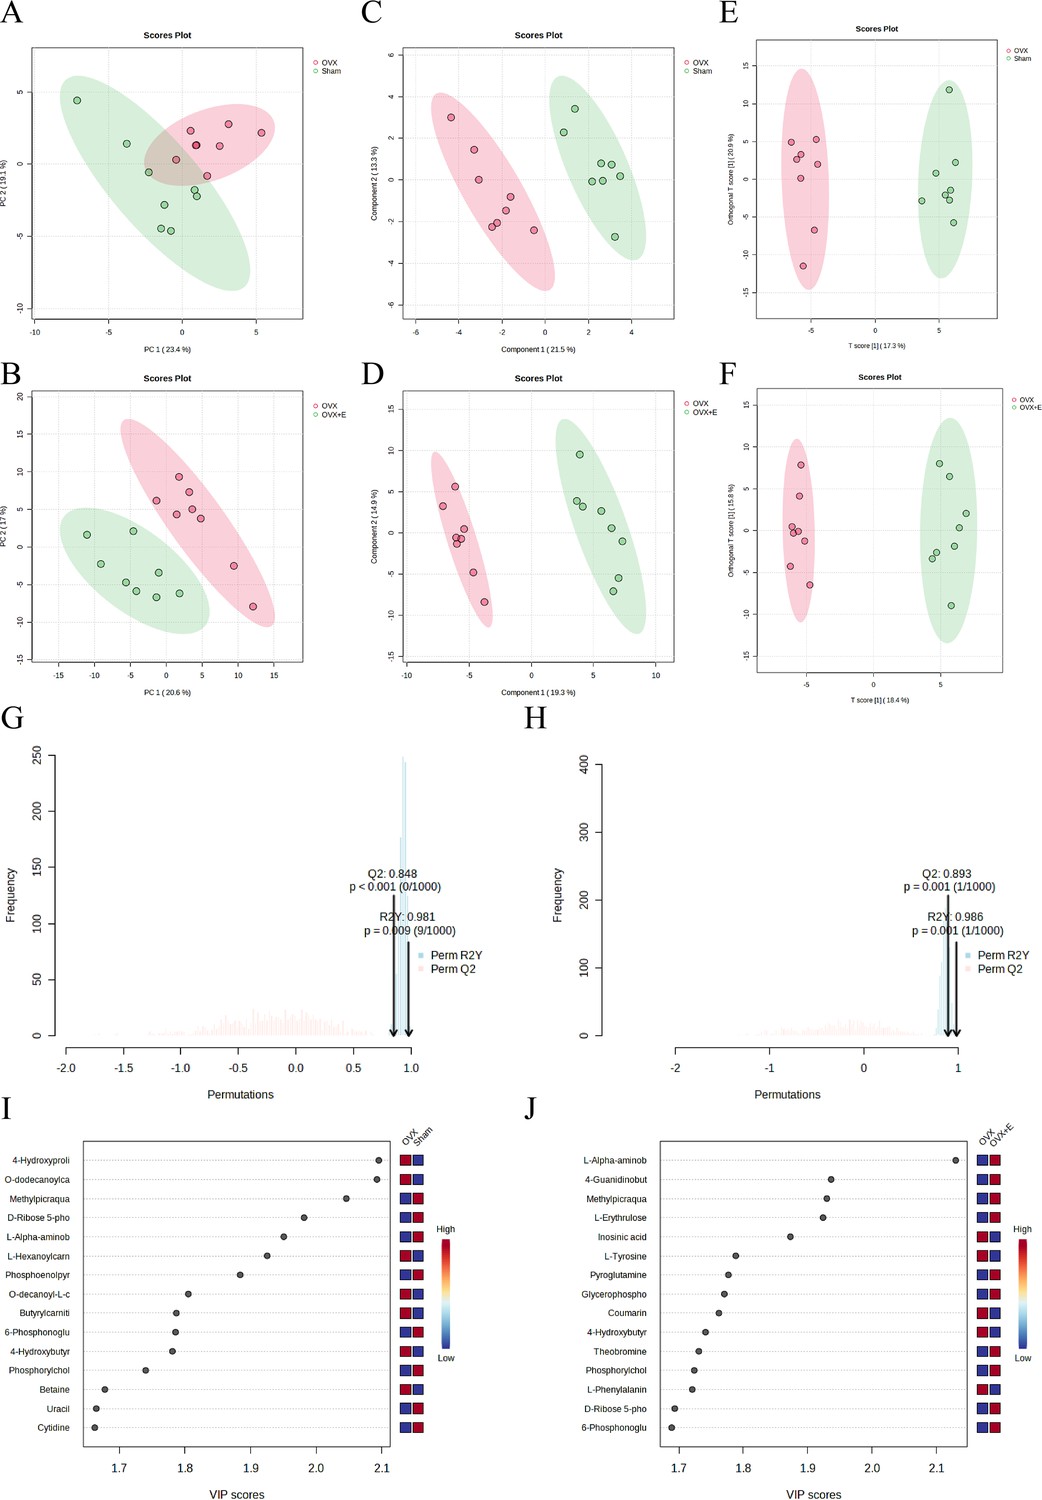
The subgroup dimensionality reduction analysis.
(A) PCA scatter plot between the Sham group and OVX group. (B) PCA scatter plot between the OVX group and OVX + E group. (C) PLS-DA scatter plot between the Sham group and OVX group. (D) PLS-DA scatter plot between the OVX group and OVX + E group. (E) OPLS-DA scatter plot between the Sham group and OVX group. (F) OPLS-DA scatter plot between the OVX group and OVX + E group. (G) OPLS-DA model permutations test between the Sham group and OVX group. (H) OPLS-DA models permutations test between the OVX group and OVX + E group. (I) VIP score of OPLS-DA model between the Sham group and OVX group. (J) VIP score of OPLS-DA model between the OVX group and OVX + E group.
Figure 8—figure supplement 1

The subgroup dimensionality reduction analysis.
(A) PCA plot between the Sham group and OVX group. (B) PCA plot between the OVX group and OVX + E group. (C) PLS-DA plot between the Sham group and OVX group. (D) PLS-DA plot between the OVX group and OVX + E group. (E) PLS-DA model permutations test between the Sham group and OVX group. (F) PLS-DA models permutations test between the OVX group and OVX + E group. (G) OPLS-DA model permutations test between the Sham group and OVX group. (H) OPLS-DA models permutations test between the OVX group and OVX + E group.
Figure 8—figure supplement 2
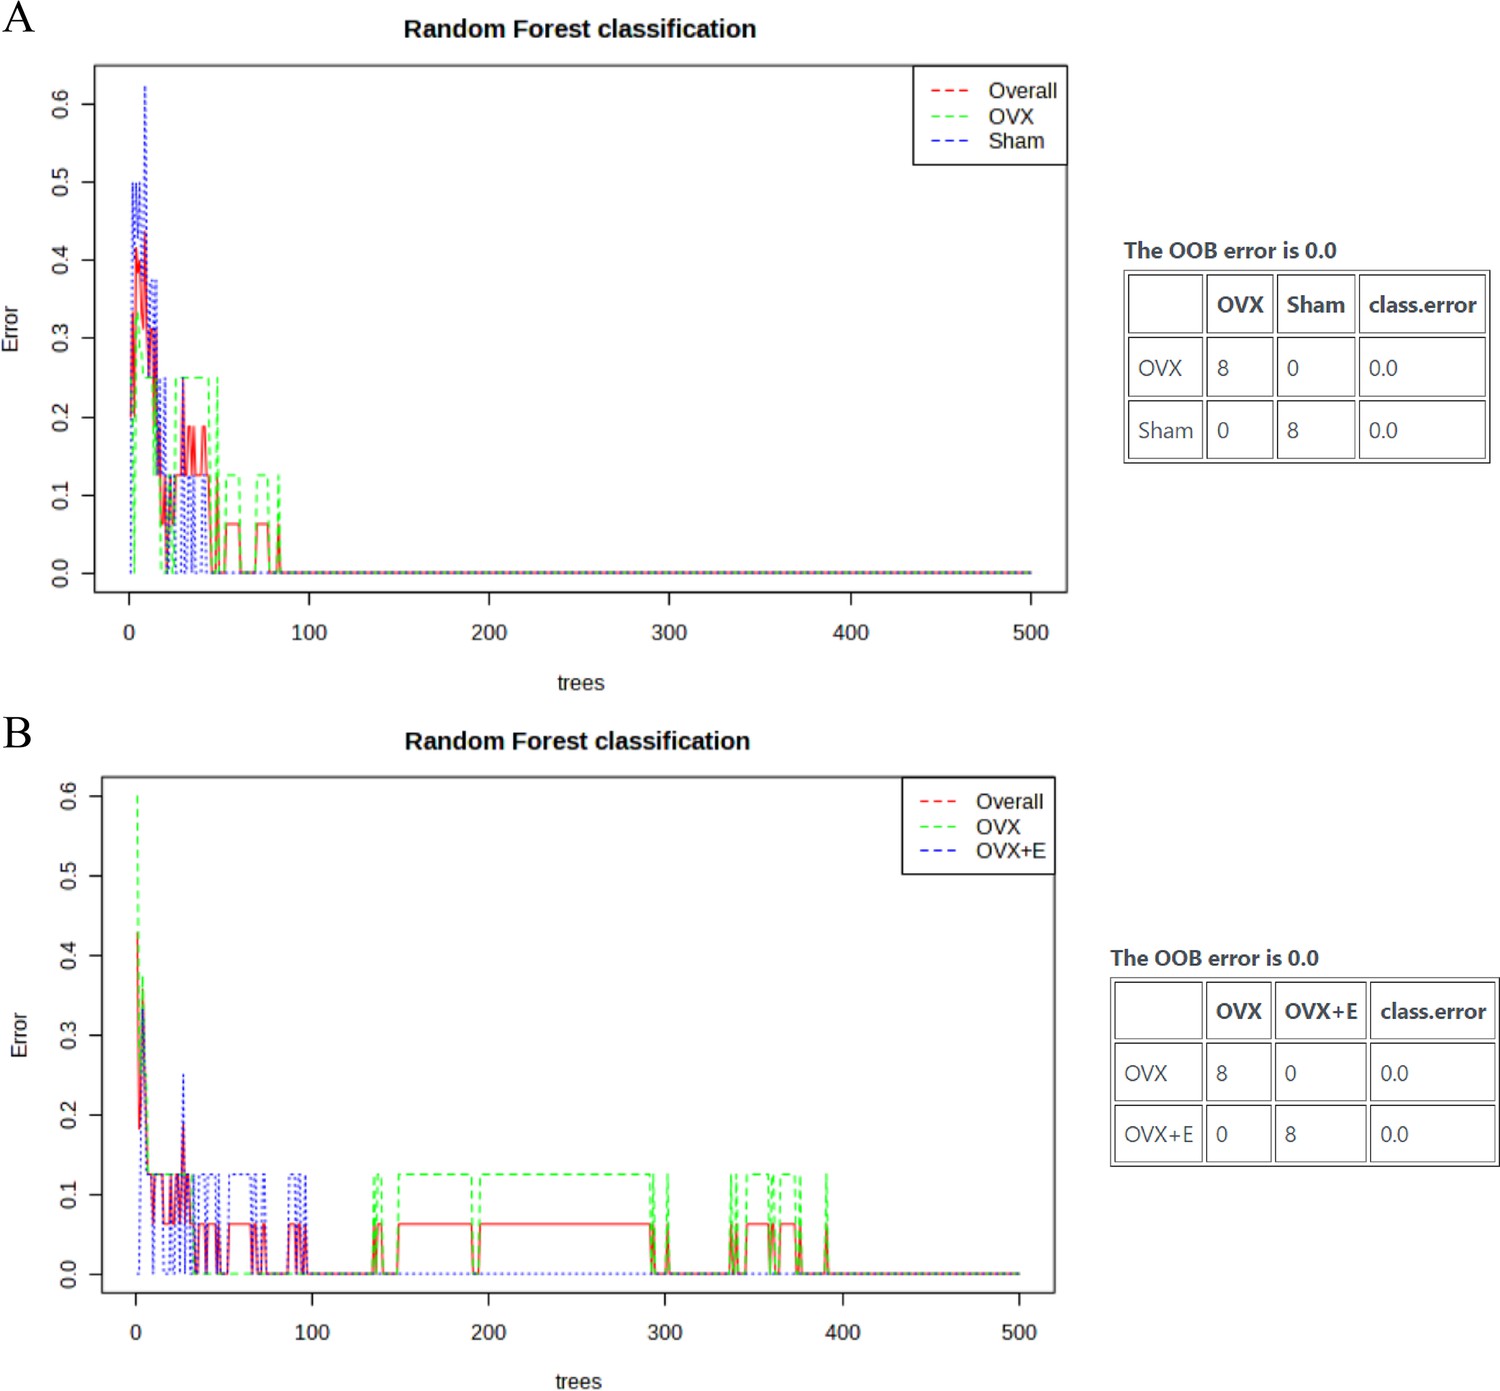
The subgroup random forest model.
(A) The random forest classification and OOB error plot between the Sham group and OVX group. (B) The random forest classification and OOB error plot between the OVX group and OVX + E group.
Figure 9
Screening differential metabolites using RF, EBAM, and SAM methods.
(A) VIP patterns based on RF model between the Sham group and OVX group. (B) VIP patterns based on RF model between the OVX group and OVX +E group. (C, D) Volcano plots for subgroup comparison based on EBAM method. (E, F) Screening of differential metabolites between subgroups based on SAM method.
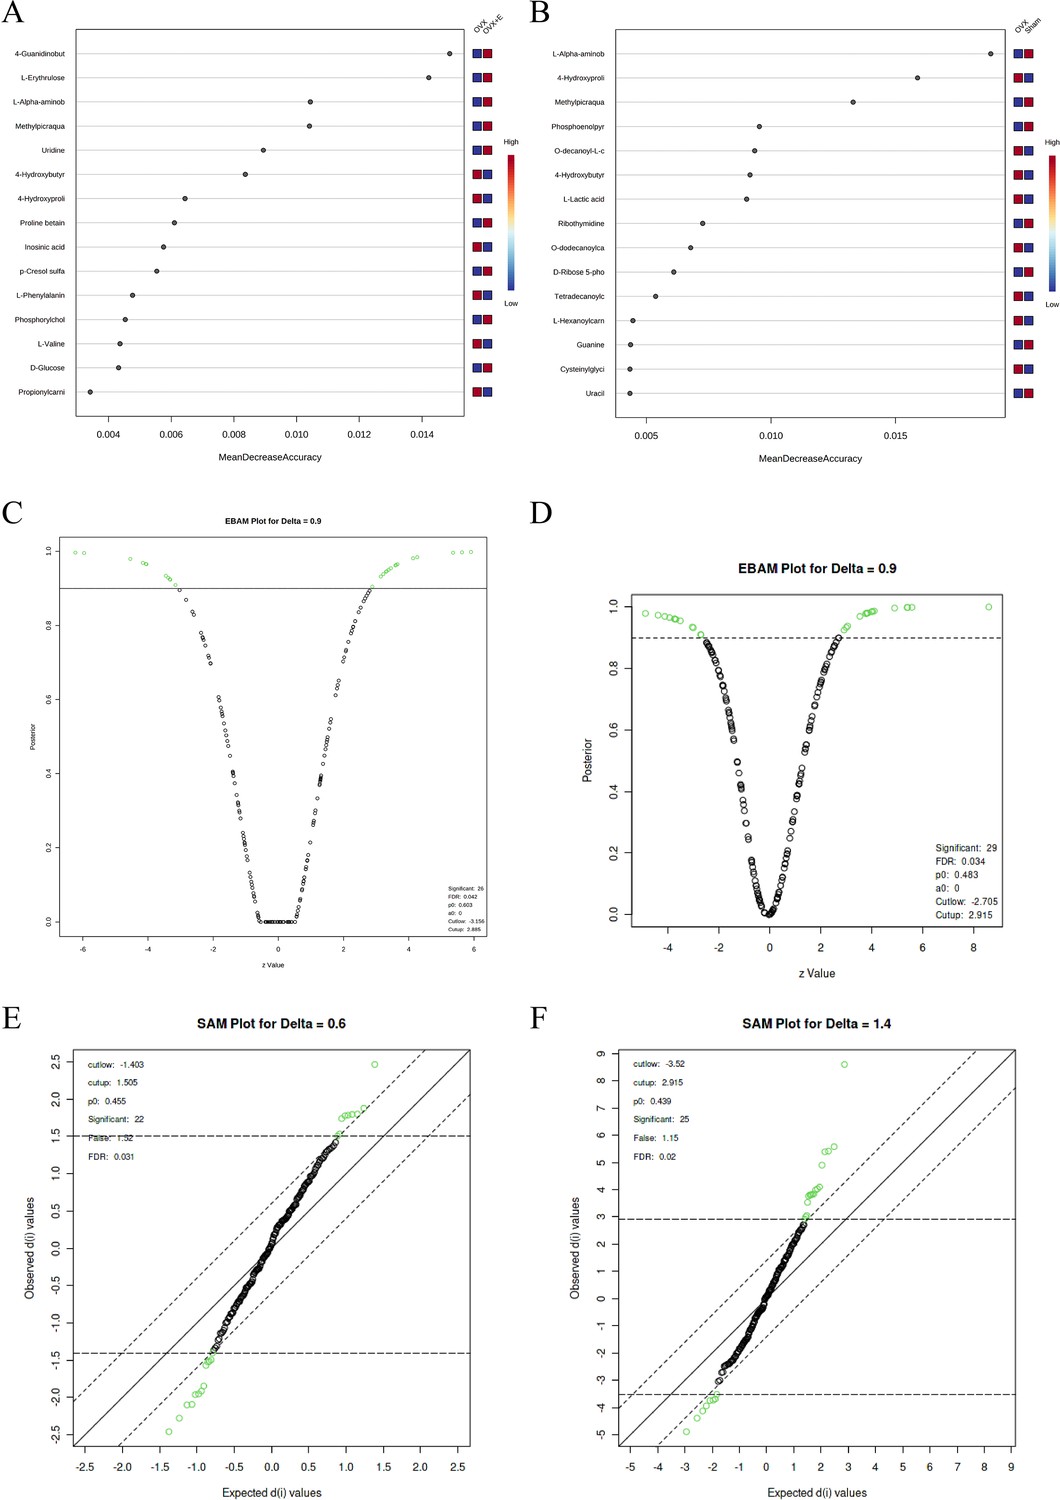
Figure 10
Expression patterns of metabolites.
(A) Metabolite expression patterns associated with ovariectomy. (B) Metabolite expression patterns related to estrogen supplementation. (C) Metabolite expression patterns associated with increased estrogen concentration. (D) Metabolite expression patterns associated with L-AABA.
Figure 11 with 1 supplement
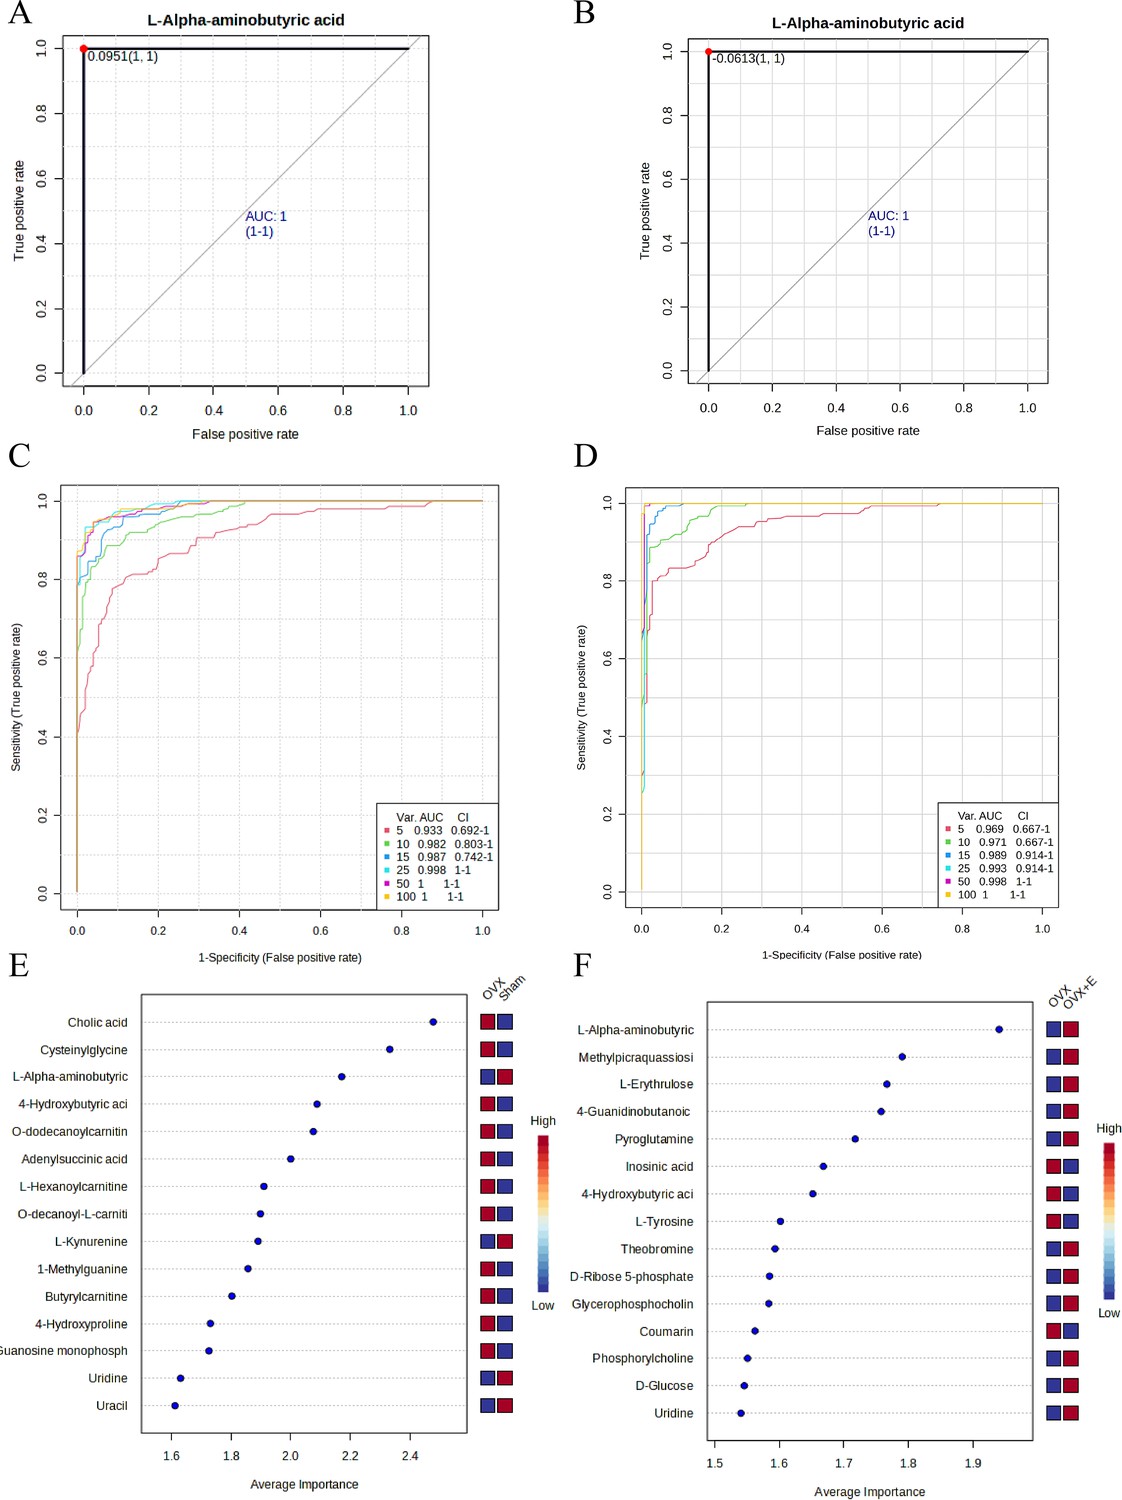
Screening of typical biomarkers.
(A) ROC curve of L-AABA between the Sham group and OVX group. (B) ROC curve of L-AABA between the OVX group and OVX +E group. (C) Multivariate ROC curve based exploratory analysis between the Sham and OVX group. (D) Multivariate ROC curve based exploratory analysis between the OVX group and OVX +E group. (E) Average importance ranking of multivariate models for biomarkers between the Sham and OVX group. (F) Average importance ranking of multivariate models for biomarkers between the OVX and OVX +E group.
Figure 11—figure supplement 1
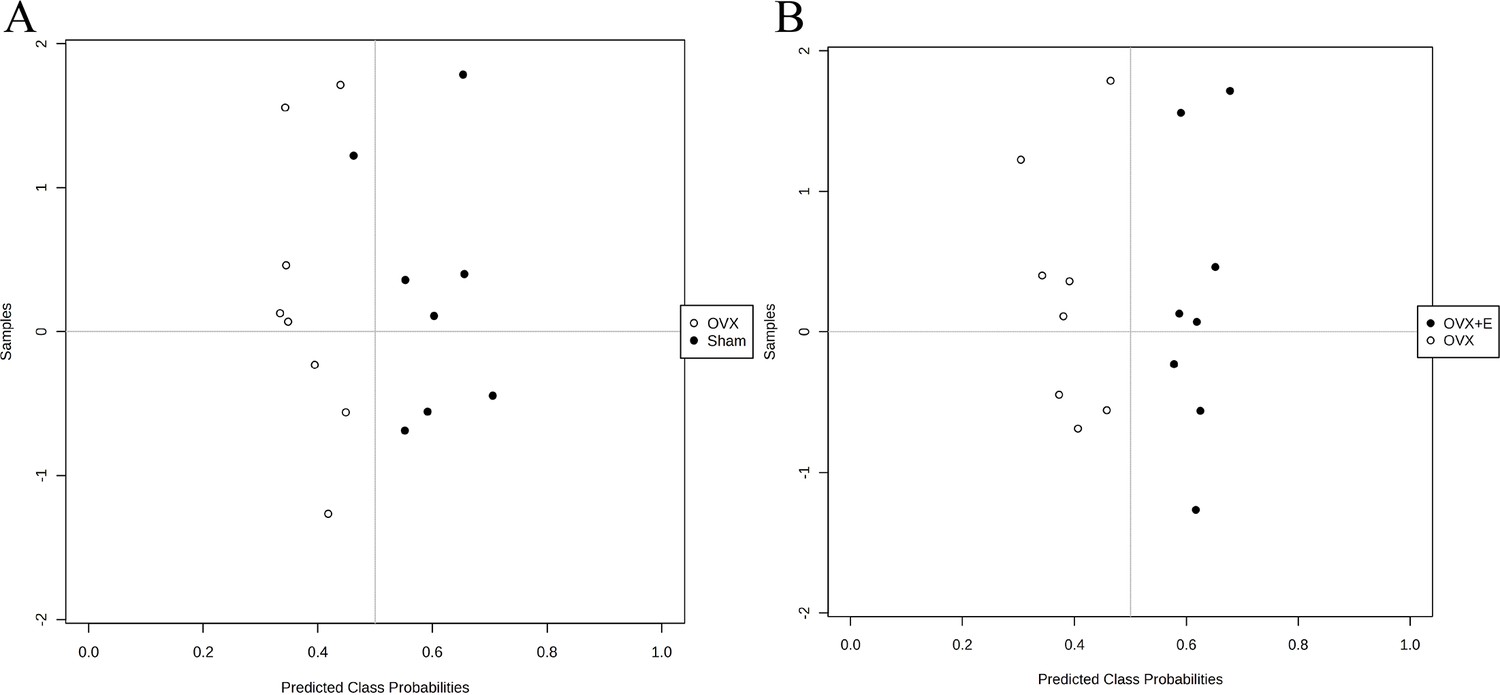
The error classification of the multivariate ROC curve.
(A) The misclassifications between the OVX and Sham groups. (B) The misclassifications between the OVX and OVX +E groups.
Figure 12
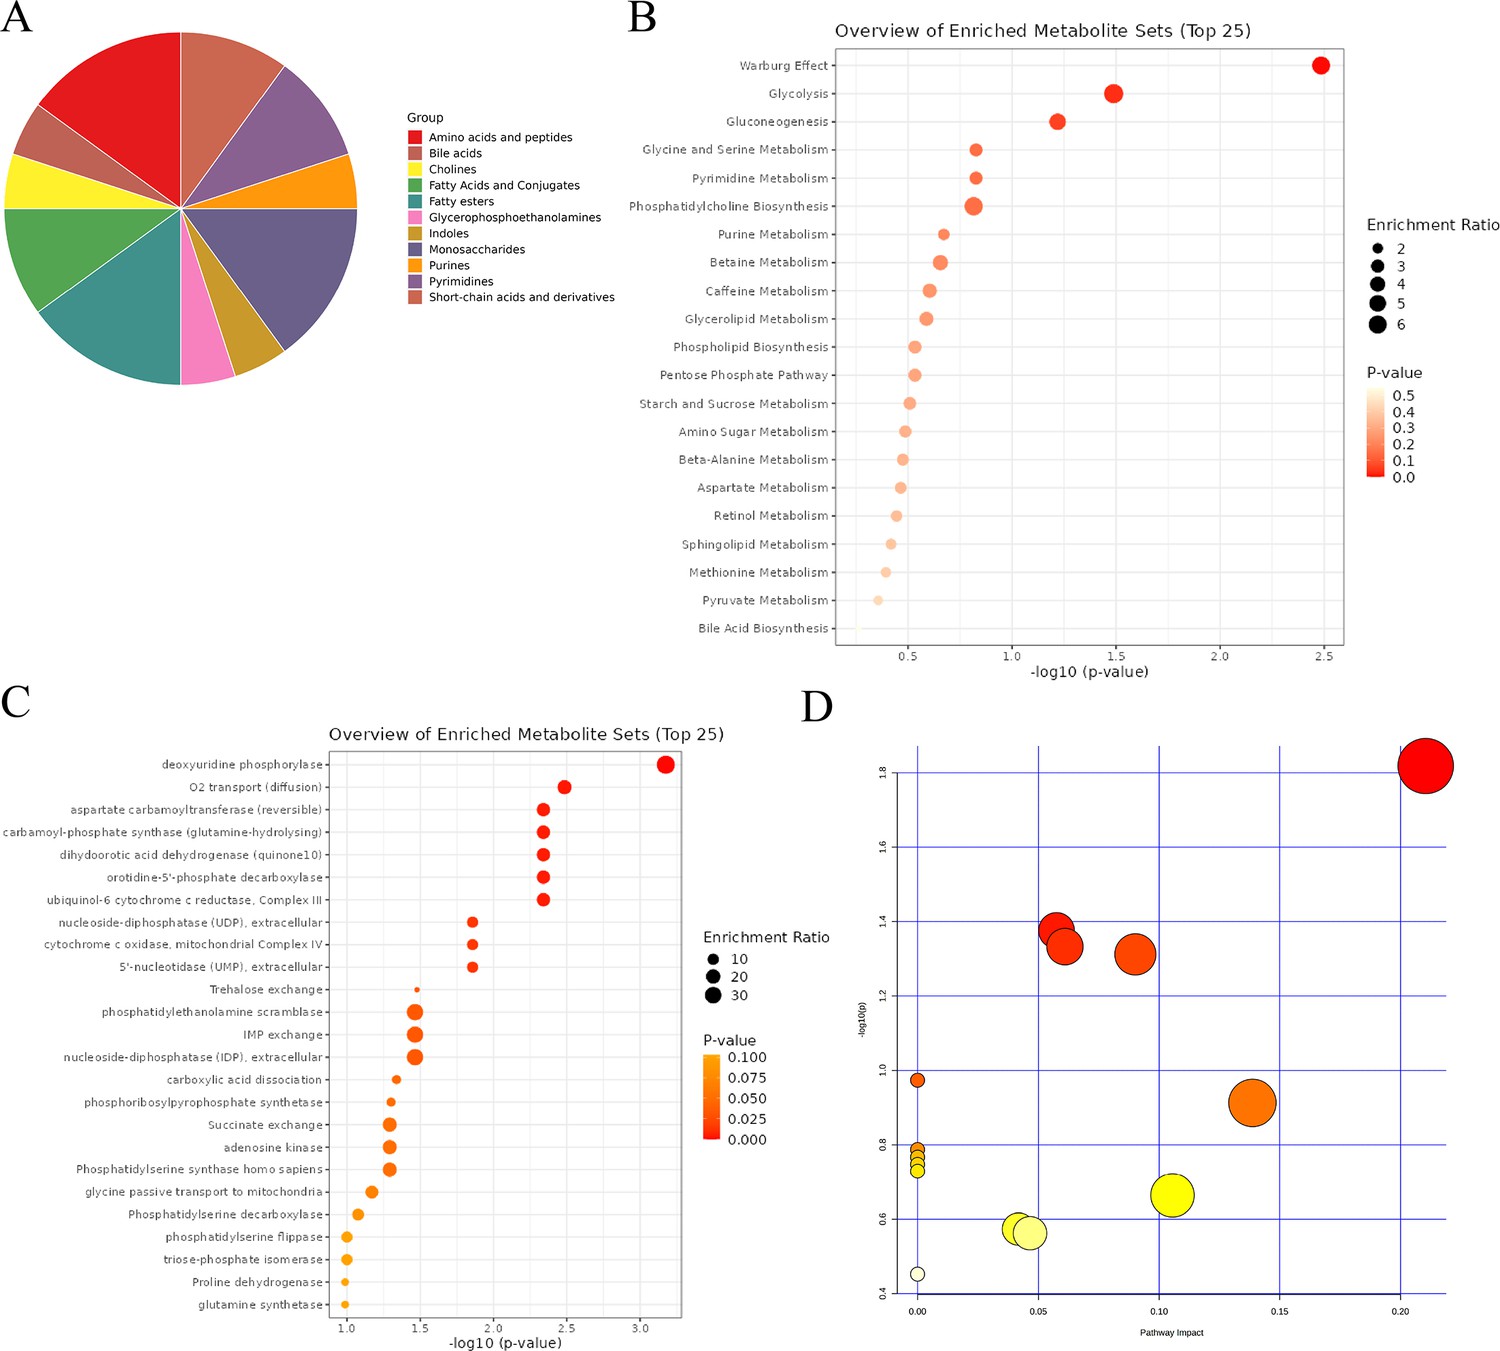
Comprehensive analysis of differential metabolites.
(A) Classification pie chart of differential metabolites. (B) Metabolic enrichment analysis of differential metabolites. (C) Enzyme enrichment analysis of differential metabolites. (D) Enrichment analysis of rat-specific metabolite pathways.
Additional files
-
Supplementary file 1
Metabolomics raw data.
- https://cdn.elifesciences.org/articles/101701/elife-101701-supp1-v1.csv
-
Supplementary file 2
Non-parametric tests of metabolites.
- https://cdn.elifesciences.org/articles/101701/elife-101701-supp2-v1.csv
-
Supplementary file 3
Fisher’s LSD tests of metabolites.
- https://cdn.elifesciences.org/articles/101701/elife-101701-supp3-v1.csv
-
Supplementary file 4
Intersection differential metabolites.
- https://cdn.elifesciences.org/articles/101701/elife-101701-supp4-v1.xlsx
-
Supplementary file 5
Differential metabolites identified by SAM.
- https://cdn.elifesciences.org/articles/101701/elife-101701-supp5-v1.csv
-
Supplementary file 6
The correlation coefficient and p-value of the correlation analysis for all metabolites.
- https://cdn.elifesciences.org/articles/101701/elife-101701-supp6-v1.csv
-
Supplementary file 7
The correlation coefficient and p-value of the correlation analysis for all metabolites.
- https://cdn.elifesciences.org/articles/101701/elife-101701-supp7-v1.csv
-
Supplementary file 8
The correlation coefficient and p-value of the correlation analysis for all samples.
- https://cdn.elifesciences.org/articles/101701/elife-101701-supp8-v1.csv
-
Supplementary file 9
The correlation coefficient and p-value of the correlation analysis for all samples.
- https://cdn.elifesciences.org/articles/101701/elife-101701-supp9-v1.csv
-
Supplementary file 10
PLS-DA cross validation details.
- https://cdn.elifesciences.org/articles/101701/elife-101701-supp10-v1.xlsx
-
Supplementary file 11
P scores for differential metabolites.
- https://cdn.elifesciences.org/articles/101701/elife-101701-supp11-v1.csv
-
Supplementary file 12
Mean Metabolic Accuracy of differential metabolites in random forest tree model.
- https://cdn.elifesciences.org/articles/101701/elife-101701-supp12-v1.csv
-
Supplementary file 13
Details of t-test for differential metabolites between Sham group and OVX group.
- https://cdn.elifesciences.org/articles/101701/elife-101701-supp13-v1.csv
-
Supplementary file 14
Details of t-test for differential metabolites between OVX +E group and OVX group.
- https://cdn.elifesciences.org/articles/101701/elife-101701-supp14-v1.csv
-
Supplementary file 15
VIP scores of OPLS-DA models between subgroups.
- https://cdn.elifesciences.org/articles/101701/elife-101701-supp15-v1.csv
-
Supplementary file 16
VIP scores of OPLS-DA models between subgroups.
- https://cdn.elifesciences.org/articles/101701/elife-101701-supp16-v1.csv
-
Supplementary file 17
VIP scores of the random forest model between subgroups.
- https://cdn.elifesciences.org/articles/101701/elife-101701-supp17-v1.csv
-
Supplementary file 18
VIP scores of the random forest model between subgroups.
- https://cdn.elifesciences.org/articles/101701/elife-101701-supp18-v1.csv
-
Supplementary file 19
The evaluation details of EBAM and SAM model between subgroups.
- https://cdn.elifesciences.org/articles/101701/elife-101701-supp19-v1.csv
-
Supplementary file 20
e evaluation details of EBAM and SAM model between subgroups.
- https://cdn.elifesciences.org/articles/101701/elife-101701-supp20-v1.csv
-
Supplementary file 21
The evaluation details of EBAM and SAM model between subgroups.
- https://cdn.elifesciences.org/articles/101701/elife-101701-supp21-v1.csv
-
Supplementary file 22
The evaluation details of EBAM and SAM model between subgroups.
- https://cdn.elifesciences.org/articles/101701/elife-101701-supp22-v1.csv
-
Supplementary file 23
Details of intergroup differential analysis of low estrogen related metabolites.
- https://cdn.elifesciences.org/articles/101701/elife-101701-supp23-v1.csv
-
Supplementary file 24
Details of intergroup differential analysis of low estrogen related metabolites.
- https://cdn.elifesciences.org/articles/101701/elife-101701-supp24-v1.csv
-
Supplementary file 25
Details of metabolite related trends from low to high estrogen concentrations.
- https://cdn.elifesciences.org/articles/101701/elife-101701-supp25-v1.csv
-
Supplementary file 26
Correlation coefficient of metabolites related to L-AABA expression.
- https://cdn.elifesciences.org/articles/101701/elife-101701-supp26-v1.csv
-
Supplementary file 27
The promising differential metabolites AUC results of ROC curves between subgroups.
- https://cdn.elifesciences.org/articles/101701/elife-101701-supp27-v1.xlsx
-
Supplementary file 28
The promising differential metabolites AUC results of ROC curves between subgroups.
- https://cdn.elifesciences.org/articles/101701/elife-101701-supp28-v1.xlsx
-
Supplementary file 29
Rat-specific metabolic pathway analysis details.
- https://cdn.elifesciences.org/articles/101701/elife-101701-supp29-v1.xlsx
-
Supplementary file 30
The legends for the figures.
- https://cdn.elifesciences.org/articles/101701/elife-101701-supp30-v1.docx
-
MDAR checklist
- https://cdn.elifesciences.org/articles/101701/elife-101701-mdarchecklist1-v1.docx
-
Source data 1
Metabolomics data of rat aorta.
- https://cdn.elifesciences.org/articles/101701/elife-101701-data1-v1.csv
Download links
A two-part list of links to download the article, or parts of the article, in various formats.
Downloads (link to download the article as PDF)
Open citations (links to open the citations from this article in various online reference manager services)
Cite this article (links to download the citations from this article in formats compatible with various reference manager tools)
Exploration of the metabolomic mechanisms of postmenopausal hypertension induced by low estrogen state
eLife 13:RP101701.
https://doi.org/10.7554/eLife.101701.2


