Periosteal skeletal stem cells can migrate into the bone marrow and support hematopoiesis after injury
- Service d’hématologie Clinique, Centre Hospitalier Universitaire de Rennes, France
- UMR U1236, INSERM, Université Rennes, EFS Bretagne, Equipe Labellisée Ligue Contre le Cancer, France
- Ruth L. and David S. Gottesman Institute for Stem Cell and Regenerative Medicine, Albert Einstein College of Medicine, Michael F. Price Center, United States
- Department of Cell Biology, Albert Einstein College of Medicine, Michael F. Price Center, United States
- Department of Medical Oncology, Albert Einstein College of Medicine, United States
- Department of Pharmacology & Regenerative Medicine, University of Illinois at Chicago, United States
- Department of Dermatology, University of Wisconsin-Madison, United States
- Laboratoire Suivi Immunologique des Thérapeutiques Innovantes, Centre Hospitalier Universitaire de Rennes, France
Figures
Figure 1 with 2 supplements
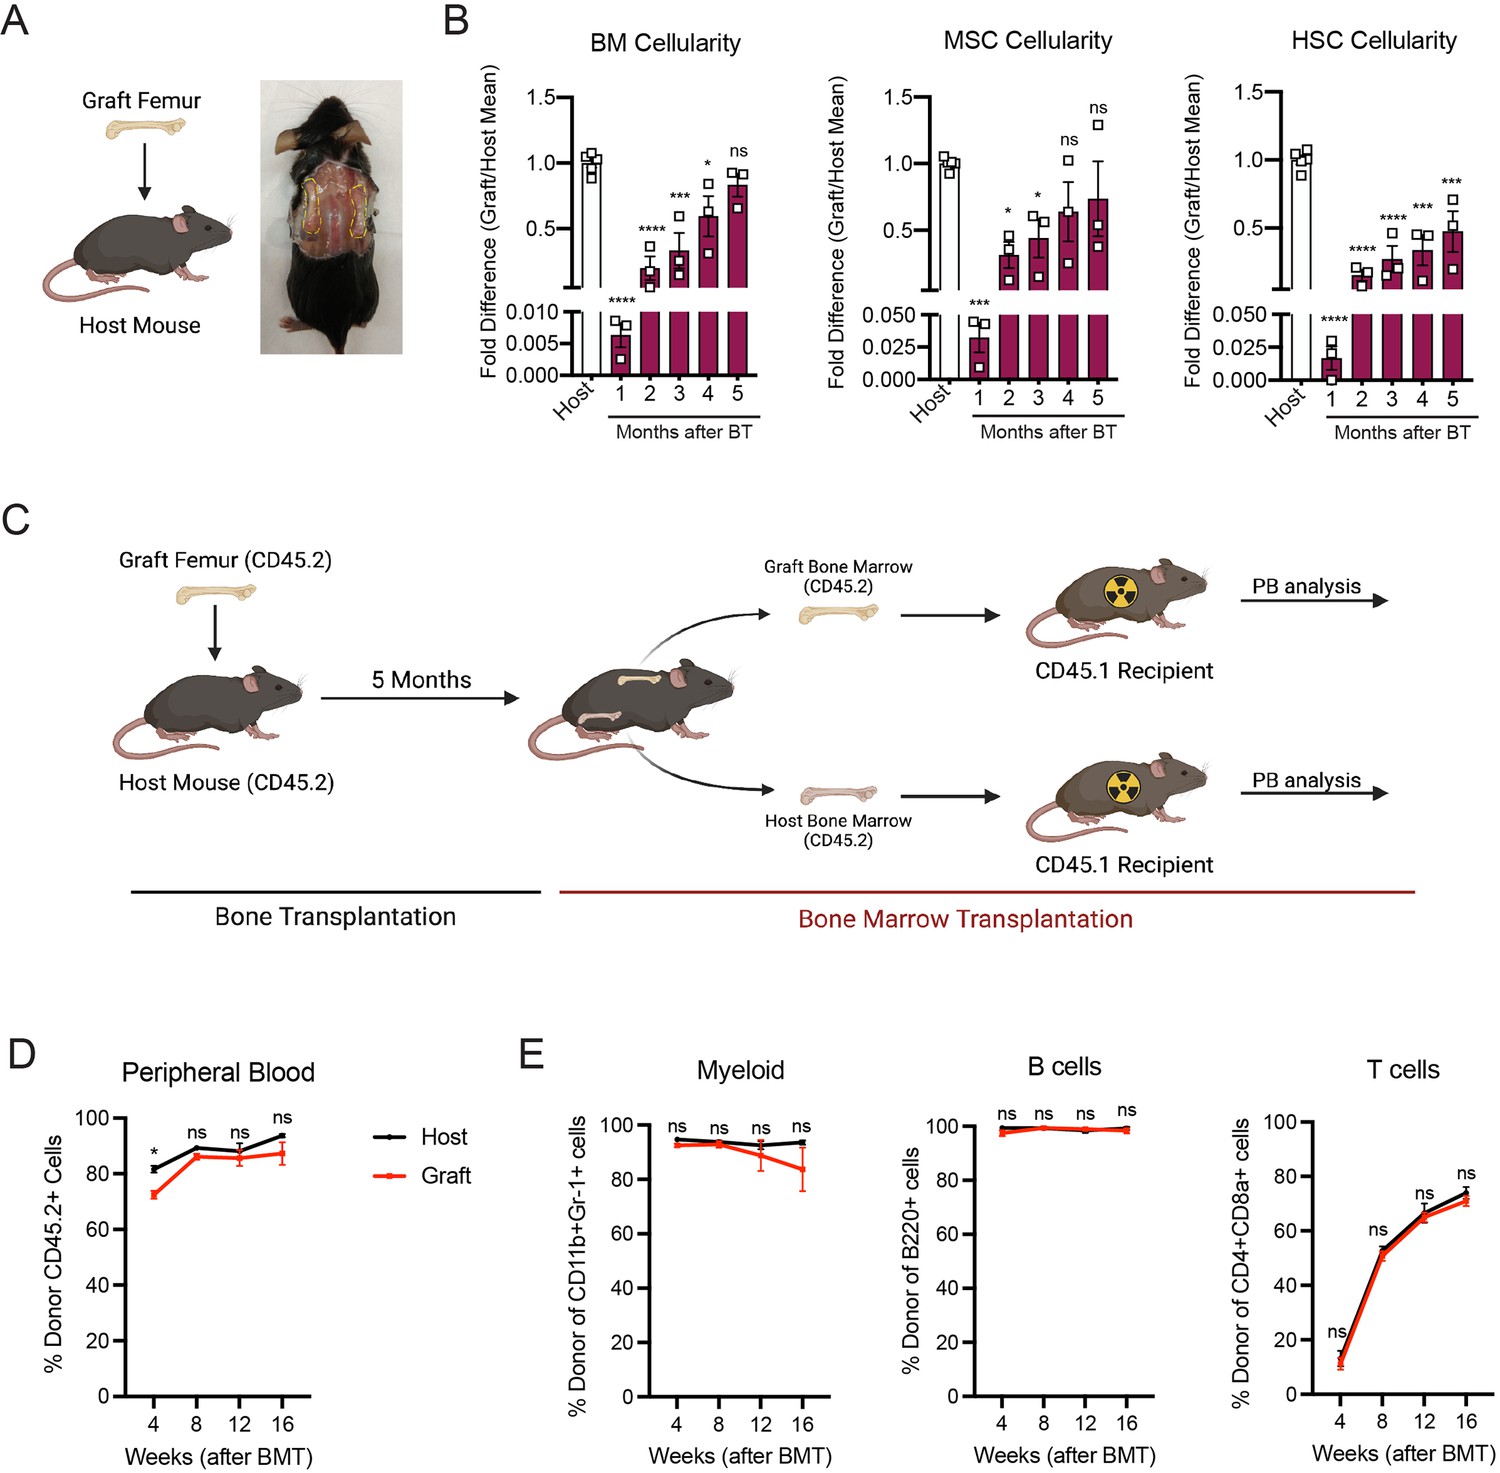
Whole bone transplantation is a good model to study bone marrow regeneration.
(A) Schematic and picture of the bone transplantation procedure. (B) Fold difference quantification of graft femur/host femur cellularity normalized to mean host femur cellularity. Total graft bone marrow cells, bone marrow mesenchymal stem cells (BM-MSCs) and hematopoietic stem cells (HSCs) were analyzed monthly until 5 months after bone transplantation (BT) (n = 3). Ordinary one-way ANOVA with Dunnett multiple comparisons was used to determine statistical significance. (C) Schematic illustration of the non-competitive repopulating assay after bone transplantation. (D) Donor HSC contribution of graft and host recipients at 4 weeks after bone marrow transplantation (n = 10). (E) Quantification of tri-lineage (myeloid, B lymphoid, and T lymphoid cells) engraftment 4-week post-transplantation (n = 10). *p < 0.05, **p < 0.01, ***p < 0.001, ****p < 0.0001. This figure was created with BioRender.com.
Figure 1—figure supplement 1
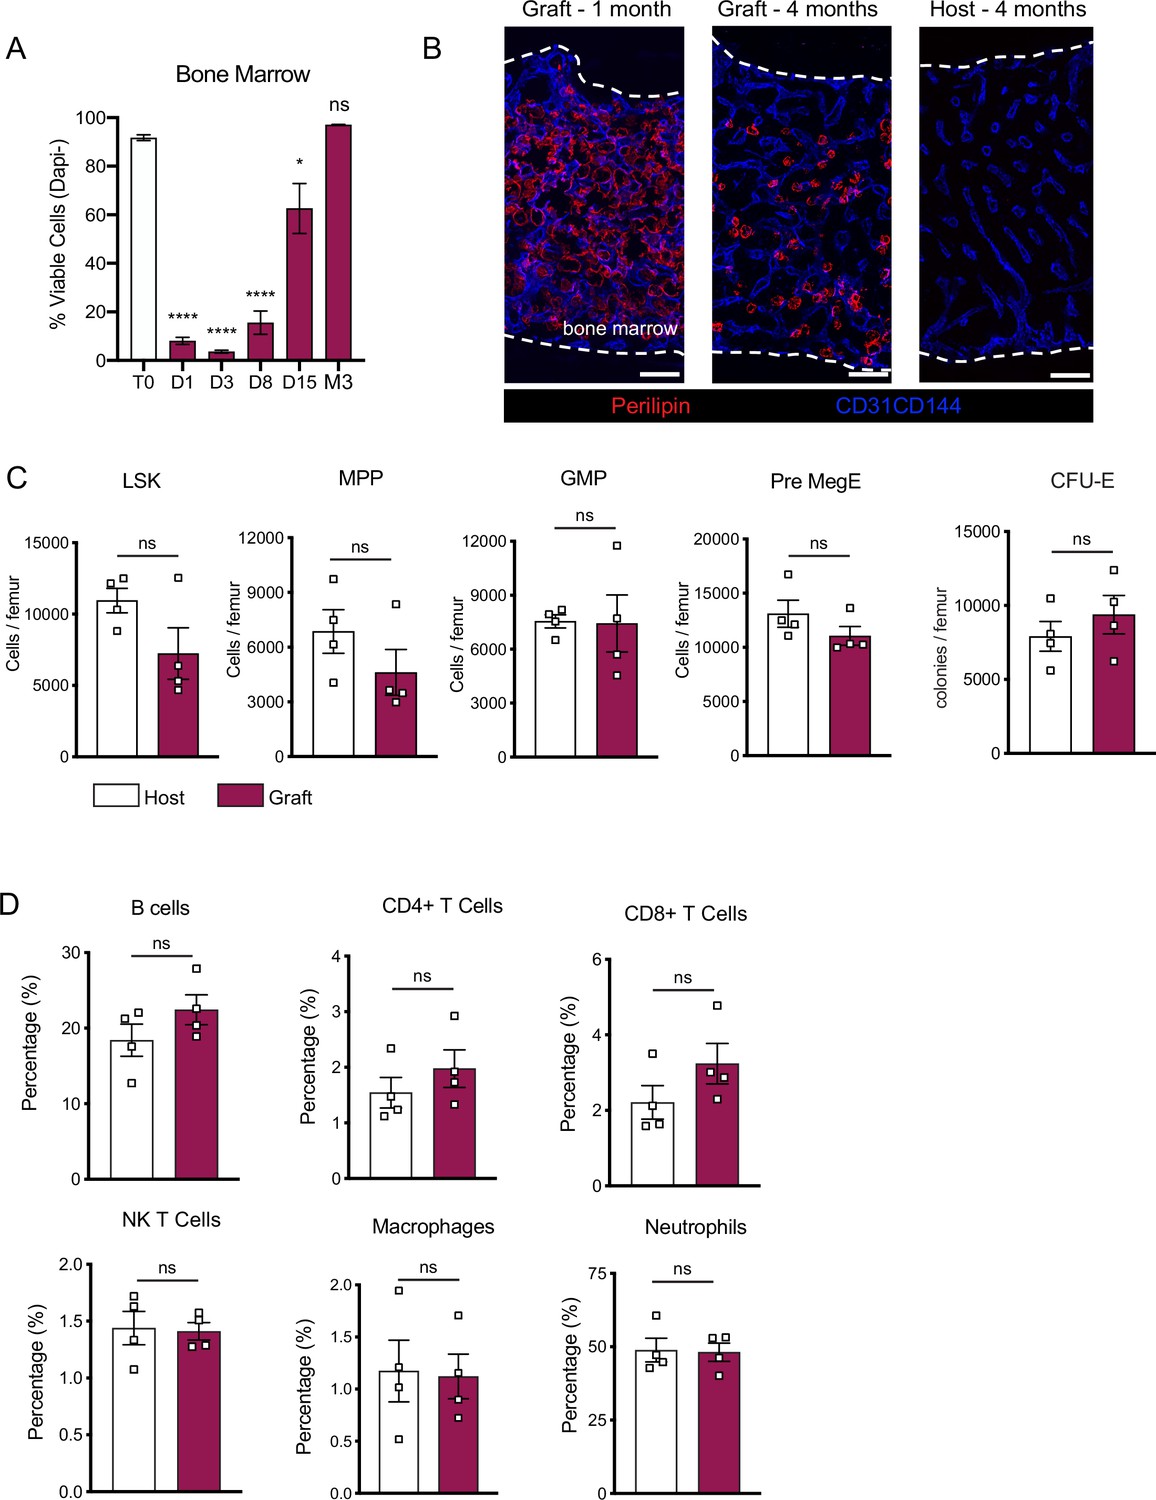
Bone marrow regeneration after transplantation.
(A) Cell viability determined by flow cytometry and expressed as percentage of total Dapi- alive cells in the BM graft at steady state, 1, 3, 8, 15 days and 3 months after bone transplantation (n = 3–4). One-way ANOVA with Dunnett’s multiple comparisons test used to determine statistical significance. (B) Representative whole-mount confocal z-stack projections of host and graft femurs 1 and 4 months after transplantation. Adipocytes are stained using an anti-perilipin antibody. Scale bar = 50 µm. Three independent experiments yielded similar results. (C) Comparison of different hematopoietic progenitors’ populations between graft and host 5 months after bon transplantation (n = 4 per group). (D) Comparison of different immune cells populations between graft and host 5 months after bone transplantation (n = 4 per group). Data are represented as mean ± SEM. Unless otherwise noted, statistical significance was determined using unpaired two-tailed Student’s t-test. *p < 0.05, ****p < 0.0001.
Figure 1—figure supplement 2
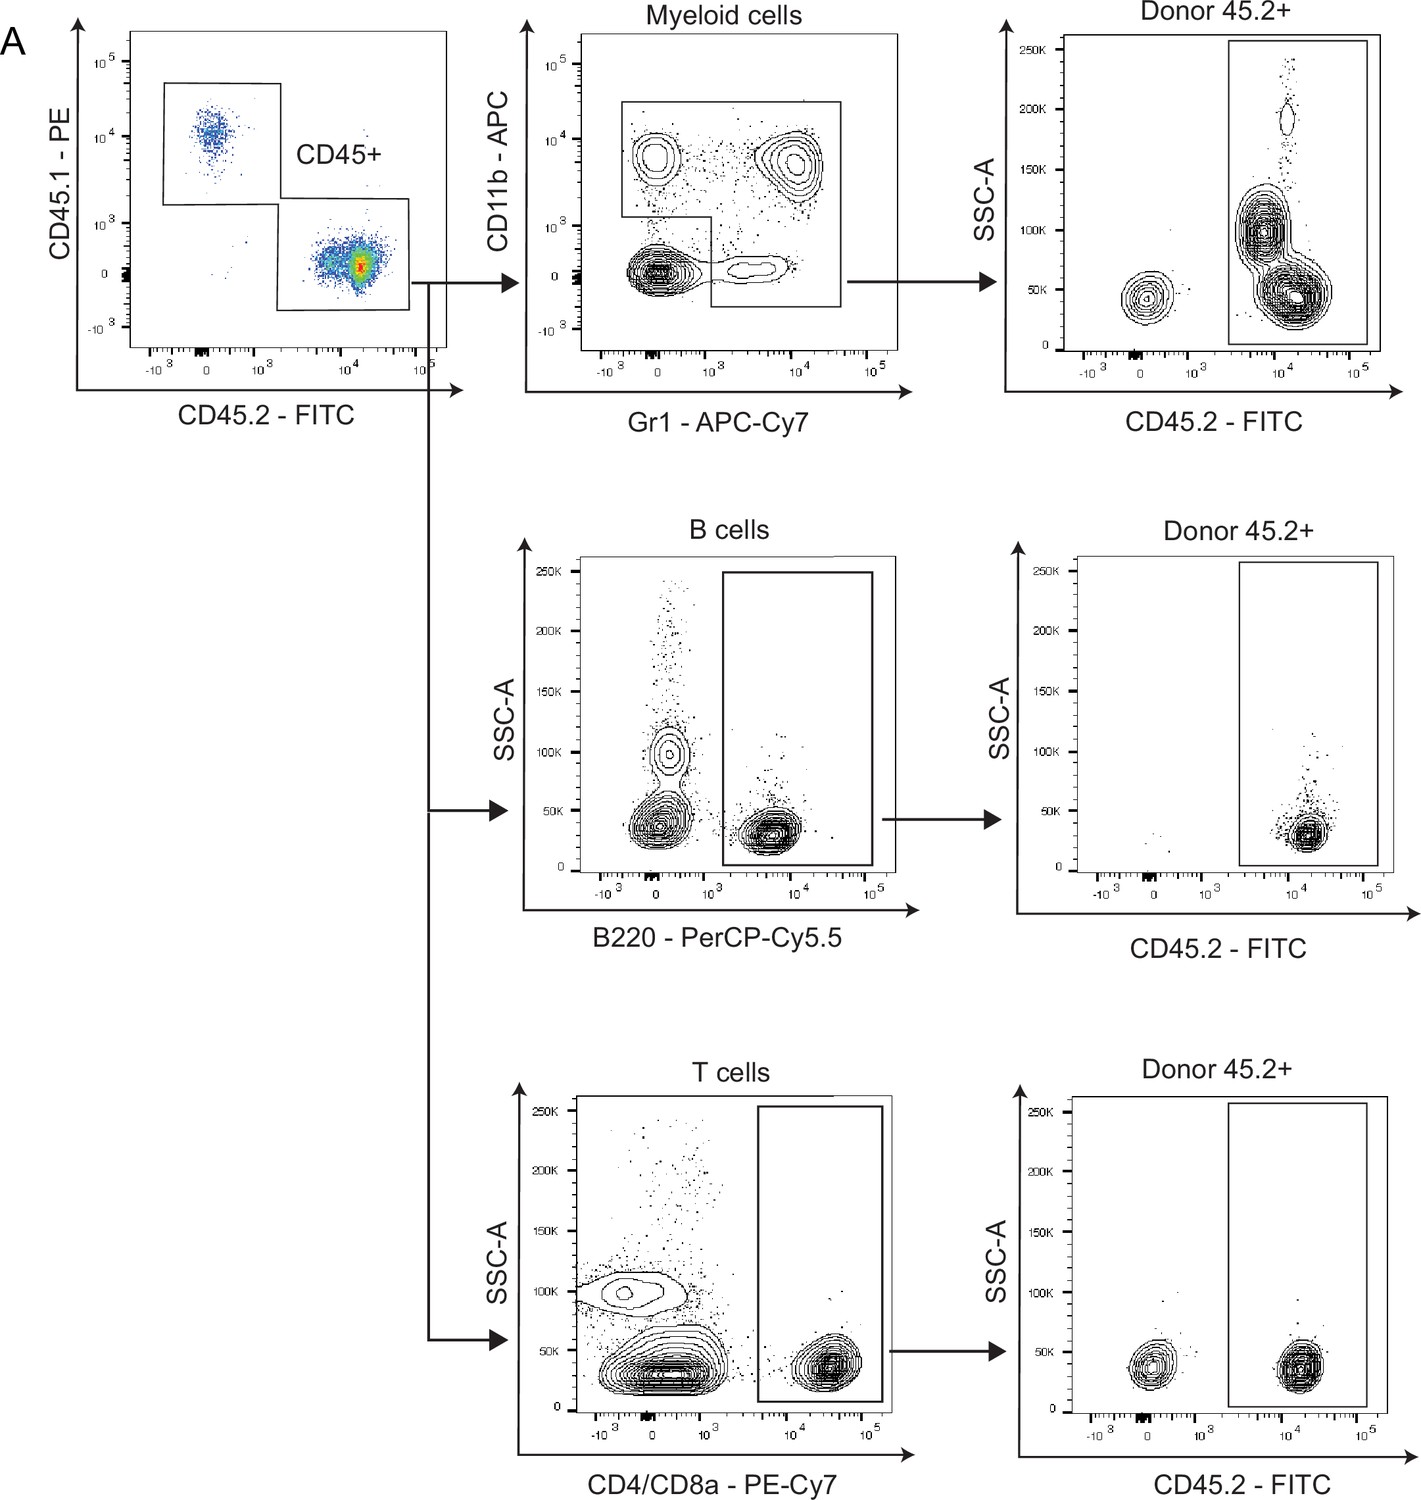
Regenerated bone marrow is capable of supporting hematopoietic cells after transplantation.
(A) Representative FACS plots showing gating strategy for trilineage reconstitution after bone marrow transplantation.
Figure 2 with 2 supplements
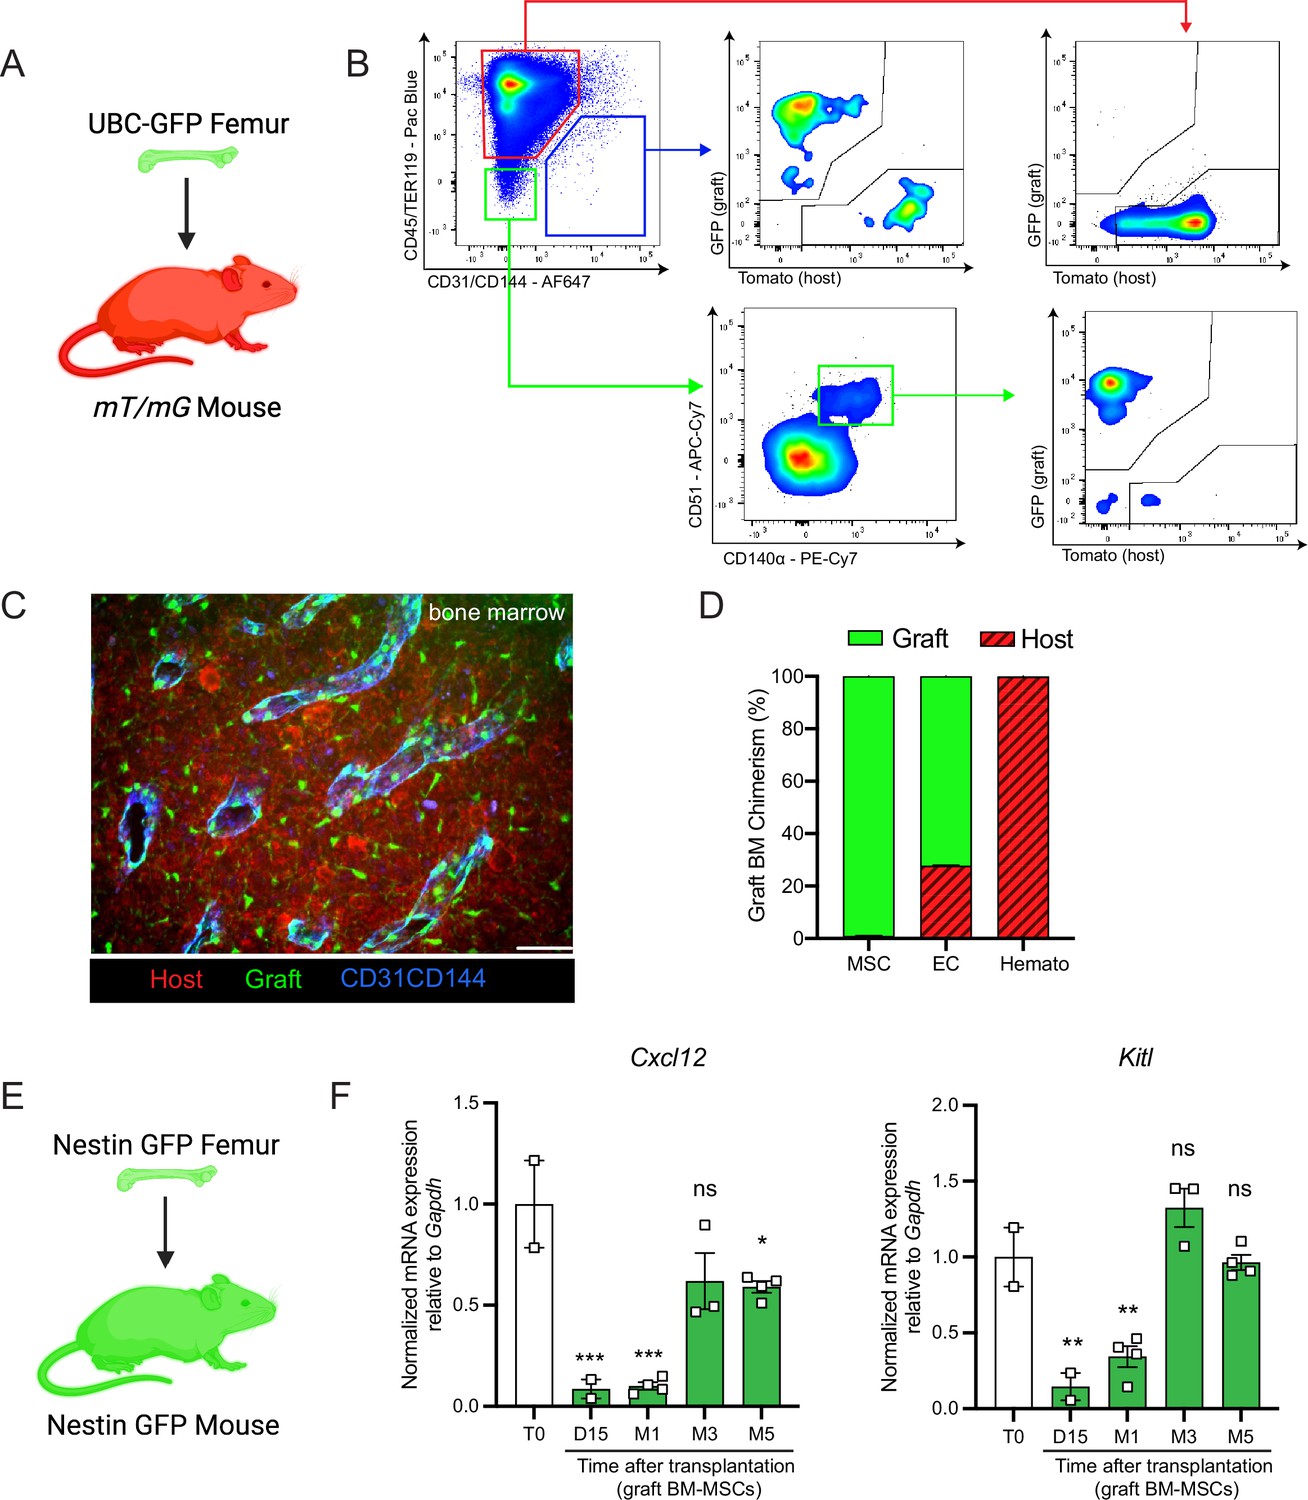
Regenerating bone marrow mesenchymal stem cells (BM-MSCs) are graft-derived and express hematopoietic stem cell (HSC)-niche factors.
(A) Schematic of a UBC-GFP femur transplanted into a mT/mG mouse. (B) Representative FACS plots showing the gating strategy to determine the origin of the different cell fractions in the graft 5 months after transplantation of a UBC-GFP femur into a mT/mG mouse. (C) Representative whole-mount confocal z-stack projections of a UBC-GFP bone transplanted into a mT/mG recipient 5 months after transplantation. Vascularization was stained with anti-CD31 and anti-CD144 antibodies. Scale bar = 100 µm (n = 2 mice). (D) Origin of graft BM-MSCs, endothelial cells (EC) and hematopoietic cells (Hemato) analyzed by flow cytometry 5 months after bone transplantation (n = 2). (E) Schematic of the Nes-GFP femur transplantation into a Nes-GFP mouse recipient. (F) Quantitative RT-PCR analysis of mRNA expression of Cxcl12 and Kitl expression relative to Gapdh in graft Nes-GFP+ BM-MSCs compared to steady-state Nes-GFP+ BM-MSCs at multiple time points after transplantation (n = 2–4 mice per time point). One-way ANOVA with Dunnett multiple comparisons was used to determine statistical significance. Data are represented as the mean ± SEM. Unless otherwise noted, statistical significance was determined using unpaired two-tailed Student’s t-test. *p < 0.05, **p < 0.01, ***p < 0.001,. This figure was created with BioRender.com.
Figure 2—figure supplement 1
Endothelial regeneration after bone transplantation.
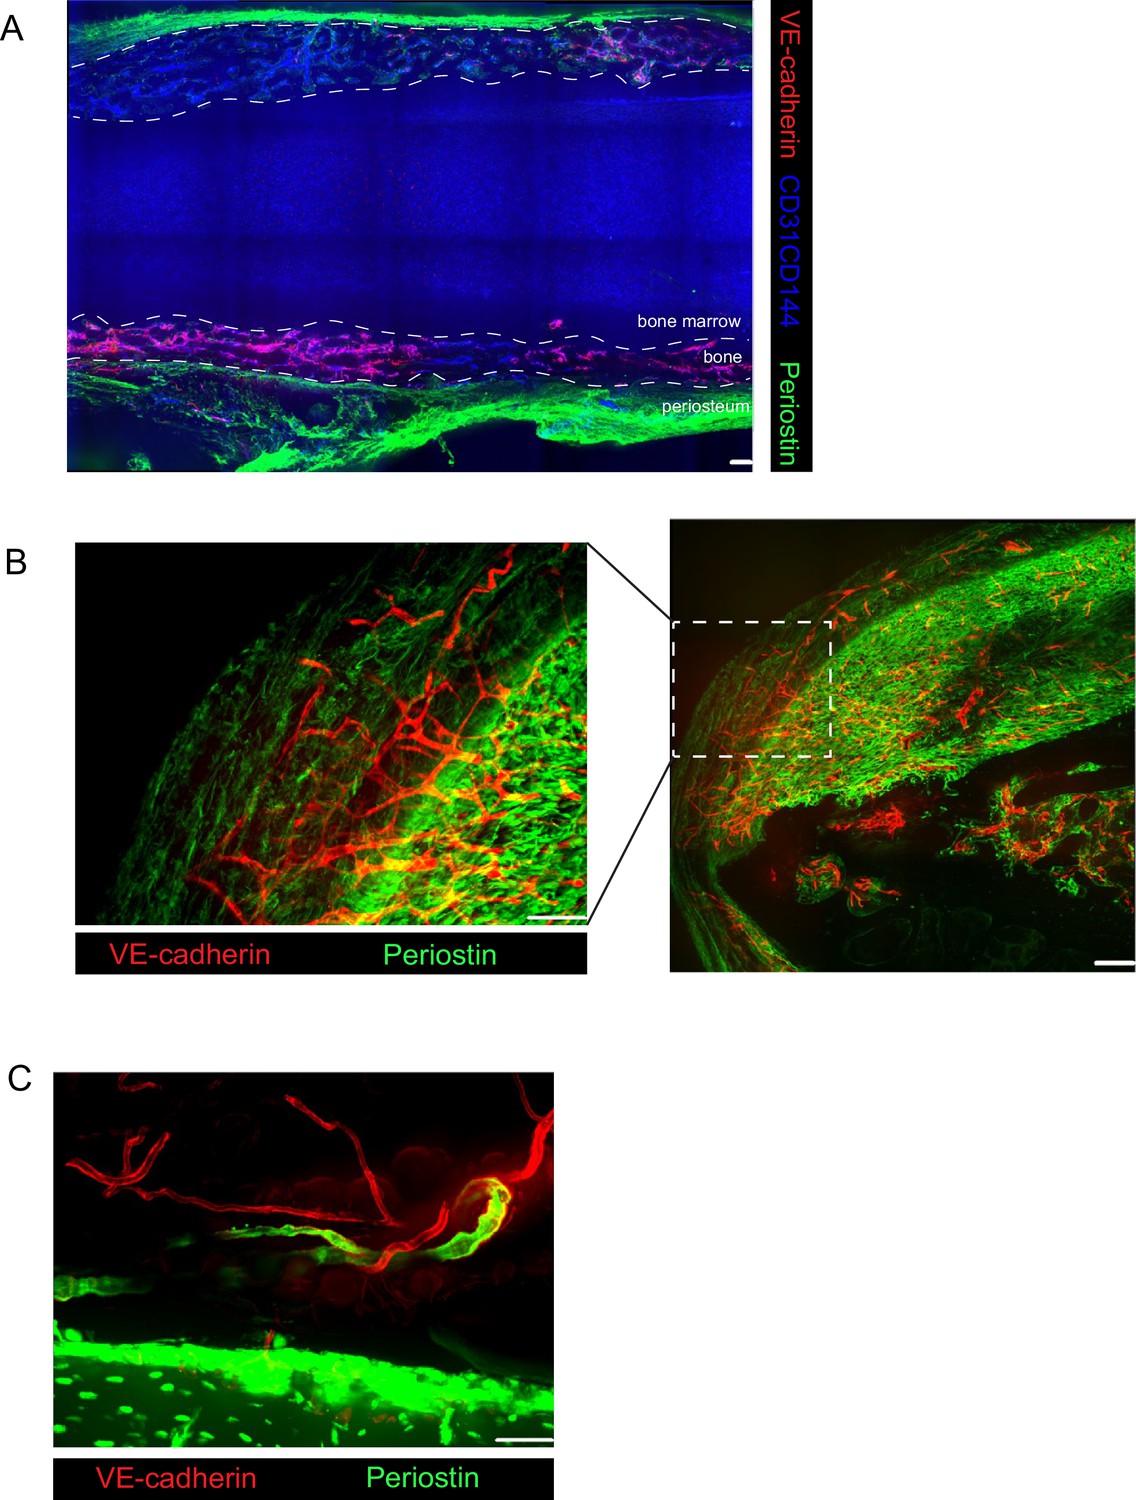
(A) Representative confocal image of graft VE-cadherin-cre;tdTomato femur transplanted into WT recipient 15 days after transplantation. Extracellularmatrix is labeled by an anti-periostin antibody. Scale bar = 100 μm (B) Representative confocal image of graft VE-cadherin-cre;tdTomato femur transplanted into WT recipient 1 month after transplantation. Extracellular matrix is labeled by an anti-periostin antibody. Scale bar = 50 μm (left) and 100 μm (right). (C) Representative confocal image of graft UBC-GFP femur transplanted into VE-cadherin-cre;tdTomato recipient 5 months after transplantation. Extracellular matrix is labeled by an anti-periostin antibody. Scale bar = 50 μm.
Figure 2—figure supplement 2
GFP+ bone marrow mesenchymal stem cells (BM-MSCs) express hematopoietic stem cell (HSC)-niche factors and form colonies.
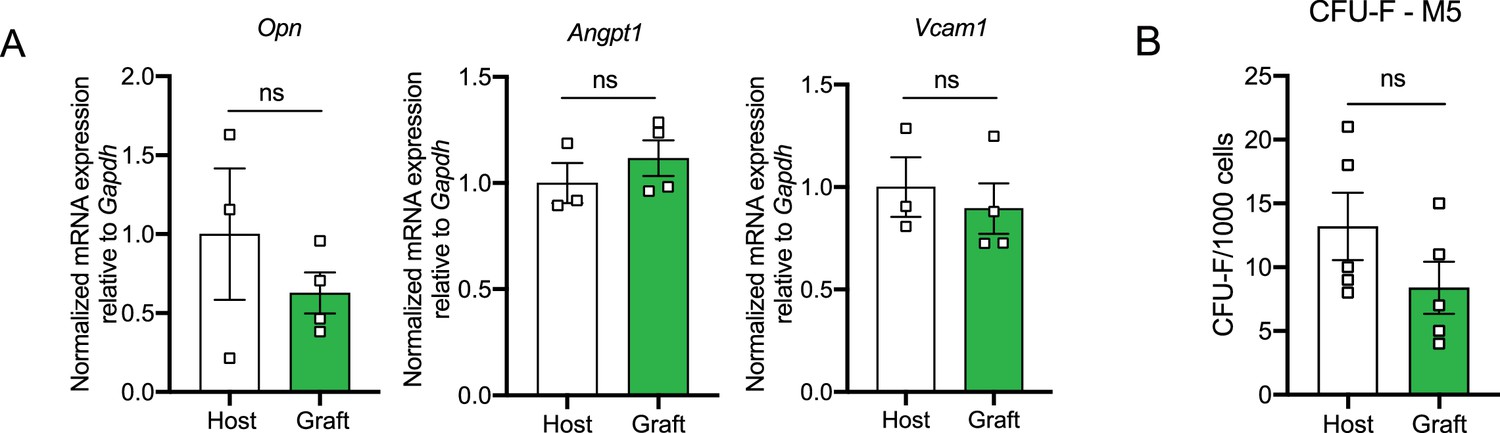
(A) Quantitative RT-PCR analysis of mRNA expression of Opn, Angpt1, and Vcam1 relative to Gapdh in host and graft Nes-GFP+ BM-MSCs 5 months after transplantation (n = 3–4 mice). (B) CFU-F absolute number of flushed CD45−Ter119−Nes-GFP+ BM-MSCs sorted from host and graft femurs 5 months after transplantation and plated at equal number and clonal densities under CFU-fibroblast (CFU-F) culture condition (n = 5 mice per group). Data are represented as mean ± SEM.
Figure 3 with 1 supplement
P-SSCs remain viable and expand after bone transplantation, in contrast to bone marrow mesenchymal stem cells (BM-MSCs).
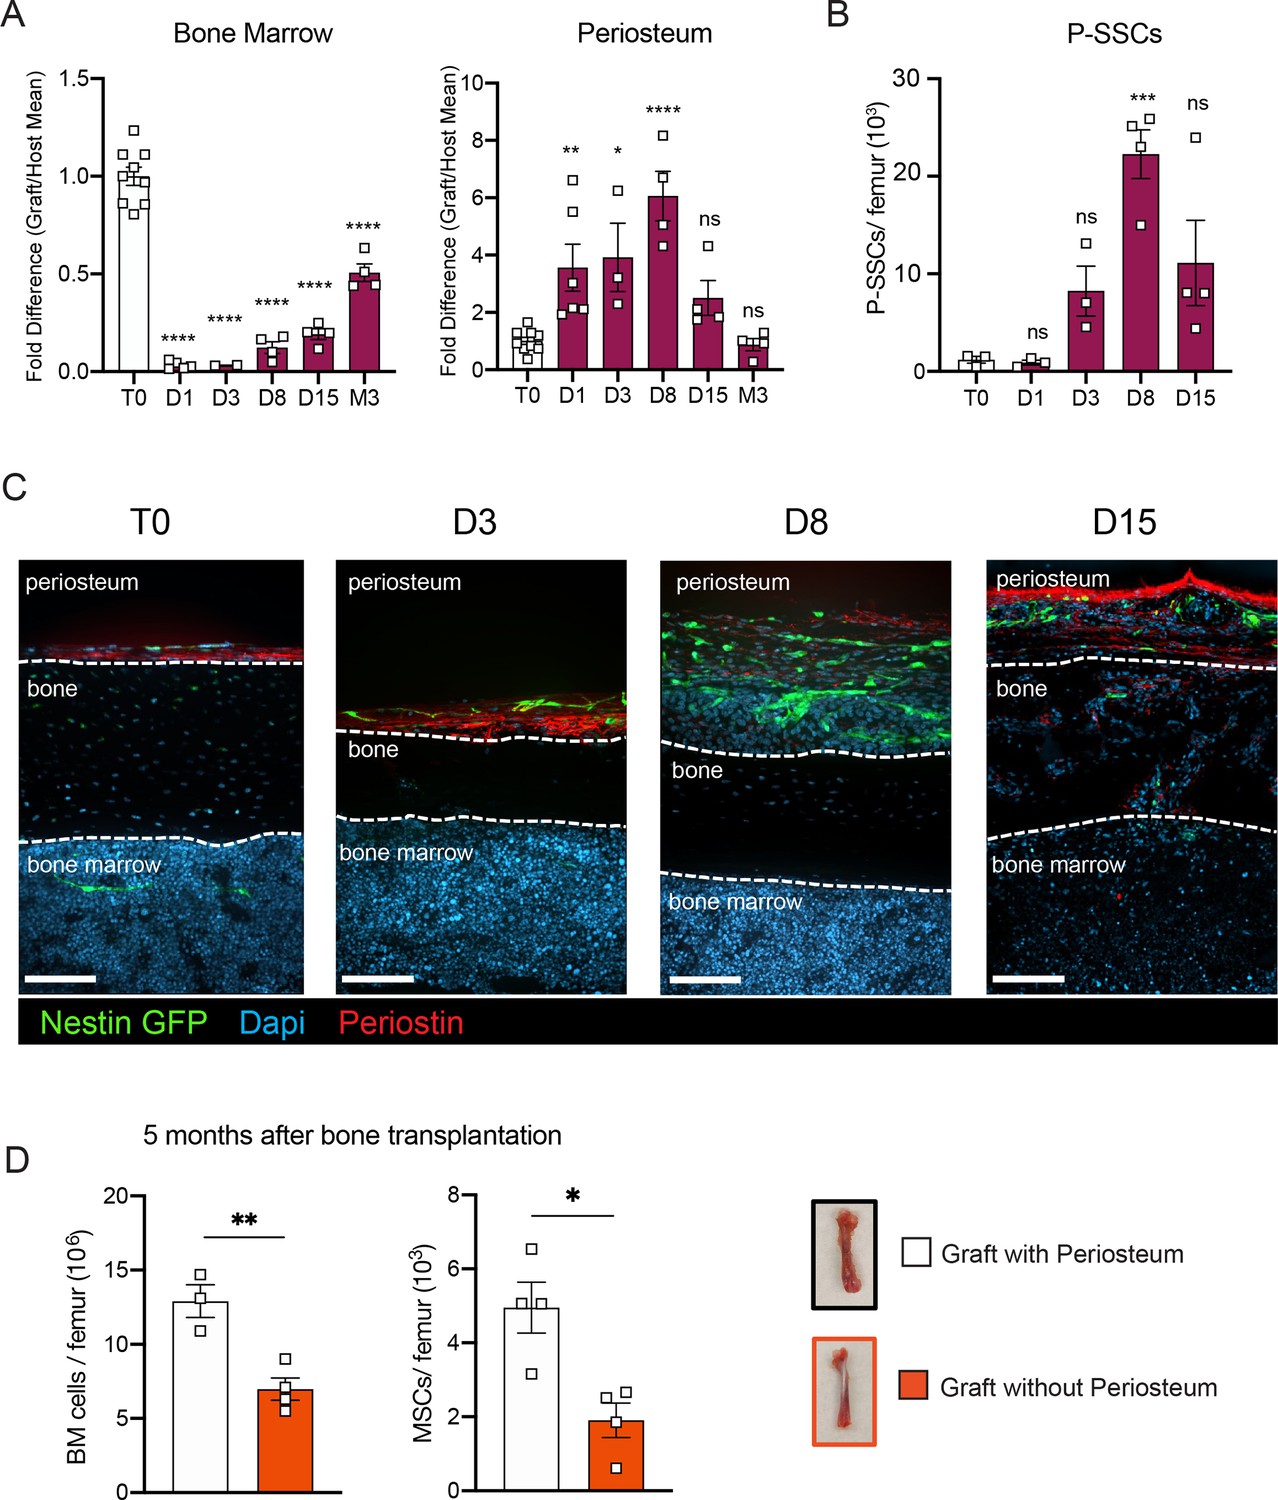
(A) Flow cytometric quantification of fold difference of total graft bone marrow and periosteum cellularity to total steady-state cellularity. Different time points early after transplantation were analyzed (n = 2–8). One-way ANOVA with Dunnett multiple comparisons was used to determine statistical significance. (B) Absolute number of CD45−Ter119−CD31−CD51+CD200+ P-SSCs at steady state and 1-, 8-, and 15-day post-transplantation (n = 3–4 mice per time point). One-way ANOVA with Dunnett multiple comparisons was used to determine statistical significance. (C) Representative whole-mount confocal z-stack projections of Nes-GFP+ bone graft at steady state, 3-, 8-, and 15-day post-transplantation. Three independent experiments yielded similar results. Arrowheads point at Nes-GFP+ cells within the bone and bone marrow. Scale bar = 100 µm. (D) Total bone marrow cellularity and BM-MSC absolute number 5 months after transplantation of bones with or without intact periosteum (n = 3–4 mice per group). Data are represented as the mean ± SEM. Unless otherwise noted, statistical significance was determined using unpaired two-tailed Student’s t-test. *p < 0.05, **p < 0.01, ***p < 0.001, ****p < 0.0001.
Figure 3—figure supplement 1
Periosteal stem cell expansion after transplantation.
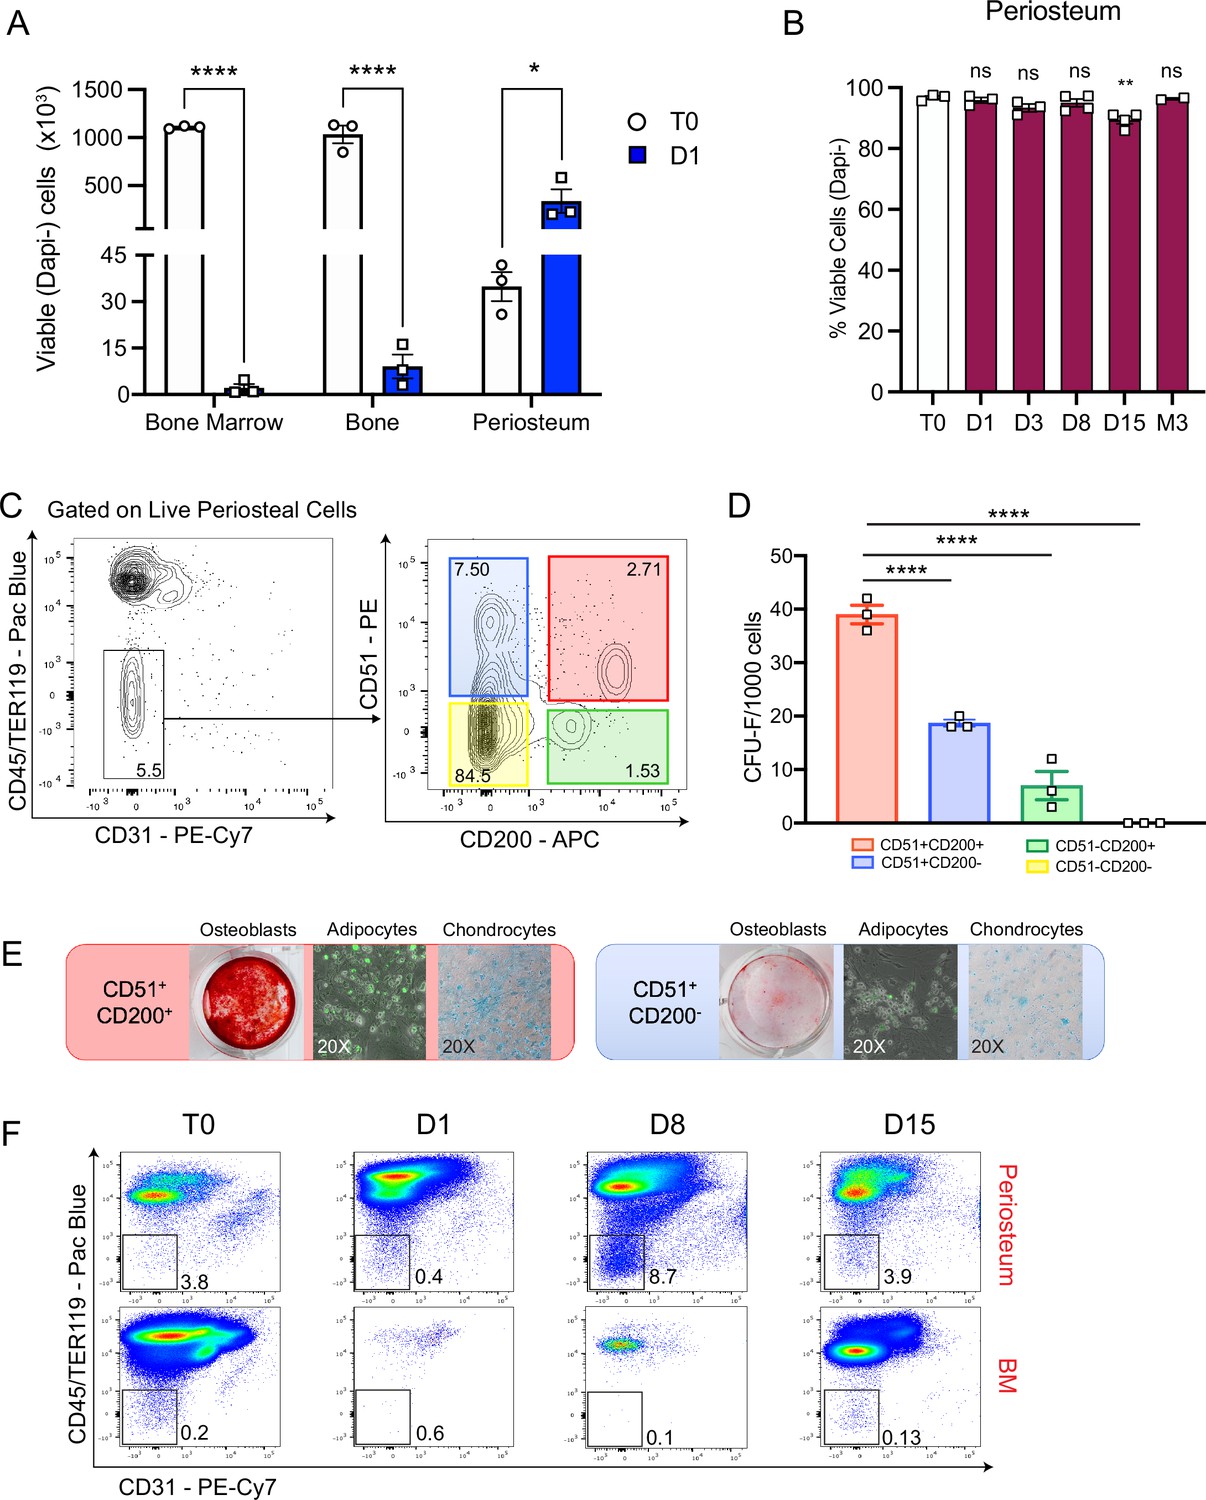
(A) Number of viable cells within bone marrow, bone and periosteum at steady state and 24-hr post-transplantation (n = 3 per group). (B) Cell viability determined by flow cytometry and expressed as percentage of total Dapi- alive cells in the periosteum graft at steady state, 1, 3, 8, 15 days and 3 months after bone transplantation (n = 2–4 per group). One-way ANOVA with Dunnett’s multiple comparisons test used to determine statistical significance. (C) Representative FACS plot showing gating of CD51+CD200+ P-SSCs after gating on triple negative cells (TNC: CD45−Ter119−CD31−) fraction. (D) Absolute CFU-F number from 1000 sorted cells within various TNC subsets of the periosteum. One-way ANOVA with Dunnett’s multiple comparisons test used to determine statistical significance. (E) Representative trilineage differentiation pictures of CD51+CD200+ compared to the group with the next highest CFU-F activity (CD51+CD200− cells). Differentiation into osteoblasts, adipocytes, and chondrocytes observed using Alizarin Red, Bodipy, and Alican Blue staining, respectively. (F) Representative FACS plots of graft periosteum and bone marrow analysis gated on TNC fraction at steady state, 1-, 8-, and 15-day post-transplantation. Data are represented as mean ± SEM. Unless otherwise noted, statistical significance was determined using unpaired two-tailed Student’s t-test. *p < 0.05, **p < 0.01, ****p < 0.0001.
Figure 4 with 2 supplements
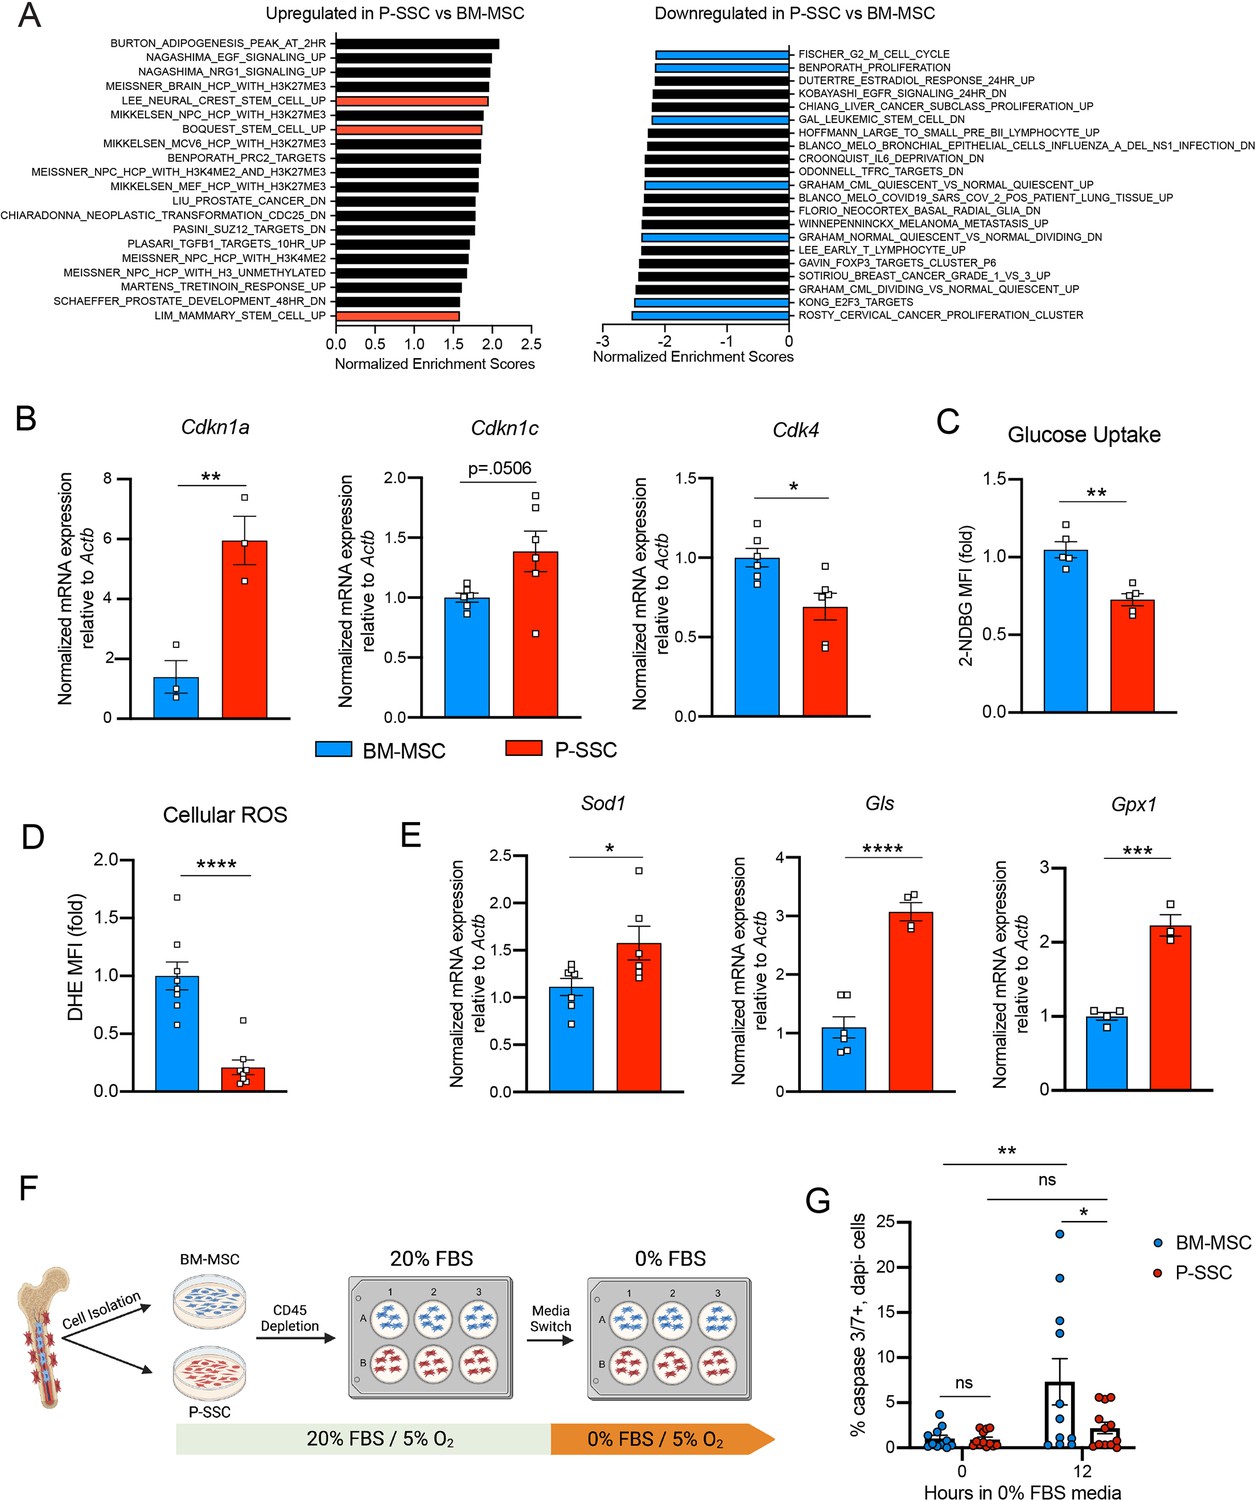
Periosteal skeletal stem cells (SSCs) have a metabolic profile conferring a resistance to stress.
(A) Gene set enrichment analysis (GSEA) plots comparing P-SSCs versus bone marrow mesenchymal stem cells (BM-MSCs) at steady state (n = 3 per group). (B) Quantitative RT-PCR analysis of mRNA expression of Cdkn1a, Cdkn1c, Cdk4 relative to Actb in sorted CD45−Ter119−CD31−CD51+CD200+ BM-MSCs and P-SSCs (n = 3–6 per group). (C) Flow cytometric analysis of glucose uptake at steady state in CD45−Ter119−CD31−CD51+CD200+ BM-MSCs and P-SSCs (n = 5 per group). (D) Quantification of cellular reactive oxygen species (ROS) at steady state in CD45−Ter119−CD31−CD51+CD200+ BM-MSCs and P-SSCs (n = 8 per group). (E) Quantitative RT-PCR analysis of mRNA expression of Sod1, Gls, and Gpx1 relative to Actb in sorted CD45−Ter119−CD31−CD51+CD200+ BM-MSCs and P-SSCs (n = 3–7 per group). (F) Schematic illustration of the protocol for the in vitro apoptosis assay. BM-MSCs and P-SSCs were isolated and digested before plating in a 10-cm dish. At near confluence, cells underwent CD45 lineage depletion and plated into multi-well plates. At near confluence, medium was switched from 20% to 0% fetal bovine serum (FBS). Cells were analyzed at the time of medium switch and 12 hr. (G) Percentage of apoptotic BM-MSCs and P-SSCs cultured under 5% O2 at baseline and 12 hr after being in 0% FBS serum conditions (n = 11–12 per group). Two-way ANOVA with Tukey’s multiple comparisons test was used to determine statistical significance. Data are represented as the mean ± SEM. Unless otherwise noted, statistical significance was determined using unpaired two-tailed Student’s t-test. *p < 0.05, **p < 0.01, ***p < 0.001, ****p < 0.0001. This figure was created with BioRender.com.
Figure 4—figure supplement 1
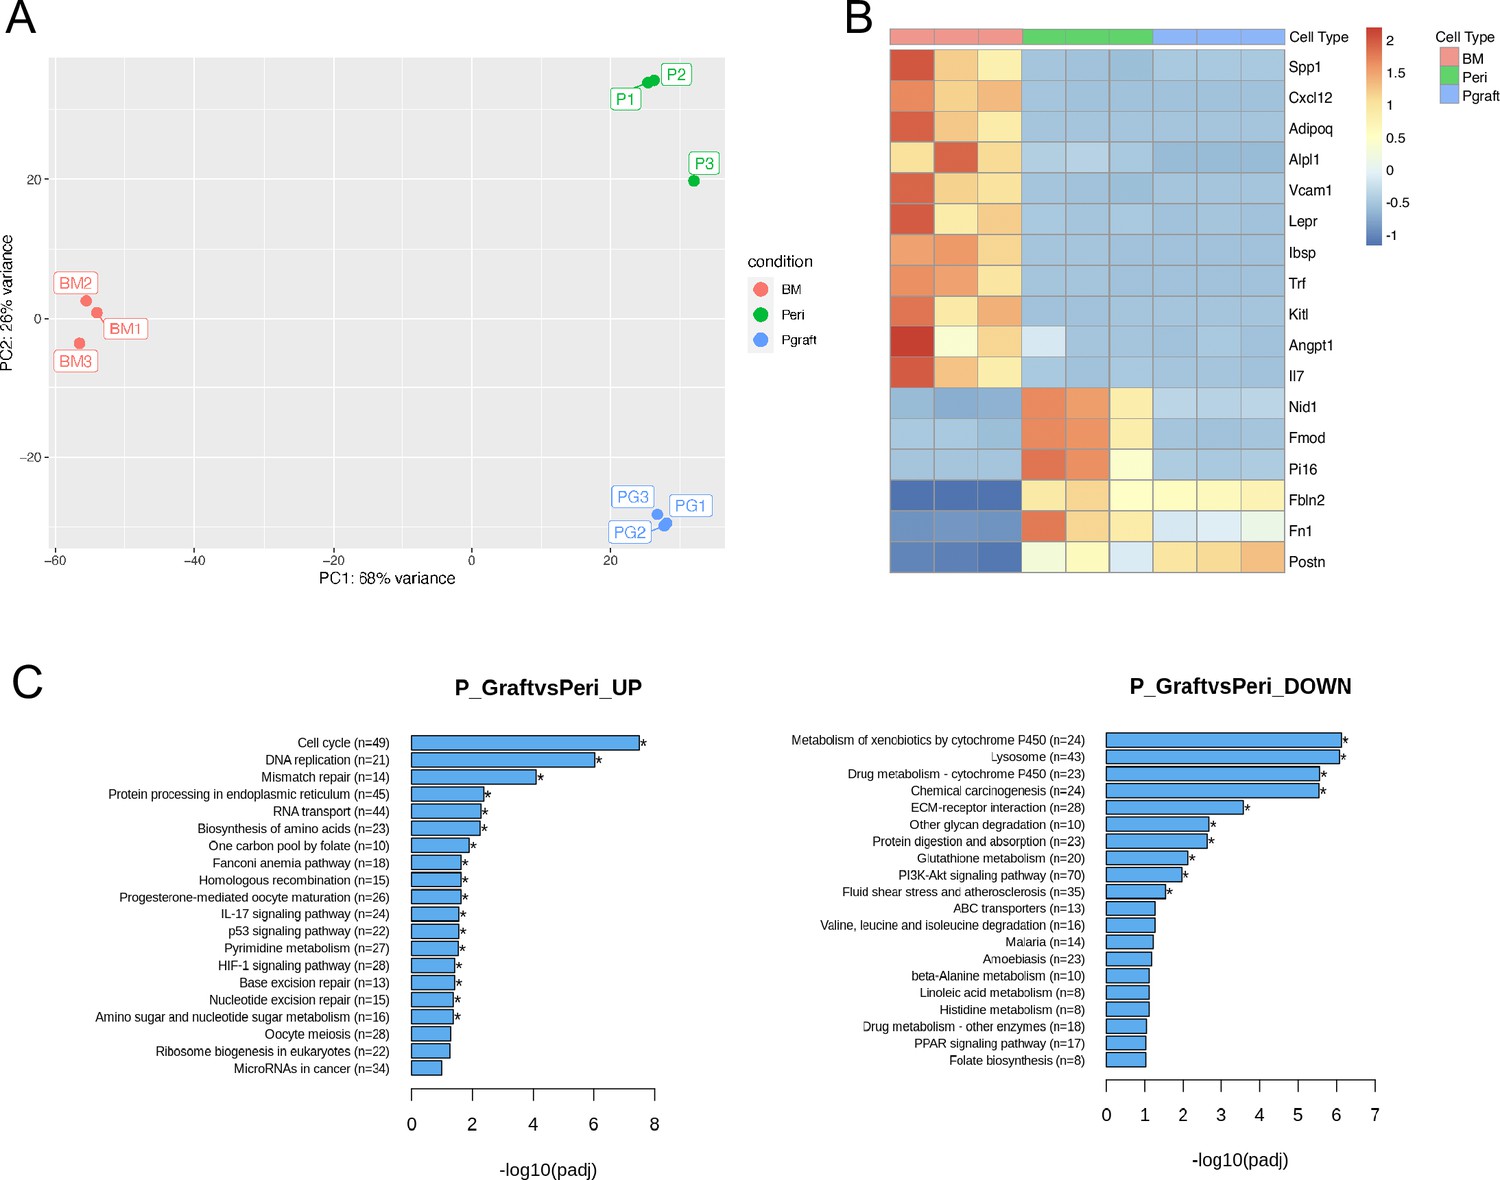
RNA sequencing analysis of periosteal skeletal stem cells (SSCs), 3-day graft periosteal and SSCs, and bone marrow MSCs.
(A) 2D principal component analysis (PCA) plot showing variance between steady-state P-SSCs and graft P-SSCs 3 days after bone transplantation (n = 3). (B) Heatmap expression level of selected genes as defined by previous studies for hematopoietic stem cell (HSC)-niche cell and extracellular matrix genes (n = 3). (C) KEGG analysis displaying signatures that are significantly up- and down-regulated between steady-state P-SSCs and graft P-SSCs 3 days after bone transplantation (n = 3). Data are represented as mean ± SEM.
Figure 4—figure supplement 2

Comparison of periosteal skeletal stem cells (SSCs) and bone marrow MSCs.
Representative FACS plots showing gating strategy for analyzing apoptosis 12 hr after switching from 20% to 0% fetal bovine serum (FBS) media.
Figure 5 with 1 supplement
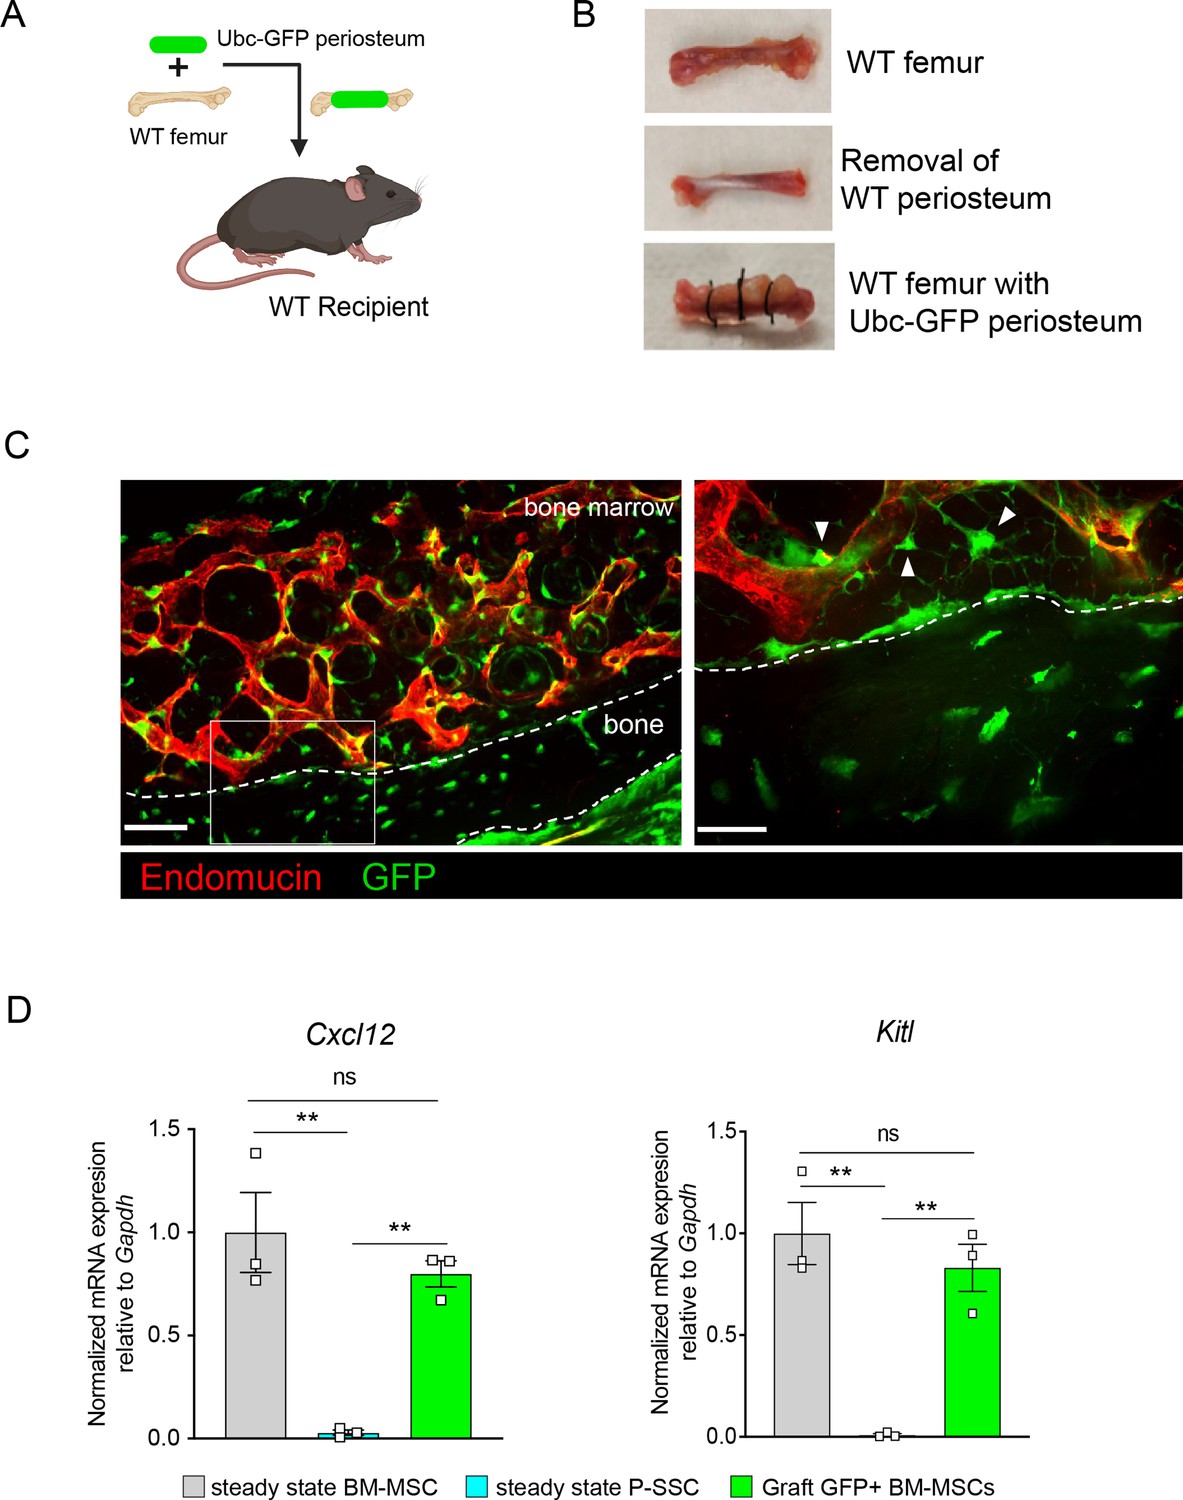
Periosteal skeletal stem cells (SSCs) migrate into the bone marrow and support stromal regeneration after bone transplantation.
(A) Schematic of the transplantation of a WT bone enwrapped with periosteum from a UBC-GFP mouse donor into a WT recipient mouse. (B) Pictures illustrating the transplantation of a WT bone enwrapped with periosteum from a UBC-GFP mouse donor into a WT recipient mouse. (C) Representative whole-mount confocal z-stack projections of wild-type bone graft enwrapped with periosteum from a UBC-GFP mouse donor into a WT recipient mouse 5 months after transplantation. Three independent experiments yielded similar results. Right panel: arrows pointing to GFP+ periosteum located perivascularly. Scale bar = 50 µm (left panel) and 20 µm (right panel). (D) Quantification of Cxcl12 and Kitl mRNA levels relative to Gapdh in sorted control CD45−Ter119−CD31−Nestin-GFP+ bone marrow mesenchymal stem cells (BM-MSCs), CD45−Ter119−CD31−CD51+CD200+ P-SSCs, and CD45−Ter119−CD31−CD51+CD200+GFP+ periosteum-derived graft BM-MSCs (n = 3–4 per group). One-way ANOVA with Tukey’s multiple comparisons was used to determine statistical significance. Data are represented as the mean ± SEM. Unless otherwise noted, statistical significance was determined using unpaired two-tailed Student’s t-test. **p < 0.01. This figure was created with BioRender.com.
Figure 5—figure supplement 1
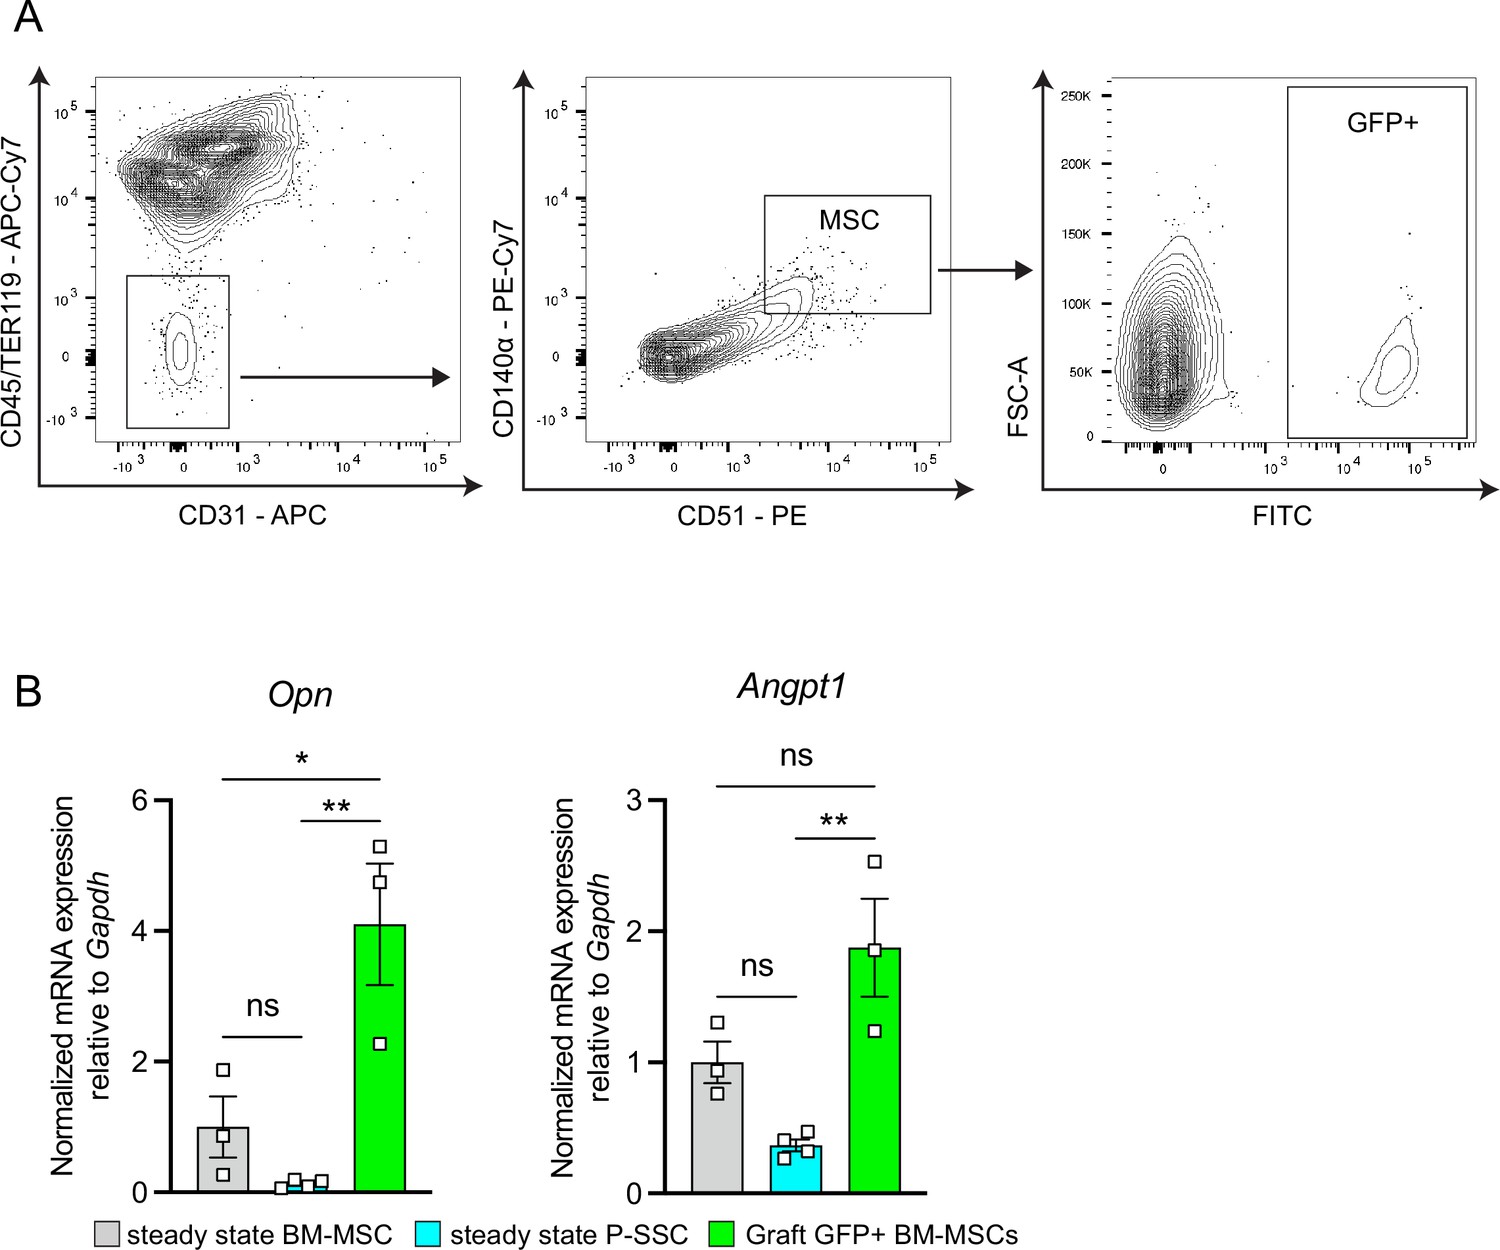
Periosteal skeletal stem cells (SSCs) migrate into the bone marrow and upregulate hematopoietic stem cell (HSC)-niche factors.
(A) Representative FACs plots showing gating strategy for sorting GFP+ bone marrow mesenchymal stem cells (BM-MSCs) used in qPCR analysis. (B) Quantification of Opn and Angpt1 mRNA level relative to Gapdh in sorted control bone marrow CD45−Ter119−CD31−Nestin-GFP+ BM-MSCs, CD45−Ter119−CD31−CD51+CD200+ steady-state P-SSCs, and CD45−Ter119−CD31−CD51+CD200+GFP+ graft BM-MSCs (n = 3–4 per group). One-way ANOVA used to determine statistical significance. Data are represented as mean ± SEM. Unless otherwise noted, statistical significance was determined using unpaired two-tailed Student’s t-test. *p < 0.05, **p < 0.01.
Figure 6 with 3 supplements
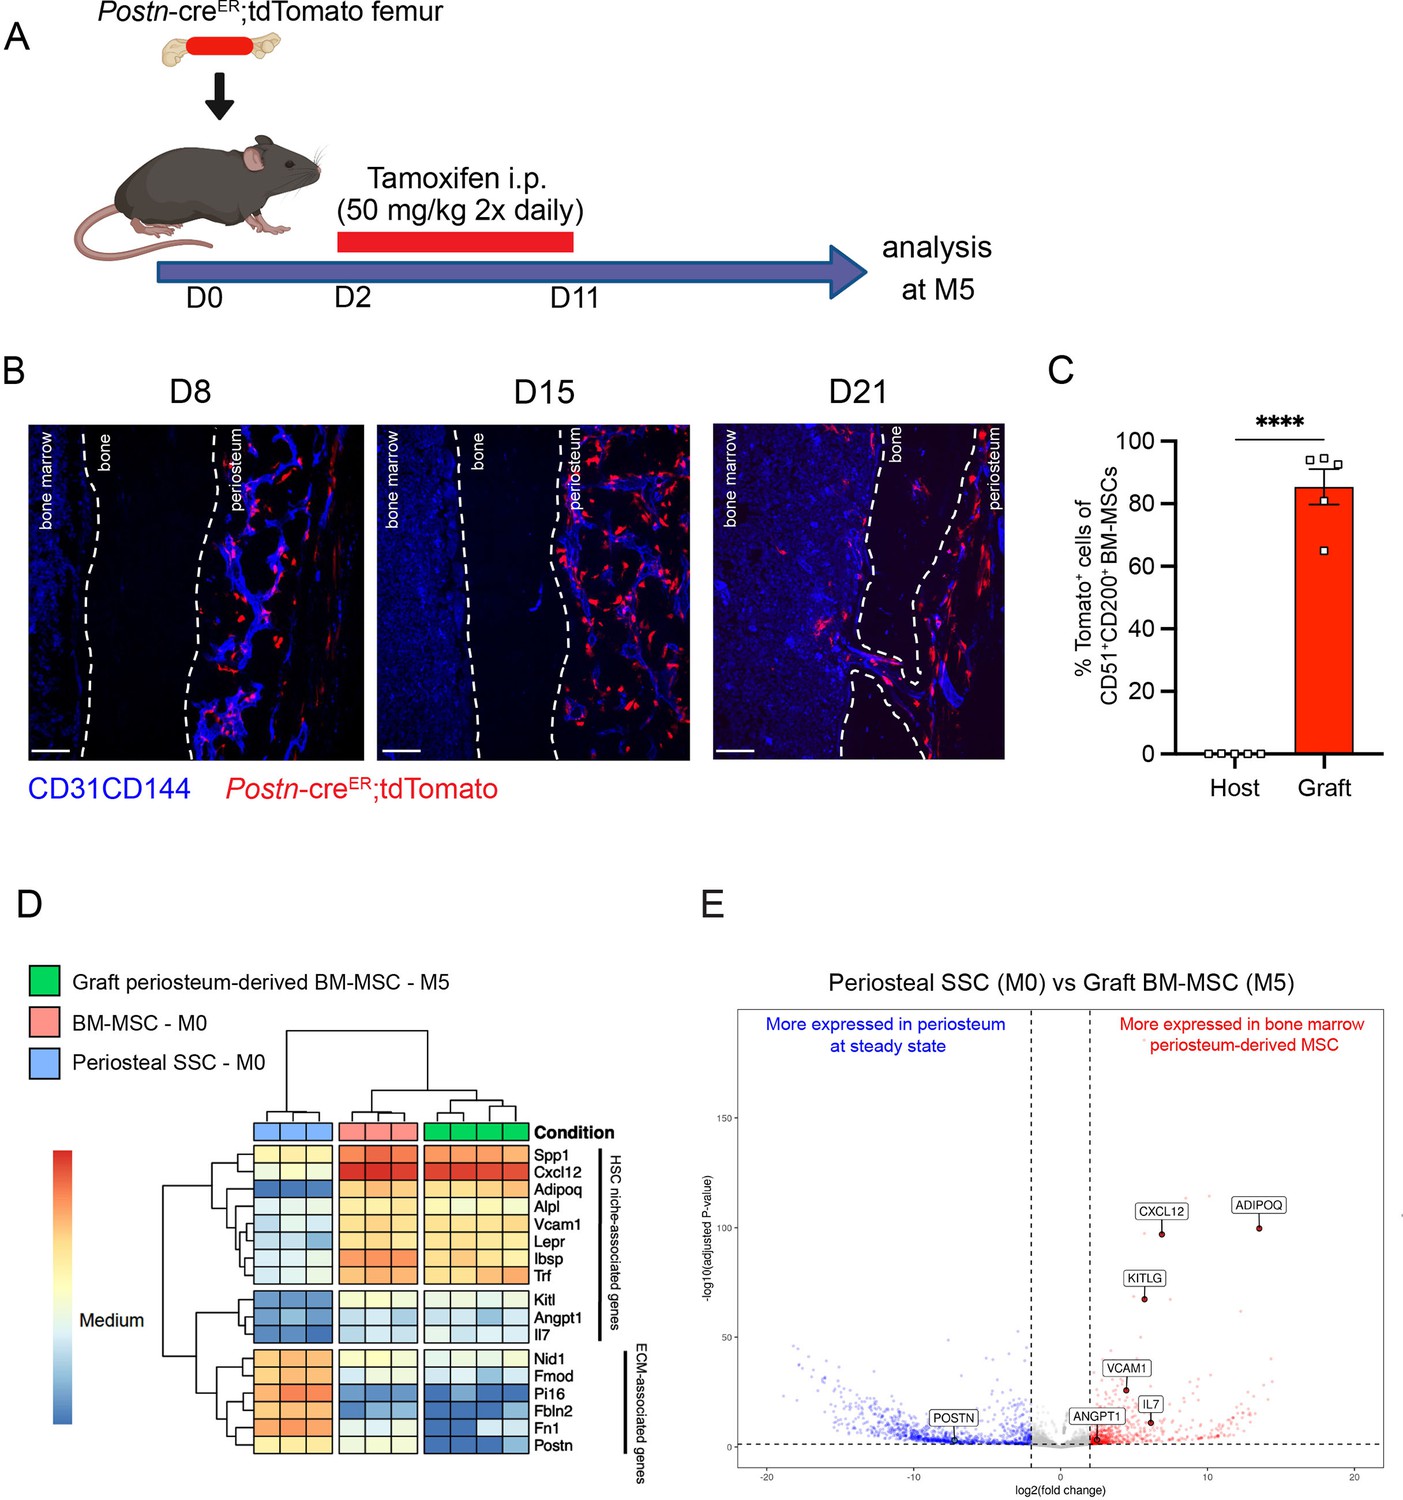
Periosteum-derived graft bone marrow mesenchymal stem cells (BM-MSCs) adopt characteristics of baseline BM-MSCs, including the expression of hematopoietic stem cell (HSC)-niche factors.
(A) Schematic illustration of the transplantation of a PostnCre-ER;tdTomato femur into a WT recipient mouse. (B) Representative whole-mount confocal z-stack projections of transplanted PostnCre-ER;tdTomato femurs into a WT recipient 8-, 15-, and 21 days after transplantation. Two to three independent experiments yielded similar results. Scale bar = 100 µm. (C) Percentage of graft periosteum-derived BM-MSCs labeled Tomato+ 5 months after transplantation of a bone from a PostnCre-ER;tdTomato mouse into a WT recipient (n = 5). (D) Heatmap expression level of selected genes defined by previous studies for HSC-niche cells and extracellular matrix genes (n = 3–4). (E) Volcano plot of P-SSCs compared to graft BM-MSCs showing higher expression of HSC-niche-associated genes in graft BM-MSCs. Data are represented as the mean ± SEM. Unless otherwise noted, statistical significance was determined using unpaired two-tailed Student’s t-test. ****p < 0.0001. This figure was created with BioRender.com.
Figure 6—figure supplement 1
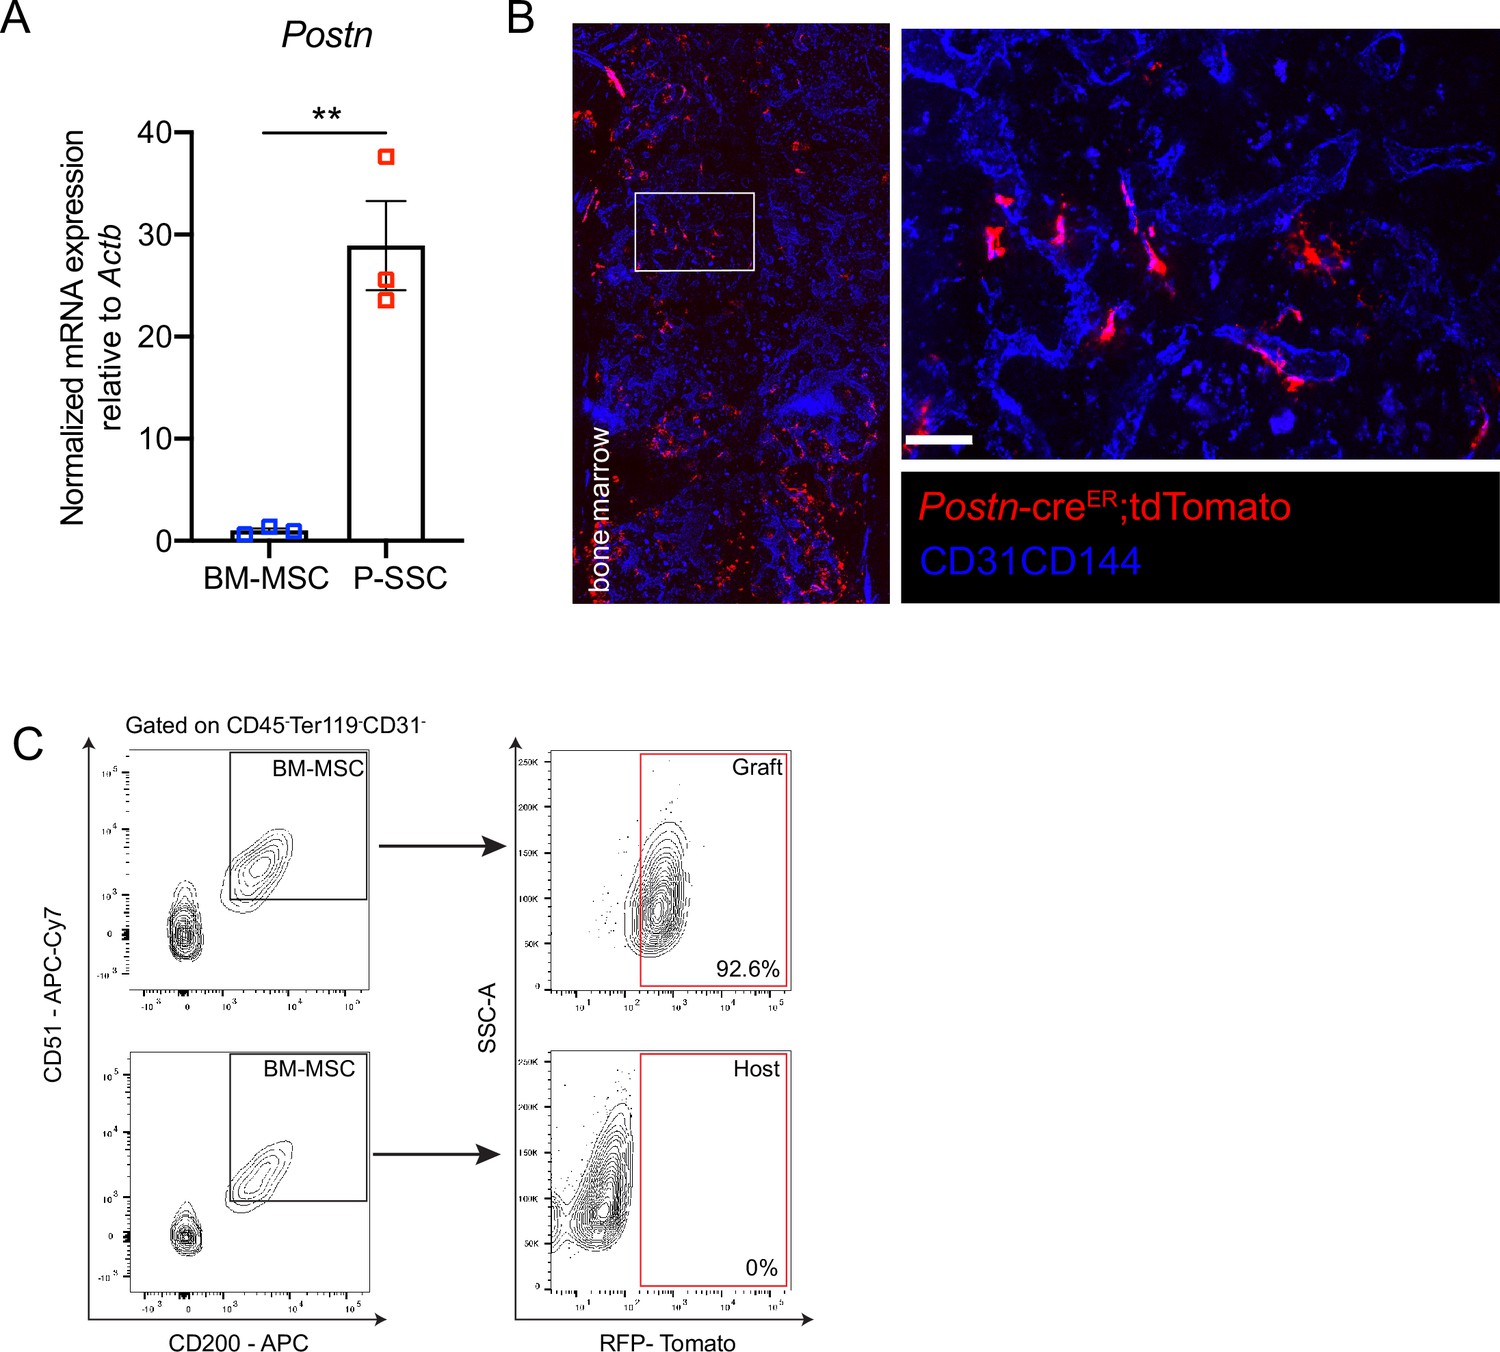
Postn-CreER;tdTomato can be used to lineage trace periosteal skeletal stem cells (SSCs) and label periosteum-derived bone marrow mesenchymal stem cells (BM-MSCs).
(A) Postn expression in sorted, steady-state CD51+CD200+ BM-MSCs and P-SSCs from CD45.2 WT mice (n = 3). (B) Representative whole-mount confocal z-stack projections of bone marrow from PostnCre-ER;tdTomato femurs into a WT recipient mouse 5 months after transplantation. Three independent experiments yielded similar results. Scale bar = 50 μm (right panel). (C) Representative FACS plots showing gating strategy for identifying Tomato+ BM-MSCs. Data are represented as mean ± SEM. Unless otherwise noted, statistical significance was determined using unpaired two-tailed Student’s t-test. **p < 0.01.
Figure 6—figure supplement 2
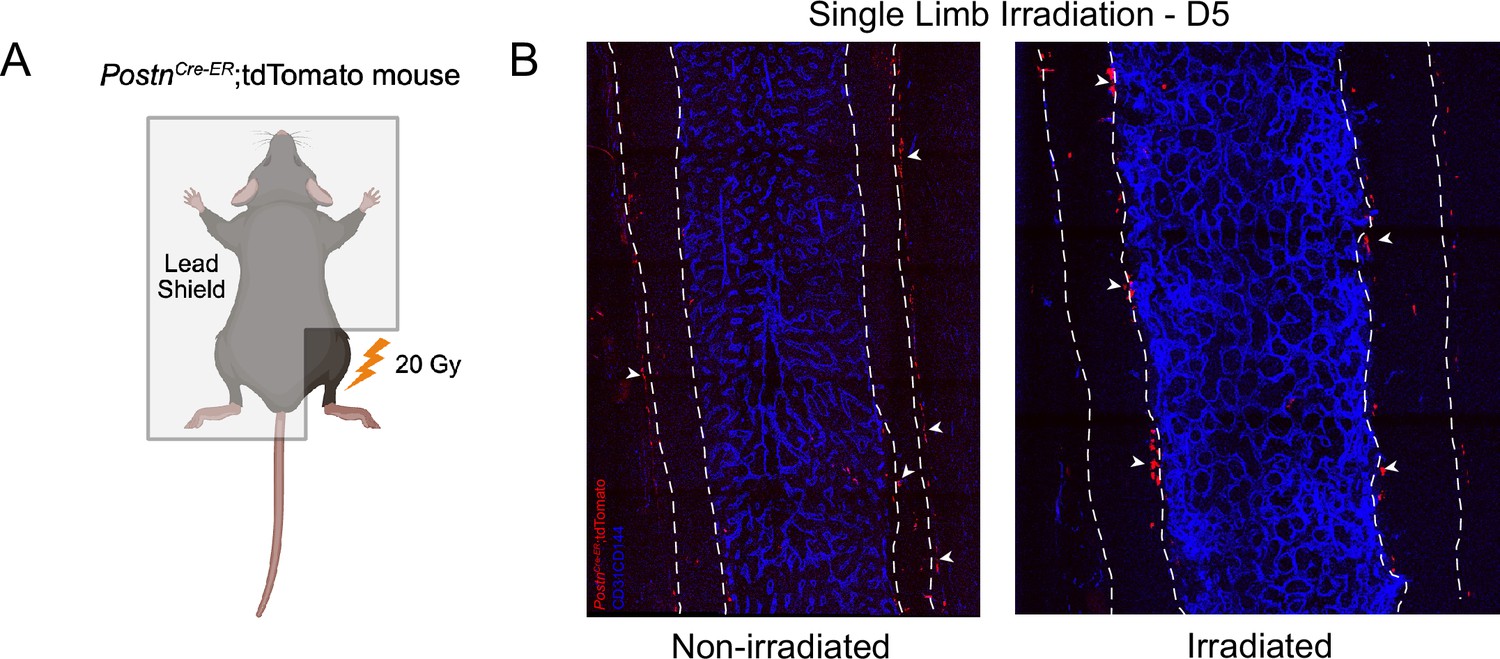
Single limb irradiation of PostnCre-ER;tdTomato mice.
(A) Schematic diagram representing single limb irradiation of PostnCre-ER;tdTomato mice. (B) Whole-mount confocal z-stack projections of bone marrow 5 days later. White arrows point at areas of Tomato labeling along the periosteum and cortical bone. This figure was created with BioRender.com.
Figure 6—figure supplement 3
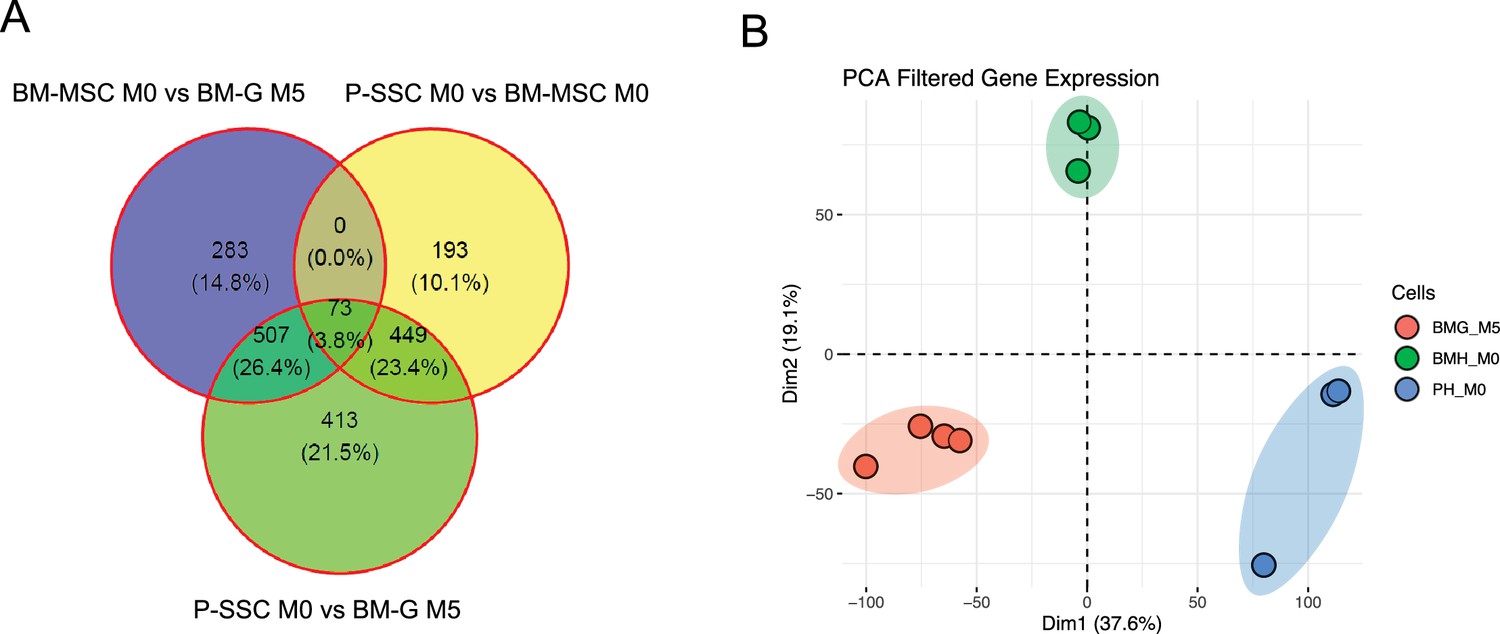
Graft Tomato+ bone marrow mesenchymal stem cells (BM-MSCs) derived from P-SSCs exhibit profile similar to that of steady-state BM-MSCs.
(A) Venn diagram of RNA sequencing analysis comparing the numbers of differentially expressed genes between the groups. (B) 2D principal component analysis (PCA) plot showing variance between graft BM-MSCs at 5 months post-transplantation, and BM-MSCs and P-SSCs at steady state (n = 3–4).
Tables
Appendix 1—key resources table
| Reagent type (species) or resource | Designation | Source or reference | Identifiers | Additional information |
|---|---|---|---|---|
| Strain, strain background (M. musculus) | B6.129S-Postntm2.1(cre/Esr1*)Jmol/J | Kanisicak et al., 2016 | Strain #:029645 RRID:IMSR_JAX:029645 | |
| Strain, strain background (M. musculus) | Nestin-GFP | Méndez-Ferrer et al., 2010 | Strain #:033927 RRID:IMSR_JAX:033927 | |
| Strain, strain background (M. musculus) | Gt(ROSA)26Sortm4(ACTB-tdTomato,-EGFP)Luo/J (RosamT/mG) | Muzumdar et al., 2007 | Strain #:007576 RRID:IMSR_JAX:007576 | |
| Strain, strain background (M. musculus) | C57BL/6-Tg(UBC-GFP)30Scha/J | Liu et al., 2020 | Strain #:004353 RRID:IMSR_JAX:004353 | |
| Strain, strain background (M. musculus) | Cdh5-CreER; iTdTomato | H. Adams (Max Planck Institute for Molecular Biomedicine, Germany) | ||
| Strain, strain background (M. musculus) | C57BL/6 | The Jackson Laboratory/ Bred in lab | Strain #:000664 RRID:IMSR_JAX:000664 | |
| Antibody | anti-streptavidin FITC/ APC-Cy7 | Invitrogen | RRID:AB_10053373 (FITC), AB_10054651 (APC-Cy7) | FC (1:100) |
| Antibody | anti-CD45 APC-eFluor 780/Pacific Blue | Invitrogen (APC-eFluor 780), Biolegend (Pacific Blue) | APC- eFluor 780 (RRID:AB_1548781), Pacific Blue (RRID:AB_493535) | Clone: 30-F11 FC (1:100) |
| Antibody | anti-CD11b AF647 | Biolegend | RRID:AB_389327 | Clone: M1/70 FC (1:100) |
| Antibody | anti-CD4 PE-Cy7 | Invitrogen | RRID:AB_469576 | Clone: GK1.5 FC (1:100) |
| Antibody | anti-CD8a PE-Cy7 | Invitrogen | RRID:AB_469584 | Clone: 53-6.7 FC (1:100) |
| Antibody | anti-B220 PerCP-Cy5.5 | Invitrogen | RRID:AB_1107006 | Clone: RA3-6B2 FC (1:100) |
| Antibody | anti-CD45.1 PE | Biolegend | RRID:AB_389327 | Clone: A20 FC (1:100) |
| Antibody | anti-CD45.2 FITC | Biolegend | RRID:AB_313442 | Clone: 104 FC (1:100) |
| Antibody | anti-CD144 AF647 | Biolegend | RRID:AB_10568319 | Clone: BV13 FC (1:100) IF (1:10) |
| Antibody | anti-Gr-1 APC-eFluor 780 | Invitrogen | RRID:AB_2534437 | Clone: RB6-8C5 FC (1:100) |
| Antibody | anti-Ter119 Pacific Blue/ APC-eFlour 780 | Biolegend (Pacific Blue), Invitrogen (APC- eFluor 780) | RRID:AB_1548786 (APC- eFluor 780), AB_225116 (Pacific Blue) | Clone: Ter-119 FC (1:100) |
| Antibody | anti-CD31 PE-Cy7/AF647 | Biolegend | RRID:AB_830756 (PE-Cy7), AB_493410 (AF647) | Clone: 390 FC (1:100) IF (1:10) |
| Antibody | anti-CD51 biotin/ PE | Biolegend (biotin), Invitrogen (PE) | RRID:AB_313072 (biotin), AB_465704 (PE) | Clone: RMV-7 FC (1:100) |
| Antibody | anti-CD200 APC | Biolegend | RRID:AB_10900447 | Clone: OX-90 FC (1:100) |
| Antibody | Anti-perilipin rabbit polyclonal | Cell Signalling Technology | Catalog #: 9349 | Clone D1D8 IF (1:100) |
| Antibody | Anti-periostin goat polyclonal | R&D | Catalog #: AF2955 | IF (1:100) |
| Antibody | Anti-endomucin rat monocloncal | Santa Cruz | Catalog #: sc-65495 | Clone: V.7C7 (1:100) |
| Chemical compound | Collagenase Type IV | Gibco | Catalog #: 17104019 | |
| Chemical compound | Dispase II | Gibco | Catalog #: 17105041 | |
| Chemical compound | Glutamax | Gibco | Catalog #: 35050061 | (1:100) |
| Chemical compound | 10% MesenCult Stimulatory Supplement | StemCell Technologies | Catalog #: 05402 | |
| Chemical compound | 2-NDBG | Cayman Chemical Company | Catalog #: 11046 | |
| Chemical compound | SCEM embedding media | Section-lab | Kawamoto and Shimizu, 2000 | |
| Chemical Compound | StemXVivo Osteogenic/Adipogenic Base media | R&D Systems | Catalog #: CCM007 | |
| Chemical Compound | StemXVivo Chondrogenic Base Media | R&D Systems | Catalog #: CCM005 | |
| Chemical Compound | StemXVivo Osteogenic Supplement | R&D Systems | Catalog #: CCM009 | |
| Chemical Compound | StemXVivo Chondrogenic Supplement | R&D Systems | Catalog #: CCM006 | |
| Chemical Compound | StemXVivo Adipogenic Supplement | R&D Systems | Catalog #: CCM011 | |
| Commercial assay, kit | Bodipy 493/503 | Invitrogen | Catalog #: D3922 | |
| Commercial assay, kit | RNA to cDNA EcoDry Premix | Clontech – Takara Bio | Catalog #: 639543 | |
| Commercial assay, kit | CellEvent Caspase 3/7 Green | Thermo Fisher | Catalog #: C10423 | |
| Commercial assay, kit | RNAeasy Plus Micro Kit | QIAGEN | Catalog #: 74034 | |
| Commercial assay, kit | Dynabeads mRNA DIRECT Micro Kit | Invitrogen | Invitrogen 61021 | |
| Sequence-based reagent | Cxcl12_F | This paper | PCR primer | 5′-CGCCAAGGTCGTCGCCG-3′ |
| Sequence-based reagent | Cxcl12_R | This paper | PCR primer | 5′-TTGGCTCTGGCGATGTGGC-3′ |
| Sequence-based reagent | Kitl_F | This paper | PCR primer | 5′-CCCTGAAGACTCGGGCCTA-3′ |
| Sequence-based reagent | Kitl_R | This paper | PCR primer | 5′-CAATTACAAGCGAAATGAGAGCC-3′ |
| Sequence-based reagent | Opn_F | This paper | PCR primer | 5′-AGCAAGAAACTCTTCCAAGCAA-3′ |
| Sequence-based reagent | Opn_R | This paper | PCR primer | 5′-GTGAGATTCGTCAGATTCATCCG-3′ |
| Sequence-based reagent | Angpt1_F | This paper | PCR primer | 5′-CTCGTCAGACATTCATCATCCAG-3′ |
| Sequence-based reagent | Angpt1_R | This paper | PCR primer | 5′-CACCTTCTTTAGTGCAAAGGCT-3′ |
| Sequence-based reagent | Vcam1_F | This paper | PCR primer | 5′-GACCTGTTCCAGCGAGGGTCTA-3′ |
| Sequence-based reagent | Vcam1_R | This paper | PCR primer | 5′-CTTCCATCCTCATAGCAATTAAGGTG-3′ |
| Sequence-based reagent | Cdkn1a_F | This paper | PCR primer | 5′-CCTGGTGATGTCCGACCTG-3′ |
| Sequence-based reagent | Cdkn1a_R | This paper | PCR primer | 5′-CCATGAGCGCATCGCAATC-3′ |
| Sequence-based reagent | Cdkn1c_F | This paper | PCR primer | 5′-CGAGGAGCAGGACGAGAATC-3′ |
| Sequence-based reagent | Cdkn1c_R | This paper | PCR primer | 5′-GAAGAAGTCGTTCGCATTGGC-3′ |
| Sequence-based reagent | Cdk4_F | This paper | PCR primer | 5′-ATGGCTGCCACTCGATATGAA 3′ |
| Sequence-based reagent | Cdk4_R | This paper | PCR primer | 5′-TCCTCCATTAGGAACTCTCACAC-3′ |
| Sequence-based reagent | Sod1_F | This paper | PCR primer | 5′-TGGTGGTCCATGAGAAACAA-3′ |
| Sequence-based reagent | Sod1_R | This paper | PCR primer | 5′-GTTTACTGCGCAATCCCAAT-3′ |
| Sequence-based reagent | Gls_F | This paper | PCR primer | 5′-TTCGCCCTCGGAGATCCTAC-3′ |
| Sequence-based reagent | Gls_R | This paper | PCR primer | 5′-CCAAGCTAGGTAACAGACCCT-3′ |
| Sequence-based reagent | Gpx1_F | This paper | PCR primer | 5′-AGTCCACCGTGTATGCCTTCT-3′ |
| Sequence-based reagent | Gpx1_R | This paper | PCR primer | 5′-GAGACGCGACATTCTCAATGA-3′ |
| Sequence-based reagent | Postn_F | This paper | PCR primer | 5′-CCTGCCCTTATATGCTCTGCT-3′ |
| Sequence-based reagent | Postn_R | This paper | PCR primer | 5′-AAACATGGTCAATAGGCATCACT-3′ |
| Sequence-based reagent | Gapdh_F | This paper | PCR primer | 5′-TGTGTCCGTCGTGGATCTGA-3′ |
| Sequence-based reagent | Gapdh_R | This paper | PCR primer | 5′-CCTGCTTCACCACCTTCTTGA-3′ |
| Sequence-based reagent | Actb_F | This paper | PCR primer | 5′-GCTTCTTTGCAGCTCCTTCGT-3′ |
| Sequence-based reagent | Actb_R | This paper | PCR primer | 5′-ATCGTCATCCATGCCGAACT-3′ |
| Other | DAPI | Sigma | Prod #: D9542 |
Additional files
-
MDAR checklist
- https://cdn.elifesciences.org/articles/101714/elife-101714-mdarchecklist1-v1.pdf
-
Supplementary file 1
Antibodies used in flow cytometry experiments.
- https://cdn.elifesciences.org/articles/101714/elife-101714-supp1-v1.docx
-
Supplementary file 2
Sequences of primers used for RT-PCR .
- https://cdn.elifesciences.org/articles/101714/elife-101714-supp2-v1.docx
Download links
A two-part list of links to download the article, or parts of the article, in various formats.
Downloads (link to download the article as PDF)
Open citations (links to open the citations from this article in various online reference manager services)
Cite this article (links to download the citations from this article in formats compatible with various reference manager tools)
Periosteal skeletal stem cells can migrate into the bone marrow and support hematopoiesis after injury
eLife 13:RP101714.
https://doi.org/10.7554/eLife.101714.3


