Caffeic acid phenethyl ester protects Clostridioides difficile infection by toxin inhibition and microbiota modulation
- State Key Laboratory for Diagnosis and Treatment of Severe Zoonotic Infectious Diseases, Key Laboratory for Zoonosis Research of the Ministry of Education, College of Veterinary Medicine, Jilin University, Center for Pathogen Biology and Infectious Diseases, The First Hospital of Jilin University, China
- Center for Pathogen Biology and Infectious Diseases, State Key Laboratory for Zoonotic Diseases, The First Hospital of Jilin University, China
- Measurement Biotechnique Research Center, College of Biological and Food Engineering, Jilin Engineering Normal University, China
- Hunan Provincial Key Laboratory of Animal Intestinal Function and Regulation, Hunan International Joint Laboratory of Animal Intestinal Ecology and Health, Laboratory of Animal Nutrition and Human Health, College of Life Sciences, Hunan Normal University, China
Figures
Figure 1 with 3 supplements
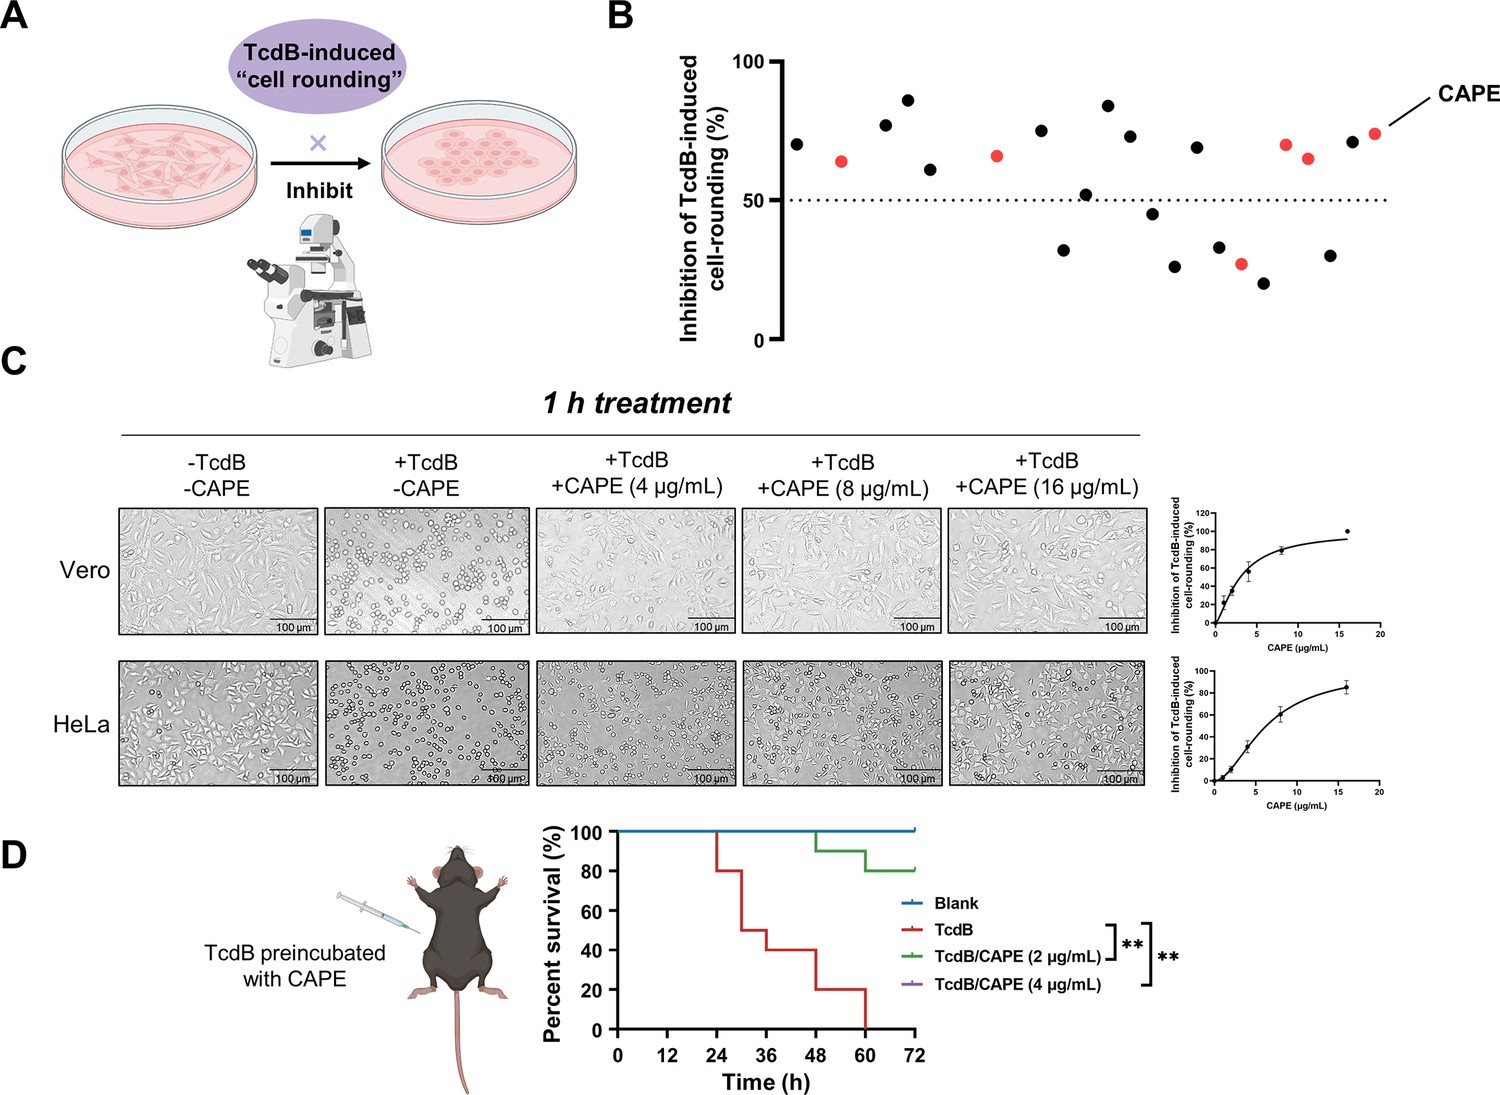
Caffeic acid phenethyl ester (CAPE) suppresses TcdB-mediated cell rounding.
(A) Schematic of the process used for the identification of small molecules that inhibit the cell rounding phenotype induced by TcdB. TcdB (0.2 ng/ml) was preincubated with 8 μg/ml of individual compounds prior to addition to the cell cultures. (B) Active compounds were identified from the chemical library consisting of 2076 chemicals. The red dots represent caffeic acid and its derivatives. (C) Dose-dependent CAPE inhibition of TcdB-induced rounding of Vero (upper) and HeLa (lower) cells. Scale bar, 100 μm. The dose titration curves are presented on the right (mean ± SD; n = 3). (D) The survival rates of mice that were intraperitoneally injected with CAPE-pretreated or native TcdB (30 ng) (n = 10; **p < 0.01 by log-rank (Mantel‒Cox) test).
Figure 1—figure supplement 1

Caffeic acid phenethyl ester (CAPE) reduces cell death induced by TcdB.
TcdB was pretreated with CAPE for 1 hr, followed by its addition to Vero cells for a 1 hr (A) or 12 hr (B) incubation to assess cell viability (mean ± SD; n = 3; **p < 0.01 using one-way ANOVA).
Figure 1—figure supplement 2
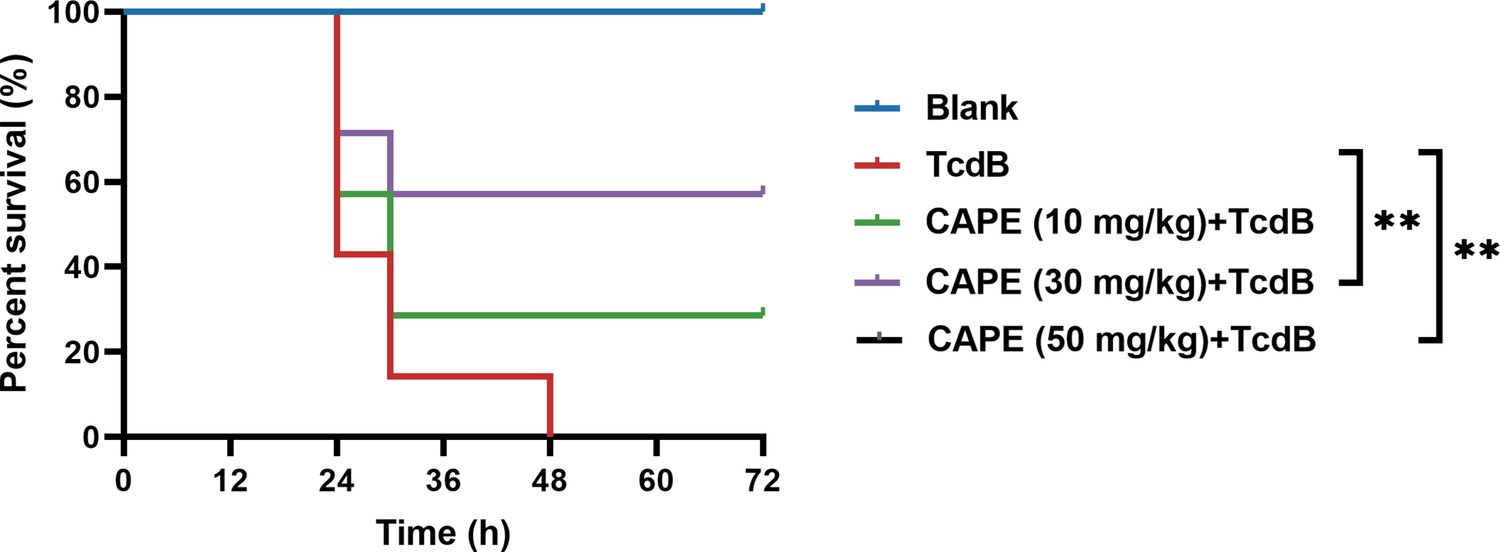
Caffeic acid phenethyl ester (CAPE) neutralizes TcdB-mediated acute toxicity in mice.
The survival rates of mice that were intraperitoneally injected with CAPE 2 hr prior to the subsequent injection of native TcdB (30 ng) (n = 7; **p < 0.01 by log-rank (Mantel‒Cox) test).
Figure 1—figure supplement 3
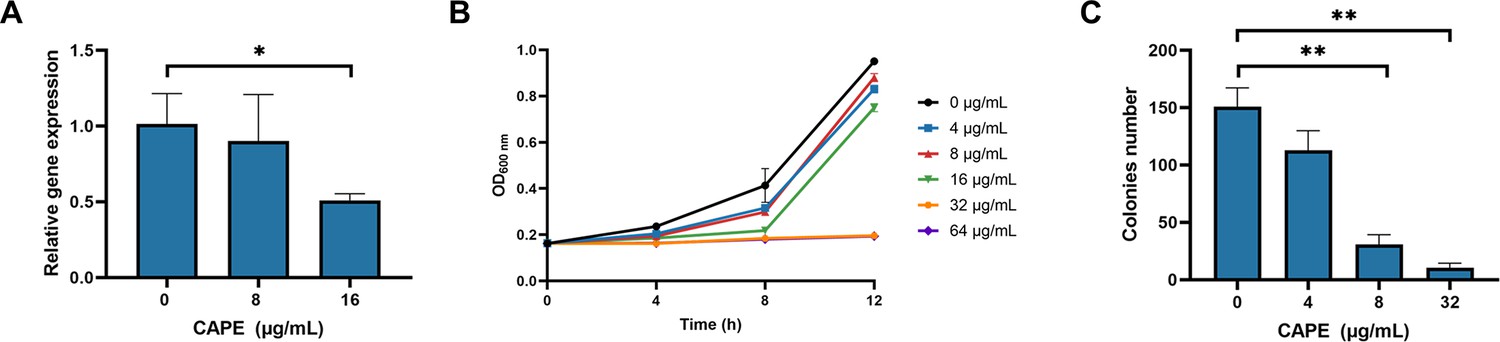
Caffeic acid phenethyl ester (CAPE) inhibits the growth of C. difficile BAA-1870 and the expression of TcdB.
(A) CAPE effectively suppresses the expression of TcdB in a dose-dependent manner (mean ± SD; n = 3; *p < 0.05 using one-way ANOVA). (B) Growth curves of C. difficile BAA-1870 in the presence of varying concentrations of CAPE (0–64 µg/ml) (mean ± SD; n = 3). (C) Effect of CAPE on spore production capacity of C. difficile BAA-1870. The colony-forming units of heat-shocked spore solution of BAA-1870 progressively decline with the elevation of CAPE concentrations (0–32 µg/ml) (mean ± SD; n = 3; **p < 0.01 using one-way ANOVA).
Figure 2 with 1 supplement
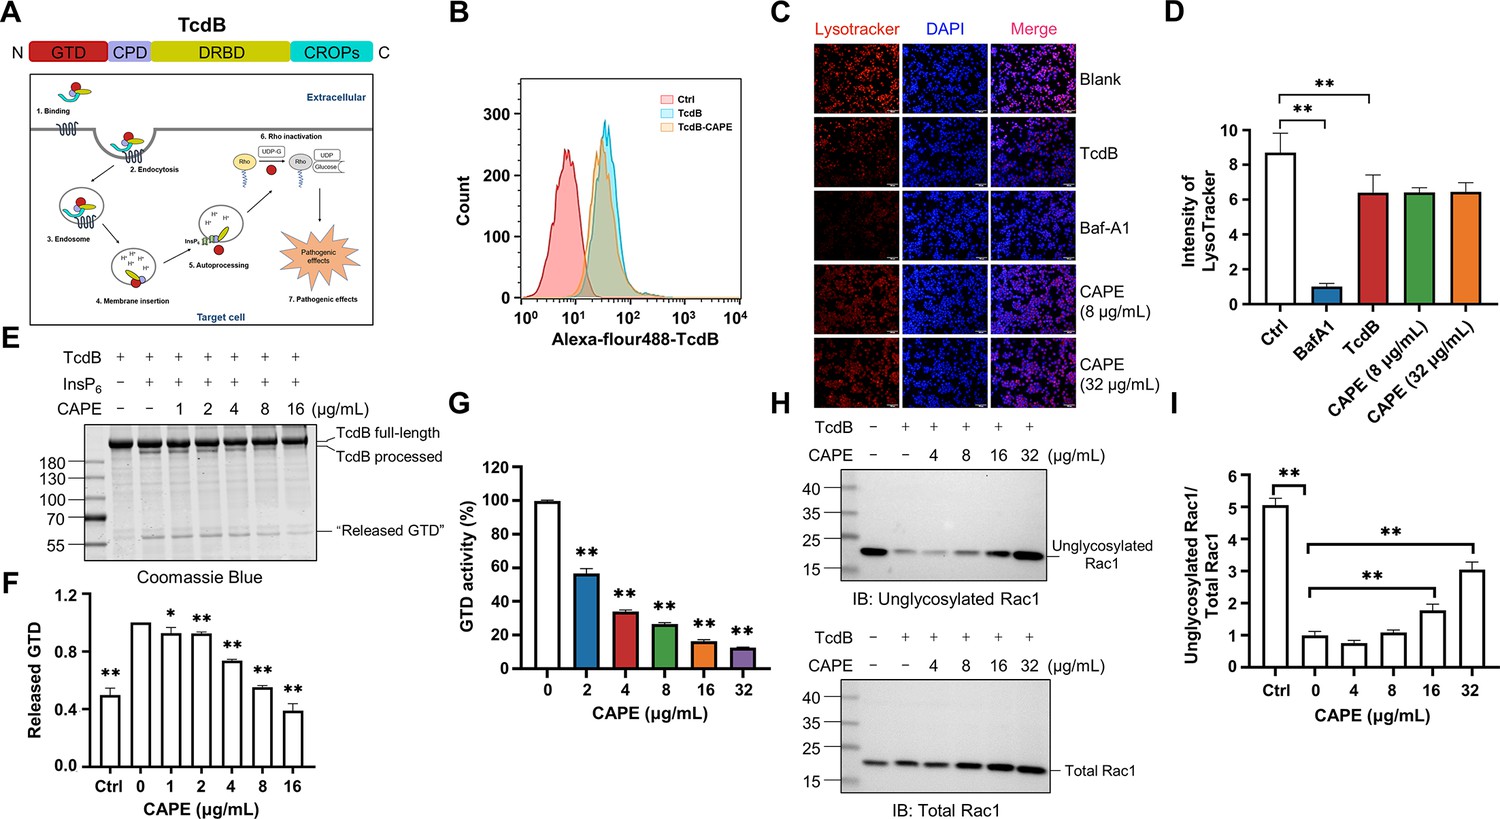
Mechanism by which caffeic acid phenethyl ester (CAPE) suppresses TcdB intoxication.
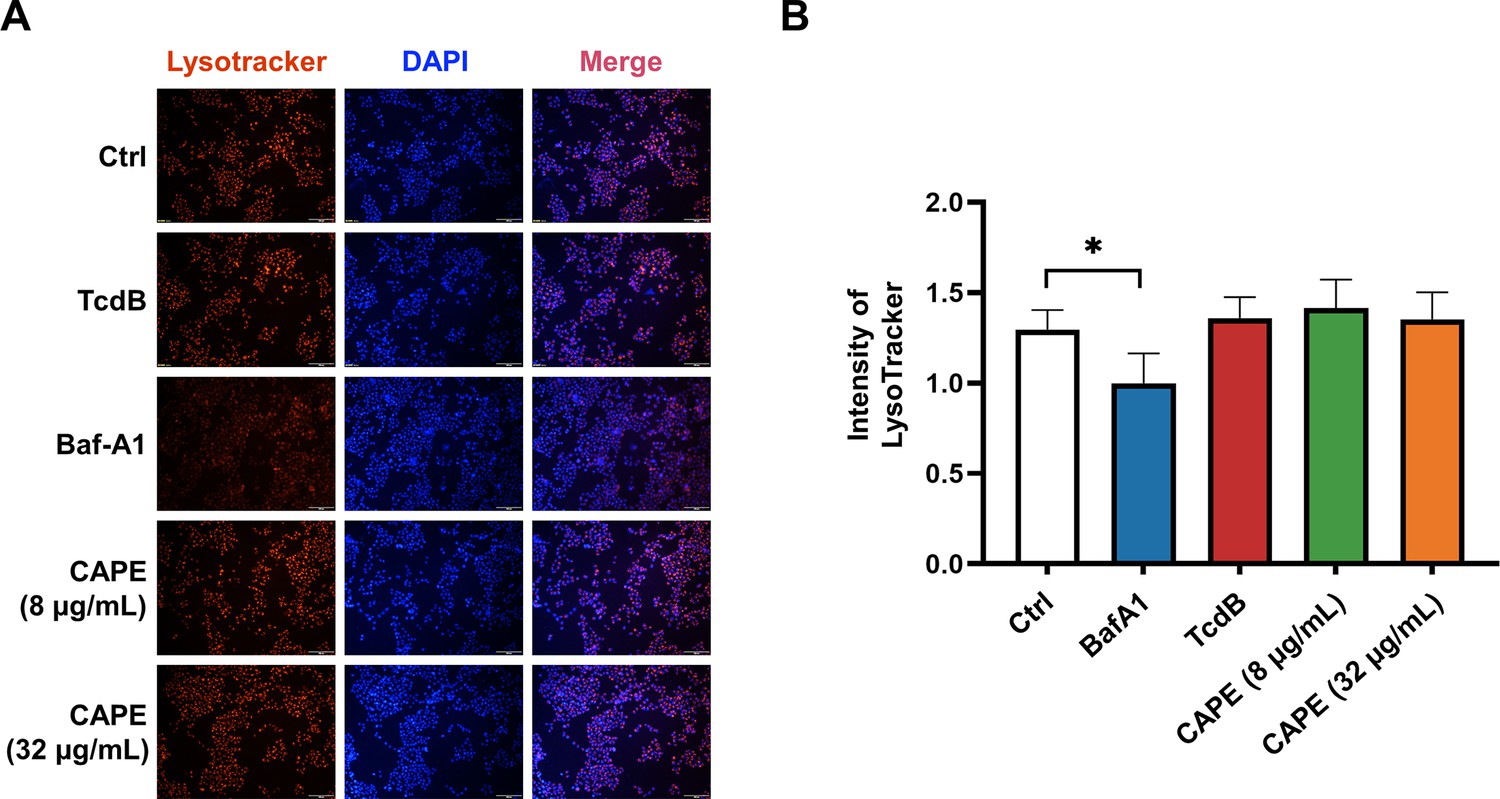
(A) Schematic illustration of the multistep mechanism of TcdB intoxication of host cells. (B) Determination of internalized TcdB levels. Alexa Fluor 488-labeled TcdB was incubated with 32 μg/ml CAPE for 30 min before it was added to the cell culture. The cellular uptake of TcdB was measured by flow cytometry analysis. (C) Lysosomal activity in host cells treated with CAPE was measured via LysoTracker staining. The nuclei were stained with DAPI. Bar, 100 μm. (D) The intensities of LysoTracker staining were quantified using ImageJ (mean ± SD; n = 3; **p < 0.01 using one-way ANOVA). (E, F) CAPE inhibits InsP6-induced autoprocessing of full-length TcdB. Two micrograms of TcdB was preincubated with increasing concentrations of CAPE for 1 hr. Self-cleavage of TcdB was initiated by the addition of 3 μg of InsP6, and the cells were incubated for 6 hr at 37°C. Reactions were terminated with 5× SDS loading buffer, and the release of GTD was visualized by CBB staining of the SDS‒PAGE gel (E). The level of released GTD in panel E was quantified by ImageJ (F) (mean ± SD; n = 3; *p < 0.05; **p < 0.01 using one-way ANOVA). (G) Dose-dependent inhibition of the GTD activity of TcdB by CAPE. Recombinant GTD of TcdB was mixed with different concentrations of CAPE (0–32 μg/ml) and incubated for 15 min at 25°C. GTD activity was measured by the UDP-Glo glycosyltransferase assay (mean ± SD; n = 3; *p < 0.05; **p < 0.01 using one-way ANOVA). (H, I) Intracellular Rac1 glucosylation in cells treated with TcdB. Native or CAPE-pretreated TcdB was added to the cell culture and cells were incubated for 2 hr. The cells were lysed, and the glucosylation of Rac1 was analyzed by western blotting using antibodies recognizing total Rac1 and unglycosylated Rac1 (H). The level of Rac1 glucosylation shown in H was quantified by ImageJ (I) (mean ± SD; n = 3; **p < 0.01 using one-way ANOVA).
-
Figure 2—source data 1
PDF file containing original western blots for Figure 2 indicating the relevant bands and treatments.zip.
- https://cdn.elifesciences.org/articles/101757/elife-101757-fig2-data1-v1.zip
-
Figure 2—source data 2
Original files for western blot analysis displayed in Figure 2.
- https://cdn.elifesciences.org/articles/101757/elife-101757-fig2-data2-v1.zip
Figure 2—figure supplement 1
Lysosomal activity of Caco-2 cells in the presence of caffeic acid phenethyl ester (CAPE).
(A) Caco-2 cells were treated with 8 or 16 μg/ml CAPE for 1 hr. The acidic compartments were stained with LysoTracker Red DND-99, and the nuclei were stained with DAPI. Bar, 100 μm. (B) The intensities of LysoTracker staining were quantified using ImageJ (mean ± SD; n = 3; *p < 0.05 using one-way ANOVA).
Figure 3
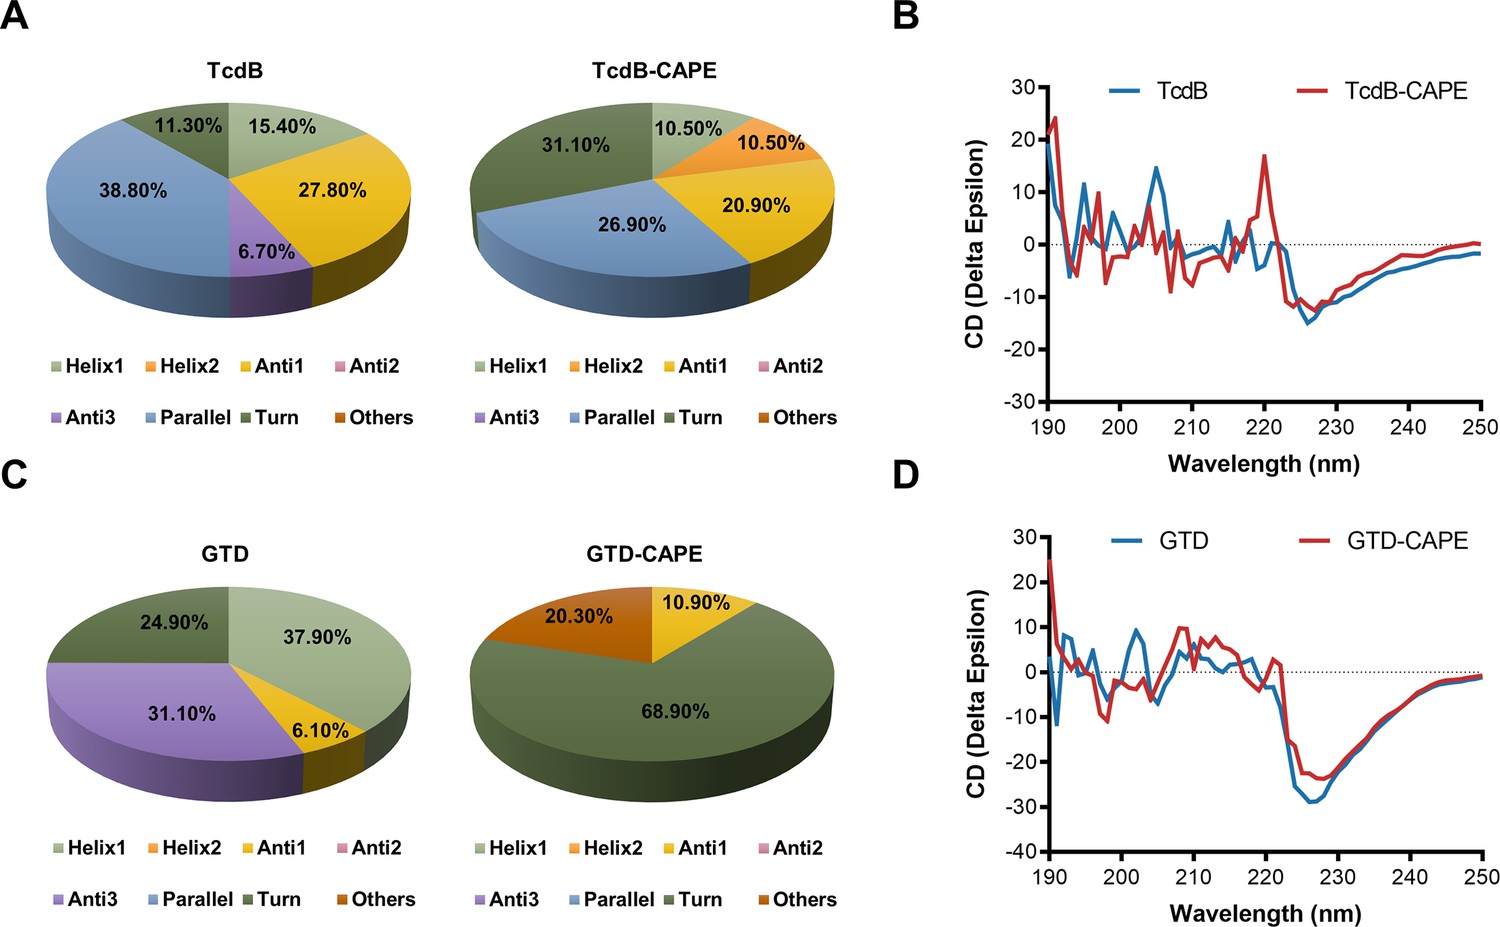
Caffeic acid phenethyl ester (CAPE) alters the secondary structure of TcdB and GTD.
(A) The secondary structure of TcdB in the presence or absence of 32 μg/ml CAPE was determined by circular dichroism (CD) spectroscopy. (B) Calculated CD spectra of CAPE-treated TcdB. (C) The secondary structure of GTD in the presence or absence of 32 μg/ml CAPE was determined by CD spectroscopy. (D) Calculated CD spectra of CAPE-treated GTD. The wavelength for CD spectroscopy was set at 190–250 nm.
Figure 4

Direct interaction of caffeic acid phenethyl ester (CAPE) with TcdB and GTD.
(A, B) Full-length TcdB or GTD was immobilized on a CM5 chip, followed by the injection of various concentrations of CAPE. The response unit (RU) value and affinities of CAPE interactions with TcdB (A) and GTD (B) were determined by a Biacore T100.
Figure 5

Asp286 and Trp520 in the GTD are critical for caffeic acid phenethyl ester (CAPE)-mediated inhibition of GTD.
(A) Three-dimensional structure determination of GTD with the CAPE complex was performed by molecular modeling. (B) The root mean square deviation (RMSD) values of the GTD–CAPE complex. (C) Decomposition of the binding energy on a per-residue basis in the binding sites of the GTD–CAPE complex. Blue denotes the total binding energy, red signifies the electrostatic interactions, green corresponds to the van der Waals forces, and orange indicates solvation or hydration effects. The horizontal axis represents the mutation of the amino acid residue at the respective position to alanine (mean ± SD; n = 3). (D) Glucosyltransferase activity of wild-type GTD and the GTD mutants (mean ± SD; n = 5). Residual activity of wild-type GTD (E) and its mutants GTDL265A (F), GTDT465A(G), GTDI466A(H), GTDL519A(I), GTDW520A(J), and GTDD286A(K) in the presence of increasing concentrations of CAPE (0–4 μg/ml) (mean ± SD; n = 3; *p < 0.05; **p < 0.01 using one-way ANOVA).
Figure 6 with 1 supplement
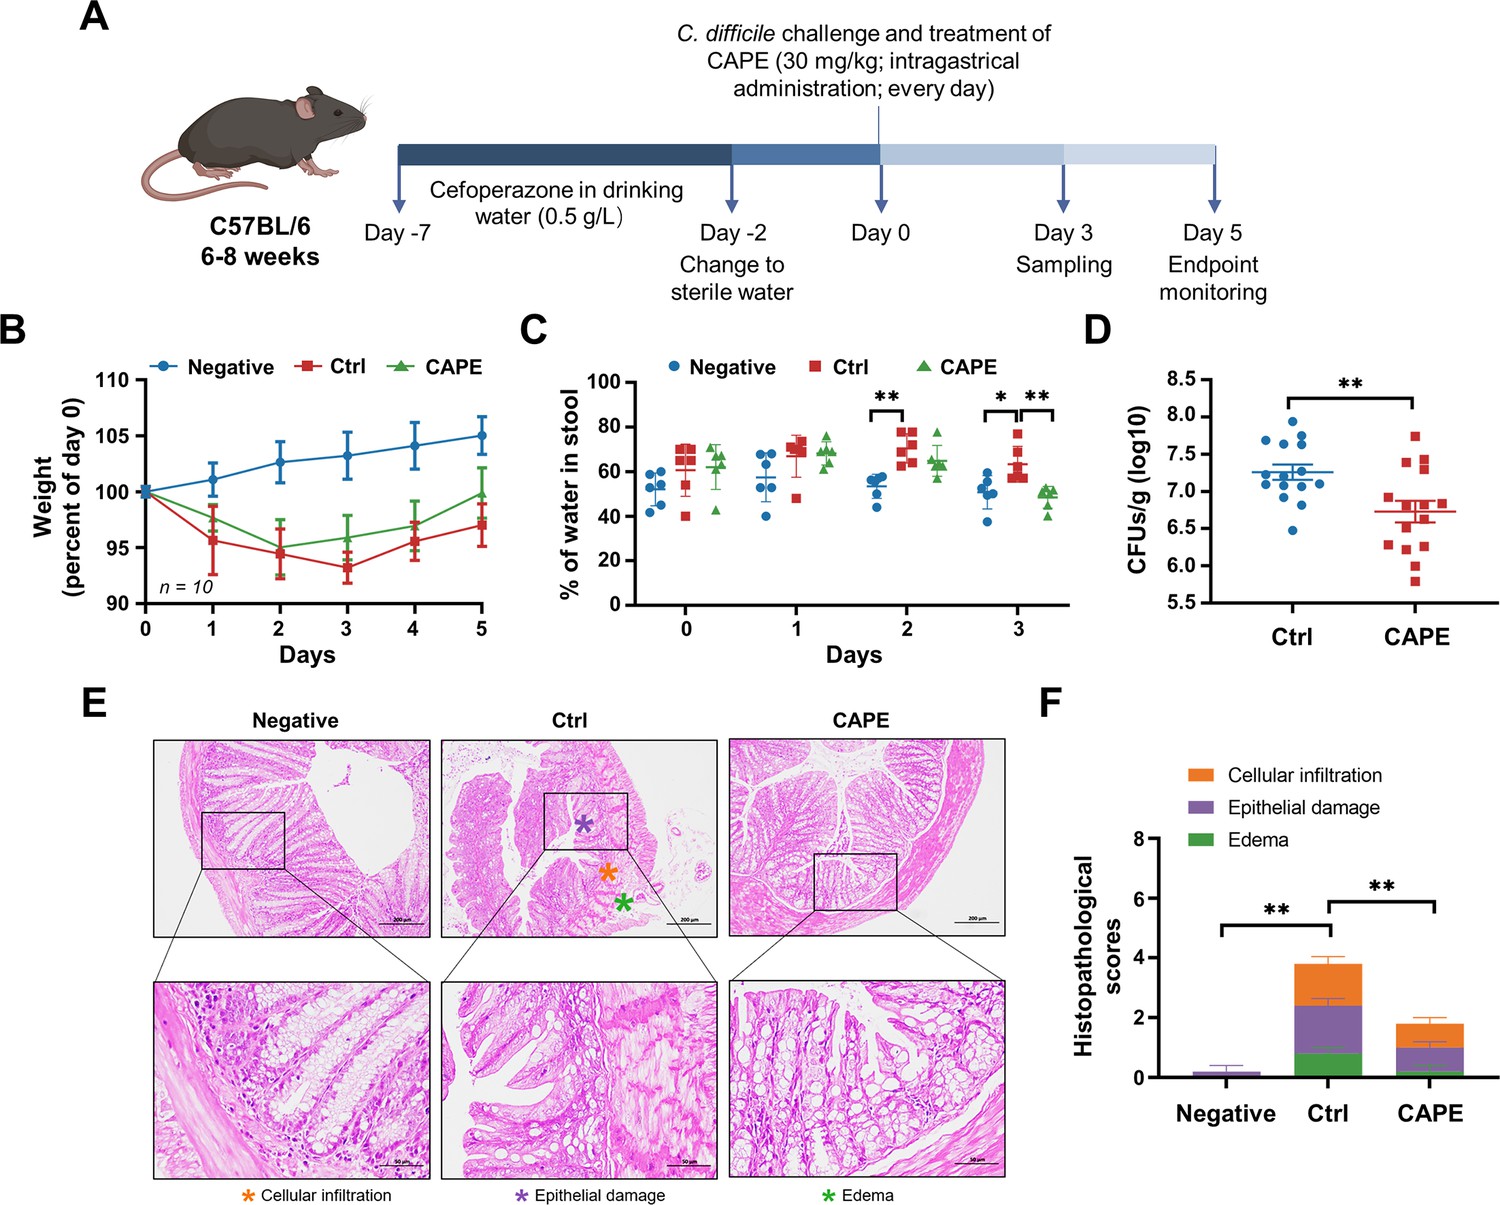
Caffeic acid phenethyl ester (CAPE) treatment blocks the pathology of Clostridioides difficile infection (CDI) in mice.
(A) Schematic of the process used for the establishment of the CDI mouse model. (B) Weight changes in CDI mice after CAPE or vehicle treatment (mean ± SD; n = 10). (C) The fecal dry/wet weight ratio in CDI mice treated with CAPE or vehicle (mean ± SD; n = 6; *p < 0.05; **p < 0.01 using one-way ANOVA). (D) Bacterial colonization in the feces of CDI mice treated with CAPE or vehicle (mean ± SD; n = 15; **p < 0.01 using one-way ANOVA). (E) Pathological analysis of colon sections from CDI mice treated with CAPE or vehicle. The black boxes are the regions that were magnified and are shown underneath. (F) Histopathological scores of vehicle-treated and CAPE-treated mice in terms of cell infiltration (orange), epithelial damage (purple), and edema (green) (mean ± SD; n = 3; *p < 0.05; **p < 0.01 using one-way ANOVA).
Figure 6—figure supplement 1
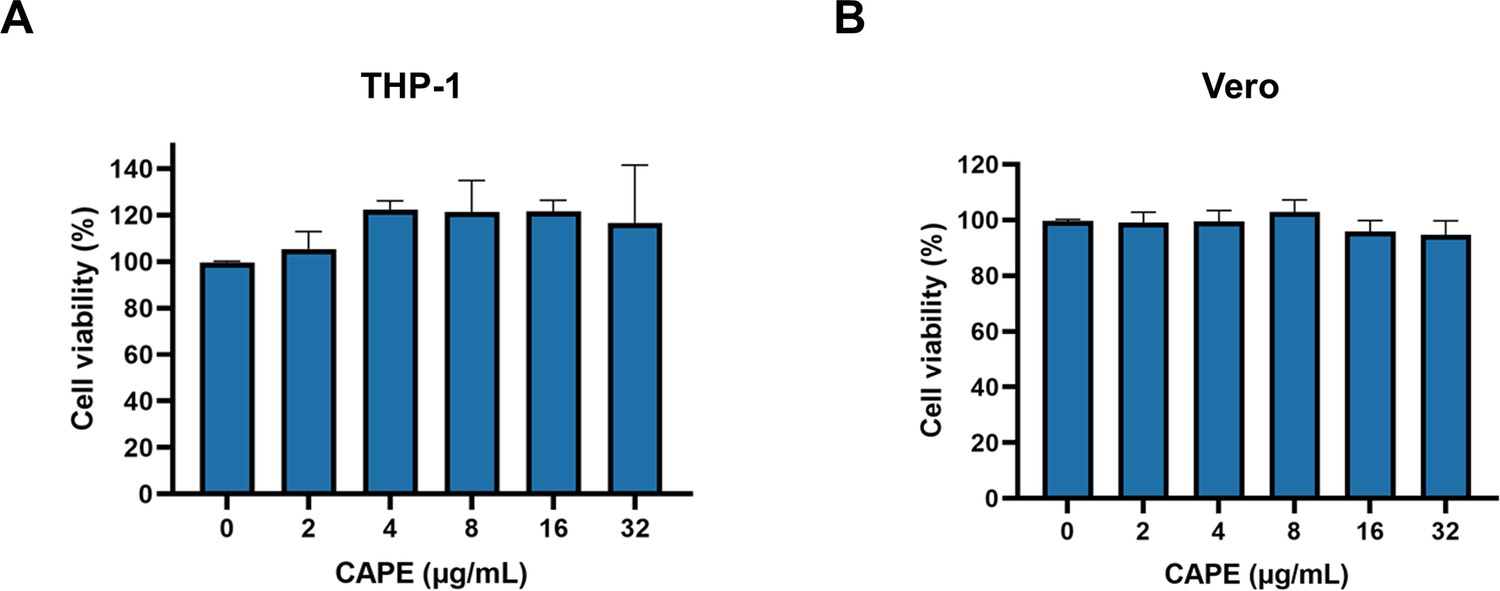
Caffeic acid phenethyl ester (CAPE) is not cytotoxic.
THP-1 (A) and Vero (B) cells were incubated with increasing concentrations of CAPE for 3 hr. Cytotoxicity was measured using a CCK-8 kit (mean ± SD; n = 3).
Figure 7
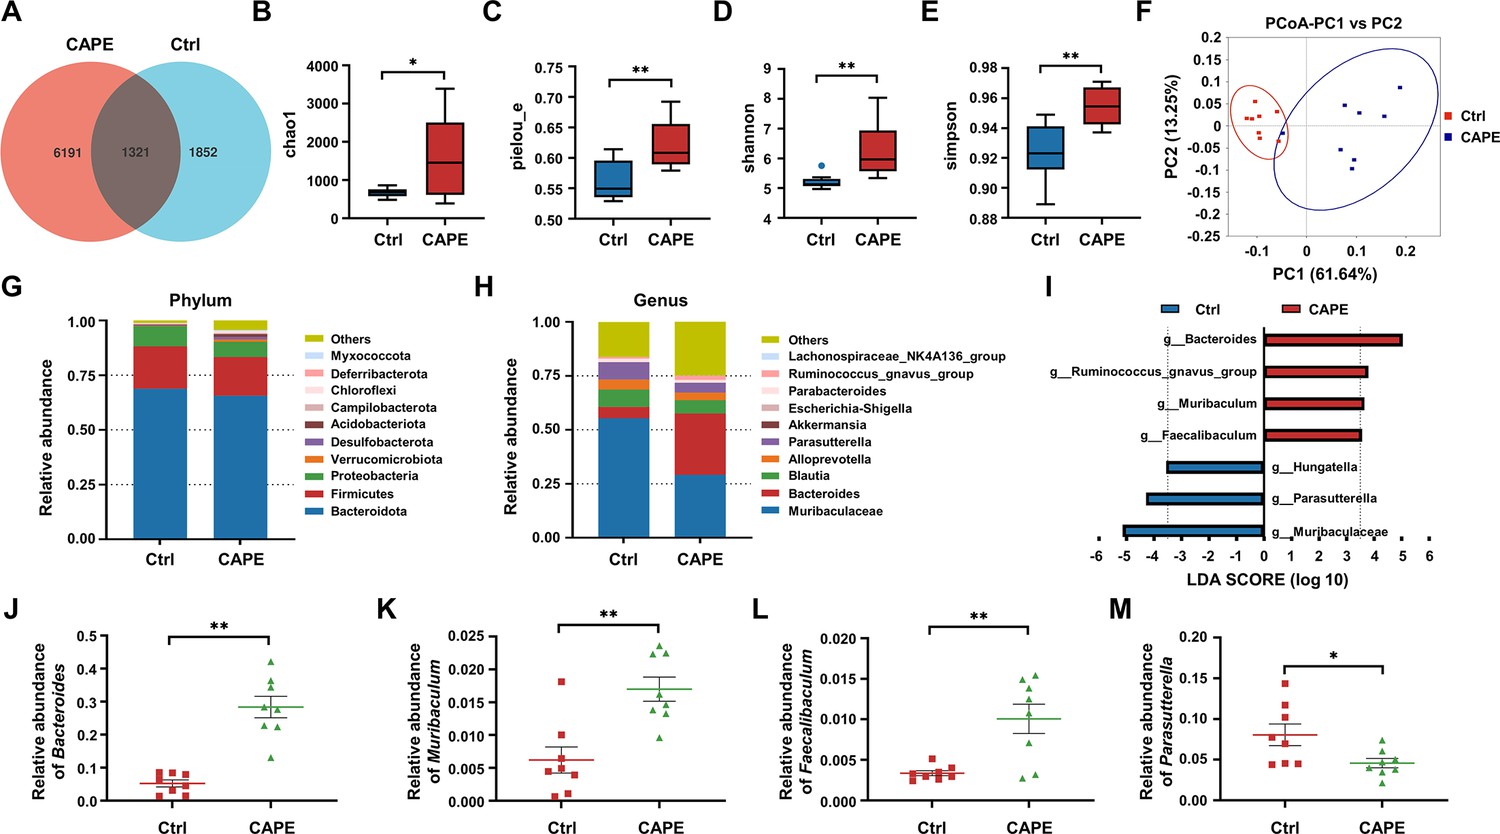
The influence of caffeic acid phenethyl ester (CAPE) treatment on the diversity and composition of the gut microbiota in Clostridioides difficile infection (CDI) mice.
(A) Venn diagram illustrating the numbers of differentially abundant bacteria identified using a single model and their cooperation. Quantification of the α diversity of the gut microbiota according to the observed species richness (B, C), Shannon index (D), and Simpson index (E) (mean ± SD; n = 8; *p < 0.05; **p < 0.01 using an unpaired Student’s t-test). (F) Principal coordinate analysis (PCoA) showing β diversity based on the weighted UniFrac distance. Relative abundance of the top 10 predominant bacteria classified at the phylum (G) and genus (H) levels. (I) Significant changes in flora among the control and CAPE groups, as measured by LEfSe analysis (LDA score [log 10]>3.5). Relative abundances of Bacteroides (J), Muribaculum (K), Faecalibaculum (L), and Parasutterella (M) in mice in the control and CAPE treatment groups (mean ± SD; n = 8; *p < 0.05; **p < 0.01 using an unpaired Student’s t-test).
Figure 8 with 2 supplements

Alterations in gut metabolites in caffeic acid phenethyl ester (CAPE)-treated mice with Clostridioides difficile infection (CDI).
(A) The score plots show orthogonal partial least square discriminant analysis (PLS-DA) results. (B) Volcano plot representing the up- or downregulated gut metabolites in the CAPE treatment group compared to those in the control group. (C) Enrichment bubble map of the top 20 metabolic pathways in the CAPE treatment and control groups. (D) The 26 potential biomarkers are displayed in a heatmap, along with hierarchical clustering analysis.
Figure 8—figure supplement 1

Measurement of melatonin levels in mouse fecal samples.
The melatonin content in mouse fecal supernatant was determined using a Mouse MT (melatonin) ELISA Kit (mean ± SD; n = 8; **p < 0.01 using one-way ANOVA).
Figure 8—figure supplement 2
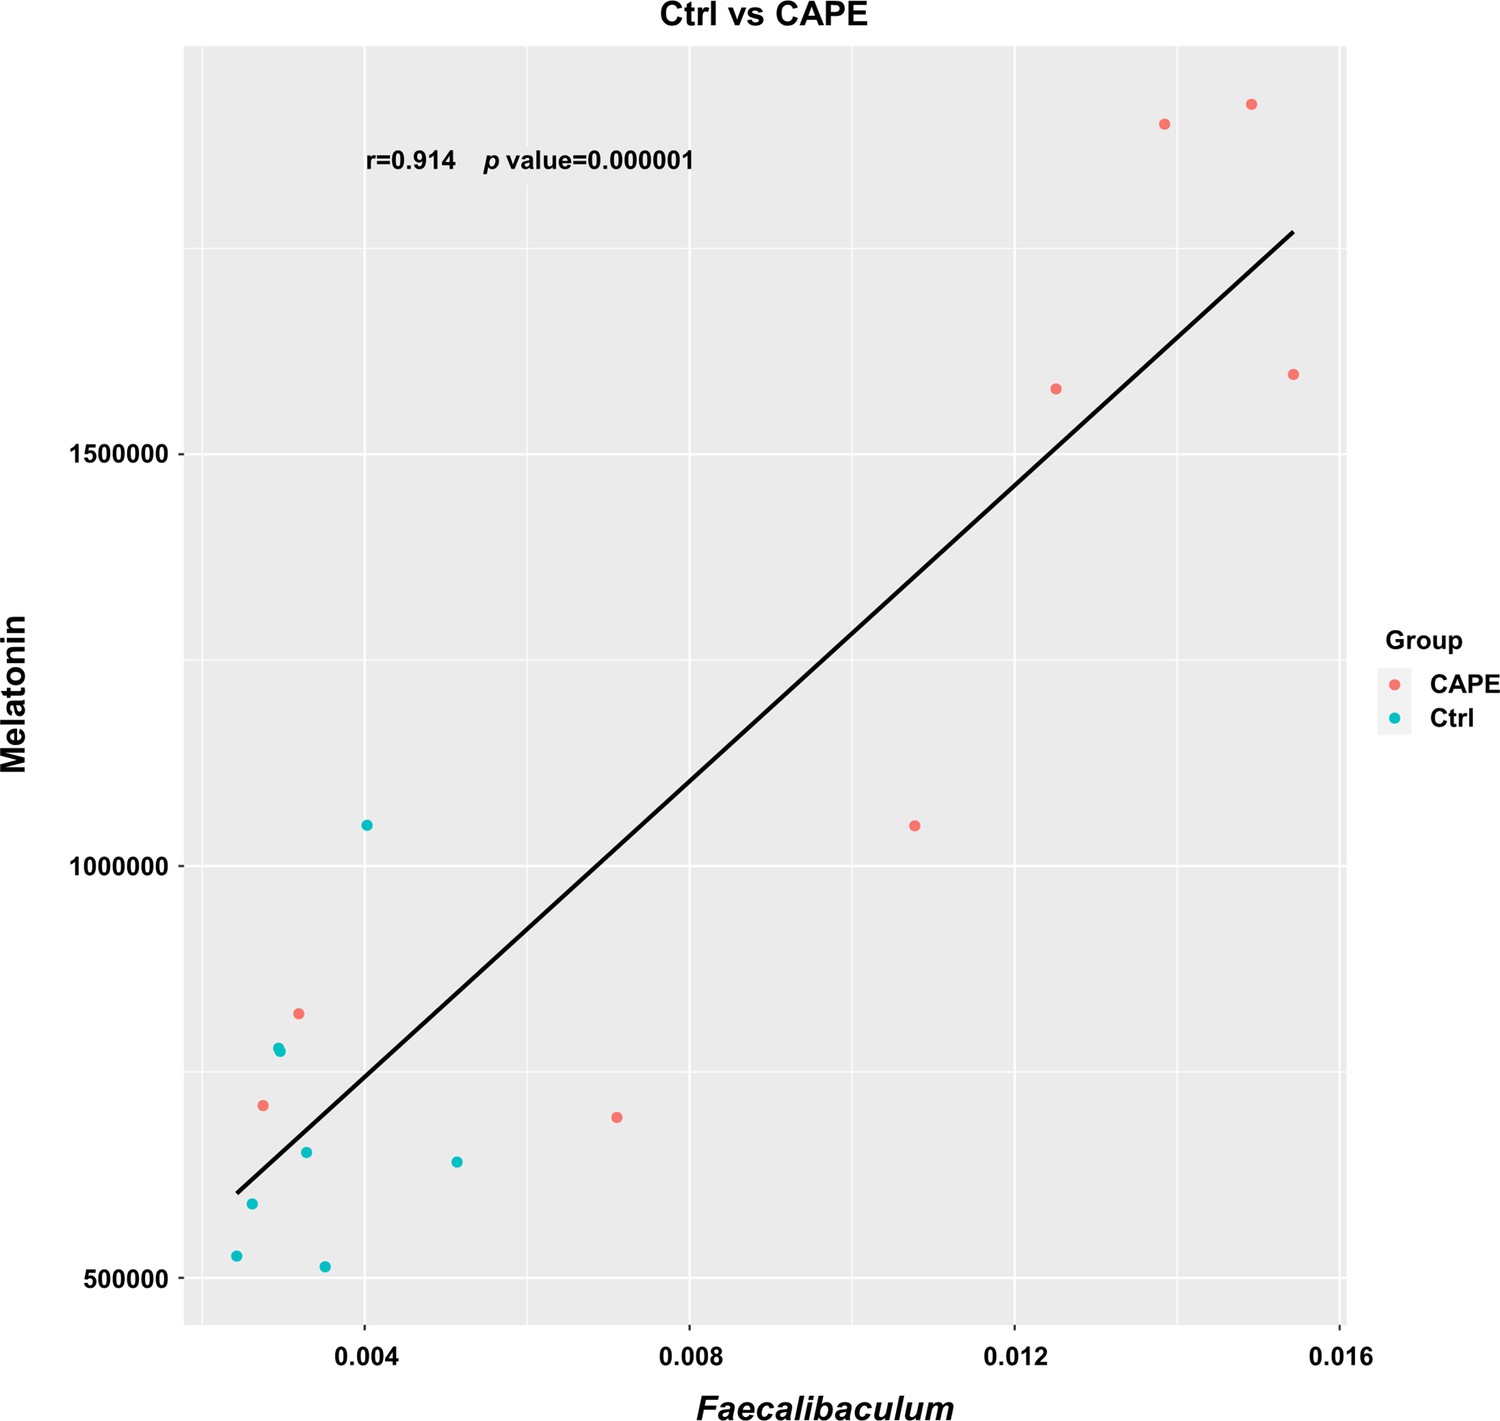
The abundance of melatonin was plotted against the abundance of Faecalibaculum based on the microbiota and metabolome profiles.
Correlation and statistical regression analyses were performed using Pearson’s method (n = 8).
Figure 9
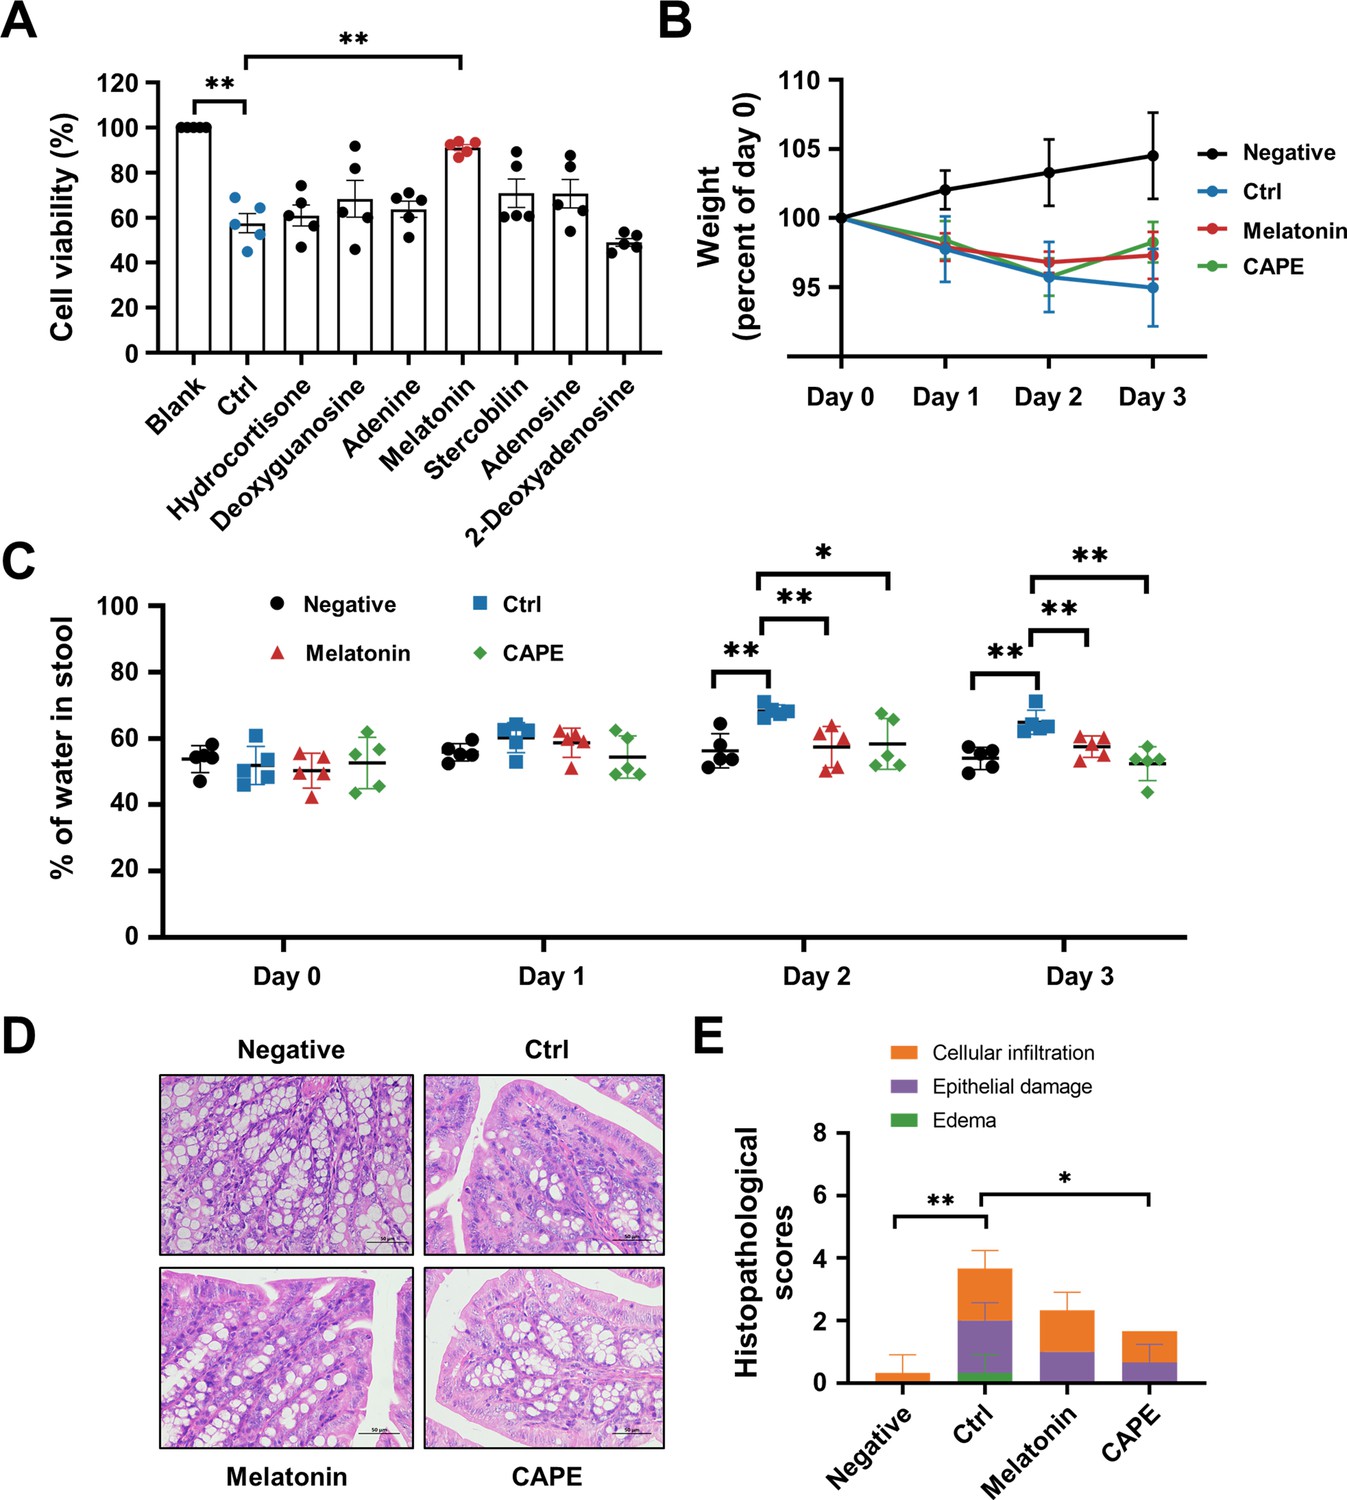
Oral administration of melatonin alleviates the pathology of Clostridioides difficile infection (CDI).
(A) The impact of upregulated metabolites on the cytotoxicity of TcdB. TcdB (0.2 ng/ml) was incubated with each of the metabolites (100 μg/ml) for 1 hr at 37°C before being added to the Vero cell culture. At 3 hr after TcdB treatment, cell death was evaluated with a CCK-8 kit (mean ± SD; n = 3; **p < 0.01 using one-way ANOVA). (B) Body weight changes in melatonin-treated CDI mice (mean ± SD; n = 5). (C) The fecal dry/wet weight ratio in CDI mice after melatonin treatment (mean ± SD; n = 5; *p < 0.05; **p < 0.01 using one-way ANOVA). (D) Histopathological analysis of colon tissue from CDI mice treated with melatonin. (E) Histopathological scores of melatonin-treated CDI mice (mean ± SD; n = 3; *p < 0.05; **p < 0.01 using one-way ANOVA).
Figure 10

A model for caffeic acid phenethyl ester (CAPE)-mediated suppression of TcdB cytotoxicity and protection of mice from Clostridioides difficile infection (CDI).
The intoxication of cells by TcdB involves multistep mechanisms. Direct interaction of CAPE with full-length TcdB blocks InsP6-induced autoproteolysis, resulting in decreased production of active GTD. The binding between GTD and CAPE inhibits its glucosyltransferase activity, thus decreasing the glucosylation level of Rac1. CAPE treatment of CDI mice markedly restored the diversity and composition of the gut microbiota and induced changes in gut metabolites, which might have contributed to the therapeutic outcomes of CDI following CAPE treatment.
Additional files
-
MDAR checklist
- https://cdn.elifesciences.org/articles/101757/elife-101757-mdarchecklist1-v1.docx
-
Supplementary file 1
All the tables involved in the supplementary materials.
- https://cdn.elifesciences.org/articles/101757/elife-101757-supp1-v1.docx
Download links
A two-part list of links to download the article, or parts of the article, in various formats.
Downloads (link to download the article as PDF)
Open citations (links to open the citations from this article in various online reference manager services)
Cite this article (links to download the citations from this article in formats compatible with various reference manager tools)
Caffeic acid phenethyl ester protects Clostridioides difficile infection by toxin inhibition and microbiota modulation
eLife 13:RP101757.
https://doi.org/10.7554/eLife.101757.4


