Context-dependent modulations of subthalamo-cortical synchronization during rapid reversals of movement direction in Parkinson’s disease
- Institute of Clinical Neuroscience and Medical Psychology, Medical Faculty and University Hospital Düsseldorf, Heinrich Heine University Düsseldorf, Germany
- Medical Research Council Brain Network Dynamics Unit, University of Oxford, United Kingdom
- Nuffield Department of Clinical Neurosciences, University of Oxford, United Kingdom
- Department of Functional Neurosurgery and Stereotaxy, Medical Faculty and University Hospital Düsseldorf, Germany
- School of Physiology, Pharmacology & Neuroscience, University of Bristol, United Kingdom
Figures
Figure 1
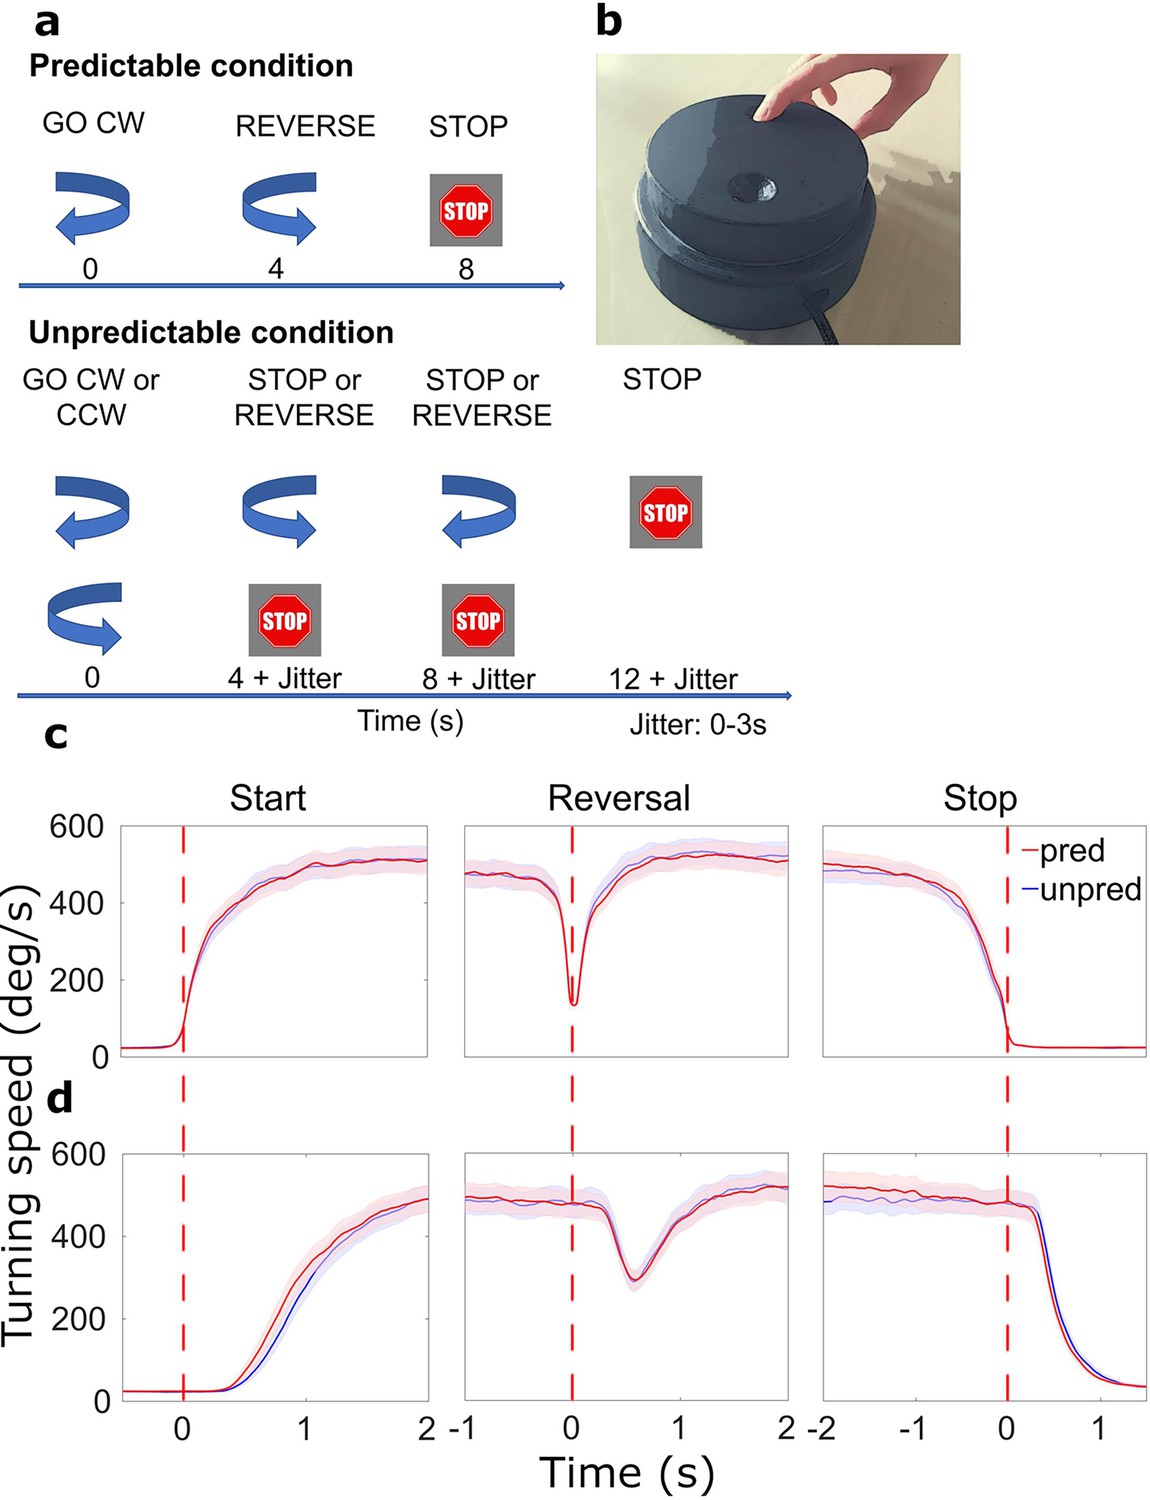
Paradigm and behavioral results.
(a) Patients were cued by arrows to start turning or reverse movement direction. Stop cues were presented at the end of each sequence. The timing of cues varied with the condition: in the predictable condition, the start cue was always followed by a reverse cue after 4 s and a stop cue after another 4 s (no jitter). In the unpredictable condition, there were either 0, 1, or 2 reversals (equal probability). Cue onset was jittered. CW: clockwise, CCW: counterclockwise. (b) Turning device for motor paradigm. (c) Average movement-aligned wheel speed. Red dotted lines indicate when turning began, was reversed in direction, and halted. (d) Average cue-aligned wheel speed. Red dotted lines indicate when the start, reversal, and stop cues appeared, respectively. N=20.
Figure 2
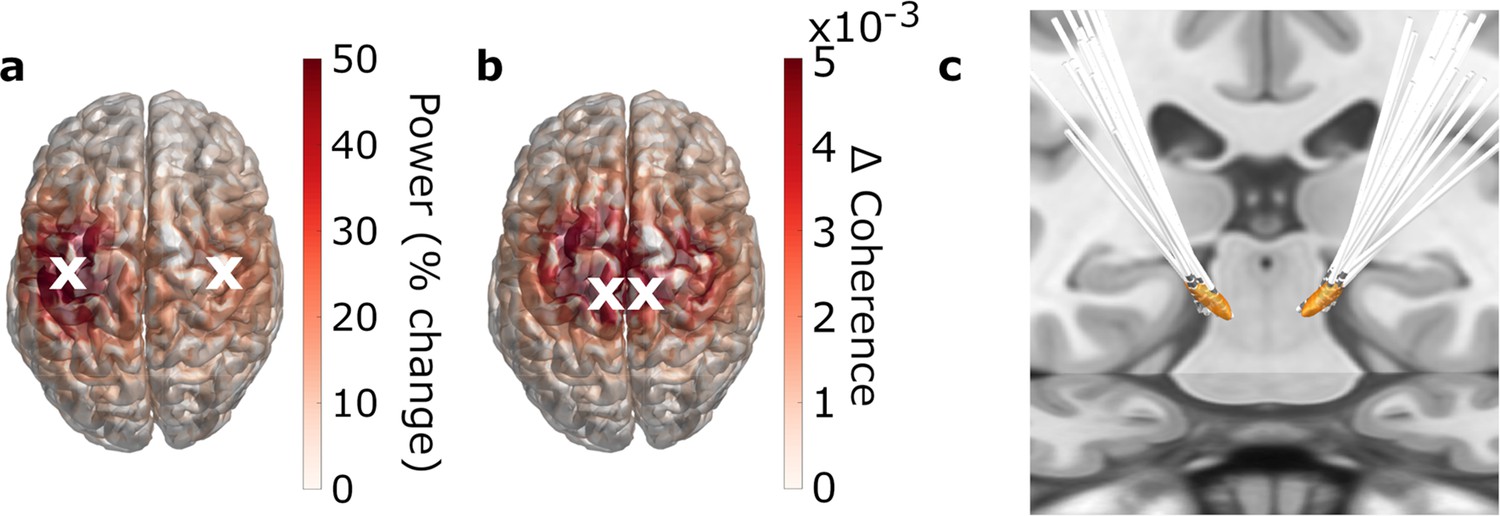
Regions of interest.
(a, b) 3D source-reconstruction in MNI space. N=20. White crosses mark the cortical regions of interests (ROIs) selected for further analysis based on the strongest relative change in power (a) and the strongest absolute change in coherence (b). (c) All patients’ deep brain stimulation (DBS) electrodes, localized with Lead-DBS.
Figure 3 with 1 supplement
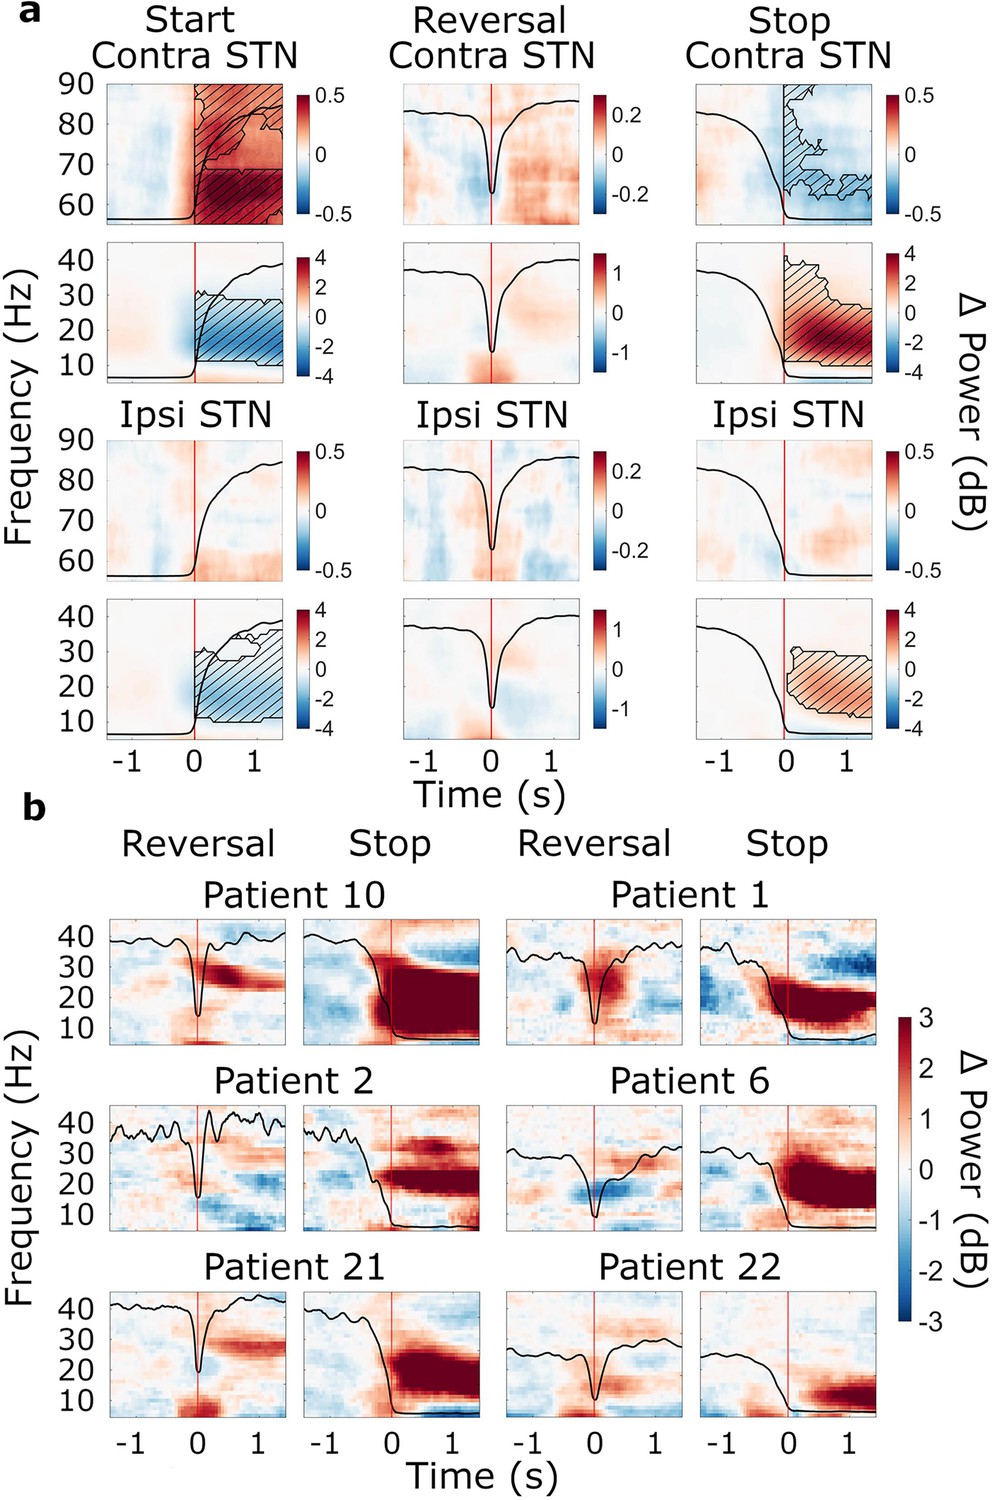
Movement-related beta power modulations in the subthalamic nucleus (STN).
(a) Time-frequency spectra of start, reversal, and stop trials for the STN (group average, trials averaged across predictability conditions). Time 0 marks the moment turning began, was reversed in direction, and halted (red lines). The black line in each plot represents the average wheel turning speed (scale: 0–600 deg/s). Power was baseline-corrected (baseline: –1.6–0 s). Hatched lines within black contours indicate significant changes relative to baseline. N=20. (b) Six examples of individual patients at reversal and stop. Power was baseline-corrected (baseline: –1.6–0 s). Time 0 marks the brief pause of movement occurring during reversals, and movement stop, respectively (red lines). The black line in each plot represents each patient’s trial-average wheel turning speed (scale: 0–600 deg/s; for patient 21, the scale was adapted to 0–750 deg/s). Patient 10: contralateral, predictable; Patient 1: contralateral, unpredictable, Patient 2: contralateral, predictable; Patient 6: ipsilateral, unpredictable; Patient 21: contralateral, unpredictable; Patient 22; ipsilateral, unpredictable.
Figure 3—figure supplement 1

Cue-aligned beta power modulations in the subthalamic nucleus (STN).
Time-frequency spectra of cue-aligned start, reversal, and stop trials for the STN (group average, trials averaged across predictability conditions). Time 0 marks the appearance of the cue to start, reverse, or stop turning (red lines). The black line in each plot represents the average wheel turning speed (scale: 0–600 deg/s). Power was baseline-corrected (baseline: –1.6–0 s). Hatched lines within black contours indicate significant changes relative to baseline. N=20.
Figure 4 with 1 supplement
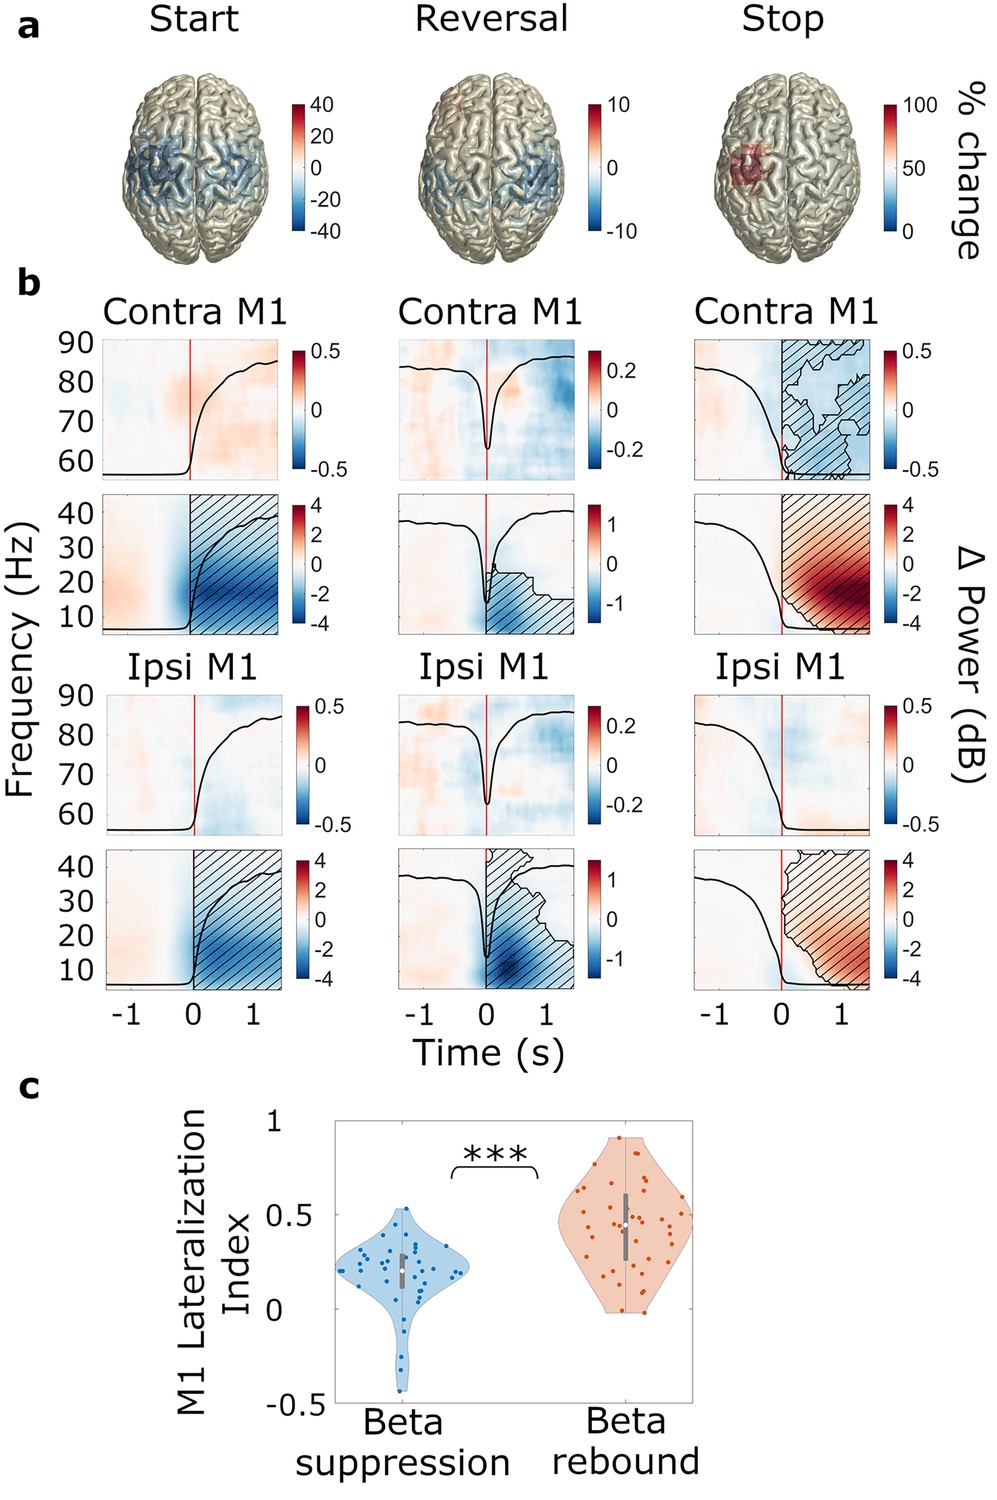
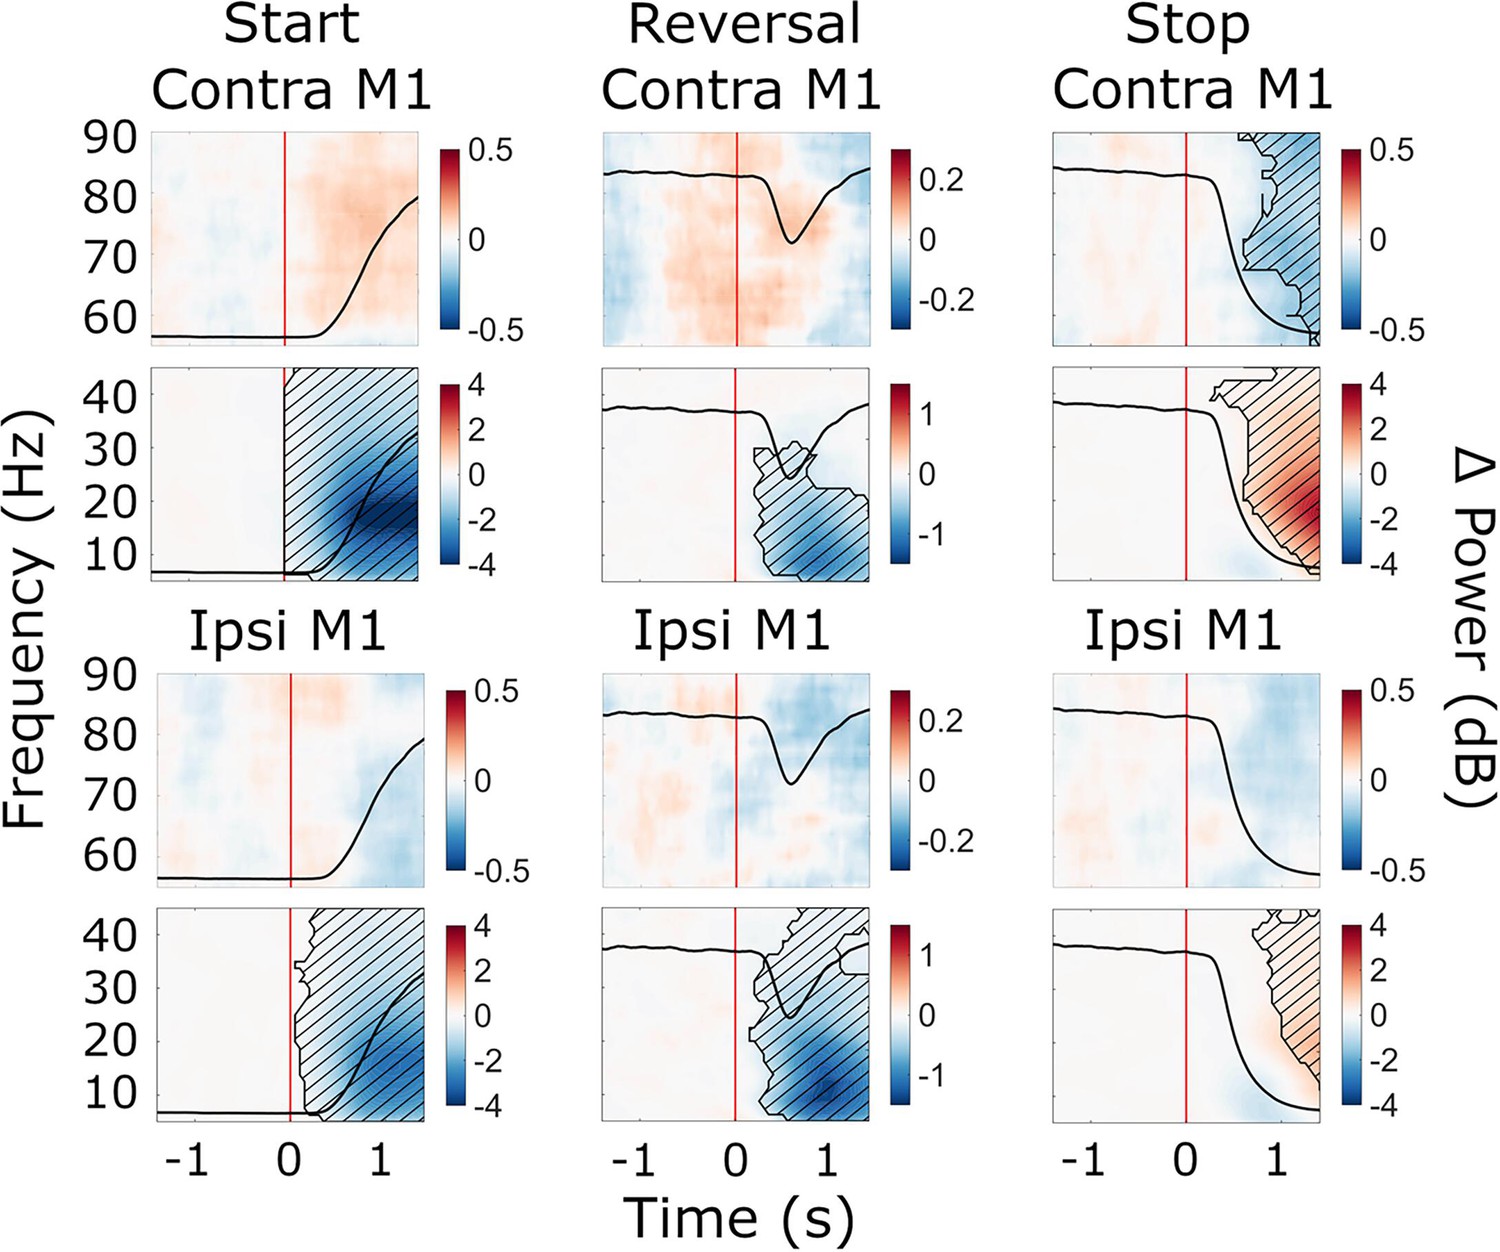
Movement-related beta power modulations in M1.
N=20. (a) Source-localized movement-related modulation of beta power at movement start, reversal, and stop (Montreal Neurological Institute, MNI space, group average, trials averaged across predictability conditions). The hemisphere contralateral to movement is on the left. (b) Time-frequency spectra of start, reversal, and stop trials for M1. Time 0 marks the time point turning began, was reversed in direction, and halted (red lines). The black line in each plot represents the average wheel turning speed (scale: 0–600 deg/s). Power was baseline-corrected (baseline: –1.6–0 s). Hatched lines within black contours indicate significant changes relative to baseline. (c) Lateralization index for M1. LI = 0 corresponds to no lateralization; positive values refer to a contralateral lateralization and negative values to an ipsilateral lateralization. Blue: beta suppression; red: beta rebound.
Figure 4—figure supplement 1
Cue-aligned beta power modulations in M1.
Time-frequency spectra of cue-aligned start, reversal, and stop trials for M1. Time 0 marks the appearance of the cue to start, reverse, or stop turning (red lines). The black line in each plot represents the average wheel turning speed (scale: 0–600 deg/s). Power was baseline-corrected (baseline: –1.6–0 s). Hatched lines within black contours indicate significant changes relative to baseline. N=20.
Figure 5
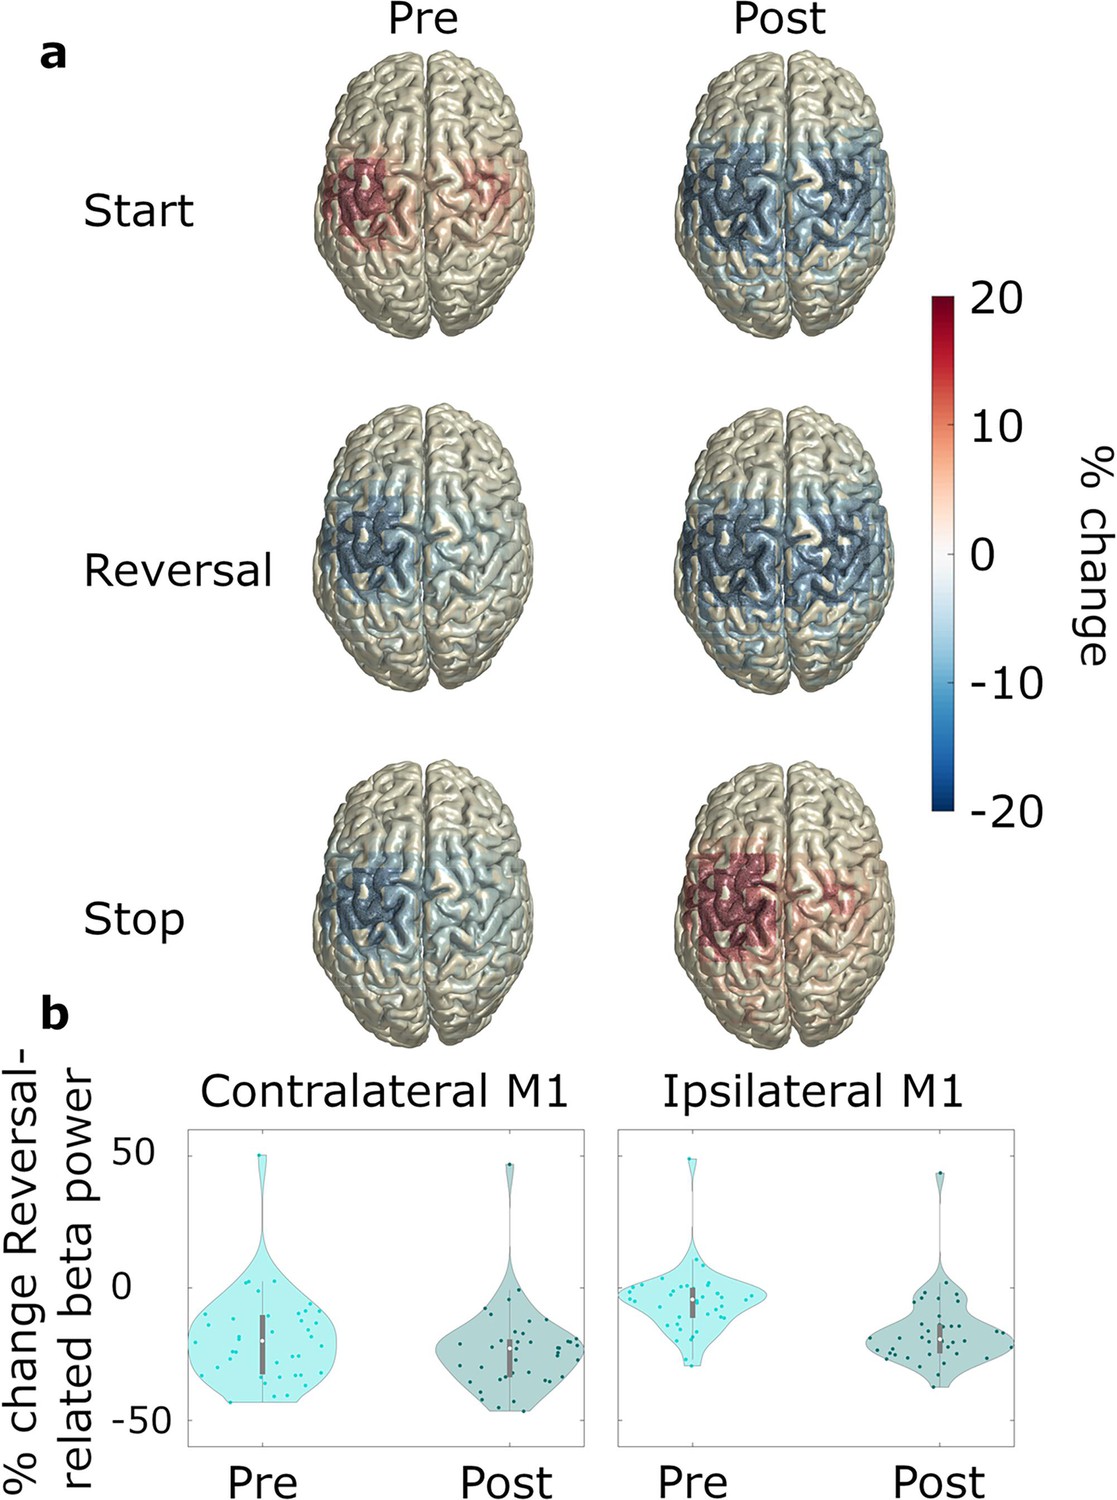
Pre- and post-event beta power.
N=20. (a) Source-localized modulation of beta power before and after movement start, reversal, and stop (−1–0 and 0–1 s with respect to the movement of interest; baseline: power averaged over all time points and movement types). Plots are group-averages in Montreal Neurological Institute (MNI) space, trials were averaged across predictability conditions. (b) Relative change with respect to whole recording average baseline, of ipsilateral and contralateral beta power for pre-reversal and post-reversal time windows.
Figure 6 with 2 supplements
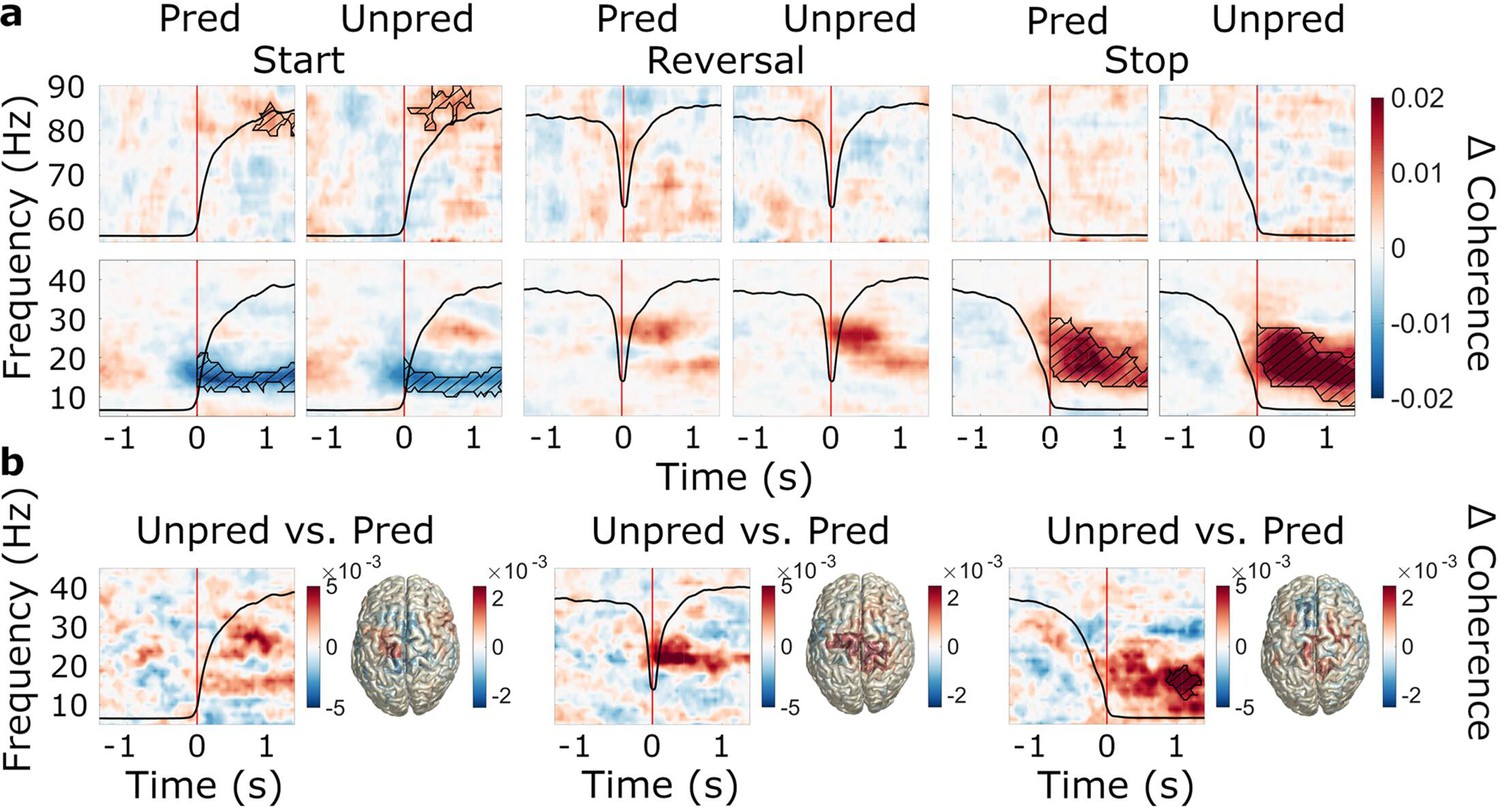
Event-related modulations of subthalamic nucleus (STN)-cortex coherence and the effect of predictability.
N=20 (a) Baseline-corrected group average time-frequency representations of STN-cortex coherence (averaged over regions of interests, ROIs) during start, reversal, and stop for both the predictable and the unpredictable trials (baseline: –1.6–0 s). Time 0 marks the moment turning began, was reversed in direction, and was halted, respectively (red line). The black line in each plot represents the average wheel turning speed (scale: 0–600 deg/s). Hatched lines within black contours indicate significant changes relative to baseline. (b) Group average coherence difference between the unpredictable and predictable conditions. Left: Contrast of time-frequency representations. TFRs were averaged over ROIs. Right: Contrast of source-localized, event-related coherence modulations in the beta band.
Figure 6—figure supplement 1
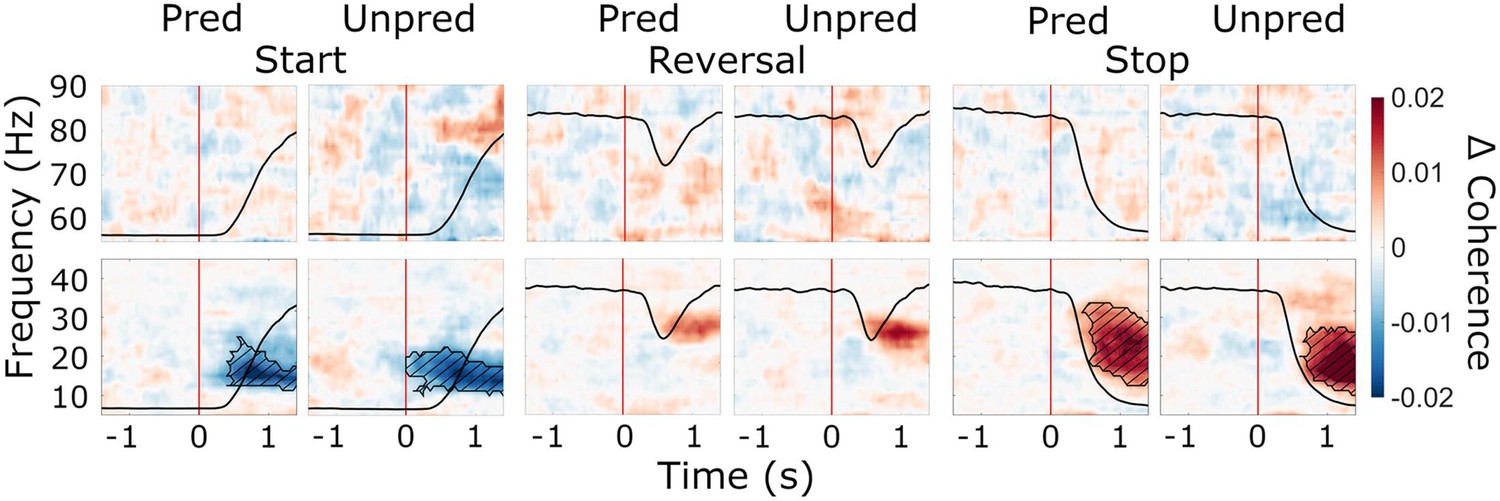
Cue-aligned modulations of subthalamic nucleus (STN)-cortex coherence and the effect of predictability.
Baseline-corrected group average of time-frequency representations of STN-cortex coherence (averaged over regions of interest, ROIs) during start, reversal, and stop (cue-aligned) for both the predictable and the unpredictable trials (baseline: –1.6–0 s). Time 0 marks the appearance of the cue to start, reverse, or stop turning (red lines). The black line in each plot represents the average wheel turning speed (scale: 0–600 deg/s). Hatched lines within black contours indicate significant changes relative to baseline. N=20.
Figure 6—figure supplement 2
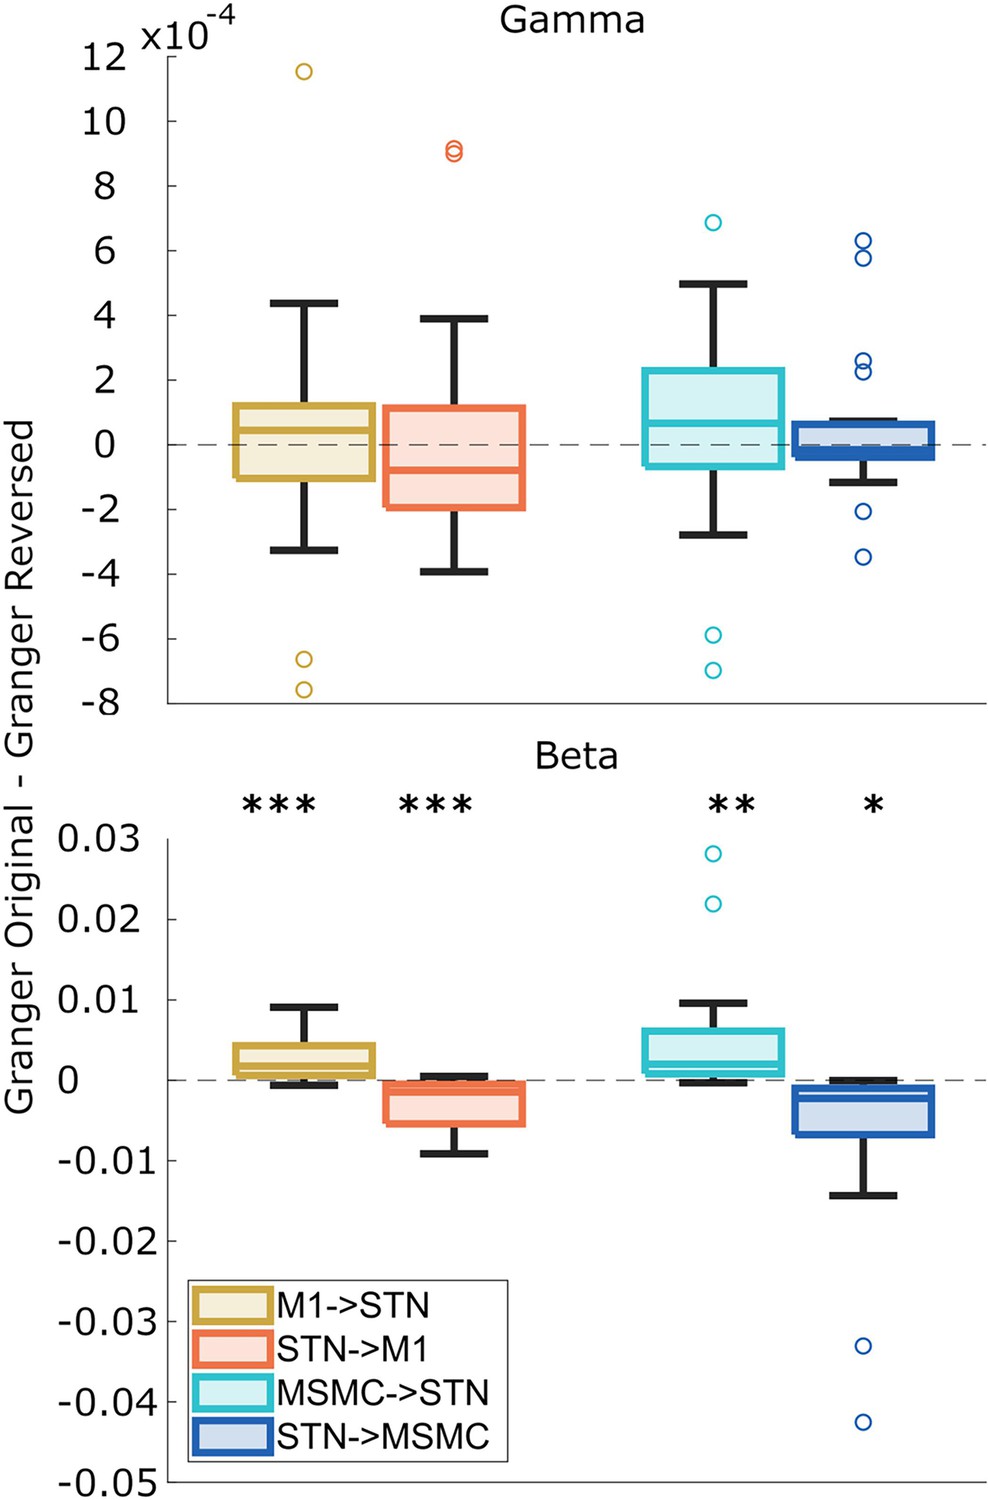
Directionality of M1-subthalamic nucleus (STN) and MSMC-STN coupling.
Beta and gamma Granger causality estimates were averaged over predictability conditions, movements, and hemispheres. Boxplots illustrate the differences in Granger causality between the original data and the time-reversed data. Differences significantly deviating from zero indicate significant directionality, as indicated by asterisks. Positive values suggest a given area drives the other. N=20.
Tables
Table 1
Patient clinical characteristics.
Disease duration refers to the time since diagnosis. For patient 4, the time since first symptom manifestation is given. MoCa = Montreal Cognitive Assessment Test.
| ID | Age | sex | Pre-surgical MDS-UPDRS III ON | Pre-surgical MoCa | Used hand | Disease duration (y) | Motor subtype | DBS Lead |
|---|---|---|---|---|---|---|---|---|
| 1 | 70 | m | 20 | 27 | R | 3 | tremor | Abbott Infinity |
| 2 | 67 | m | 31 | 27 | R | 32 | mixed | Abbott Infinity |
| 3 | 64 | M | 23 | 25 | R | 6 | akinetic-rigid | Abbott Infinity |
| 4 | 57 | M | 53 | 27 | L | 2 | tremor | Abbott Infinity |
| 5 | 66 | F | 33 | 26 | R | 18 | mixed | Abbott Infinity |
| 6 | 75 | M | 11 | 24 | R | 13 | akinetic-rigid | Abbott Infinity |
| 7 | 66 | M | 10 | 27 | R | 13 | mixed | Abbott Infinity |
| 8 | 83 | F | 7 | 25 | R | 13 | tremor | Abbott Infinity |
| 9 | 68 | F | 15 | 20 | L | 11 | akinetic-rigid | Abbott Infinity |
| 10 | 58 | F | 21 | 14 | R | 5 | mixed | Medtronic |
| 11 | 69 | M | 17 | 27 | L | 12 | mixed | Abbott Infinity |
| 12 | 73 | F | 17 | 28 | L | 9 | mixed | Abbott Infinity |
| 13 | 65 | M | 28 | 21 | L | 13 | mixed | Abbott Infinity |
| 14 | 65 | M | 12 | 20 | R | 4 | tremor | Abbott Infinity |
| 15 | 64 | M | 25 | 23 | R | 17 | mixed | Medtronic |
| 16 | 68 | M | 15 | 28 | R | 5 | mixed | Abbott Infinity |
| 17 | 65 | M | 9 | 18 | R | 4 | akinetic-rigid | Abbott Infinity |
| 18 | 50 | M | 11 | 26 | R | 4 | tremor | Abbott Infinity |
| 19 | 68 | F | 42 | 23 | L | 12 | mixed | Abbott Infinity |
| 20 | 56 | F | 20 | 26 | R | 3 | tremor | Medtronic |
Additional files
-
Supplementary file 1
Behavioral effects.
(A) Effects of condition (predictable, unpredictable) and movement (start, reverse, stop) on movement-aligned speed, controlling for age, pre-operative UPDRS score, and disease duration. (B) Effects of condition (predictable, unpredictable) and movement (start, reverse, stop) on reaction times to cues, controlling for age, pre-operative UPDRS score, and disease duration.
- https://cdn.elifesciences.org/articles/101769/elife-101769-supp1-v1.docx
-
Supplementary file 2
Effects on lateralization.
Effects of modulation type (beta suppression, beta rebound), condition (predictable, unpredictable), and ROI (STN, M1, MSMC) on lateralization index, controlling for age, pre-operative UPDRS score, and disease duration.
- https://cdn.elifesciences.org/articles/101769/elife-101769-supp2-v1.docx
-
Supplementary file 3
Effects on beta power and coherence.
(A) Effects of condition (predictable, unpredictable), movement (start, reverse, stop), and regions of interest ROI (contralateral and ipsilateral STN, M1, MSMC) on normalized power, controlling for movement speed, age, pre-operative UPDRS score, and disease duration. (B) Effects of condition (predictable, unpredictable), movement (start, reverse, stop), and ROI (contralateral STN-M1, contralateral STN-MSMC, ipsilateral STN-M1, ipsilateral STN-MSMC) on coherence modulation, controlling for movement speed, age, pre-operative UPDRS score, and disease duration.
- https://cdn.elifesciences.org/articles/101769/elife-101769-supp3-v1.docx
-
Supplementary file 4
Effects on beta Granger causality.
(A) Effects of condition (predictable, unpredictable), movement (start, reverse, stop), and regions of interest (ROI) (contralateral and ipsilateral M1->STN, STN->M1, MSMC->STN, STN->MSMC) on Granger causality, controlling for movement speed, age, pre-operative UPDRS score, and disease duration.
- https://cdn.elifesciences.org/articles/101769/elife-101769-supp4-v1.docx
-
Supplementary file 5
Effects on gamma power and coherence.
(A) Effects of condition (predictable, unpredictable), movement (start, reverse, stop), and regions of interest (ROI) (contralateral and ipsilateral STN, M1, MSMC) on normalized power, controlling for movement speed, age, pre-operative UPDRS score and disease duration. (B) Effects of condition (predictable, unpredictable), movement (start, reverse, stop), and ROI (contralateral STN-M1, contralateral STN-MSMC, ipsilateral STN-M1, ipsilateral STN-MSMC) on coherence modulation, controlling for movement speed, age, pre-operative UPDRS score, and disease duration.
- https://cdn.elifesciences.org/articles/101769/elife-101769-supp5-v1.docx
-
Supplementary file 6
Effects on gamma Granger causality.
(A) Effects of condition (predictable, unpredictable), movement (start, reverse, stop), and regions of interest (ROI) (contralateral and ipsilateral M1->STN, STN->M1, MSMC->STN, STN->MSMC) on Granger causality, controlling for movement speed, age, pre-operative UPDRS score, and disease duration.
- https://cdn.elifesciences.org/articles/101769/elife-101769-supp6-v1.docx
-
Supplementary file 7
Excel file containing reaction times and movement speed.
- https://cdn.elifesciences.org/articles/101769/elife-101769-supp7-v1.xlsx
-
Supplementary file 8
Excel file containing beta and gamma power values.
- https://cdn.elifesciences.org/articles/101769/elife-101769-supp8-v1.xlsx
-
Supplementary file 9
Excel file containing beta lateralization index values.
- https://cdn.elifesciences.org/articles/101769/elife-101769-supp9-v1.xlsx
-
Supplementary file 10
Excel file containing the beta and gamma coherence values.
- https://cdn.elifesciences.org/articles/101769/elife-101769-supp10-v1.xlsx
-
Supplementary file 11
Excel file containing the beta and gamma Granger causality values.
- https://cdn.elifesciences.org/articles/101769/elife-101769-supp11-v1.xlsx
-
MDAR checklist
- https://cdn.elifesciences.org/articles/101769/elife-101769-mdarchecklist1-v1.docx
Download links
A two-part list of links to download the article, or parts of the article, in various formats.
Downloads (link to download the article as PDF)
Open citations (links to open the citations from this article in various online reference manager services)
Cite this article (links to download the citations from this article in formats compatible with various reference manager tools)
Context-dependent modulations of subthalamo-cortical synchronization during rapid reversals of movement direction in Parkinson’s disease
eLife 13:RP101769.
https://doi.org/10.7554/eLife.101769.3


