Statistical learning beyond words in human neonates
- Cognitive Neuroimaging Unit, CNRS ERL 9003, INSERM U992, CEA, Université Paris Saclay, NeuroSpin center, France
- Department of Developmental Psychology and Socialisation and Department of Neuroscience, University of Padova, Italy
- Departement d’étude Cognitives, École Normale Supérieure, France
- Aix Marseille Univ, INSERM, INS, Inst Neurosci syst, France
Figures
Figure 1
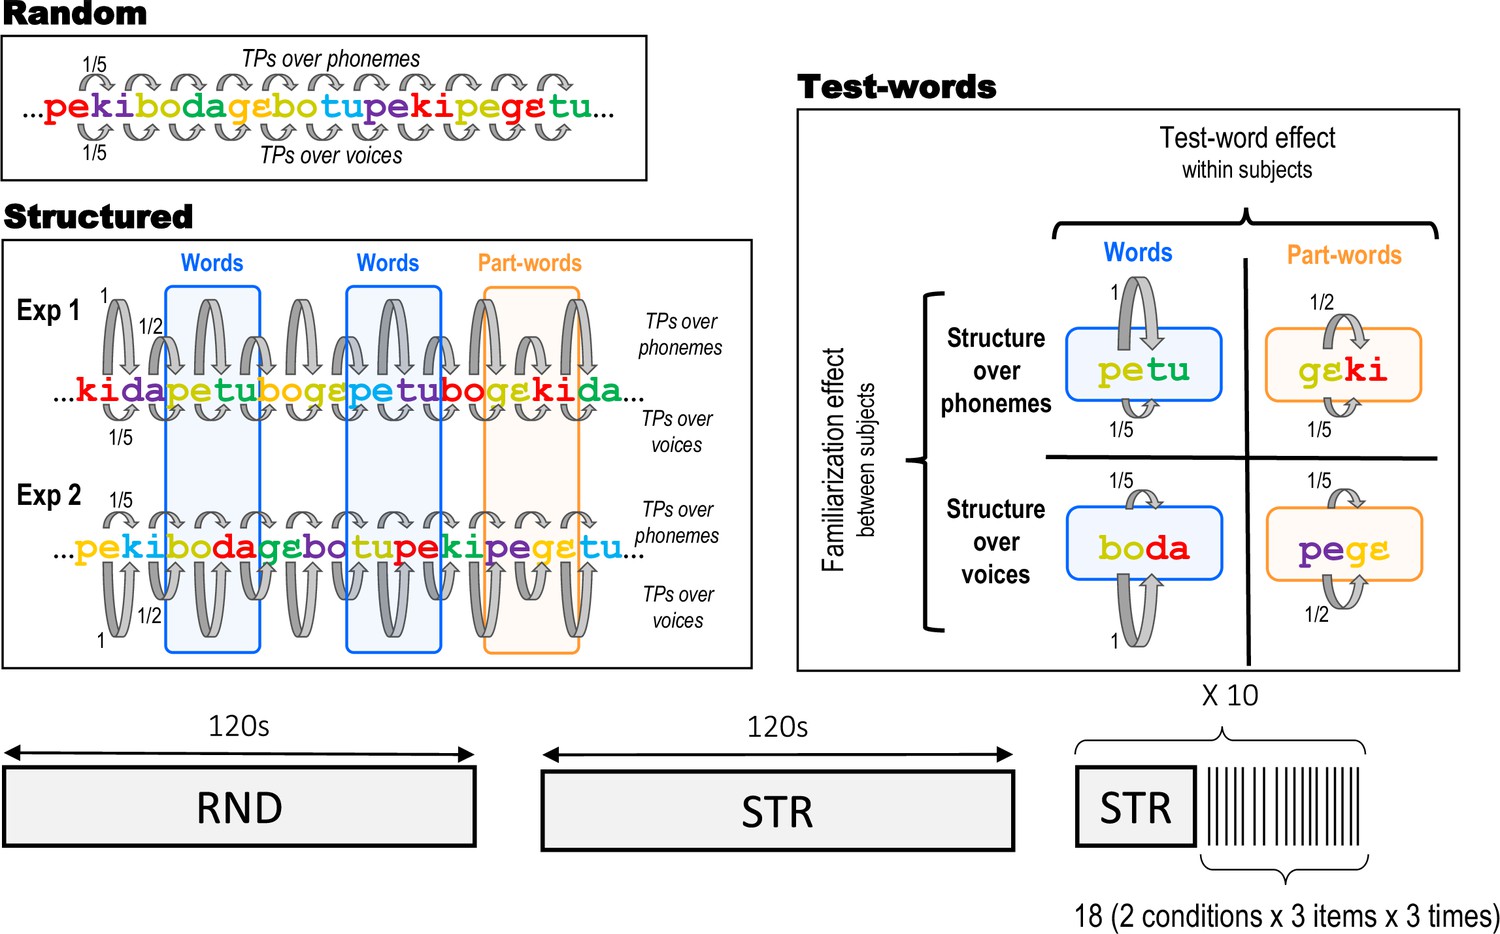
Experimental protocol.
The experiments started with a Random stream (120 s) in which both syllables and voices changed randomly, followed by a long-Structured stream (120 s). Then, 10 short familiarisation streams (30 s), each followed by test blocks comprising 18 isolated duplets (SOA 2–2.3 s) were presented. Example streams are presented to illustrate the construction of the streams, with different colours representing different voices. In Experiment 1, the Structured stream had a statistical structure based on phonemes (TPs alternated between 1 and 0.5), while the voices were randomly changing (uniform TPs of 0.2). For example, the two syllables of the word ‘petu’ were produced by different voices, which randomly changed at each presentation of the word (e.g. ‘yellow’ voice and ‘green’ voice for the first instance, ‘blue’ and ‘purple’ voice for the second instance, etc..). In Experiment 2, the statistical structure was based on voices (TPs alternated between 1 and 0.5), while the syllables changed randomly (uniform TPs of 0.2). For example, the ‘green’ voice was always followed by the ‘red’ voice, but they were randomly saying different syllables ‘boda’ in the first instance, ‘tupe’ in the second instance, etc... The test duplets in the recognition test phase were either Words (TP = 1) or Partwords (TP = 0.5). Words and Partwords were defined in terms of phonetic content for Experiment 1 and voice content for Experiment 2.
Figure 2
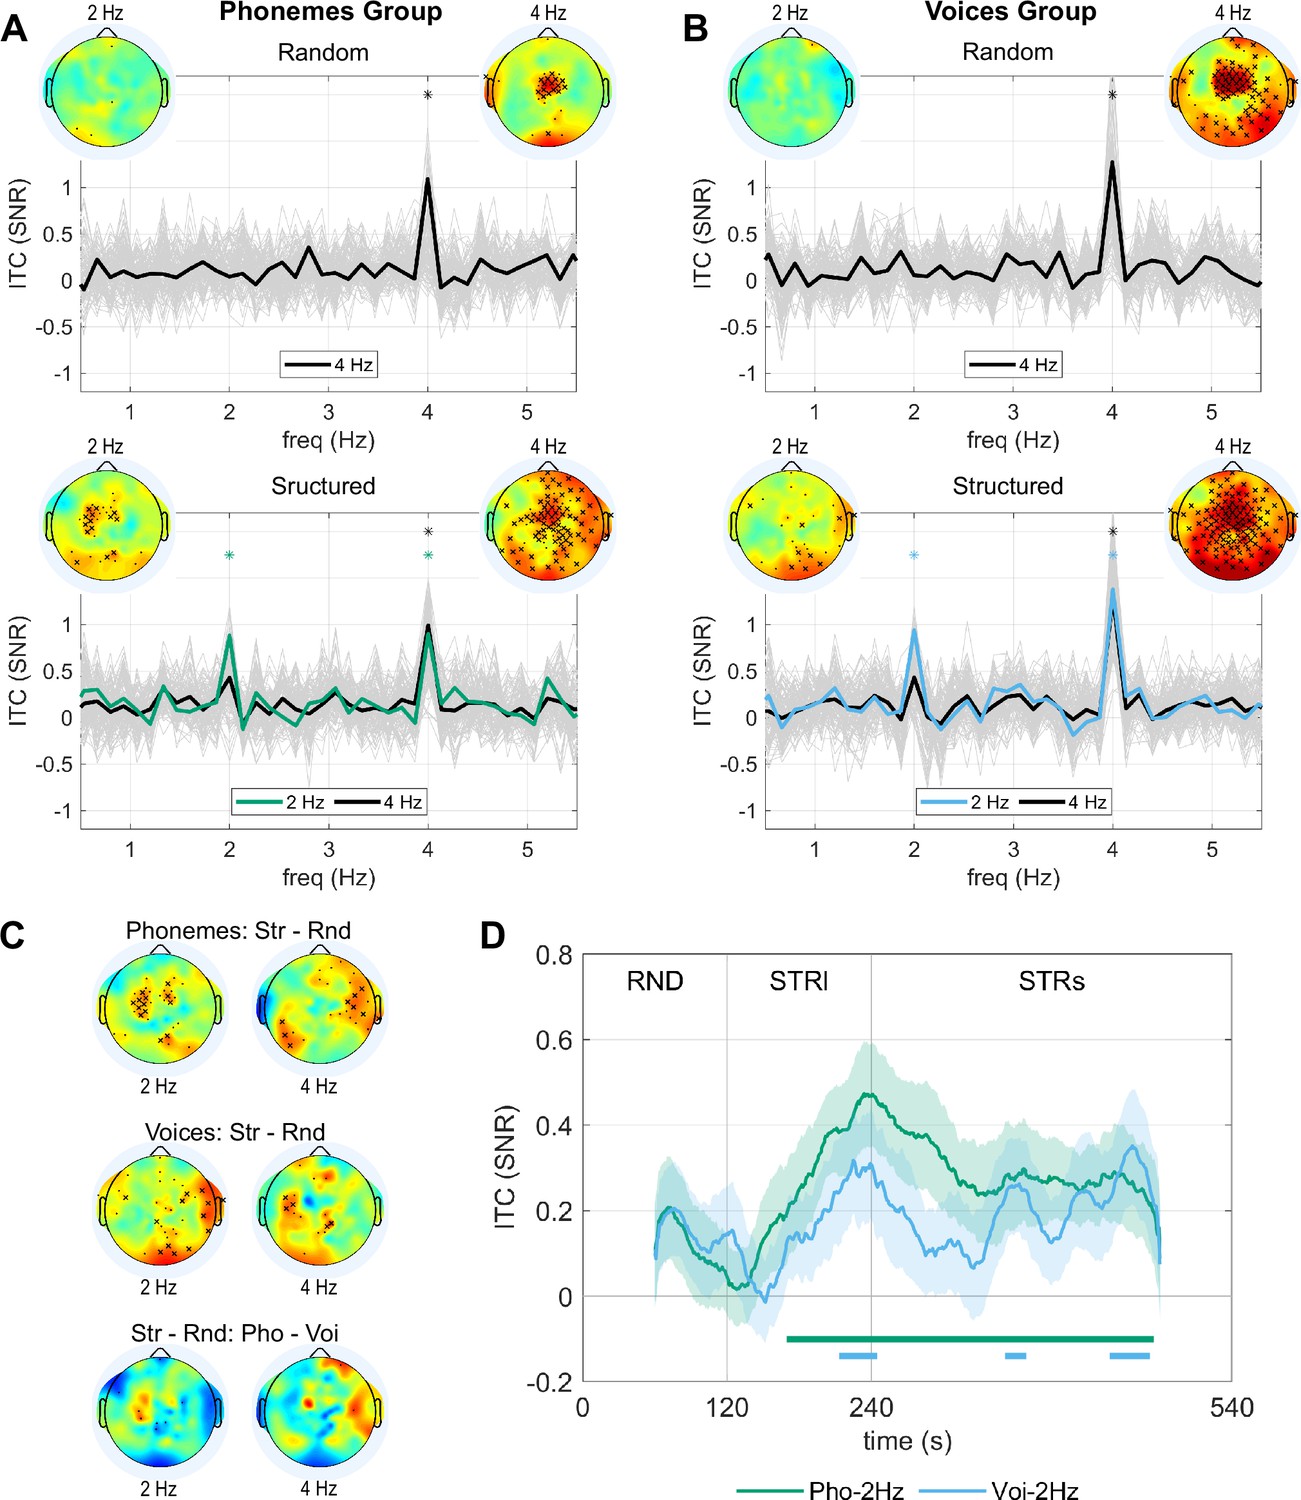
Neural entrainment during the random and structured streams.
(A) SNR for the ITC during the Random and Structured streams of Experiment 1 (structure on phonetic content) (n=32). The topographies represent the entrainment in the electrode space at the syllabic (4 Hz) and duplet rates (2 Hz). Crosses indicate the electrodes showing enhanced neural entrainment (cross: p<0.05, one-sided paired permutation test, FDR corrected by the number of electrodes; dot: p<0.05, without FDR correction). Colour scale limits [–1.8, 1.8]. The entrainment for each electrode is shown in light grey. The thick black line shows the mean over the electrodes with significant entrainment relative to the adjacent frequency bins at the syllabic rate (4 Hz) (p<0.05 FDR corrected). The thick green line shows the mean over the electrodes showing significant entrainment relative to the adjacent frequency bins at the duplet rate (2 Hz) (p<0.05 FDR corrected). The asterisks indicate frequency bins with entrainment significantly higher than on adjacent frequency bins for the average across electrodes (p<0.05, one-sided permutation test, FDR corrected for the number of frequency bins). (B) Analog to A for Experiment 2 (structure on voice content) (n=32). (C) The first two rows show the topographies for the difference in entrainment during the Structured and Random streams at 4 Hz and 2 Hz for both experiments. Crosses indicate the electrodes showing stronger entrainment during the Structured stream (cross: p<0.05, one-sided paired permutation test, FDR corrected by the number of electrodes; dot: p<0.05, without FDR correction). The bottom row shows the interaction effect by comparing the difference in entrainment during the Structured and Random streams between Experiments 1 and 2. Crosses indicate significant differences (cross: p<0.05, two-sided unpaired permutation test, FDR corrected by the number of electrodes; dot: p<0.05, without FDR correction). (D) Time course of the neural entrainment at 4 Hz for the average over electrodes showing significant entrainment during the Random stream and at 2 Hz for the average over electrodes showing significant entrainment during the Structured stream (Phoneme: green line, Voice blue line). The shaded area represents standard errors. The horizontal lines on the bottom indicate when the entrainment was larger than 0 (p<0.05, one-sided t-test, corrected by FDR by the number of time points).
Figure 3 with 3 supplements

Cluster-based permutation analysis of ERPs to isolated duplets during recognition The topographies show the difference between the two conditions corresponding to each main effect.
Results obtained from the cluster-based permutation analyses are shown at the bottom of each panel. Thick lines correspond to the grand averages for the two main tested conditions. Shaded areas correspond to the standard error across participants. Thin lines show the ERPs separated by duplet type and familiarisation type. The shaded areas between the thick lines show the time extension of the cluster. The topographies correspond to the difference between conditions during the time extension of the cluster. The electrodes belonging to the cluster are marked with a cross. Significant clusters are indicated with an asterisk. Color scale limits [–0.07, 0.07] a.u. (A) Main effect of Test-duplets (Words - Part-words) over a frontal-right positive cluster (p=0.019) and a left temporal negative cluster (p=0.0056) (n = 67 Words, n = 67 Part-words). (B) Main effect of familiarisation (Phonemes - Voices) over a posterior negative cluster (p=0.018) (n = 68 Phonemes, n = 66 Voices). The frontal positive cluster did not reach significance (p=0.12). Results are highly comparable to the ROIs-based analysis (Figure 3—figure supplement 1 and Figure 3—figure supplement 3).
Figure 3—figure supplement 1
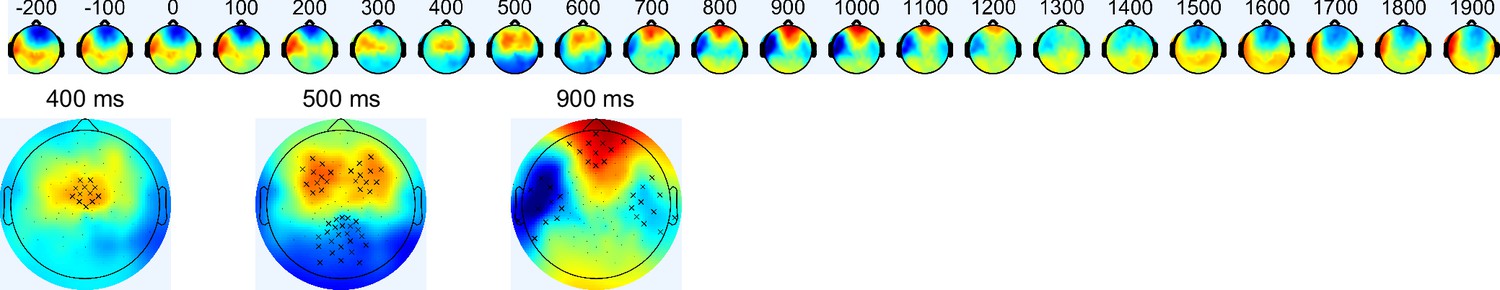
Topographies for the grand average ERP ERP across all participants for both Experiments.
The three main topographies observed during the response are plotted on the bottom. The markers show the electrodes belonging to the 7 defined ROIs: for the first topography, central electrodes; for the second topography, frontal left, frontal right and occipital electrodes; and for the third topography, temporal left, temporal right and pre-frontal electrodes. Color scale limits [–0.07, 0.07] a.u.
Figure 3—figure supplement 2
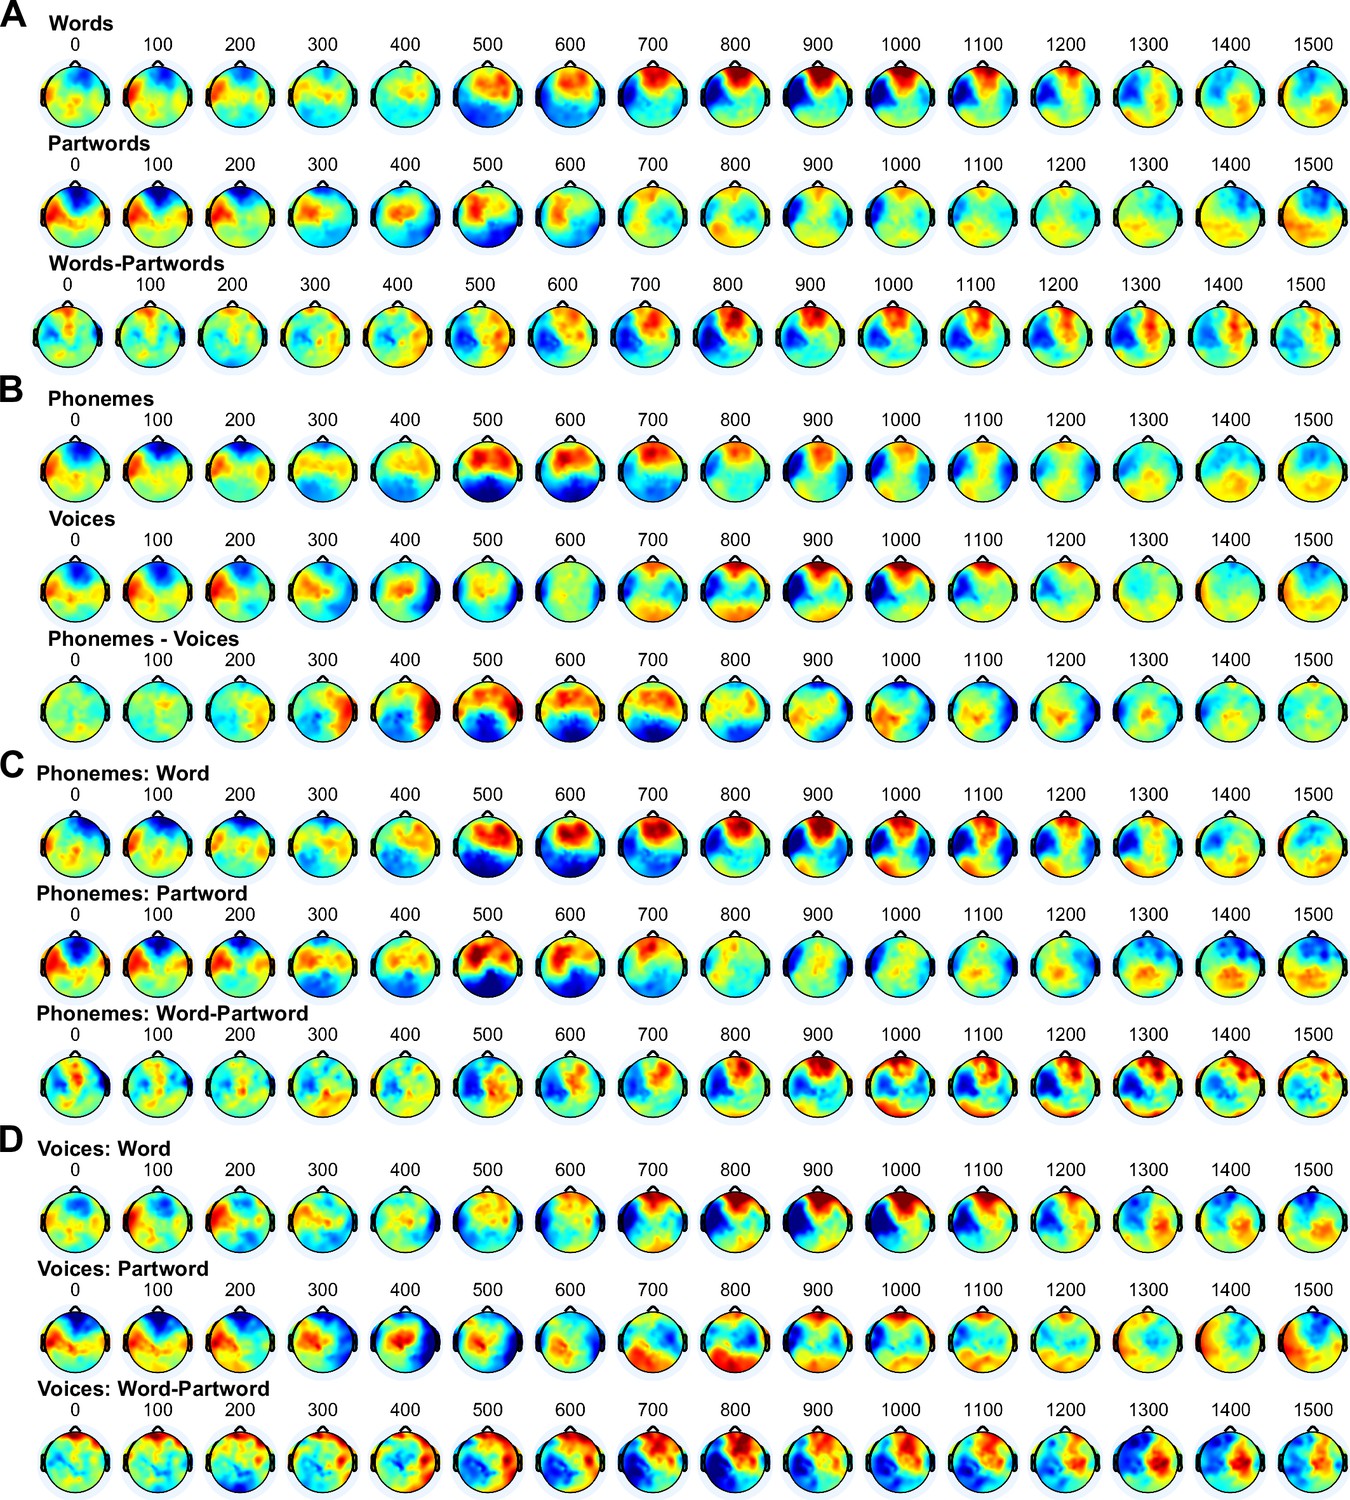
Topographies for the ERPs to test words during recognition Color scale limits [–0.07, 0.07] a.u.
(A) Topographies for the Test-word effect. (B) Topographies for the Famliarisation effect. (C) Topographies for the Test-word effect during Experiment 1 (structured over Phonemes). (D) Topographies for the Test-word effect during Experiment 2 (structured over Voices).
Figure 3—figure supplement 3
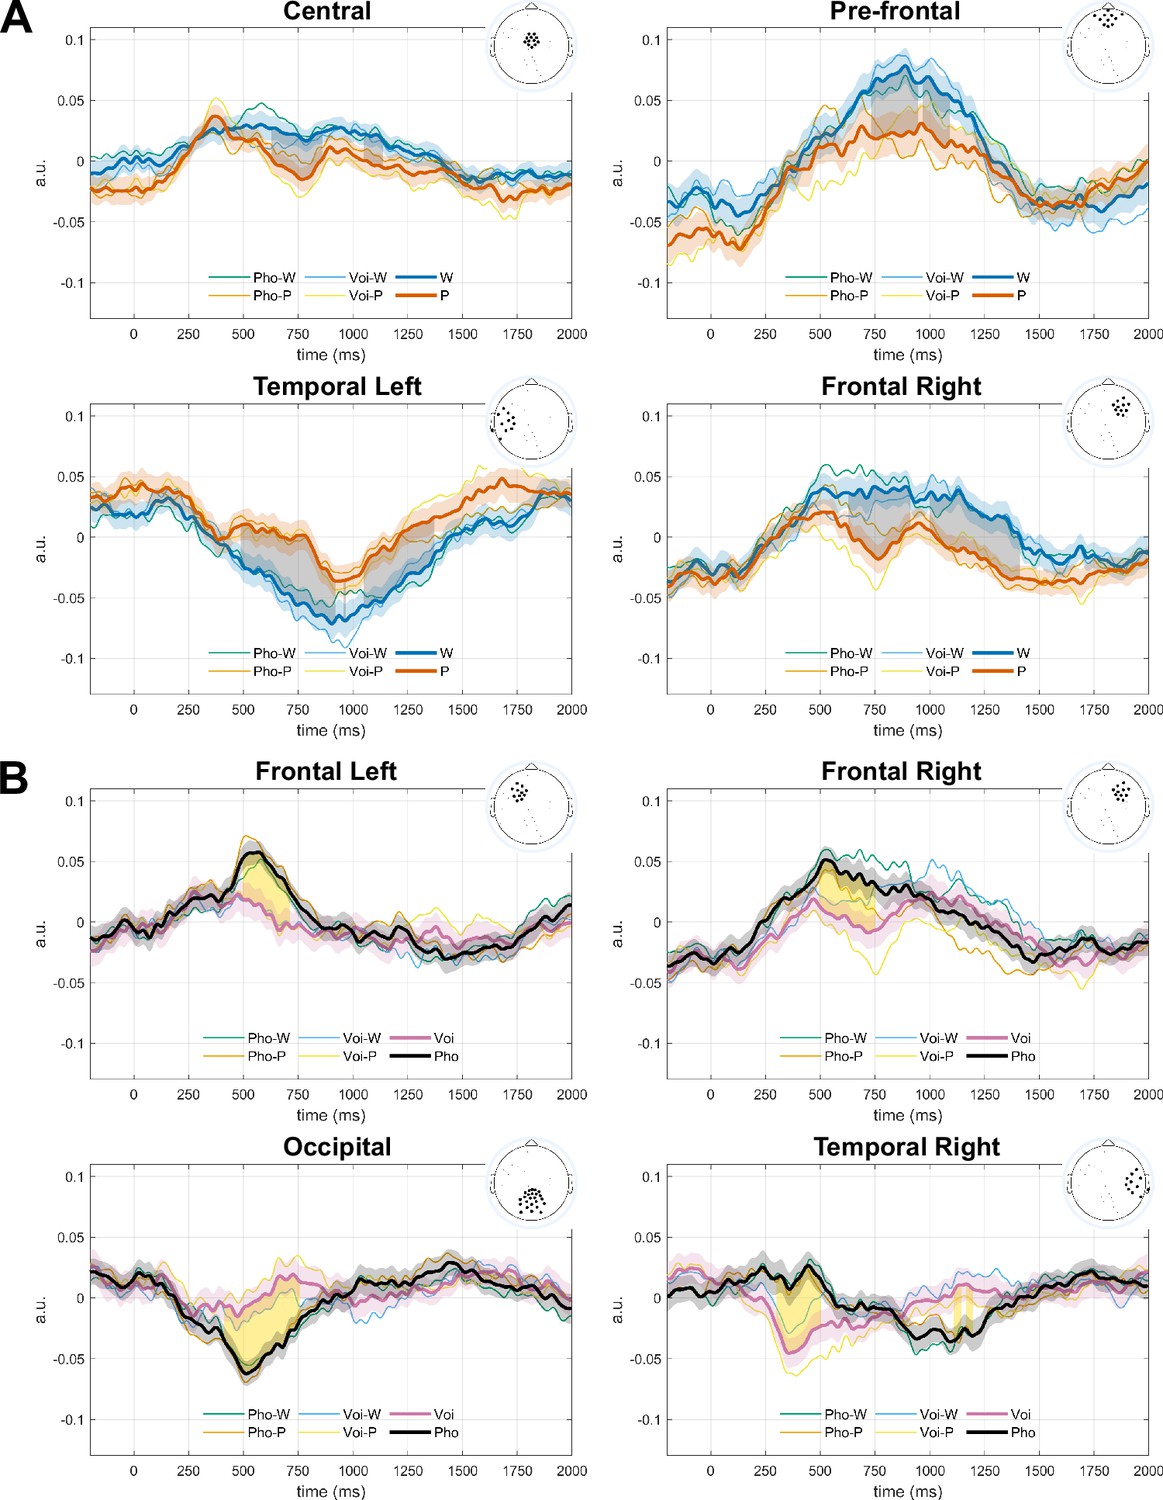
Result for the ROI analysis of the ERPs to test words during recognition.
ROIs showing significant differences for the ERPs during the recognition phase in A Words vs Partwords comparison and B Voice vs Phoneme Comparison: the thick lines show the grand averages for the two conditions showing the main effect. Shaded areas around the lines correspond to the standard error across participants (n = 67 Words, n = 67 Part-words; n = 68 Phonemes, n = 66 Voices). Thin lines show the ERPs separated by duplet type and Familiarization type. The shaded areas between the thick lines indicate time windows where significant differences were found after correcting by multiple comparisons (p<0.05, FDR corrected by the number of ROIs and times points). The topographies represent the electrodes belonging to the ROI. We run an ANOVA for the average activity in each ROI and significant time window, including test duplet and familiarisation as factors. We did not observe significant interactions in any case. Voi = Voice; Pho = Phoneme; W=Words, P=Part-Words.
Figure 4

Adults’ behavioural experiment.
Each subject’s average score attributed to the Words (blue) and Partwords (orange) is represented. On the right, for the group familiarised with the Phoneme structure (n=27) and on the left, for the group familiarised with the Voice structure (n=30). The difference between test duplets was significant for the Phoneme group (p=0.007) and only marginally significant for the Voice group (p=0.050). There was also a significant interaction group ×duplet type (p=0.025).
Appendix 1—figure 1
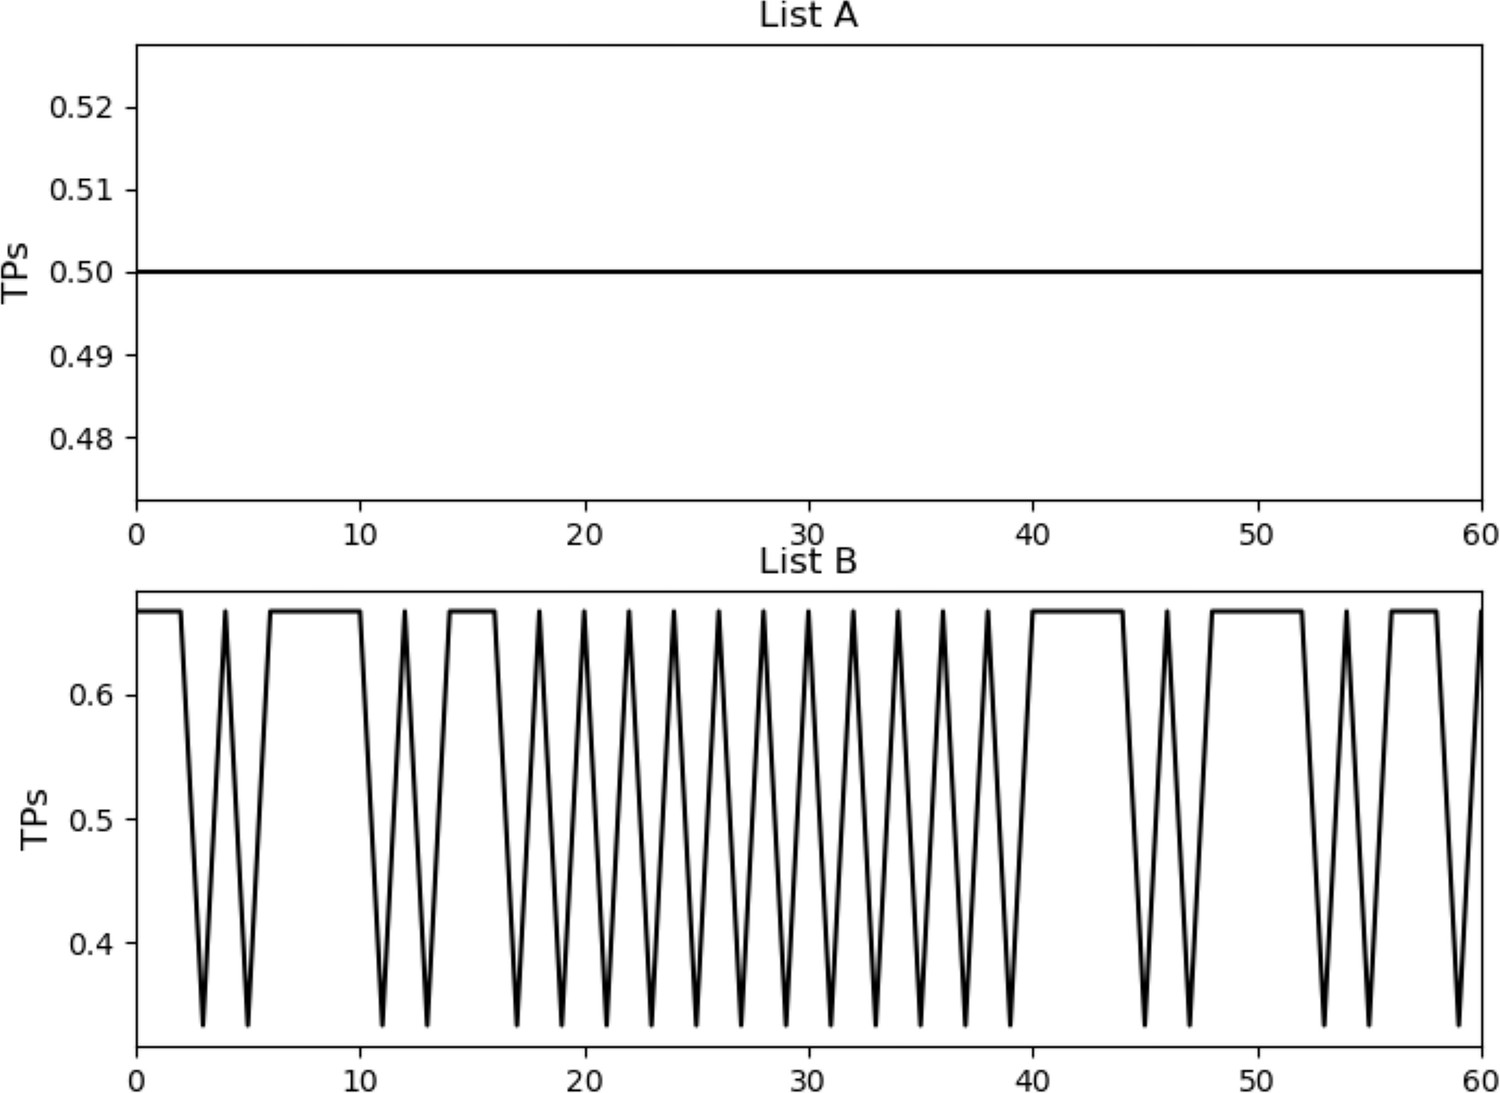
Transition probabilities (TPs) across the structured stream in Experiment 2, considering voices processed by gender (Female or Male).
Top: List A. Bottom: List B.
Appendix 1—figure 2

Neural entrainment at word rate (2Hz) during the structured stream of Experiment 2 for Lists A and B.
Appendix 1—figure 3
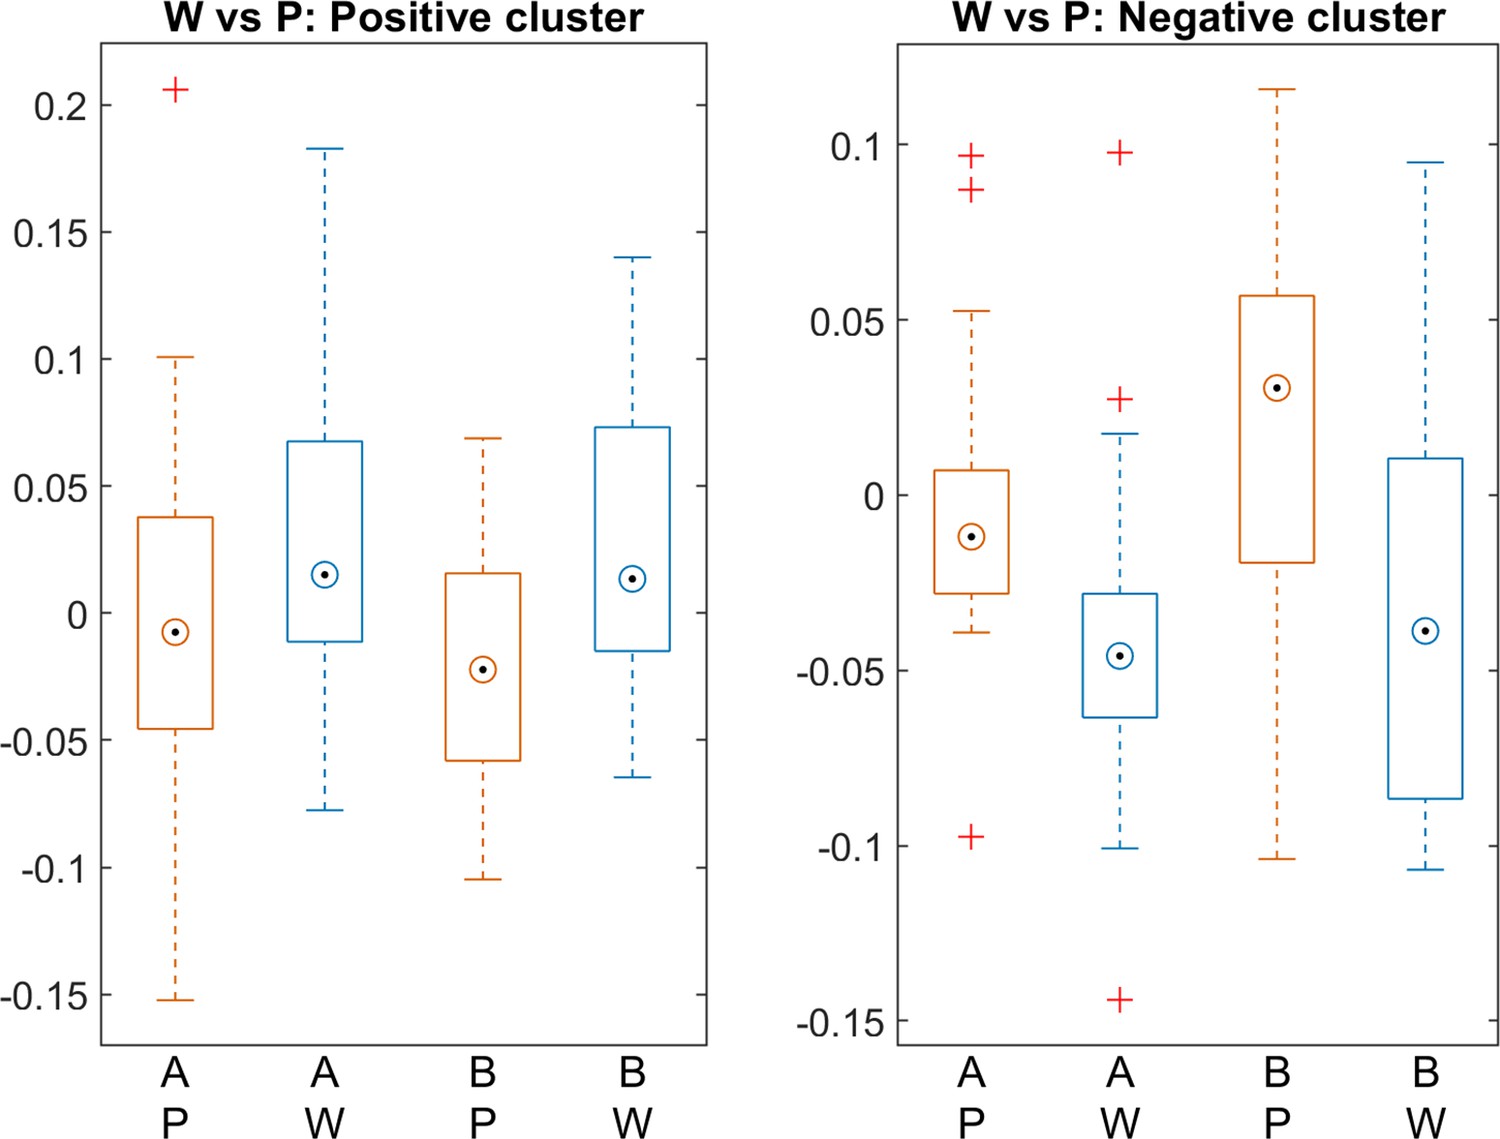
Difference in ERP voltage (Words – Part-words) for the twPo lists (A and B); W=Words; P=Part-Words.
Author response image 1

Transition probabilities (TPs) across the structured stream in Experiment 2, considering voices processed by gender (Female or Male).
Top: List A. Bottom: List B.
Author response image 2

Difference in ERP voltage (Words – Part-words) for the two lists (A and B); W=Words; P=Part-Words.
Author response image 3

Neural entrainment at 2Hz during the structured stream of Experiment 2 for Lists A and B.
Author response image 4

International 10–20 sensors' location on the skull of an infant template, with the underlying 3-D reconstruction of the grey-white matter interface and projection of each electrode to the cortex.
Computed across 16 infants (from Kabdebon et al, Neuroimage, 2014). The O1, O2, T5, and T6 electrodes project lower than in adults.
Tables
Appendix 1—table 1
Voice stimuli.
properties of the six voices used to construct the stimuli. The Voice column indicates the name of the voice from the MBROLA diphone database voice used.
| Voice | Gender | Pitch (Hz) | |
|---|---|---|---|
| Ma | fr3 | Male | 75 |
| Mb | fr1 | Male | 108 |
| Mc | fr7 | Male | 140 |
| Fa | fr2 | Female | 133 |
| Fb | it4 | Female | 190 |
| Fc | fr4 | Female | 247 |
Appendix 1—table 2
Stimuli.
Words and Part-words for each experiment and list.
| Experiment 1 | Experiment 2 | ||||||
|---|---|---|---|---|---|---|---|
| List A | List B | List A | List B | ||||
| Word | Part-word | Word | Part-word | Word | Part-word | Word | Part-word |
| kida | dape | dape | kida | FbMb | MbFc | MbFc | FbMb |
| petu | tubo | tubo | petu | FcFa | FaMa | FaMa | FcFa |
| bogɛ | gɛki | gɛki | bogɛ | MaMc | McFb | McFb | MaMc |
Additional files
Download links
A two-part list of links to download the article, or parts of the article, in various formats.
Downloads (link to download the article as PDF)
Open citations (links to open the citations from this article in various online reference manager services)
Cite this article (links to download the citations from this article in formats compatible with various reference manager tools)
Statistical learning beyond words in human neonates
eLife 13:RP101802.
https://doi.org/10.7554/eLife.101802.3


