Circuit mechanisms encoding odors and driving aging-associated behavioral declines in Caenorhabditis elegans
- University of California, San Diego, United States
- Salk Institute for Biological Studies, United States
- University of Michigan, United States
- Worcester Polytechnic Institute, United States
Figures
Figure 1 with 1 supplement
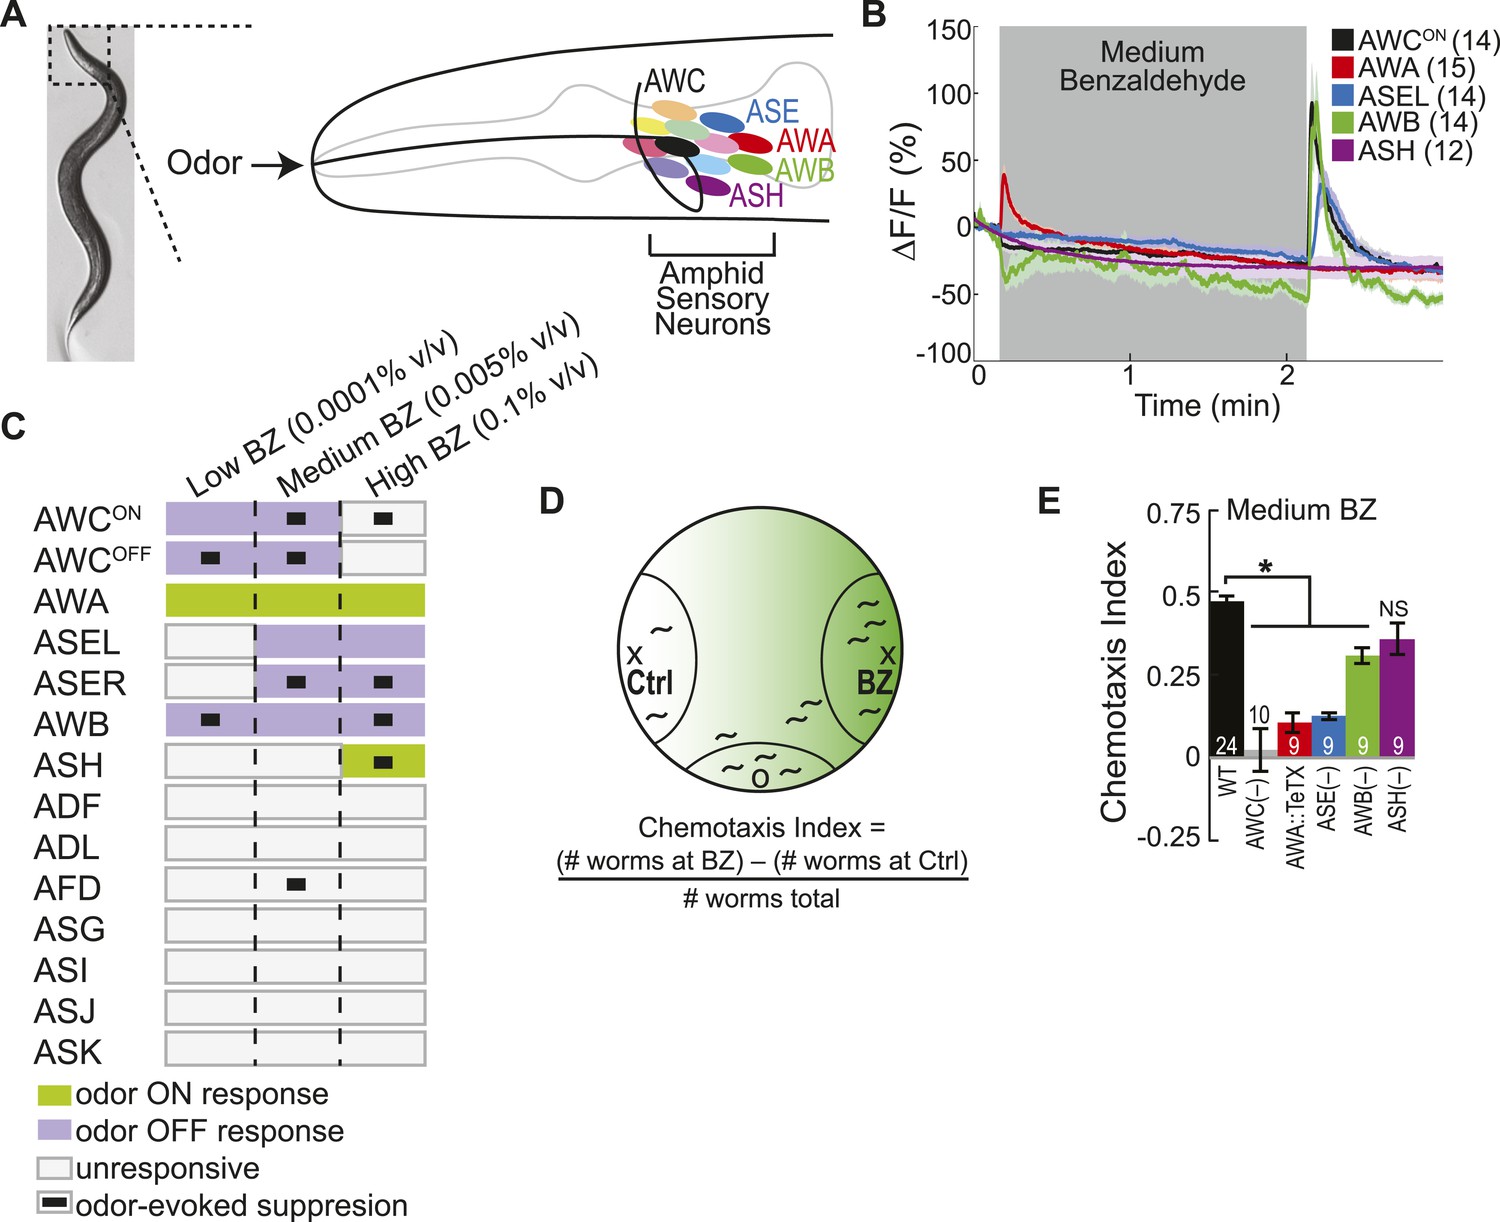
Multiple sensory neurons detect the odor benzaldehyde (BZ).
(A) Image of a young adult C. elegans and schematic depicting the twelve pairs of sensory neurons in the anterior amphid ganglia whose dendrites project to the nose of the animal where they detect sensory stimuli. (B) Average GCaMP fluorescence change in young adult (day 1), wild-type sensory neurons in response to medium concentration (0.005% vol/vol) BZ stimulation. Shaded box indicates two minute BZ odor stimulation beginning at t = 10 s. The light color shading around curves indicates s.e.m. and numbers in parentheses indicate number of neurons imaged. (C) Summary chart of the calcium responses of all amphid sensory neurons to low (0.0001% vol/vol), medium (0.005% vol/vol) and high (0.1% vol/vol) concentrations of BZ odor. This chart shows the composition of the C. elegans olfactory neural circuit and depicts a combinatorial sensory neuron code for odor concentration. The calcium signal in some neurons (as indicated) is suppressed by the addition of odor (see methods and materials section). (D) Chemotaxis assay schematic depicting C. elegans attraction to a point source of BZ. Animals are placed at the origin (O) and allow to chemotax towards a point of BZ or control (Ctrl). The putative BZ gradient is shown in shades of green with darker colors representing higher BZ concentrations. (E) Young adult (day 1) chemotaxis performance of wild-type, AWC or AWB or ASH neuron-specific genetic ablation, AWA neuron-specific tetanus toxin expression worms or che-1 mutants missing ASE neurons to a medium concentration point source of BZ odor (Uchida et al., 2003). See Figure 1—source data 1 for raw chemotaxis data. Numbers on bars indicate number of assay plates and error bars indicate s.e.m. *p < 0.05, two-tailed t-test with Bonferroni correction, compared to wild-type.
-
Figure 1—source data 1
Young adult chemotaxis performance data.
- https://doi.org/10.7554/eLife.10181.004
-
Figure 1—source data 2
Odor-evoked responses in wild-type young adult data.
- https://doi.org/10.7554/eLife.10181.005
Figure 1—figure supplement 1
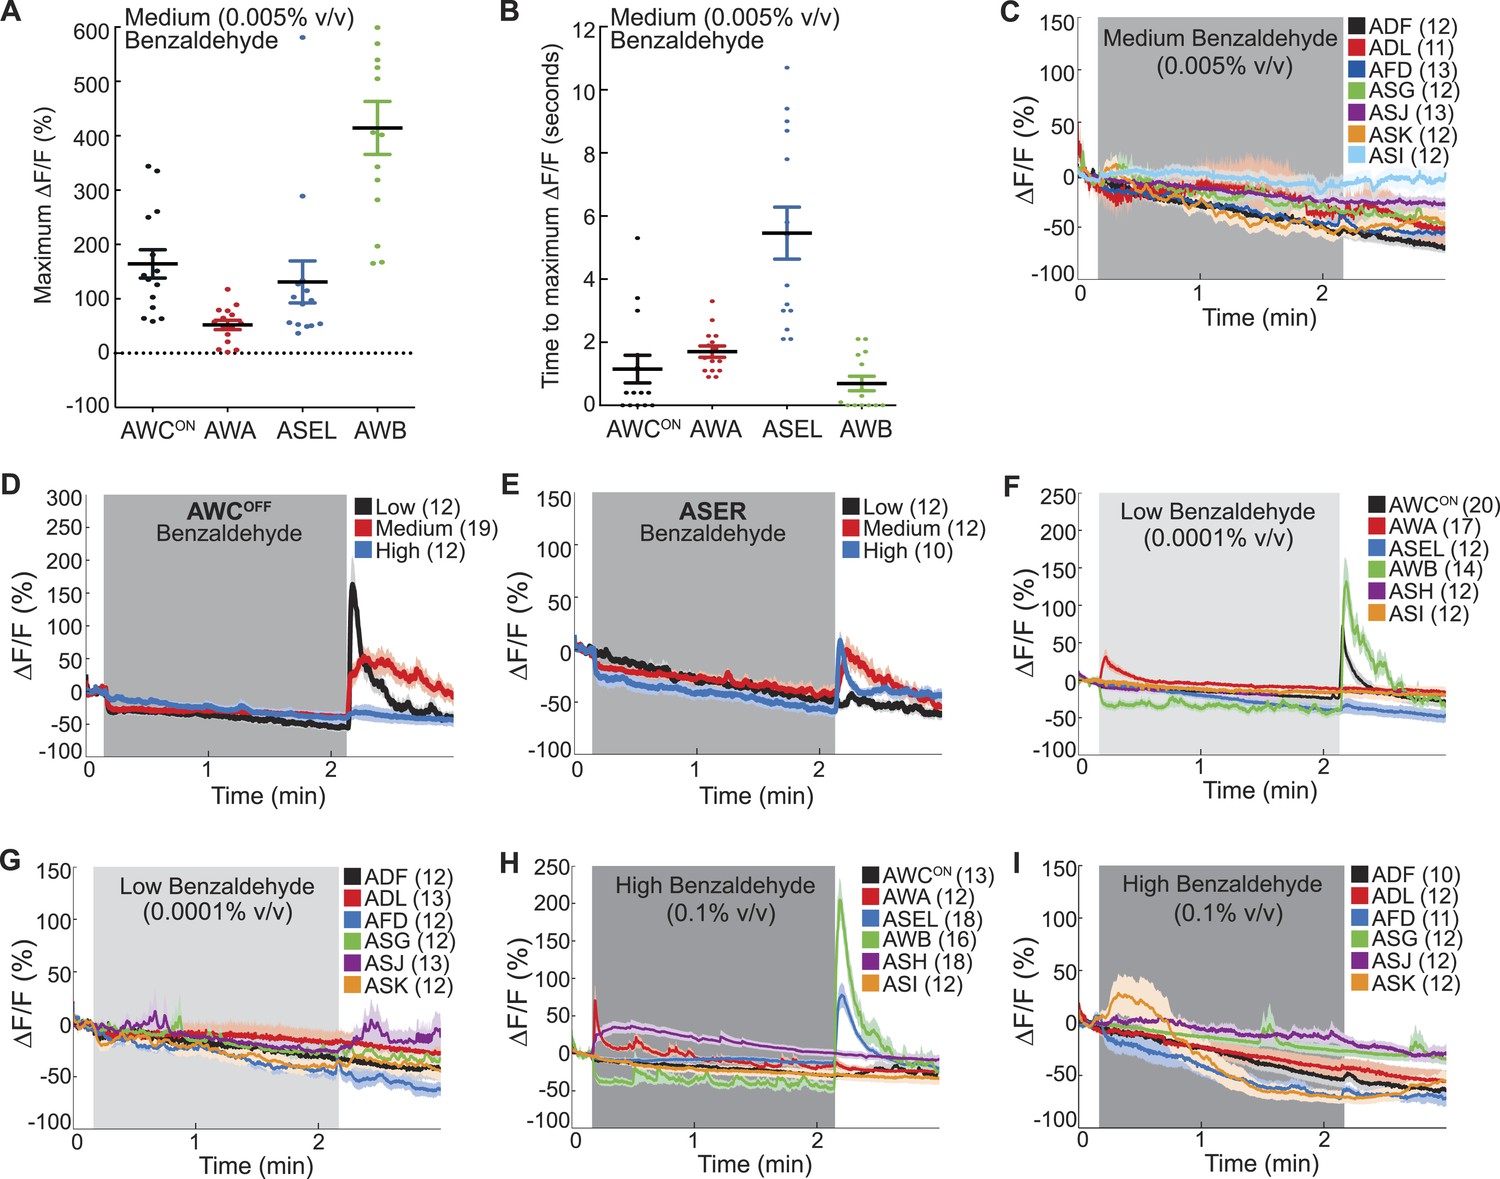
Combinatorial olfactory coding in C. elegans.
(A) Maximum ΔF/F of each individual wild-type animal's AWCON, AWA, ASEL or AWB neuron response to medium BZ. (B) Quantification of the time to maximum ΔF/F following stimulus change for each wild-type AWCON, AWA, ASEL or AWB neuron response to medium BZ in seconds. (A, B) These graphs show additional quantification of the young adult odor response data presented in Figure 1B. Horizontal lines show mean and error bars represent s.e.m. (C) Average calcium responses of young adult, wild-type amphid sensory neurons to medium concentration BZ stimulus. (D, E) Average GCaMP fluorescence change in young adult, wild-type (D) AWCOFF or (E) ASE right (ASER) sensory neurons in response to low, medium or high concentration BZ stimulus. (F–I) Average calcium responses of wild-type amphid sensory neurons to (F, G) low and (H, I) high concentration BZ stimulus. (C–I) Shaded box represents two minute BZ stimulation (low 0.0001% vol/vol, medium 0.005% vol/vol and high 0.1% vol/vol) beginning at t = 10 s. Light shading around curves indicates s.e.m. and numbers in parentheses indicate number of neurons imaged. See Figure 1—source data 2 for raw data.
Figure 2
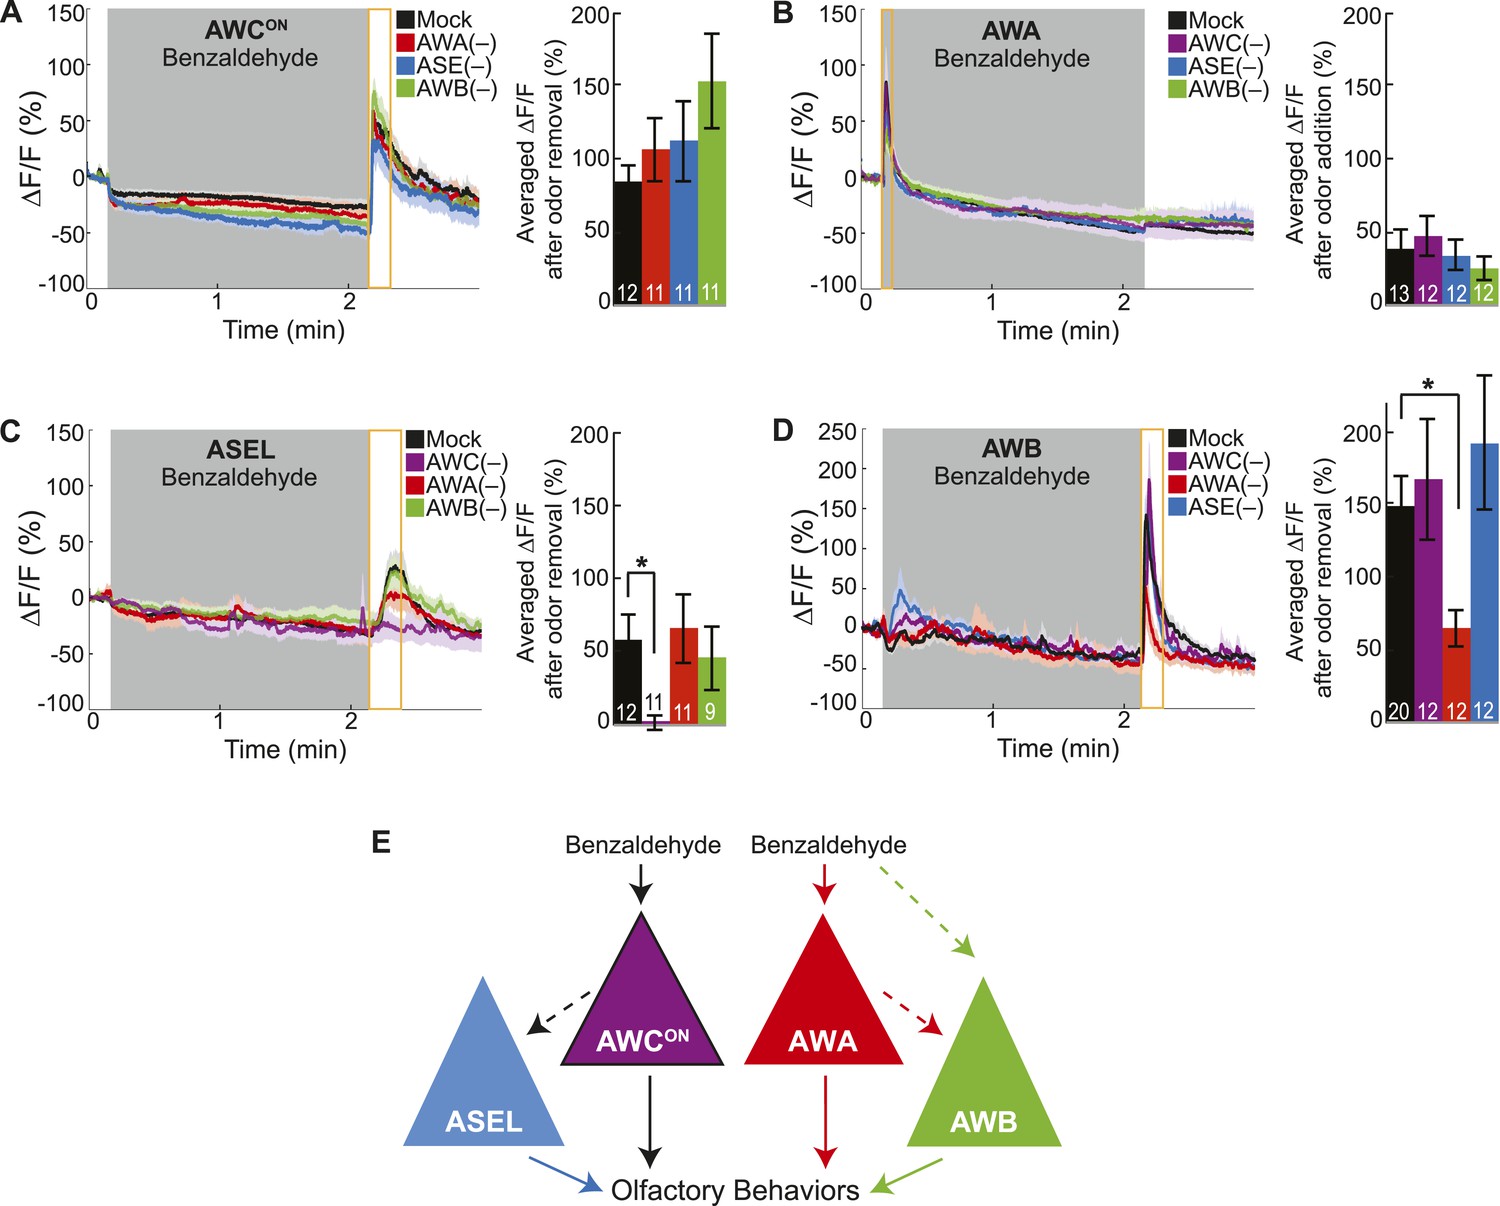
Cell ablation reveals primary and secondary BZ sensory neurons.
(A) Average young adult AWCON neuron responses to medium BZ in control (Ctrl) mock-ablated animals compared to animals with the AWA, ASE or AWB sensory neurons ablated (neurons ablated at an early larval stage). (B) Average young adult AWA neuron responses to BZ in Ctrl mock-ablated animals compared to animals with AWC, ASE or AWB sensory neurons ablated. (C) Average young adult ASEL neuron responses to BZ in Ctrl mock-ablated animals compared to animals with AWC, AWA or AWB sensory neurons ablated. (D) Average young adult AWB neuron responses to BZ in Ctrl mock-ablated animals compared to animals with AWC, AWA or ASE sensory neurons ablated. (A–D) Shaded box represents two minute medium BZ (0.005% vol/vol) stimulation beginning at t = 10 s. Yellow box indicates the time period after stimulus change for which the fluorescence change was averaged in the bar graphs (See Figure 2—source data 1 for raw data.). Light shading around curves and bar graph error bars indicate s.e.m. Numbers on bars indicate number of neurons imaged. *p < 0.05, two-tailed t-test with Bonferroni correction, compared to mock-ablation. (E) Schematic of the BZ circuit depicting the primary, direct BZ sensory neurons and the secondary, indirect BZ sensory neurons whose odor responses are reduced by cell ablation.
-
Figure 2—source data 1
Odor responses in cell ablated animal data.
- https://doi.org/10.7554/eLife.10181.008
Figure 3 with 1 supplement
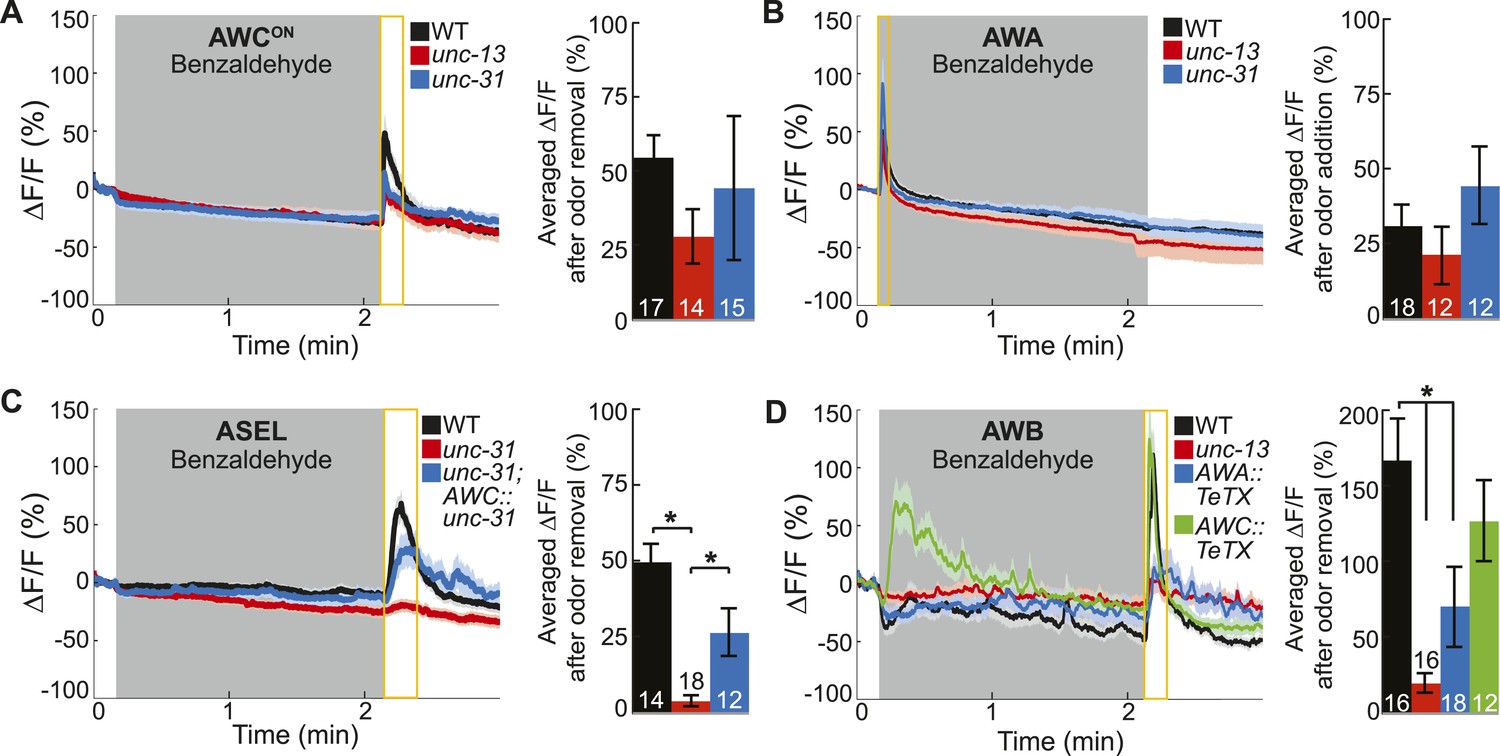
Primary olfactory neurons release neuropeptides and classical neurotransmitters to recruit secondary neurons into the BZ circuit.
(A, B) Average young adult (A) AWCON and (B) AWA neuron calcium responses to BZ in wild-type, unc-13 mutants with impaired synaptic vesicle release, and unc-31 mutants with impaired dense core vesicle release. (C) ASEL responses to BZ in unc-31 mutants and unc-31; AWC-specific unc-31 rescue. (D) AWB responses to BZ in unc-13 mutants and animals with AWA- or AWC-specific expression of tetanus toxin. (A–D) Shaded box indicates two-minute medium BZ (0.005% vol/vol) odor stimulation. Yellow box indicates the time period after stimulus change for which the fluorescence change was averaged in the bar graphs (See Figure 3—source data 1 for raw data). The light color shading around curves and bar graph error bars indicate s.e.m. Numbers on bars indicate number of neurons imaged. *p < 0.05, two-tailed t-test with Bonferroni correction, compared to wild-type or mutant as indicated.
-
Figure 3—source data 1
Odor responses in neurotransmitter release pathway genetic mutant data.
- https://doi.org/10.7554/eLife.10181.010
-
Figure 3—source data 2
Odor responses in genetic mutant data.
- https://doi.org/10.7554/eLife.10181.011
Figure 3—figure supplement 1
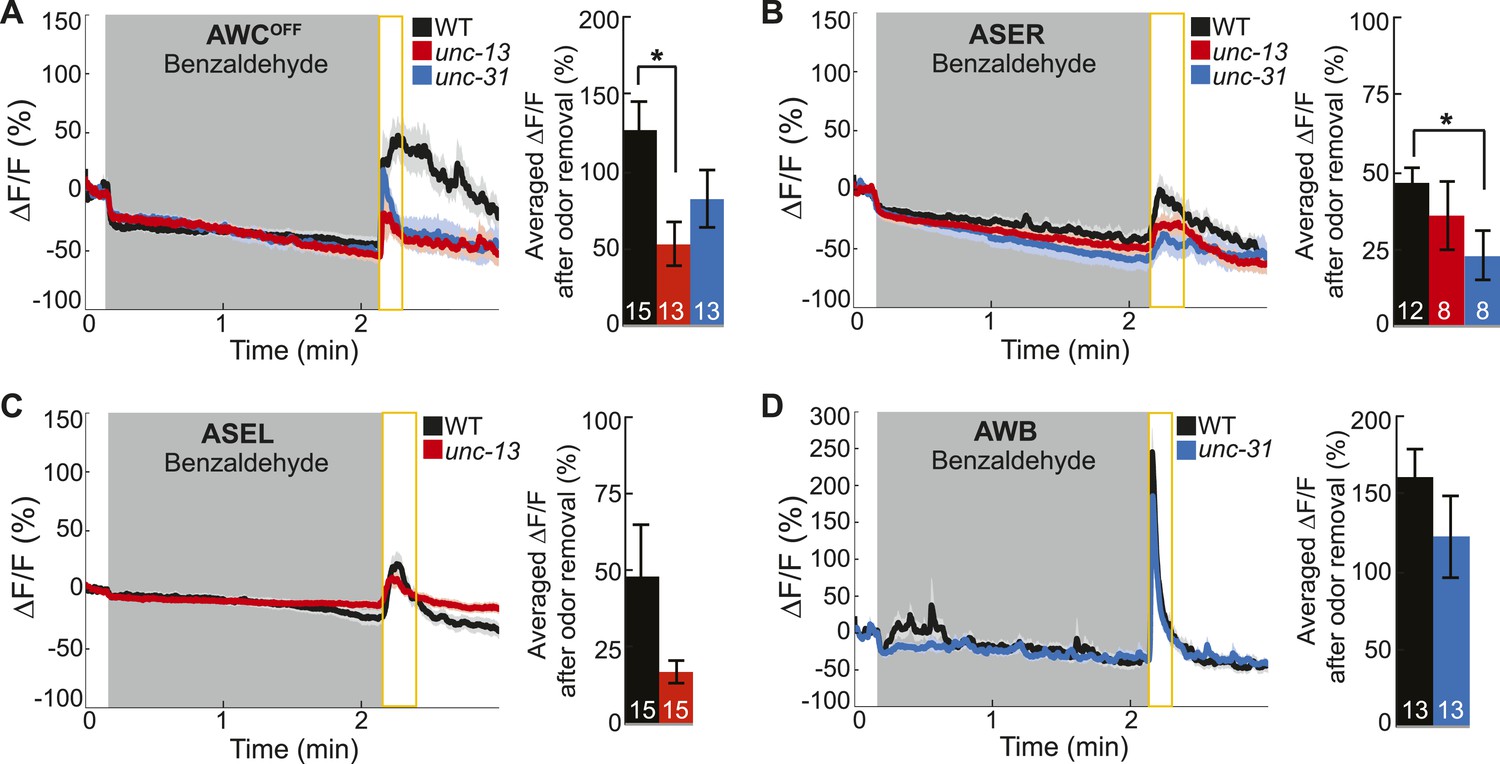
Primary and secondary olfactory neurons respond to BZ.
(A-D) Average calcium responses of young adult (A) AWCOFF, (B) ASER, (C) ASEL and (D) AWB neurons in wild-type, unc-13 mutants with impaired synaptic vesicle release, and unc-31 mutants with impaired dense core vesicle release to BZ stimulation. (A–D) Shaded box indicates two-minute medium BZ (0.005% vol/vol) odor stimulation. Yellow box indicates the time period after stimulus change for which the fluorescence change was averaged in the bar graphs(see Figure 3—source data 2 for raw data). Numbers on bar graphs indicate number of neurons imaged. Light color shading around curves and bar graph error bars indicate s.e.m. *p < 0.05, two-tailed t-test with Bonferroni correction, compared to wild-type.
Figure 4 with 1 supplement
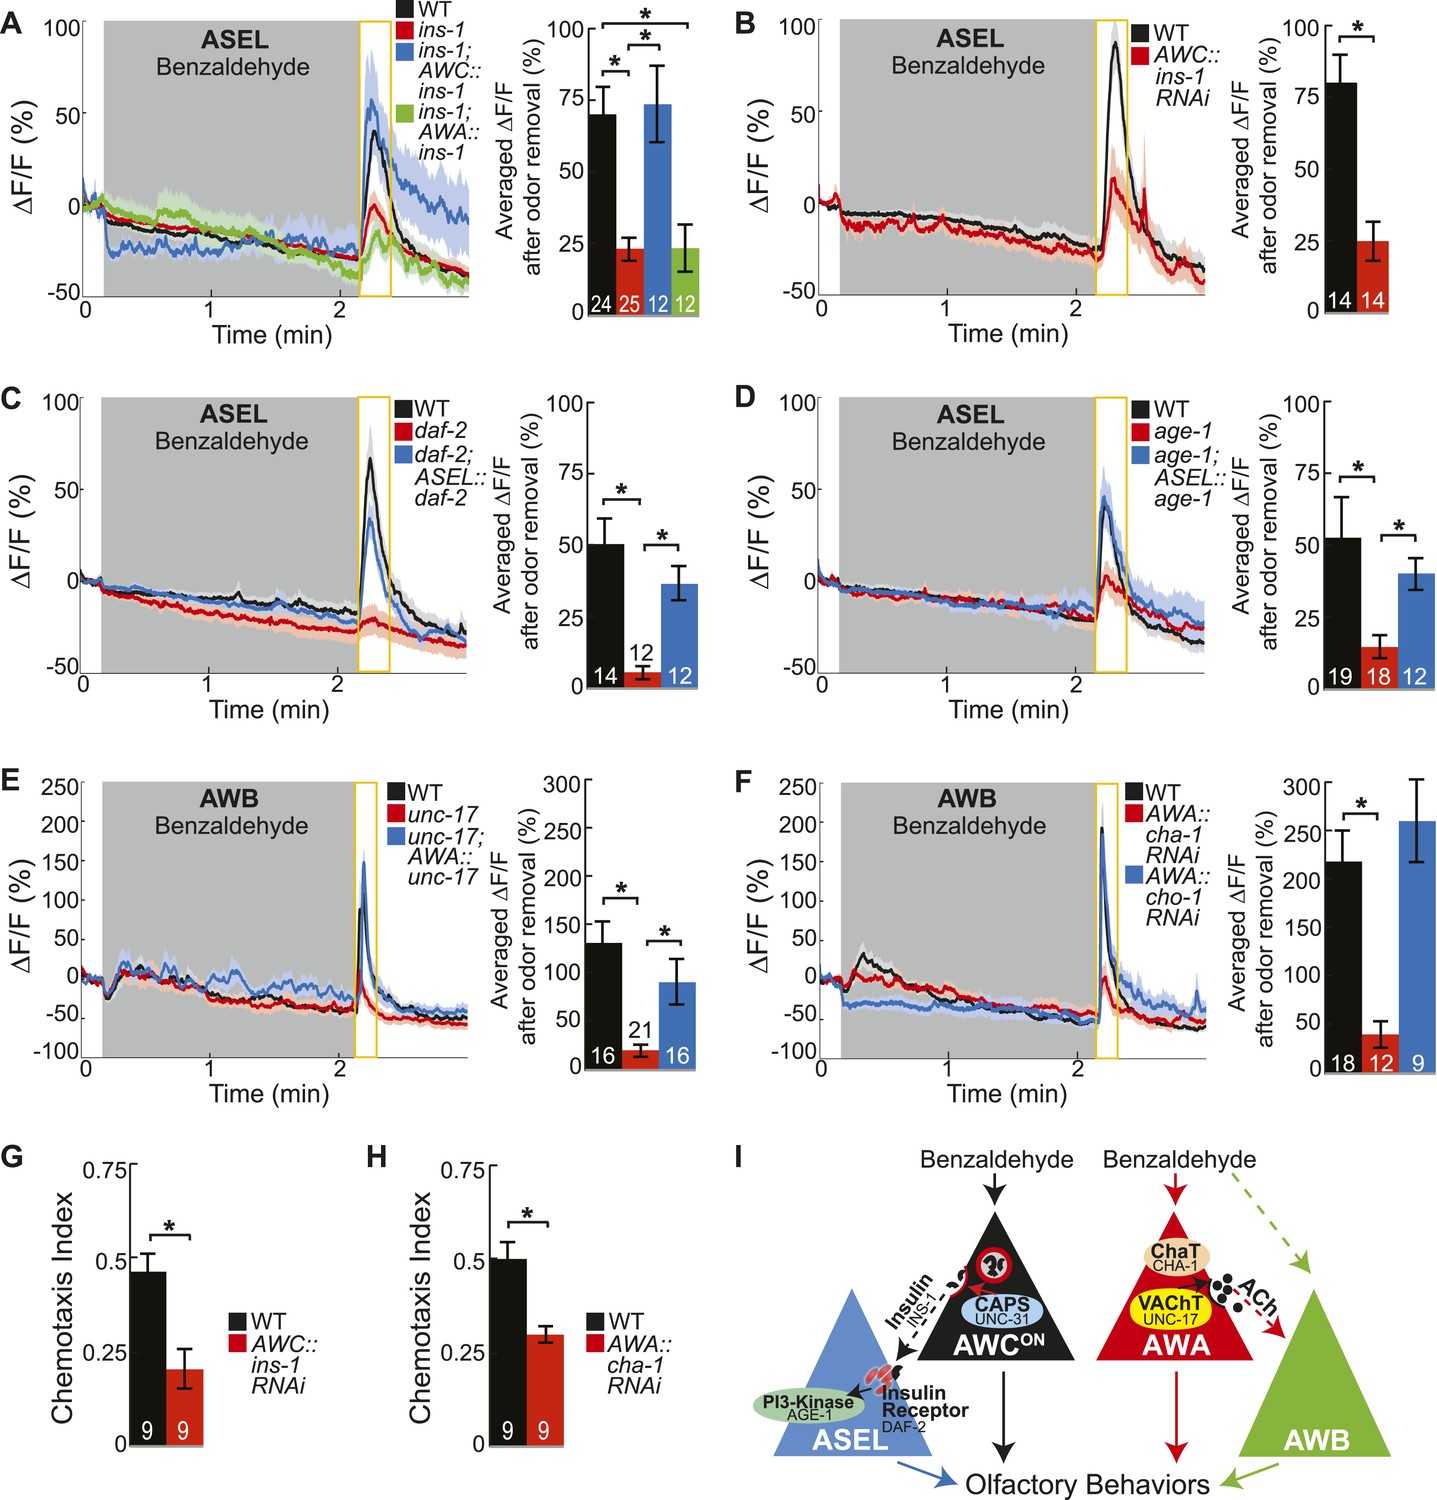
Insulin peptidergic and cholinergic transmission from the two primary olfactory sensory neurons recruits two secondary olfactory neurons.
(A) BZ-evoked activity in young adult ASEL neurons in wild-type, ins-1 insulin-like peptide mutants, ins-1; AWC-specific ins-1 rescue and ins-1; AWA-specific ins-1 rescue. (B) Average ASEL responses to BZ in young adult wild-type and AWC neuron-specific ins-1 RNAi knockdown animals. (C,D) BZ-evoked activity in young adult ASEL neurons in (C) daf-2 insulin receptor mutants and daf-2; ASEL-specific daf-2 rescue, and (D) age-1 PI3-Kinase mutants and age-1; ASEL-specific age-1 rescue compared to wild-type. (E) AWB neuronal activity in response to BZ in young adult wild-type, unc-17 vesicular acetylcholine transporter mutants and unc-17; AWA-specific unc-17 rescue. (F) AWB neuronal activity in response to BZ in young adult wild-type, AWA neuron-specific cha-1 choline acetyltransferase RNAi and AWA-specific cho-1 choline transporter RNAi knockdown transgenic animals. (G,H) Young adult chemotaxis performance of wild-type and (G) AWC neuron-specific ins-1 RNAi knockdown or (H) AWA neuron-specific cha-1 RNAi knockdown animals to a medium concentration point source of BZ odor. Numbers on bars indicate number of assay plates and error bars indicate s.e.m. *p < 0.05, two-tailed t-test. (I) Proposed young adult BZ circuit model. (A-F) Shaded box indicates medium BZ (0.005% vol/vol) odor stimulation. Yellow box indicates the time period after stimulus change for which the fluorescence change was averaged in the bar graphs. Numbers on bar graphs indicate number of neurons imaged. Light color shading around curves and bar graph error bars indicate s.e.m. *p < 0.05, two-tailed t-test with Bonferroni correction, compared to wild-type or mutant as indicated. See also Figure 4—source data 1 for raw data.
-
Figure 4—source data 1
Odor responses and chemotaxis performance in insulin and acetycholine pathway mutant and transgenic data.
- https://doi.org/10.7554/eLife.10181.014
-
Figure 4—source data 2
Additional odor responses in insulin and acetycholine pathway mutant and transgenic data.
- https://doi.org/10.7554/eLife.10181.015
Figure 4—figure supplement 1
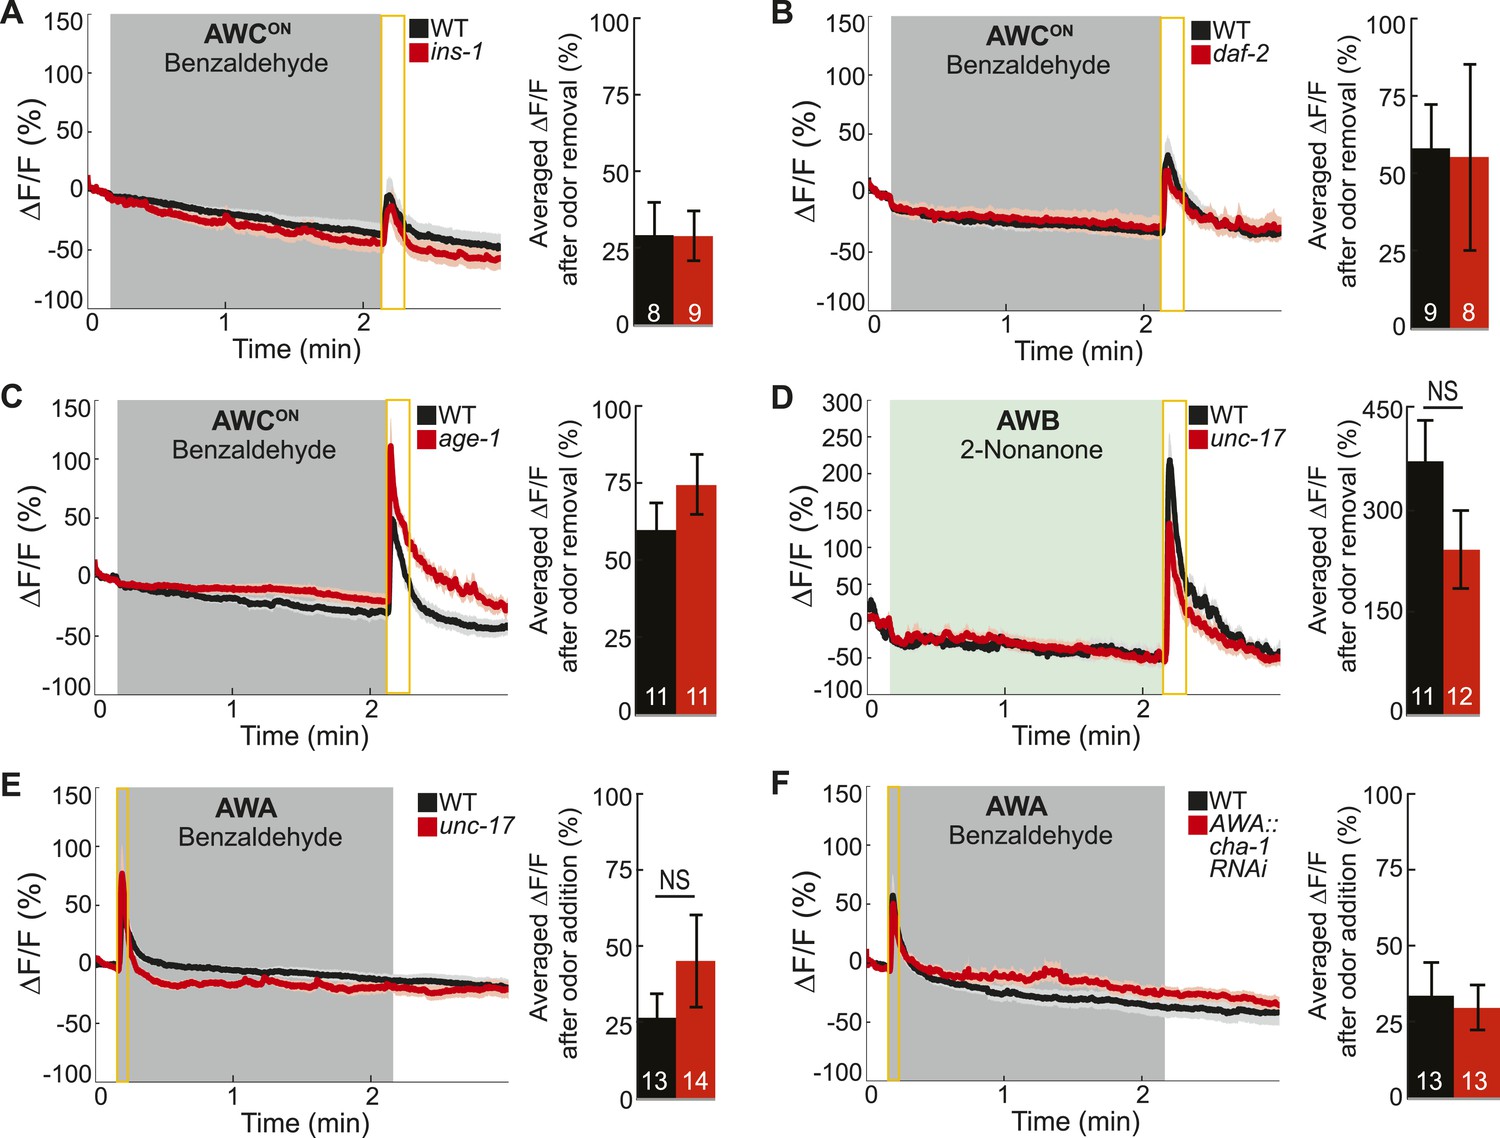
Odor-evoked calcium dynamics in genetic mutants.
(A–C) Young adult AWCON neuron average responses to BZ stimulation in wild-type animals compared to (A) insulin-like peptide ins-1 mutants, (B) daf-2 insulin receptor mutants and (C) age-1 PI3-Kinase mutants. (D) Average AWB calcium responses to 2-nonanone in wild-type and unc-17 vesicular acetylcholine transporter mutants. (E) Average young adult AWA neuron responses to BZ in wild-type and unc-17 vesicular acetylcholine transporter mutants. (F) Average AWA neuron responses to BZ in wild-type and AWA neuron-specific cha-1 choline acetyltransferase RNAi knockdown animals. (A–F) Data presented as described for Figure 4. NS, p > 0.05, two-tailed t-test. See Figure 4—source data 2 for raw data.
Figure 5 with 5 supplements
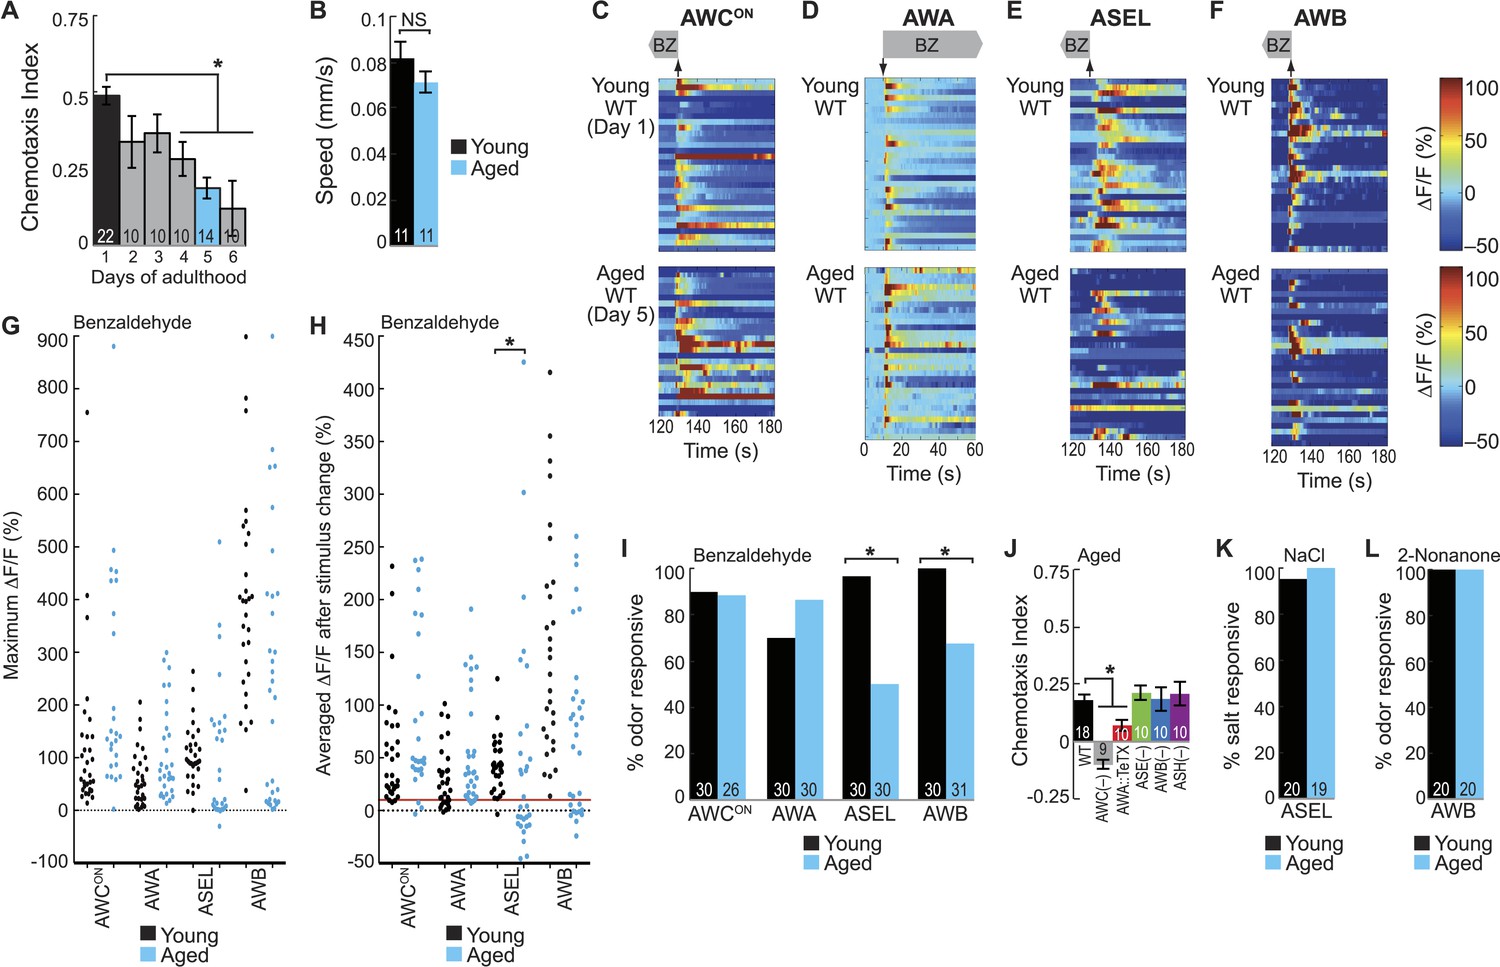
BZ-evoked secondary neuron activity and behavior specifically degrade with age.
(A) Chemotaxis performance of wild-type worms from young adulthood (day 1) through early stage aging (day 6) towards a point source of medium BZ. (B) Speed of wild-type young (day 1) and aged (day 5) adult animals chemotaxing towards a point source of BZ odor. (C–F) Heat maps of ratio change in fluorescence to total fluorescence for wild-type young adult (day 1) and aged adult (day 5) sensory neuron responses to the addition (at t = 10 s) or removal (at t = 130 s) of a two-minute medium BZ stimulus (0.005% vol/vol), as indicated by shaded box and arrows. One row represents activity from one neuron. (G) Maximum ΔF/F for each individual young (black dots) or aged (blue dots) wild-type animal shown in C–F. (H) Averaged ΔF/F after odor addition (for AWA) or odor removal (for all other neurons) for each individual young (black dots) or aged (blue dots) wild-type animal shown in C–F. The red line represents a ΔF/F of 10%, the cutoff used to classify neurons as odor responsive or non-responsive. *p < 0.05, two-tailed t-test comparing young and aged responses; statistical analysis performed only on odor responsive subset of data. (I) Quantification of the percent of odor responsive neurons shown in H. (J) Aged (day 5) adult BZ chemotaxis performance of wild-type, AWC or AWB or ASH neuron-specific genetic ablation, AWA neuron-specific tetanus toxin expression worms or che-1 mutants missing ASE neurons. (K, L) The percent of wild-type young (day 1) and aged (day 5) adult (K) ASEL neurons responsive to sodium chloride and (L) AWB neurons responsive to 2-nonanone odor. (I, K, L) Odor or salt responsive defined as having a ΔF/F to stimulus greater than 10%. Numbers on bars indicate number of neurons imaged. *p < 0.05, two-tailed Chi Square test. (A, B, J) Numbers on bars indicate number of assay plates and error bars indicate s.e.m. *p < 0.05, two-tailed t-test with Bonferroni correction, compared to young adults or wild-type as indicated. See Figure 5—source data 1 for raw data.
-
Figure 5—source data 1
Age-related decay in odor responses and chemotaxis behavior data.
- https://doi.org/10.7554/eLife.10181.018
-
Figure 5—source data 2
Primary and secondary neuron activity in young and aged animal data.
- https://doi.org/10.7554/eLife.10181.019
-
Figure 5—source data 3
Correlated behavior and functional imaging in aged animal data.
- https://doi.org/10.7554/eLife.10181.020
-
Figure 5—source data 4
Dose-dependent odor response data.
- https://doi.org/10.7554/eLife.10181.021
-
Figure 5—source data 5
Salt and 2-nonanone responses in young and aged animal data.
- https://doi.org/10.7554/eLife.10181.022
-
Figure 5—source data 6
Longevity mutant odor response data.
- https://doi.org/10.7554/eLife.10181.023
Figure 5—figure supplement 1

Quantification of BZ-evoked primary and secondary neuron activity in young and aged animals.
(A) Measurement of the perimeter of day 5 aged worms and the more variable day 6 aged worms (see ‘Materials and methods’ section). Thick red line shows mean and error bars represent standard deviation (day 5: 2656.3 μm ± 112.07, day 6: 2950.5 μm ± 291.21, n = 55 animals for each age). (B) Quantification of the time to maximum ΔF/F following stimulus change for individual wild-type young (black dots) or aged (blue dots) neuron responses to medium BZ, in seconds, for the subset of odor responsive recordings only. Horizontal red lines show mean and error bars represent s.e.m. NS, p > 0.05, two-tailed t-test comparing young and aged response times. Graph shows additional quantification of the data presented in Figure 5C–F; see Figure 5—source data 2 for raw data.
Figure 5—figure supplement 2
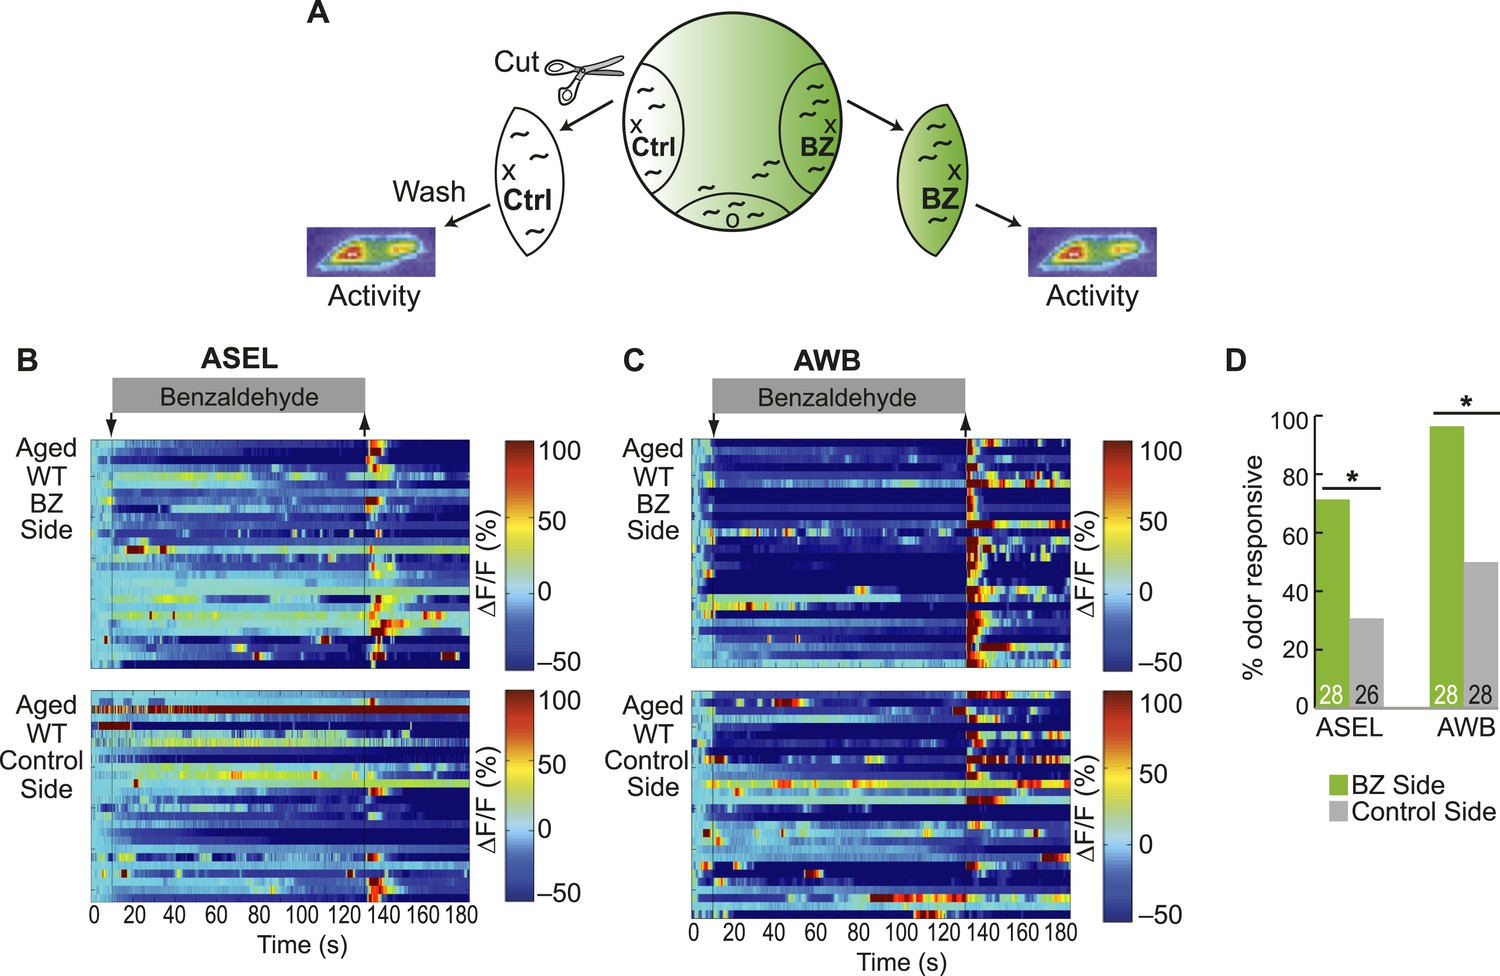
Olfactory behavior in aged animals is correlated with reliability of odor-evoked neuronal activity.
(A) Schematic of animals from a chemotaxis assay washed and sorted into two populations, based on success or failure in navigating up the BZ odor gradient, for calcium imaging. (B, C) Heat maps of ratio change in fluorescence to total fluorescence for BZ-evoked activity in wild-type (day 5) aged (B) ASEL and (C) AWB neurons in animals that did or did not successfully chemotax towards the BZ point source. Two-minute medium BZ (0.005% vol/vol) odor stimulation indicated by shaded box and arrows. One row represents activity from one neuron. (D) Quantification of the percent of BZ responsive neurons shown in B and C (see Figure 5—source data 3 for raw data). Numbers on bars represent number of neurons imaged and odor responsive is defined as having a ΔF/F to odor greater than 10%. *p < 0.05, two-tailed Chi Square test.
Figure 5—figure supplement 3
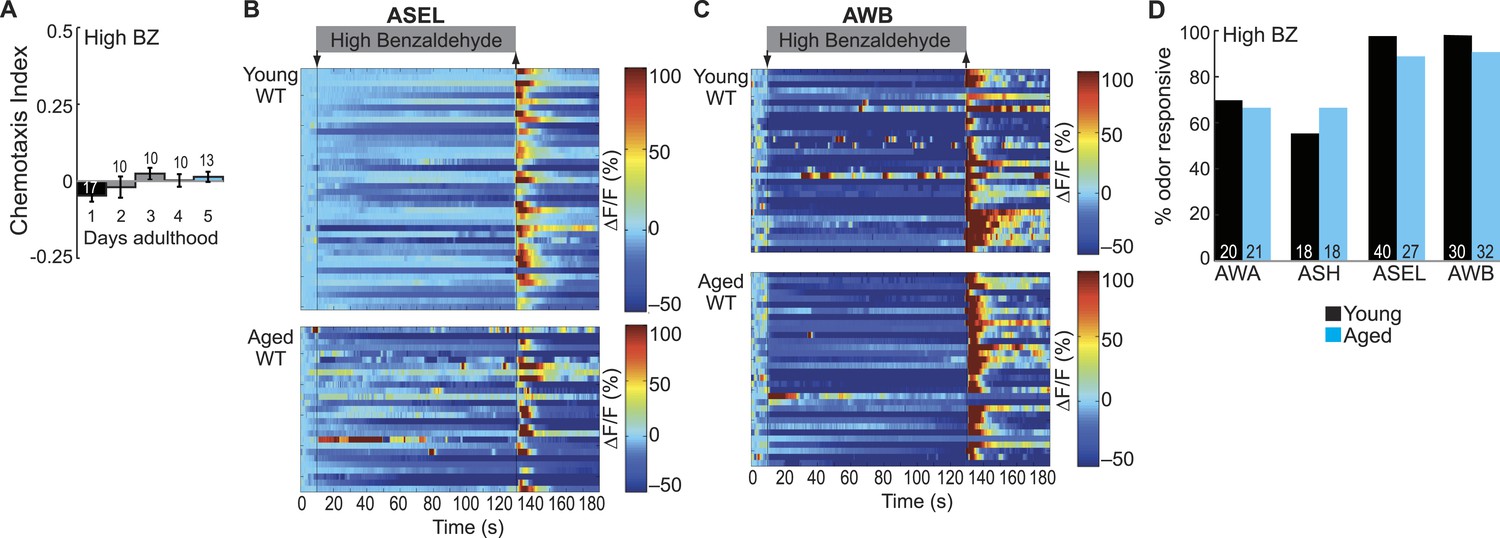
Dose-dependent odor-evoked calcium dynamics in young and aged adults.
(A) Chemotaxis performance of wild-type worms of different ages towards a point source of high concentration BZ. Numbers on bars represent number of assay plates and error bars indicate s.e.m. NS, p > 0.05, two-tailed t-test with Bonferroni correction, compared to young adults. (B, C) Heat maps of ratio change in fluorescence to total fluorescence for wild-type young adult (day 1) and aged adult (day 5) (B) ASEL and (C) AWB sensory neuron responses to high concentration BZ (0.1% vol/vol) stimulation. One row represents activity from one neuron. (D) Quantification of the percent of high concentration BZ responsive neurons. Numbers on bars represent number of neurons imaged and odor responsive is defined as having a ΔF/F to odor greater than 10%. NS, p > 0.05, two-tailed Chi Square test. See Figure 5—source data 4 for raw data.
Figure 5—figure supplement 4
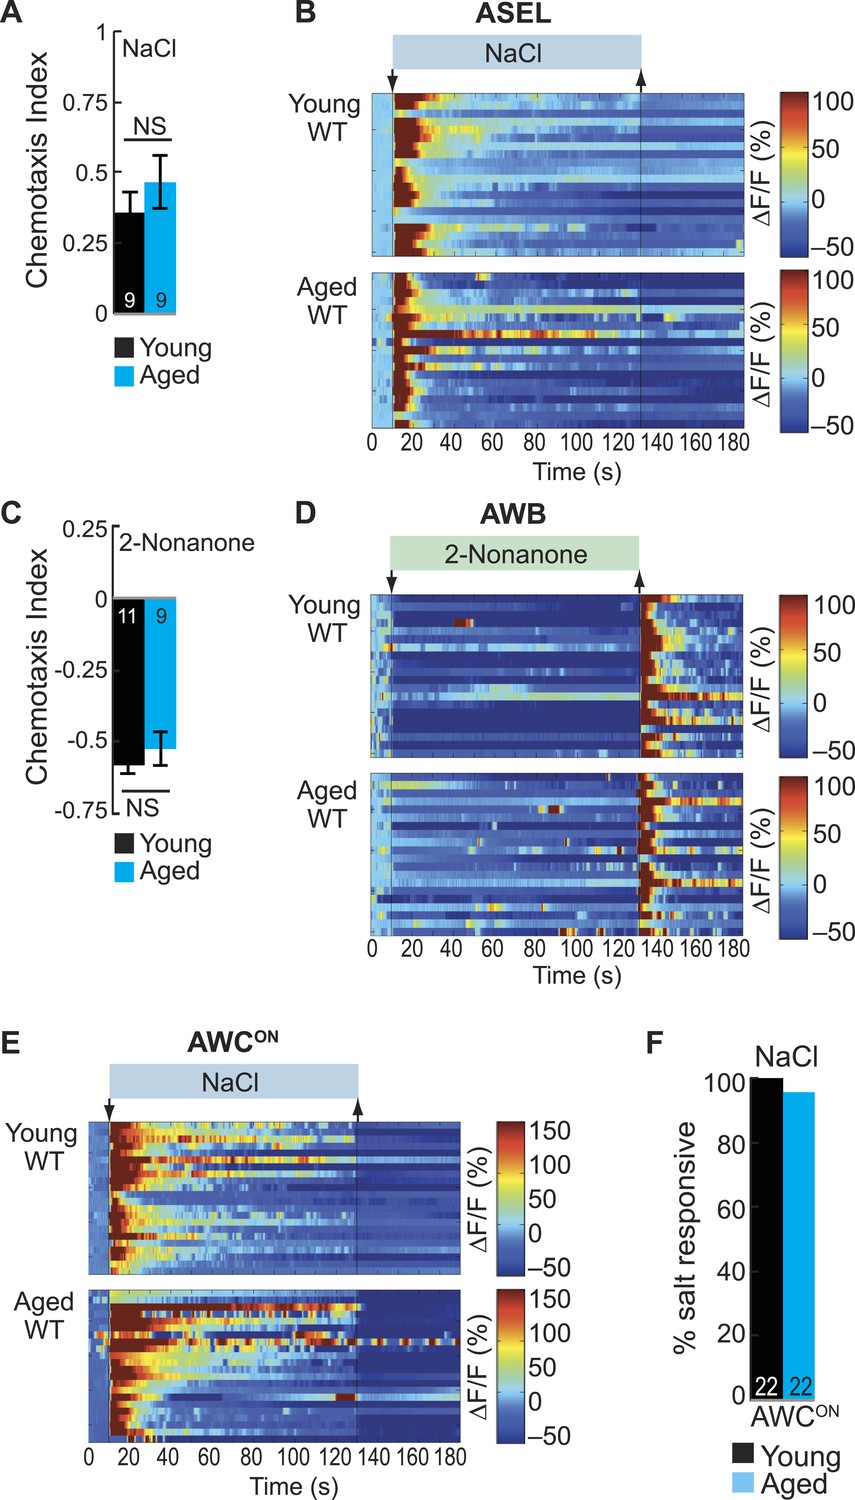
ASE and AWB primary responses to salt and 2-nonanone, respectively, remain reliable with aging.
(A) Chemotaxis performance of wild-type young (day 1) and aged (day 5) adults towards a point source of 500 mM NaCl. NS p > 0.05, two-tailed t-test. (B) Heat maps of ratio change in fluorescence to total fluorescence for wild-type young adult (day 1) and aged adult (day 5) ASEL neurons to +50 mM NaCl stimulation. (C) Chemotaxis performance of wild-type young (day 1) and aged (day 5) adults towards a point source of repulsive 2-nonanone odor. (D) Heat maps of ratio change in fluorescence to total fluorescence for wild-type young and aged adult AWB neurons to 2-nonanone odor stimulation. (E) Heat maps of ratio change in fluorescence to total fluorescence for wild-type young adult (day 1) and aged adult (day 5) AWCON neurons to +50 mM NaCl stimulation. (F) Quantification of the percent of salt responsive neurons shown in E, with salt responsive defined as having a ΔF/F to +50 mM NaCl greater than 10%. (A–F) Data presentation and statistics are as in Figure 5—figure supplement 3; see Figure 5—source data 5 for raw data.
Figure 5—figure supplement 5
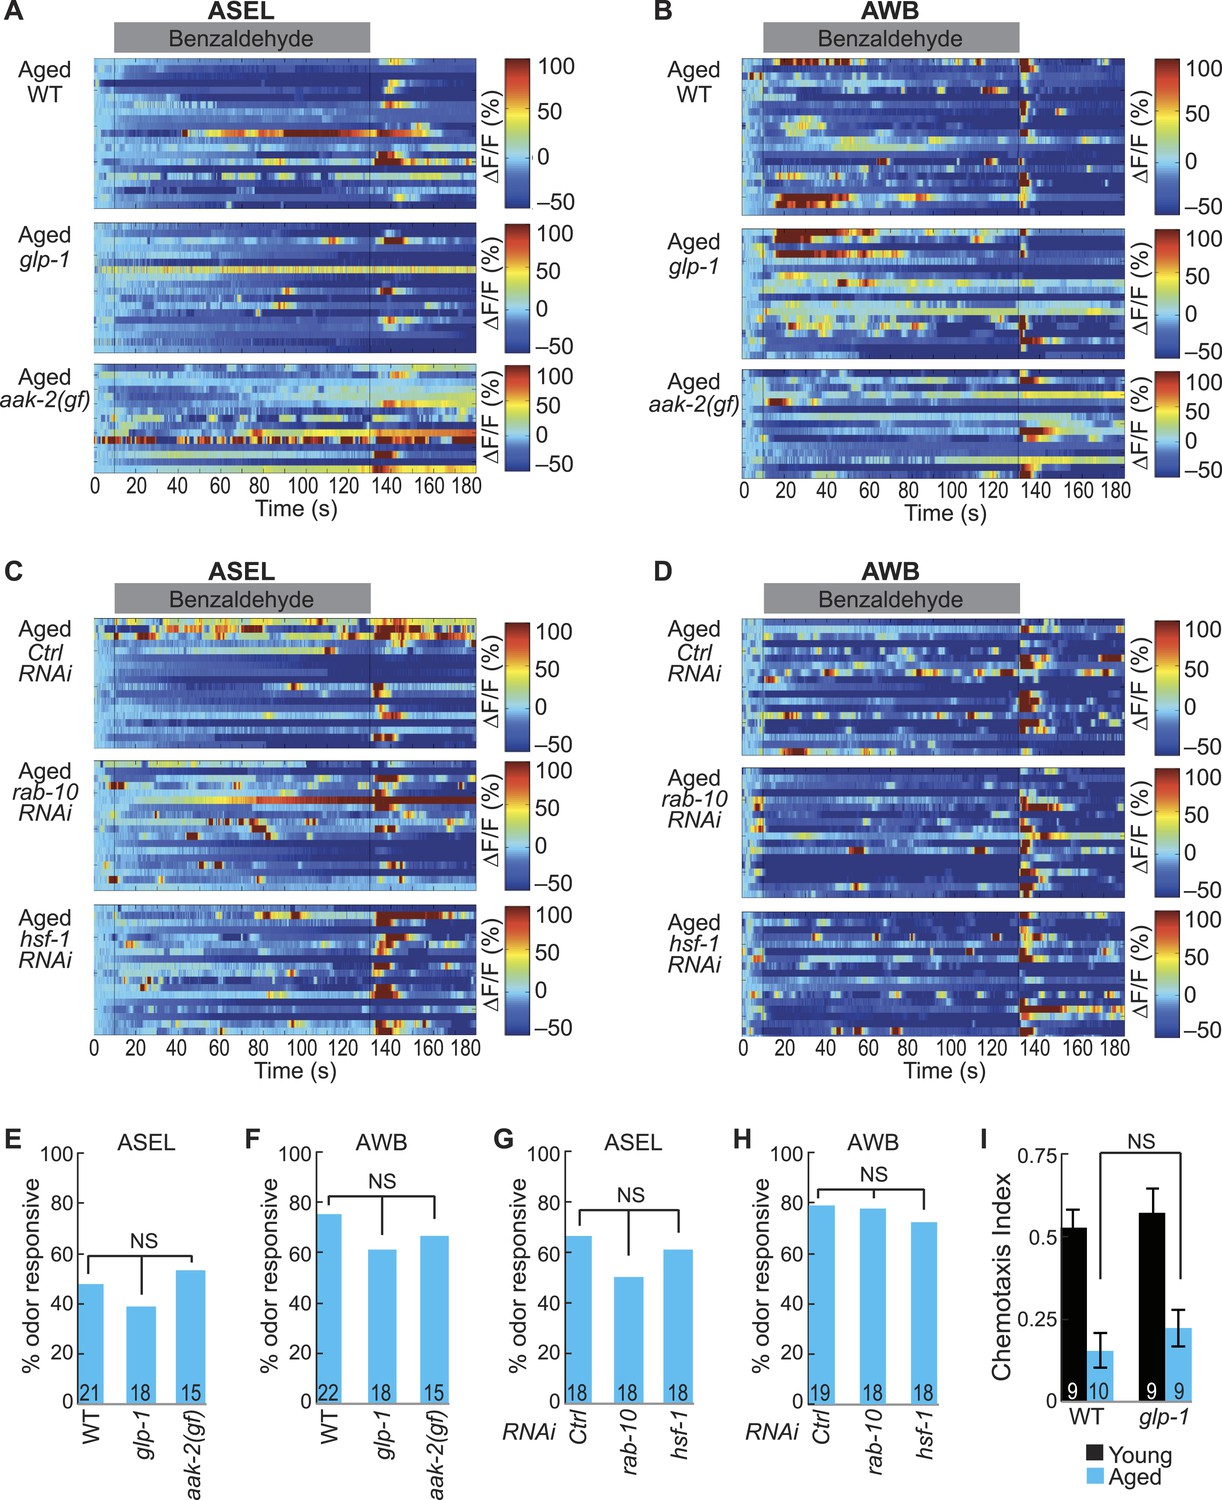
Long and short-lived mutants do not influence the aging-associated declines in neuronal function.
(A, B) Heat maps of ratio change in fluorescence to total fluorescence for aged adult (day 5) (A) ASEL and (B) AWB neurons stimulated with medium BZ (0.005% vol/vol) in wild-type, glp-1 mutants and aak-2 gain of function (gf) mutants. (C, D) Heat maps of ratio change in fluorescence to total fluorescence for aged adult (day 5) (C) ASEL and (D) AWB neurons stimulated with medium BZ (0.005% vol/vol) in Ctrl, rab-10, and hsf-1 RNAi treated animals. (E–H) Quantification of the percent of odor responsive neurons shown in A-D. NS, p > 0.05, two-tailed Chi Square test. (I) Chemotaxis performance of young and aged wild-type and glp-1 mutant animals towards a point source of medium BZ. Data presentation and statistics are as in Figure 5—figure supplement 3; see Figure 5—source data 6 for raw data.
Figure 6 with 1 supplement

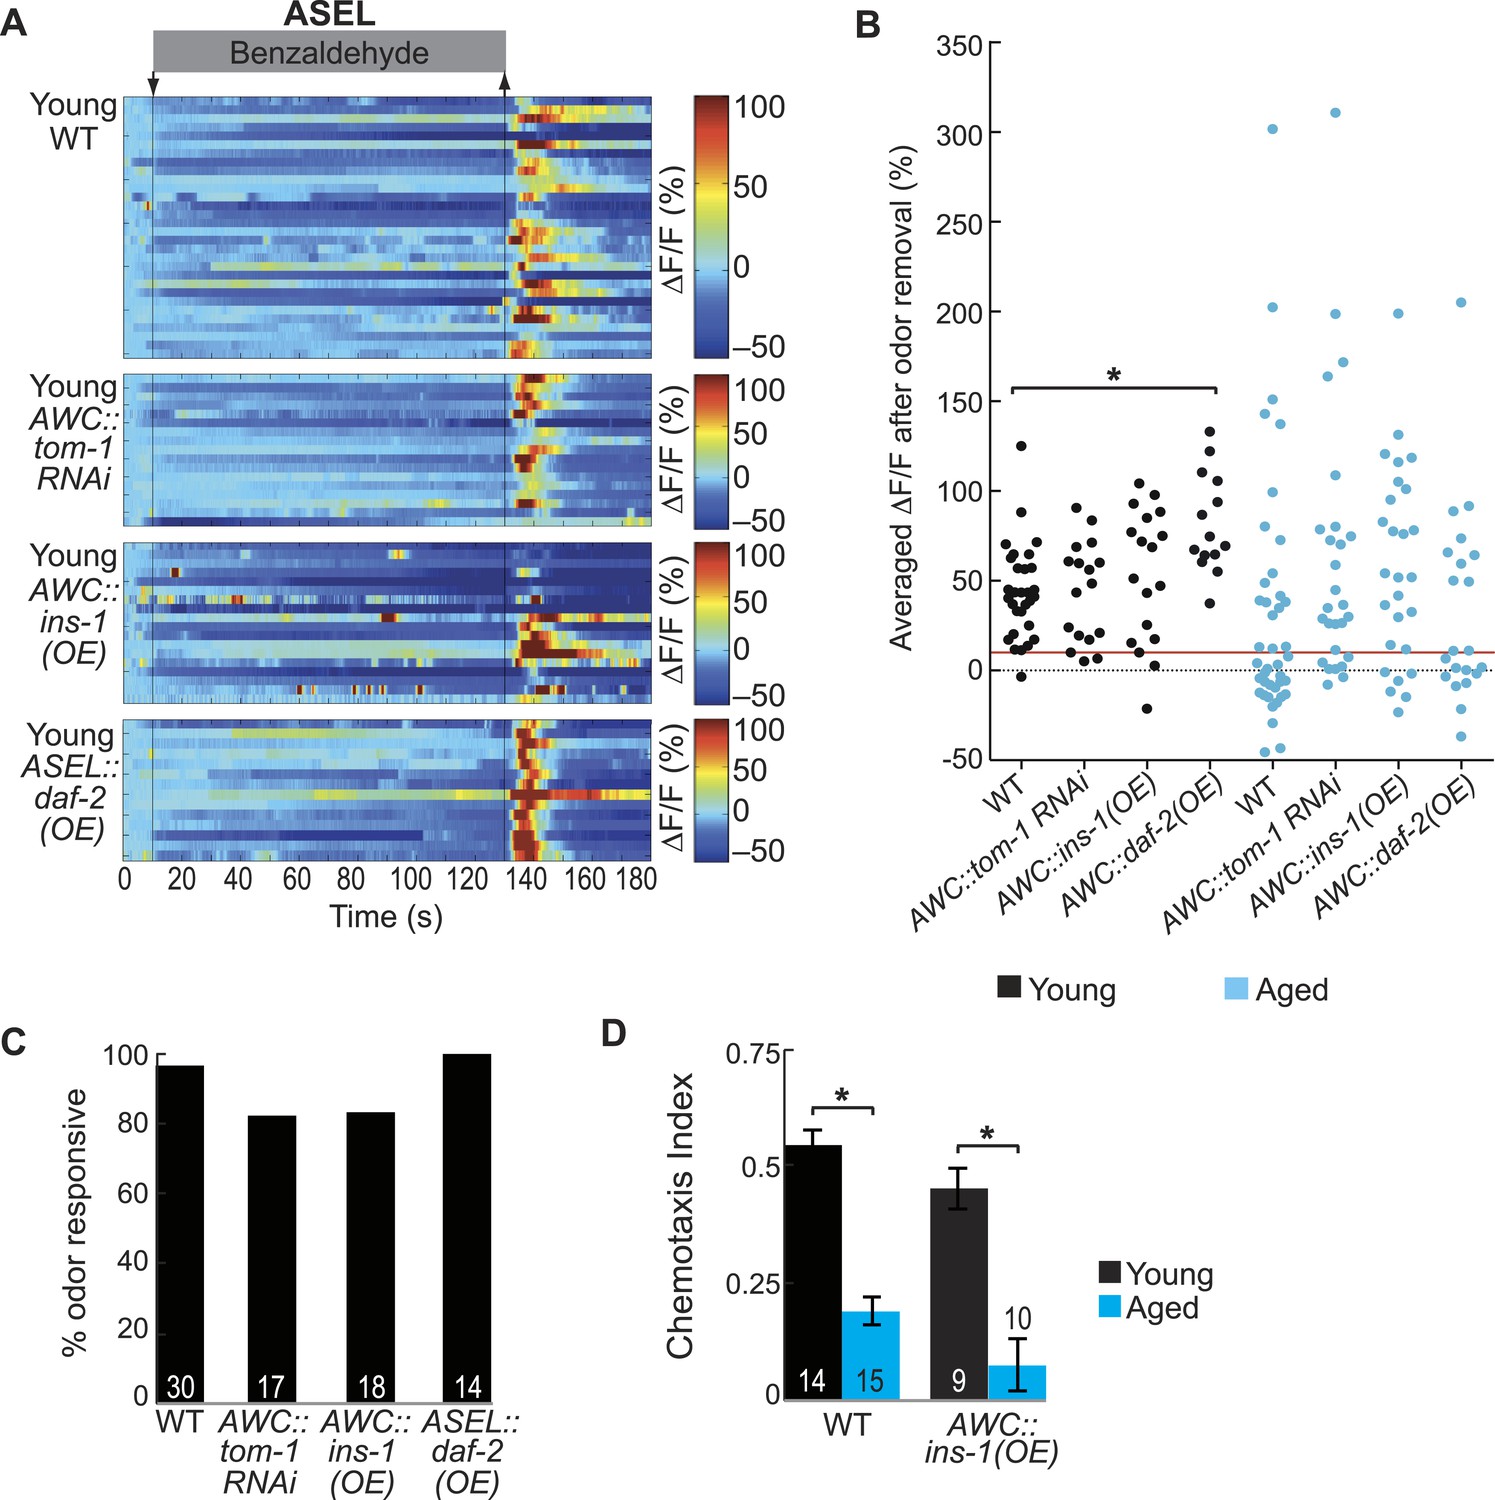
Increased neurotransmitter release from AWC neurons rescues aging-associated ASEL activity and behavioral deficits.
(A) Schematic representation of genetic manipulations to overcome aging-associated decay of neurotransmission. (B–E) Heat maps of ratio change in fluorescence to total fluorescence for aged adult (day 5) ASEL sensory neuron responses to the removal (at t = 130 s) of a two-minute medium BZ stimulus (0.005% vol/vol) in (B) wild-type, (C) ASEL-specific daf-2 overexpression (OE), (D) AWC-specific ins-1 OE and (E) AWC-specific tom-1 RNAi. (F) Quantification of the percent medium BZ responsive aged ASEL neurons in B–E. Odor responsive defined as having a ΔF/F to stimulus greater than 10%. Numbers on bars indicate number of neurons imaged. *p < 0.05, two-tailed Chi Square test. (G) BZ chemotaxis in young and aged wild-type, che-1 mutants lacking ASE neurons, AWC-specific tom-1 RNAi and AWC-specific tom-1 RNAi in the che-1 background. *p < 0.05, two-tailed t-test with Bonferroni correction. See Figure 6—source data 1 for raw data.
-
Figure 6—source data 1
Odor responses in AWC-released neurotransmitter manipulation animal data.
- https://doi.org/10.7554/eLife.10181.030
-
Figure 6—source data 2
Additional odor responses in AWC-released neurotransmitter manipulation animal data.
- https://doi.org/10.7554/eLife.10181.031
Figure 6—figure supplement 1
AWC-released neurotransmitters modify aging-associated neuronal activity and behavioral deficits.
(A) Heat maps of ratio change in fluorescence to total fluorescence for young adult (day 1) ASEL neuron responses to medium BZ (0.005% vol/vol) in wild-type animals and in transgenic animals with AWC-specific tom-1 RNAi, AWC-specific ins-1 peptide OE and ASEL-specific daf-2 insulin receptor OE. (B) Plot of the averaged ΔF/F in the 15 s following odor removal for each individual young (black dots) or aged (blue dots) wild-type, AWC-specific tom-1 RNAi, AWC-specific ins-1 OE or ASEL-specific daf-2 OE transgenic animal. The red line represents the 10% ΔF/F cutoff used to classify neurons as odor responsive or non-responsive. *p < 0.05, two-tailed t-test with Bonferroni correction comparing age-matched wild-type and transgenic animals; statistical analysis performed only on odor responsive subset of data. (C) Quantification of the percent of odor responsive neurons shown in A. (D) Chemotaxis behavior in young and aged wild-type and AWC-specific ins-1 OE animals, showing a trend towards dampened behavioral responses to medium BZ point sources in these transgenic animals. Numbers on bars indicate number of assay plates and error bars indicate s.e.m. NS, p > 0.05, two-tailed t-test. See Figure 6—source data 2 for raw data.
Figure 7 with 1 supplement

Increased release from AWA primary neurons rescues aging-associated AWB activity and behavioral deficits.
(A) Schematic representation of genetic and pharmacologic manipulations to overcome aging-associated decay of neurotransmission. (B–D) Heat maps of ratio change in fluorescence to total fluorescence for aged adult (day 5) AWB sensory neuron responses to the removal (at t = 130 s) of a two-minute medium BZ stimulus (0.005% vol/vol) in (B) wild-type, (C) AWA-specific unc-17 OE, and (D) animals treated acutely with the cholinergic agonist arecoline. (E) Quantification of the percent BZ responsive aged AWB neurons in B–D. Odor responsive defined as having a ΔF/F to stimulus greater than 10%. *p < 0.05, two-tailed Chi Square test. (F) Medium BZ chemotaxis in young and aged wild-type, AWB neuron ablated, AWA-specific unc-17 OE and AWB ablated in the AWA-specific unc-17 OE background. *p < 0.05, two-tailed t-test with Bonferroni correction. See Figure 7—source data 1 for raw data.
-
Figure 7—source data 1
Odor responses in AWA-released neurotransmitter manipulation animal data.
- https://doi.org/10.7554/eLife.10181.034
-
Figure 7—source data 2
Additional odor responses in AWA-released neurotransmitter manipulation animal data.
- https://doi.org/10.7554/eLife.10181.035
Figure 7—figure supplement 1
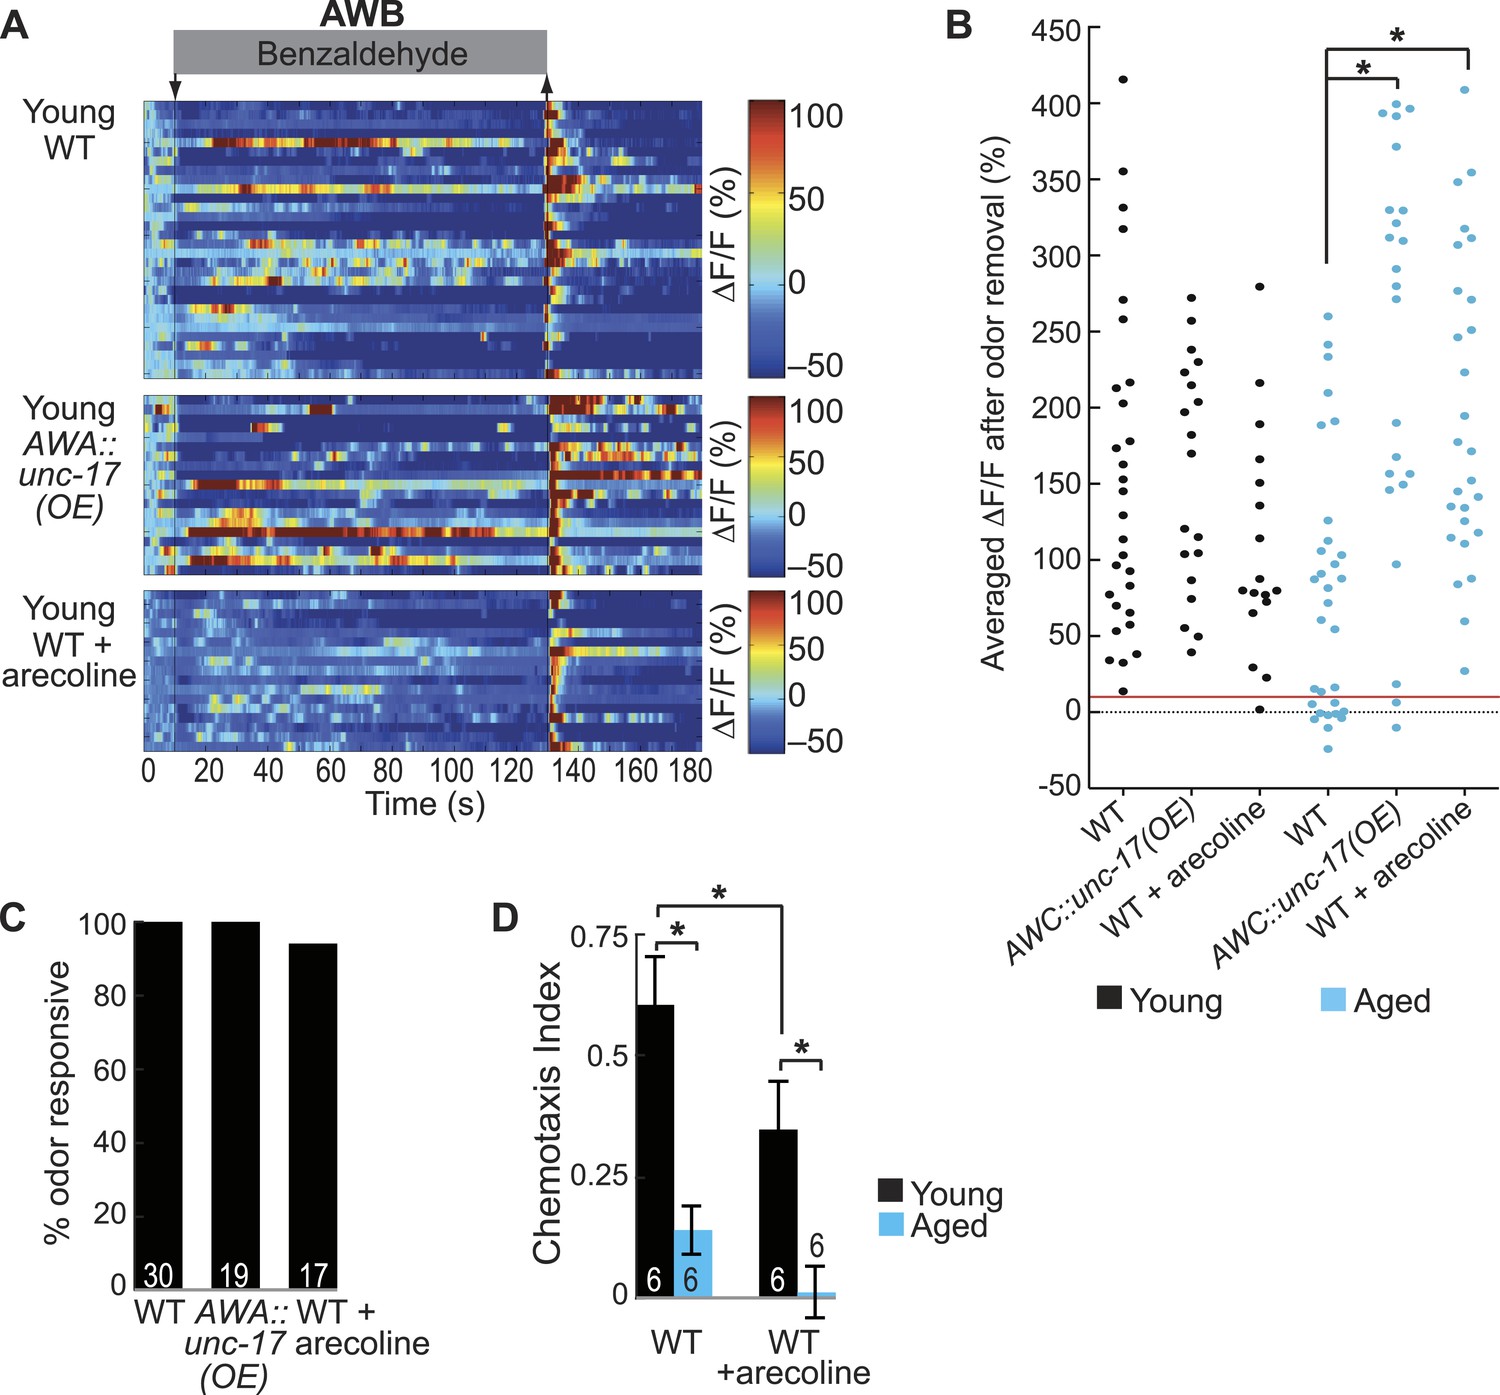
AWA neurotransmission modifies aging-associated neuronal activity and behavioral deficits.
(A) Heat maps of ratio change in fluorescence to total fluorescence for young (day 1) adult AWB neuron responses to medium BZ (0.005% vol/vol) in wild-type animals, transgenic animals with AWA-specific unc-17 OE and wild-type animals that received acute treatment with the cholinergic agonist arecoline. (B) Plot of the averaged ΔF/F in the 10 s after odor removal for each individual young (black dots) or aged (blue dots) wild-type, AWA-specific unc-17 OE or arecoline treated animal. The red line represents the 10% ΔF/F cutoff used to classify neurons as odor responsive or non-responsive. *p < 0.05, two-tailed t-test with Bonferroni correction comparing wild-type and age-matched transgenic or drug treated animals; statistical analysis performed only on odor responsive subset of data. (C) Quantification of the percent of odor responsive neurons shown in A. (D) Chemotaxis behavior in young and aged wild-type animals that did or did not receive acute arecoline treatment. Numbers on bars indicate number of assay plates and error bars indicate s.e.m. *p < 0.05, two-tailed t-test with Bonferroni correction. See Figure 7—source data 2 for raw data.
Figure 8 with 3 supplements
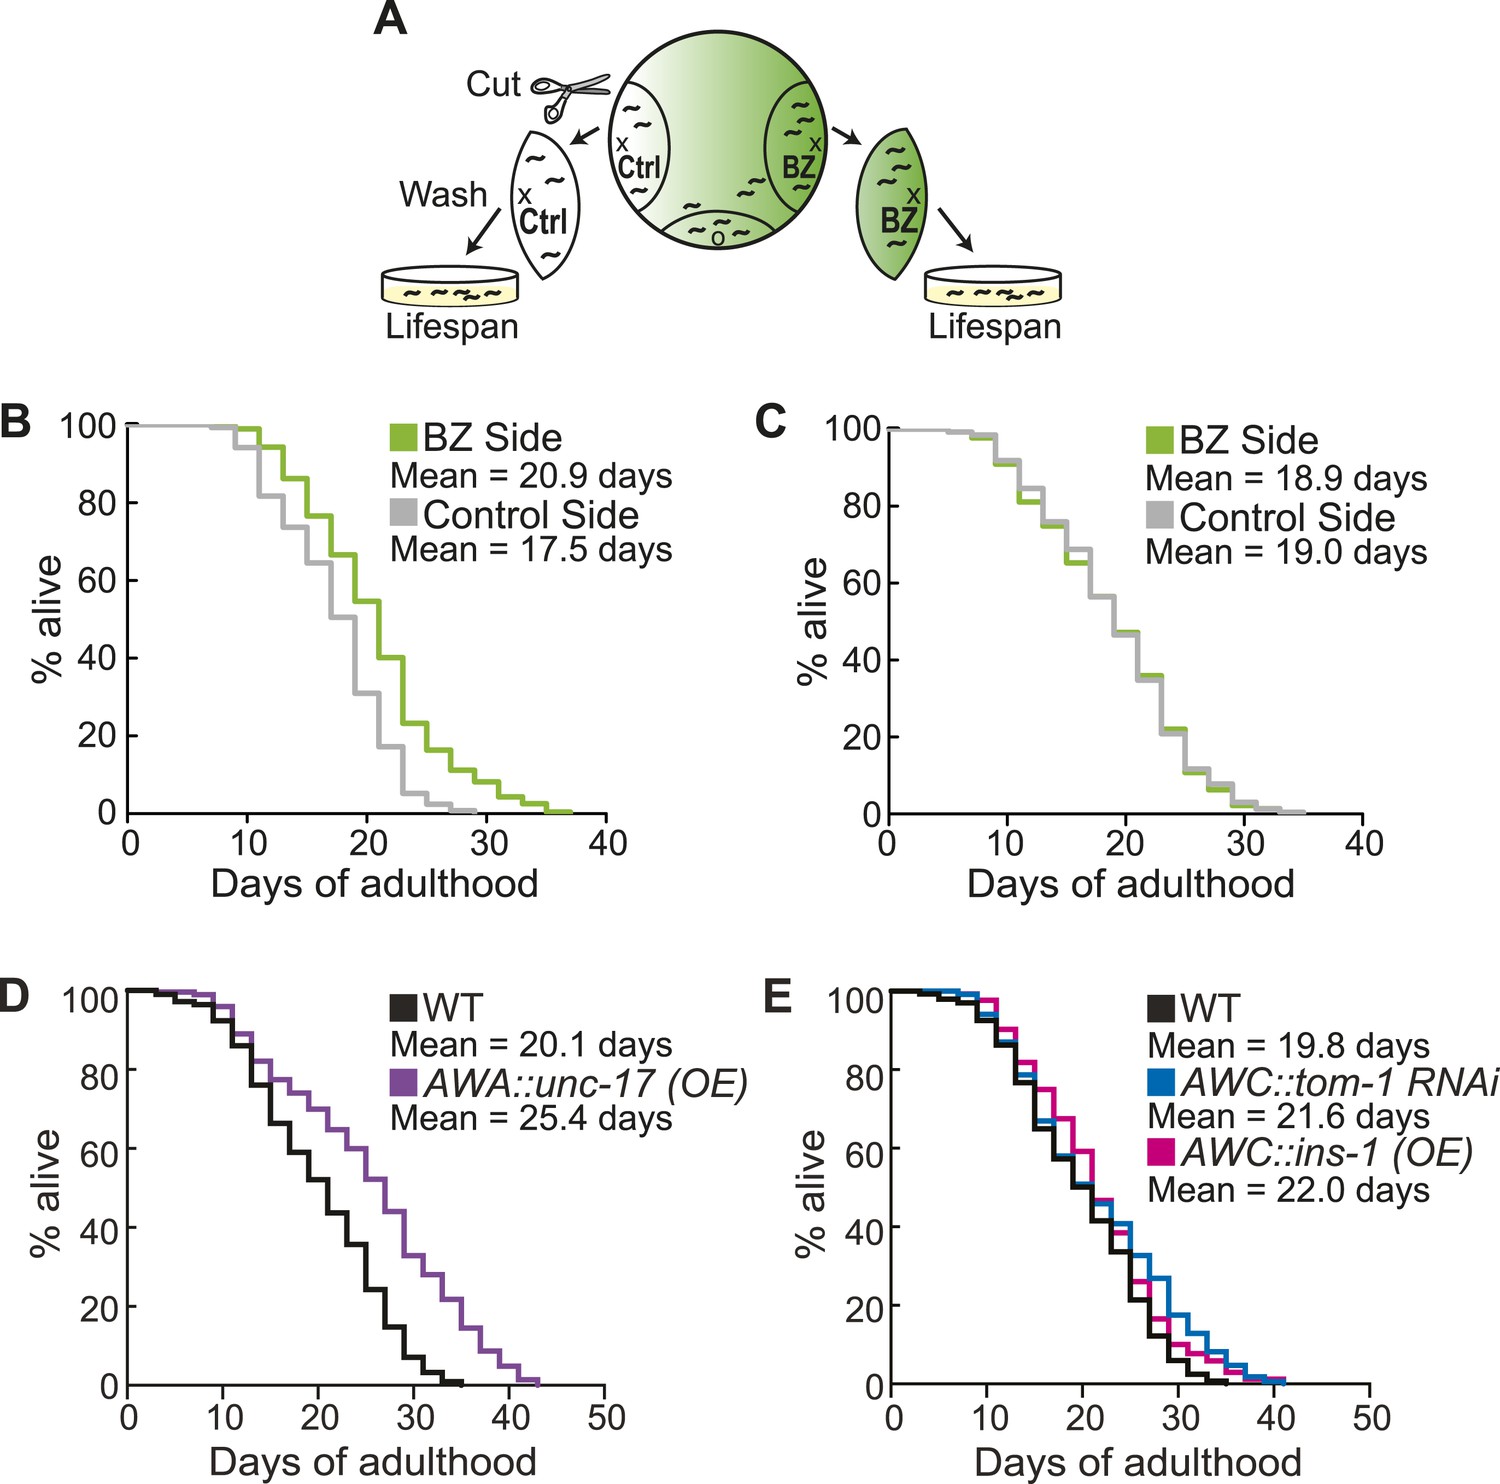
Aged animal olfactory abilities and neurotransmission from primary neurons are correlated with lifespan.
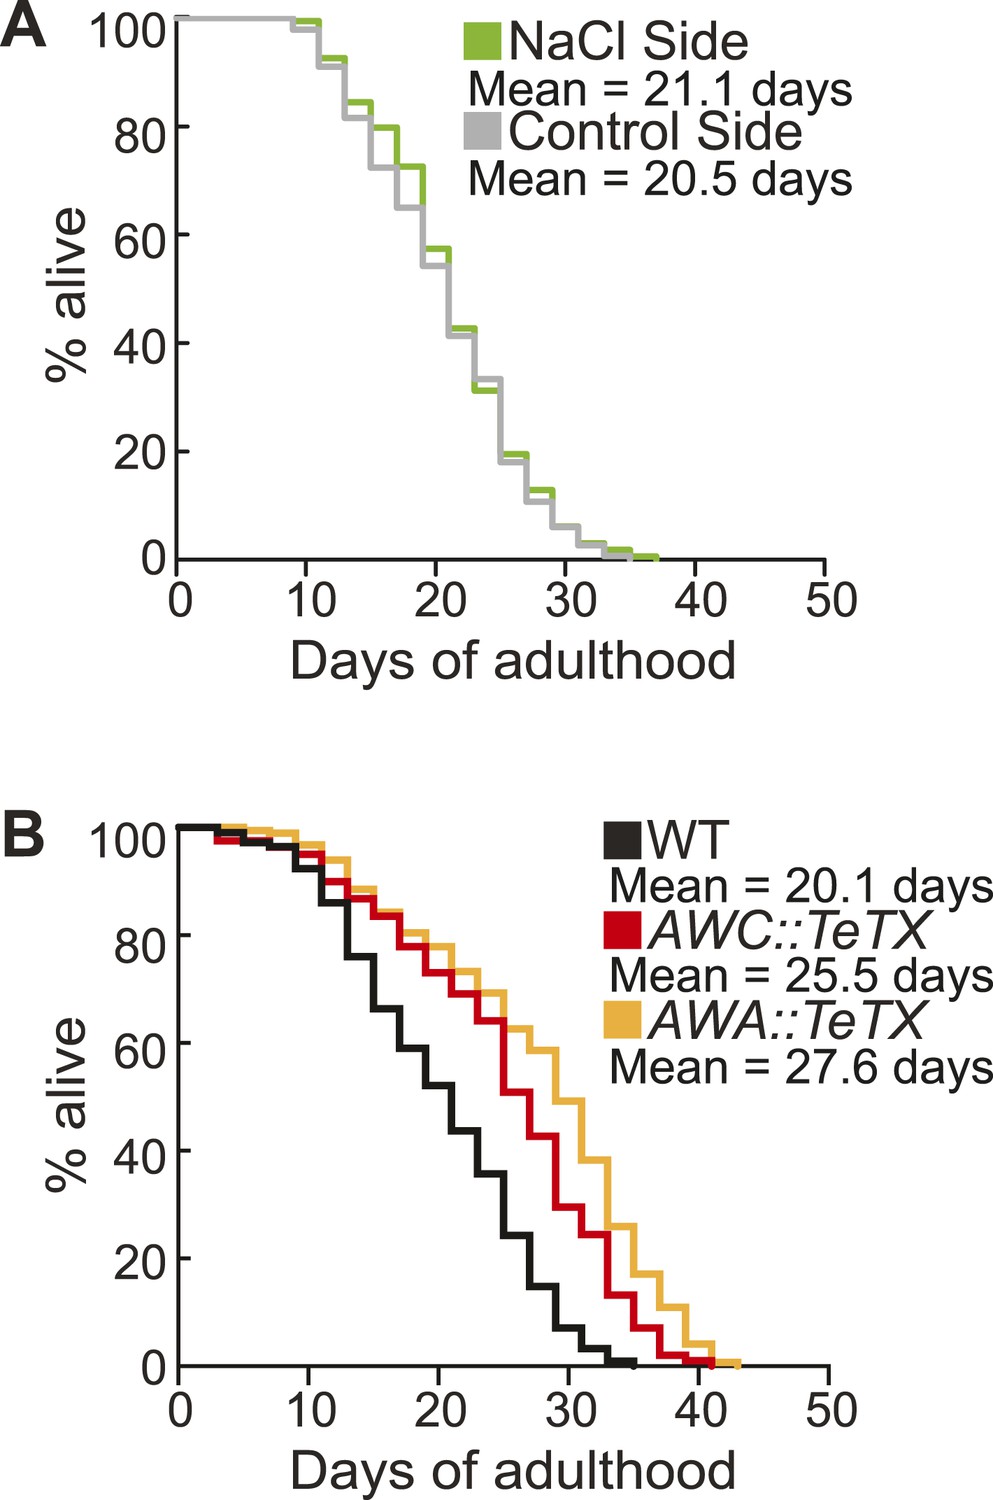
(A) Schematic of animals from a chemotaxis assay washed and sorted into two populations based on successful or failed navigation up the BZ odor gradient, for lifespan analysis. (B) Animals that chemotaxed to the BZ odor side of the chemotaxis plate as aged adults (day 5) have a 16.2% average extension in their lifespan compared to animals from the opposite, control (Ctrl) side (p < 0.01 by Mantel–Cox test, see Figure 8—figure supplement 1 and Figure 8—source data 1 for quantification). (C) Animals sorted by their young adult chemotaxis do not have significantly different lifespans (see Figure 8—figure supplement 1 and Figure 8—source data 1). (D) AWA-neuron specific unc-17 OE transgenic animals have a 26.6% average extension in lifespan compared to wild-type animals (p < 0.0001 by Mantel–Cox test, see Figure 8—figure supplement 3 and Figure 8—source data 1 for quantification). (E) Survival of wild-type, AWC-neuron specific tom-1 RNAi, and AWC-specific ins-1 OE transgenic animals (see Figure 8—figure supplement 3 and Figure 8—source data 1 for quantification). (B–E) Mean survival is reported in days of adulthood. BZ, benzaldehyde; OE, overexpression.
-
Figure 8—source data 1
Lifespan of animals sorted by their chemotaxis performance and lifespan of neurotransmitter manipulation transgenic animal data.
- https://doi.org/10.7554/eLife.10181.038
-
Figure 8—source data 2
Additional lifespan of neurotransmitter manipulation transgenic animal data.
- https://doi.org/10.7554/eLife.10181.039
Figure 8—figure supplement 1
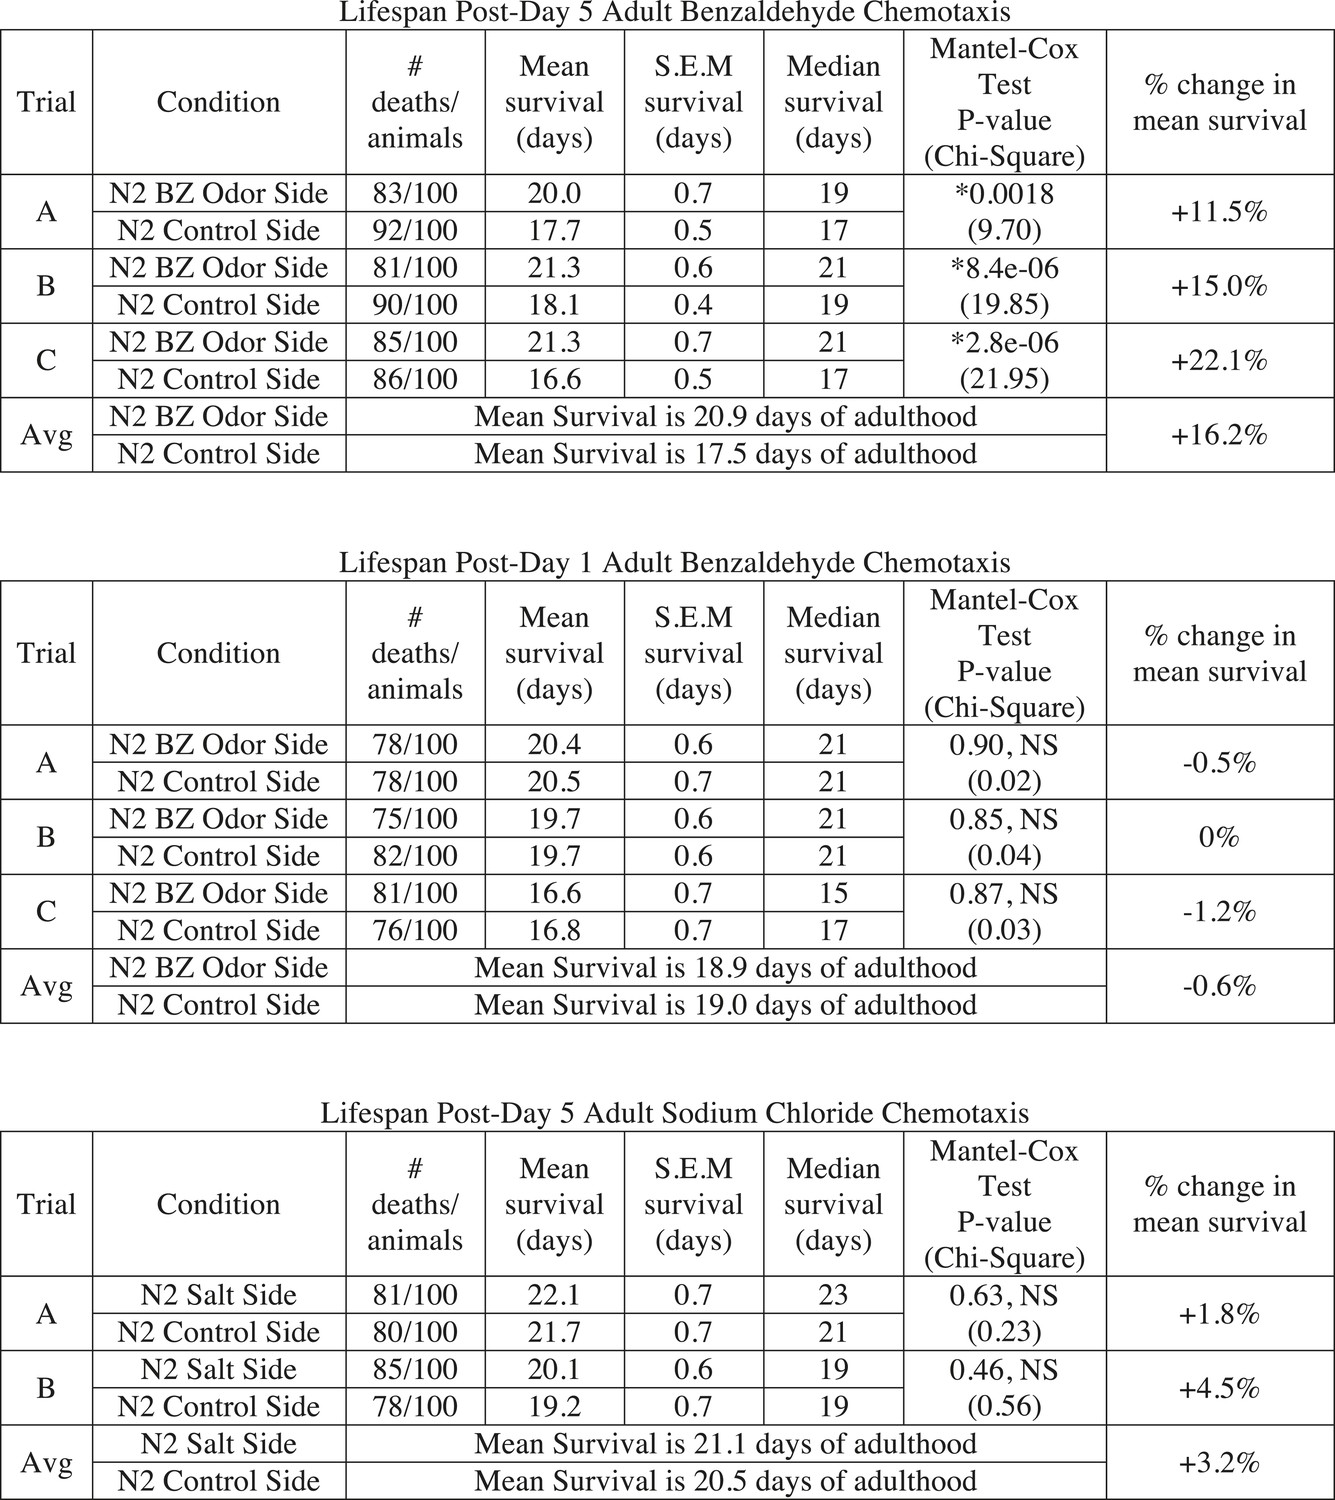
Sorting animals based on their performance on odor chemotaxis affects lifespan.
Wild-type (N2) worms were separated into a population that successfully reached the BZ odor or salt side of the chemotaxis plate and a population that failed to do so (Ctrl side) as young adults (day 1) or aged adults (day 5) and then their survival was analyzed. Data from three separate trials are shown for odor experiments and two separate trials for salt experiments. Animals were censored if they bagged, exploded or desiccated on the side of the plate. Mean survival, s.e.m. of survival, median survival and percent change in mean survival are reported in days of adulthood. *p < 0.05 by the Mantel–Cox test (the chi-square statistic value is reported in parentheses). The percent change in mean survival was calculated as the mean survival of animals from the BZ odor (or salt) side minus the mean survival of animals from the Ctrl side divided by the mean survival of the BZ odor (or salt) side. BZ, benzaldehyde.
Figure 8—figure supplement 2
Sorting animals based on their performance on salt chemotaxis and silencing primary neurons modifies lifespan.
(A) Animals sorted by their aged (day 5) adult chemotaxis to sodium chloride do not have significantly different lifespans (see Figure 8—figure supplement 1 and Figure 8—source data 2 for quantification). (B) AWC or AWA-neuron specific tetanus toxin expression to silence these neurons significantly extends lifespan compared to wild-type (+27.6% and +36.0%, respectively, *p < 0.01 by Mantel–Cox test, see Figure 8—figure supplement 3 and Figure 8—source data 2 for quantification). (A, B) Mean survival is reported in days of adulthood.
Figure 8—figure supplement 3
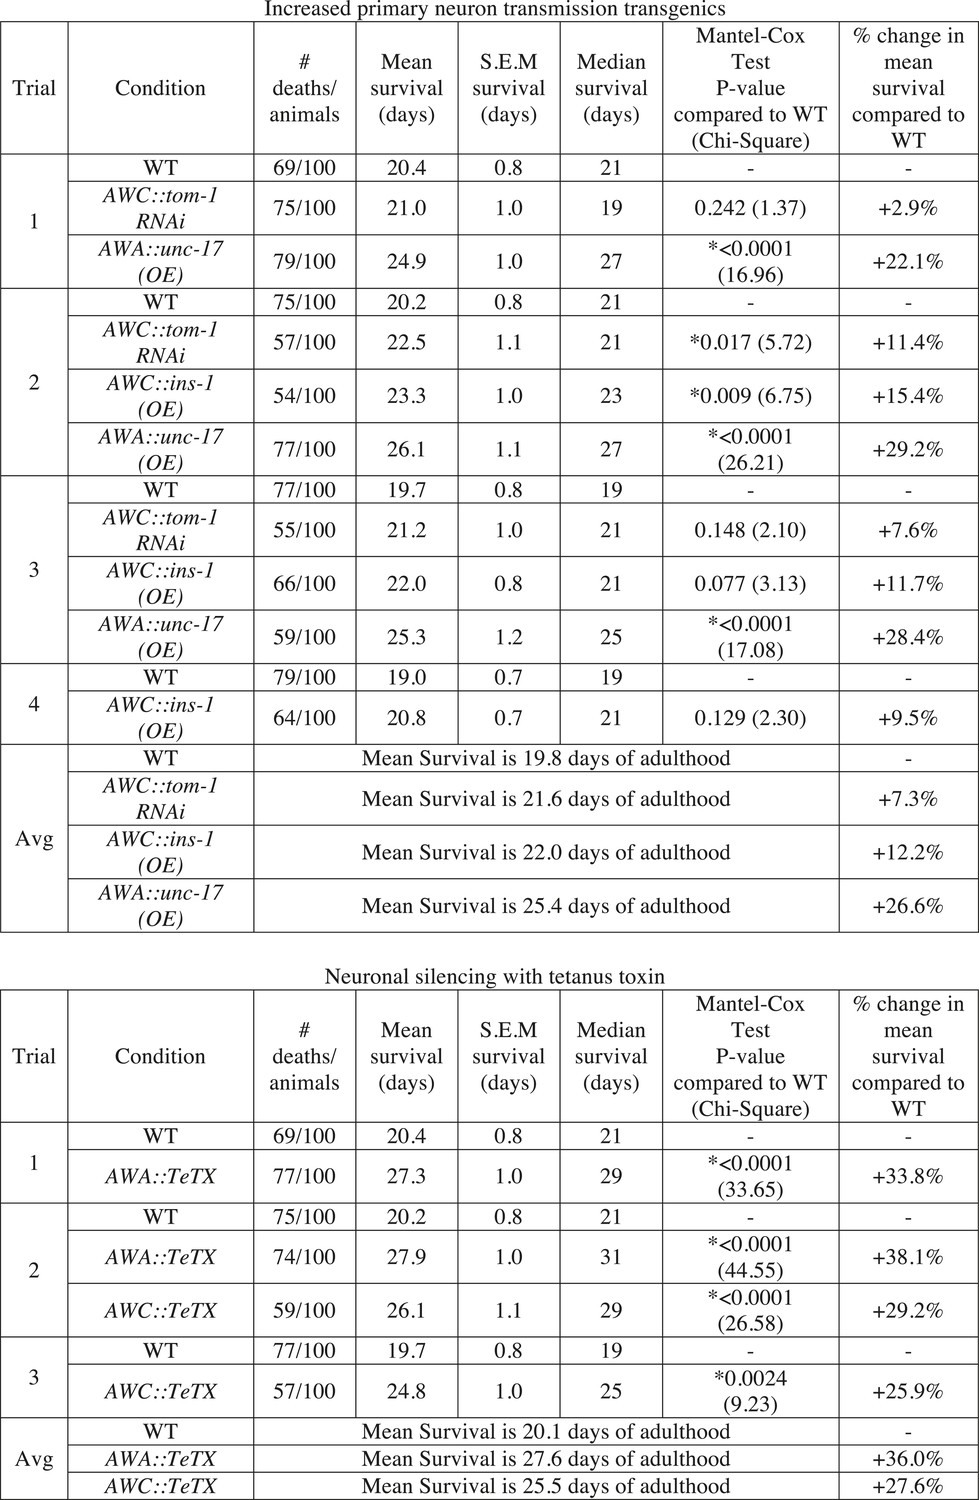
Manipulating neurotransmission from primary olfactory neurons modifies lifespan.
The survival of wild-type, AWC-neuron specific tom-1 RNAi, AWC-specific ins-1 OE, AWA-specific unc-17 OE, AWA-specific tetanus toxin expression and AWC-specific tetanus toxin expression transgenic animals was analyzed. Data from two or three separate trials (as indicated) is shown. Animals were censored if they bagged, exploded or desiccated on the side of the plate. Mean survival, s.e.m. of survival, median survival and percent change in mean survival are reported in days of adulthood. *p < 0.05 by the Mantel–Cox test (the chi-square statistic value is reported in parentheses). The percent change in mean survival was calculated as the mean survival of the transgenics minus mean survival of wild-type, divided by mean survival of wild-type.
Tables
Author response table 1
Comparison of Averaged ΔF/F in 10s time window listed below for young and aged WT odor responsive neurons (by two-tailed t-test)
Neuron | 10-20s | 20-30s | 30-40s | 40-50s | 50-60s | 60-70s |
|---|---|---|---|---|---|---|
AWCON | NS, P=0.1682 | NS, P=0.2114 | NS, P=0.2306 | NS, P=0.3829 | NS, P=0.4481 | NS, P=0.5167 |
ASEL | NS, P=0.2593 | NS, P=0.1983 | NS, P=0.1421 | NS, P=0.2748 | NS, P=0.2067 | NS, P=0.1822 |
AWB | NS, P=0.0601 | NS, P=0.1168 | NS, P=0.1327 | NS, P=0.2933 | NS, P=0.3453 | NS, P=0.3298 |
Neuron | 70-80s | 80-90s | 90-100s | 100-110s | 110-120s | 120-129s |
AWCON | NS, P=0.4226 | NS, P=0.4927 | NS, P=0.4857 | NS, P=0.5729 | NS, P=0.5361 | NS, P=0.6571 |
ASEL | NS, P=0.1531 | NS, P=0.1408 | NS, P=0.1446 | NS, P=0.1471 | NS, P=0.0620 | NS, P=0.0895 |
AWB | NS, P=0.2249 | NS, P=0.4059 | NS, P=0.2927 | NS, P=0.3530 | NS, P=0.2368 | NS, P=0.2538 |
Author response table 2
Is there a significant difference between the young and the aged odor responsive neurons?
Neuron | 130-140s | 140-150s | 150-160s | 160-170s | 170-180s |
|---|---|---|---|---|---|
AWCON | NS, P=0.0643 | NS, P=0.1383 | NS, P=0.6332 | NS, P=0.1942 | NS, P=0.0939 |
ASEL | *P=0.0336 | NS, P=0.0599 | NS, P=0.1584 | NS, P=0.4384 | NS, P=0.4712 |
AWB | NS, P=0.0909 | NS, P=0.0709 | NS, P=0.0886 | NS, P=0.3076 | NS, P=0.5934 |
Neuron | 10-20s | 20-30s | 30-40s | 40-50s | 50-60s |
AWA | NS, P=0.3929 | NS, P=0.3771 | NS, P=0.1101 | NS, P=0.1425 | NS, P=0.1957 |
Additional files
-
Supplementary file 1
C. elegans strain list.
- https://doi.org/10.7554/eLife.10181.043
Download links
A two-part list of links to download the article, or parts of the article, in various formats.
Downloads (link to download the article as PDF)
Open citations (links to open the citations from this article in various online reference manager services)
Cite this article (links to download the citations from this article in formats compatible with various reference manager tools)
Circuit mechanisms encoding odors and driving aging-associated behavioral declines in Caenorhabditis elegans
eLife 4:e10181.
https://doi.org/10.7554/eLife.10181


