Characterization of direct Purkinje cell outputs to the brainstem
- Department of Neurobiology, Harvard Medical School, United States
- Department of Neural and Behavioral Sciences, The Pennsylvania State University, United States
Figures
Figure 1
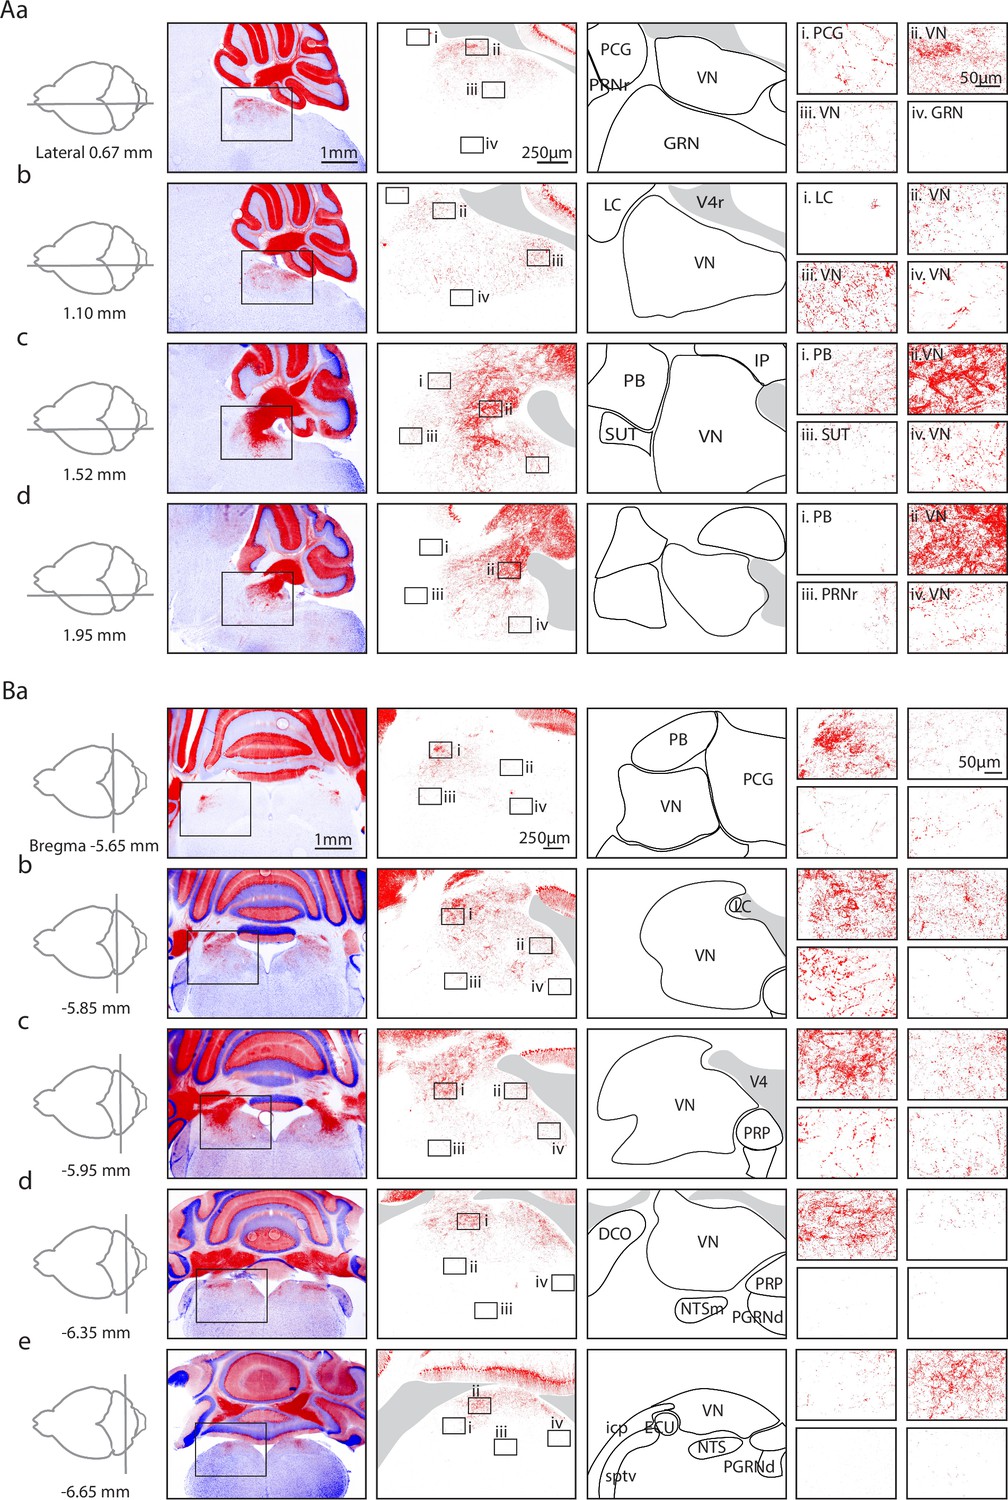
Anatomical characterization of Purkinje cell (PC) outputs to the brainstem using PC/synaptophysin-tdTomato mice.
(Aa) First column. Diagram showing parasagittal slice location. Second column. Low magnification views of tdTomato (tdT) fluorescence (red) in the cerebellar cortex and brainstem. Third column. Medium magnification views of the regions indicated in Ab. Fourth column. Anatomical regions corresponding to the preceding column. Last column. i–iv. High magnification views of the regions indicated in the preceding column. (Ab–d) As in Aa, but for subsequent parasagittal slices. (B) As in A, but for coronal slices.
Figure 2
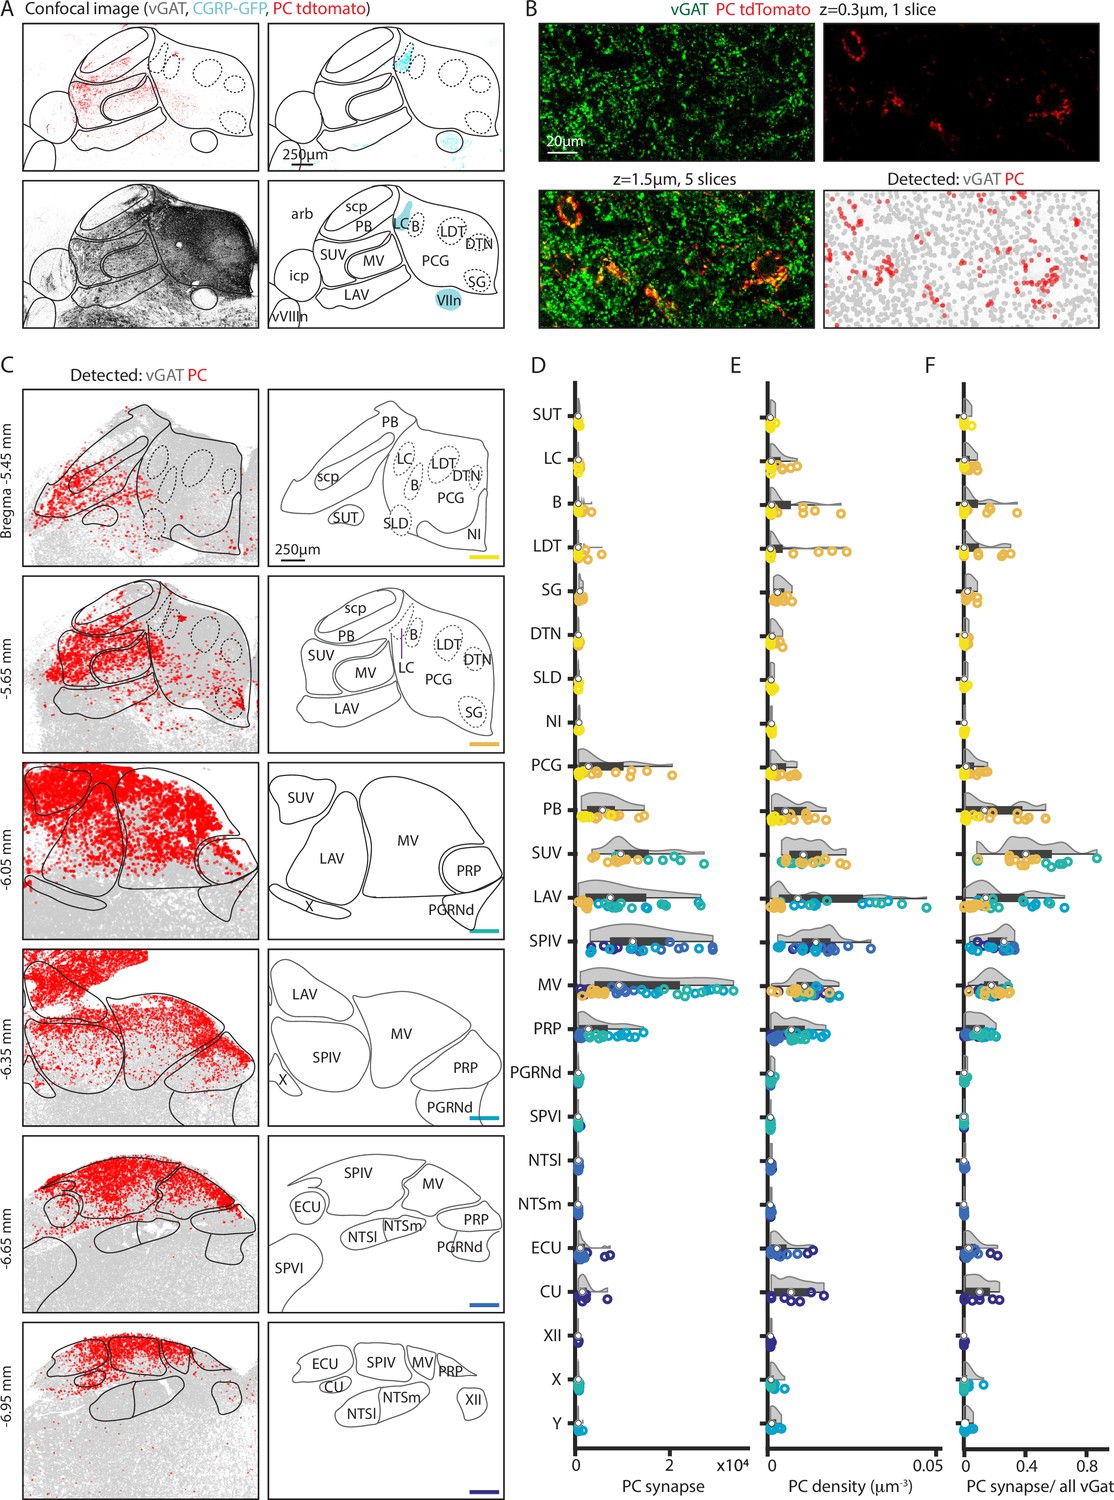
Quantification of putative Purkinje cell (PC) boutons in the brainstem.
GABAergic boutons were detected using a vesicular GABA transporter (vGAT) antibody and PC presynaptic boutons were detected based on tdTomato-synaptophysin labeling in PC/synaptophysin-tdTomato mice. (A) (Upper left) Confocal image of td-Tomato fluorescence. (Upper right) GFP fluorescence in CGRP-GFP mouse in which the locus coeruleus and facial nerve are labeled. (Lower left) vGAT labeling of GABAergic boutons. (Lower right) Allen Atlas coronal section corresponding to confocal images with landmarks used for registration highlighted in cyan. (B) (Upper left) vGAT labeling in a single confocal section. (Upper right) tdT labeling in a single confocal section. (Lower left) z-Stack of vGAT and tdT labeling in five sections (1.5 μm thick). (Lower right) Detected GABAergic boutons based on vGAT labeling (gray) and PC boutons (red). (C) (Left) Detected GABAergic boutons corresponding to PCs (red), and neurons other than PCs (gray) from six example coronal sections. (Right) Labeled anatomic regions for each coronal section. (D) Number of putative PC presynaptic boutons detected per section in each region. Individual section values are represented with symbol colors correspond to the sections in C, right (bottom-right corner color bars). Violin plot of the region shown in gray with average and quartile values in black. (E) Density of PC boutons in each region. Individual section and region average as represented in D. (F) Percentages of GABAergic boutons that correspond to PCs for each region. Individual section and region average as represented in D.
Figure 3
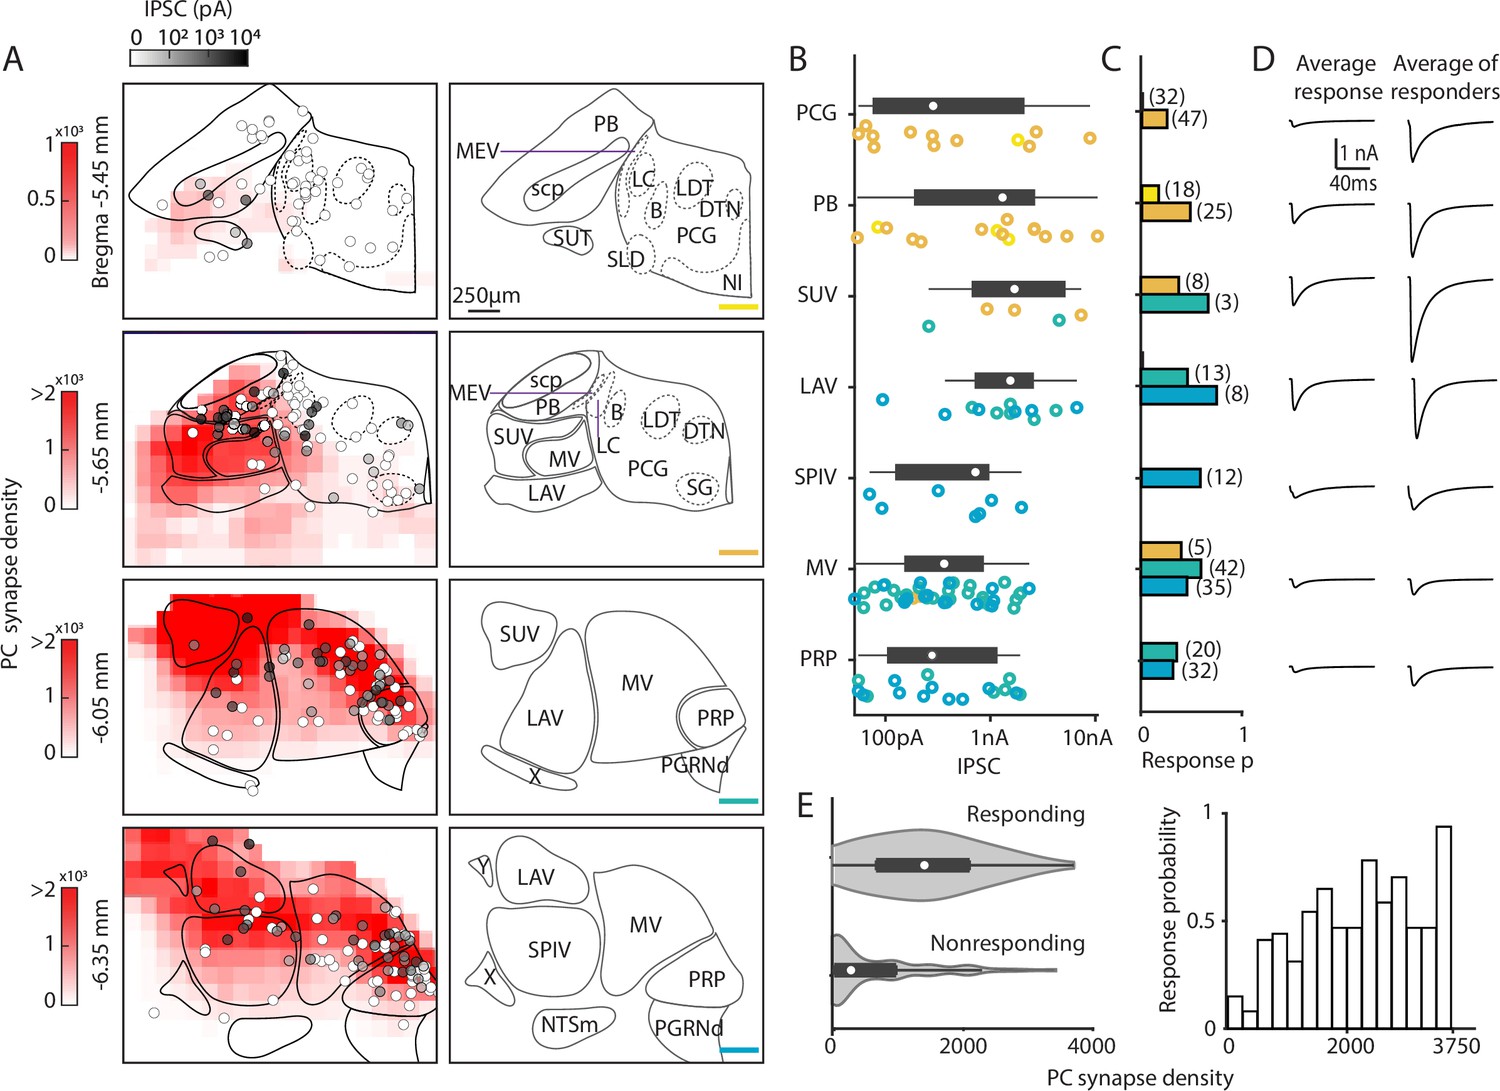
Characterization of functional properties of Purkinje cell (PC) synapses in the brainstem.
Light-evoked PC-IPSCs were measured in the brainstem of PC/ChR2-YFP mice. (A) (Left) Averaged putative PC presynaptic bouton density from previous quantification of brainstem regions (red, from Figure 2). Synapses were binned in voxels of 144×144×4 µm3. The locations of all recorded neurons are shown with the symbols coded for the light-evoked IPSC amplitudes (n=310). (Right) Labeled anatomical regions are indicated and the position of each slice is color-coded, as in Figure 2. (B) Evoked amplitudes of the responding neurons (n=113) in each region are shown. Symbol colors correspond to the sections in A. (C) Fraction of responding cells in each brainstem region and total number of neurons recorded (n=300). Bar graph colors correspond to the sections in A. (D) (Left) Average current in each region for all cells. (Right) Average current of responding cells in each region. (E) (Left) A violin plot of the average putative PC presynaptic bouton densities for neurons where a light-evoked PC-IPSC was detected (responding) and for cells where such a response was not observed (nonresponding). (Right) The probability of observing a light-evoked PC-IPSC in neurons is plotted as a function of the density of putative PC synaptic boutons in that voxel.
Figure 4
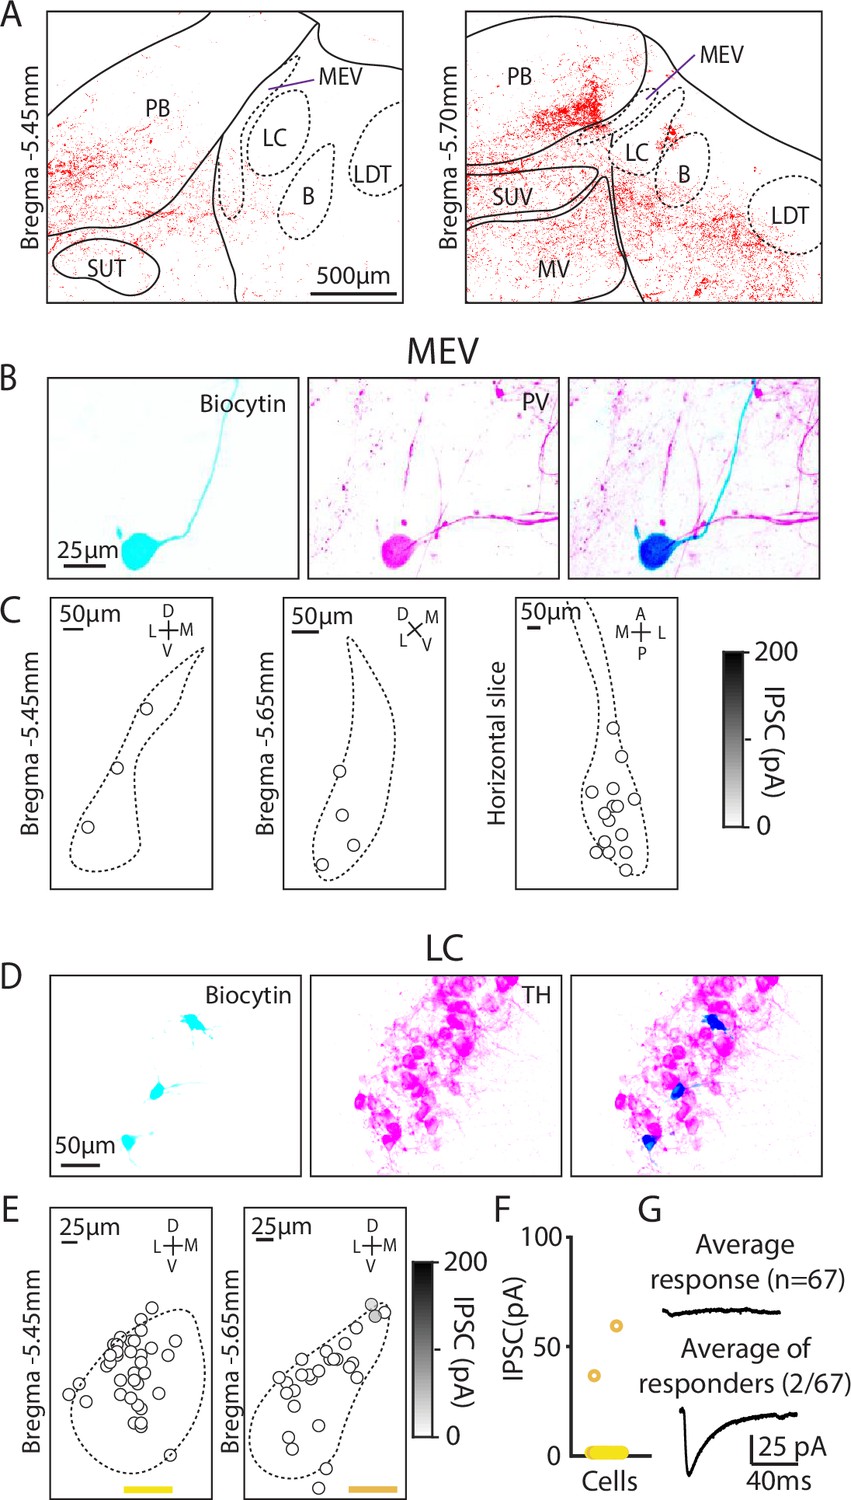
Minimal Purkinje cell (PC) inputs to locus coeruleus and mesencephalic trigeminal neurons.
(A) Example confocal image of PC presynaptic boutons labeled by synaptophysin-tdT showing cases where labeling was near locus coeruleus and the mesencephalic trigeminal nuclei. (B) (Left) Biocytin was included in the pipette to label MEV cells during whole-cell recordings. (Middle) MEV cells visualized with a parvalbumin (PV) antibody. (Right) Colocalization of biocytin and PV confirms that patched neurons were PV+MEV neurons. (C) Locations of MEV cells in two coronal slices and one horizontal slice. No PC-IPSC responses were detected in any of the cells (n=23) at any location. (D) As in B, but for LC cells labeled with a TH antibody. (E) As in C, but for two coronal levels of the LC (n=67). (F) Summary of the amplitudes of PC-IPSCs recorded in LC cells. (G) Average PC-LC neuron IPSCs for all cells (n=65, left), and for cells where a synaptic response was detected (n=2, right).
Tables
Table 1
Abbreviations of brainstem anatomical regions.
| Nuclei | |||
|---|---|---|---|
| B | Barrington’s nucleus | PRP | Prepositus nucleus |
| CU | Cuneate nucleus | SG | Supragenual nucleus |
| DCO | Dorsal cochlear nucleus | SLD | Sublaterodorsal nucleus |
| DTN | Dorsal tegmental nucleus | SPIV | Spinal vestibular nucleus |
| ECU | External cuneate nucleus | SPVI | Spinal nucleus of the trigeminal |
| GRN | Gigantocellular reticular nucleus | SUT | Supratrigeminal nucleus |
| IP | Interposed nucleus | SUV | Superior vestibular nucleus |
| LAV | Lateral vestibular nucleus | VN | Vestibular nucleus |
| LC | Locus coeruleus | X | Nucleus X |
| LDT | Laterodorsal tegmental nucleus | XII | Hypoglossal nucleus |
| MEV | Mesencephalic trigeminal nucleus | Y | Nucleus Y |
| MV | Medial vestibular nucleus | ||
| NI | Nucleus incertus | Ventricles | |
| NTS | Nucleus of the solitary tract | V4 | Fourth ventricles |
| NTSl | Nucleus of the solitary tract, lateral | V4r | Fourth ventricle (lateral recess) |
| NTSm | Nucleus of the solitary tract, medial | Fiber tracts | |
| PARN | Parvicellular reticular nucleus | arb | Arbor vitae |
| PB | Parabrachial nuclei | icp | Inferior cerebellar peduncle |
| PCG | Pontine central gray | scp | Superior cerebellar peduncle |
| PGRN | Paragigantocellular reticular nucleus | sptv | Spinal tract of the trigeminal nerve |
| PGRNd | Paragigantocellular reticular nucleus, dorsal | VIIn | Facial nerve |
| PRNr | Pontine reticular nucleus | vVIIIn | Vestibular nerve |
Key resources table
| Reagent type (species) or resource | Designation | Source or reference | Identifiers | Additional information |
|---|---|---|---|---|
| Strain, strain background (C57BL/6) | C57BL/6J | Jackson Laboratory | JAX #000664; RRID:IMSR_JAX:000664 | |
| Strain, strain background (C57BL/6) | B6.Cg-Tg(Pcp2-cre)3555Jdhu/J | Jackson Laboratory | JAX #010536; RRID:IMSR_JAX:010536 | |
| Strain, strain background (C57BL/6) | B6;129S-Gt(ROSA)26Sortm34.1(CAG-Syp/tdTomato)Hze/J | Jackson Laboratory | JAX #012570; RRID:IMSR_JAX:012570; Ai34D | |
| Strain, strain background (C57BL/6) | B6.Cg-Gt(ROSA)26Sortm32(CAG-COP4*H134R/EYFP)Hze/J | Jackson Laboratory | JAX #024109; RRID:IMSR_JAX:024109; Ai32 | |
| Strain, strain background (Swiss Webster) | Tg(Calca-EGFP)FG104 Gsat/Mmucd | MMRRC | 011187-UCD; RRID:MMRRC_011187-UCD | |
| Chemical compound, drug | NBQX disodium salt | Abcam | Ab120046 | |
| Chemical compound, drug | (R)-CPP | Abcam | Ab120159 | |
| Chemical compound, drug | Biocytin | Thermo Fisher | B1592 | |
| Antibody | Anti-tyrosine hydroxylase | Sigma-Aldrich | AB152 | Rabbit polyclonal; 1:1000 |
| Antibody | Anti-parvalbumin | Sigma-Aldrich | P3088 | Mouse monoclonal; 1:1000 |
| Antibody | Goat Anti-Rabbit Alexa Fluor 647 secondary | Thermo Fisher | A32733 | Goat anti-rabbit polyclonal; 1:1000 |
| Antibody | Goat Anti-Mouse Alexa Fluor 647 | Thermo Fisher | A21241 | Goat anti-mouse polyclonal; 1:1000 |
| Antibody | Anti-VGAT | Synaptic Systems | 131 004 | Guinea pig polyclonal; 1:500 |
| Antibody | Goat Anti-Guinea Pig Alexa Fluor 647 | Thermo Fisher | A21450 | Goat anti-guinea pig polyclonal; 1:1000 |
| Chemical compound, drug | Streptavidin, Alexa Fluor 594 Conjugate | Thermo Fisher | S11227 | |
| Software, algorithm | Arivis | Zeiss | https://www.zeiss.com/microscopy/us/products/software/arivis-pro.html | |
| Software, algorithm | Igor Pro 8 | WaveMetrics | RRID:SCR_000325 | https://www.wavemetrics.com/ |
| Software, algorithm | SutterPatch | Sutter | https://www.sutter.com/AMPLIFIERS/SutterPatch.html | |
| Software, algorithm | MafPC | Courtesy of MA Xu-Friedman | https://www.xufriedman.org/mafpc | |
| Software, algorithm | MATLAB (R2023b) | MathWorks | RRID:SCR_001622 | https://www.mathworks.com/products/matlab.html |
Additional files
Download links
A two-part list of links to download the article, or parts of the article, in various formats.
Downloads (link to download the article as PDF)
Open citations (links to open the citations from this article in various online reference manager services)
Cite this article (links to download the citations from this article in formats compatible with various reference manager tools)
Characterization of direct Purkinje cell outputs to the brainstem
eLife 13:RP101825.
https://doi.org/10.7554/eLife.101825.3


