Identification and characterization of early human photoreceptor states and cell-state-specific retinoblastoma-related features
- The Vision Center, Department of Surgery, and Saban Research Institute, Children’s Hospital Los Angeles, United States
- Development, Stem Cell, and Regenerative Medicine Program, Keck School of Medicine, University of Southern California, United States
- Cancer Biology and Genomics Program, Keck School of Medicine, University of Southern California, United States
- Department of Cancer Biology, Keck School of Medicine, University of Southern California, United States
- Norris Comprehensive Cancer Center, Keck School of Medicine, University of Southern California, United States
- Maternal-Fetal Medicine Division of the Department of Obstetrics and Gynecology, Keck School of Medicine, University of Southern California, United States
- Department of Radiology and The Saban Research Institute, Children’s Hospital Los Angeles, United States
- Department of Radiology, Keck School of Medicine, University of Southern California, United States
- Department of Development, Stem Cell, and Regenerative Medicine, Keck School of Medicine, University of Southern California, United States
- Department of Integrative Anatomical Sciences, Keck School of Medicine, University of Southern California, United States
- USC Roski Eye Institute, Department of Ophthalmology, Keck School of Medicine, University of Southern California, United States
Figures
Figure 1 with 3 supplements
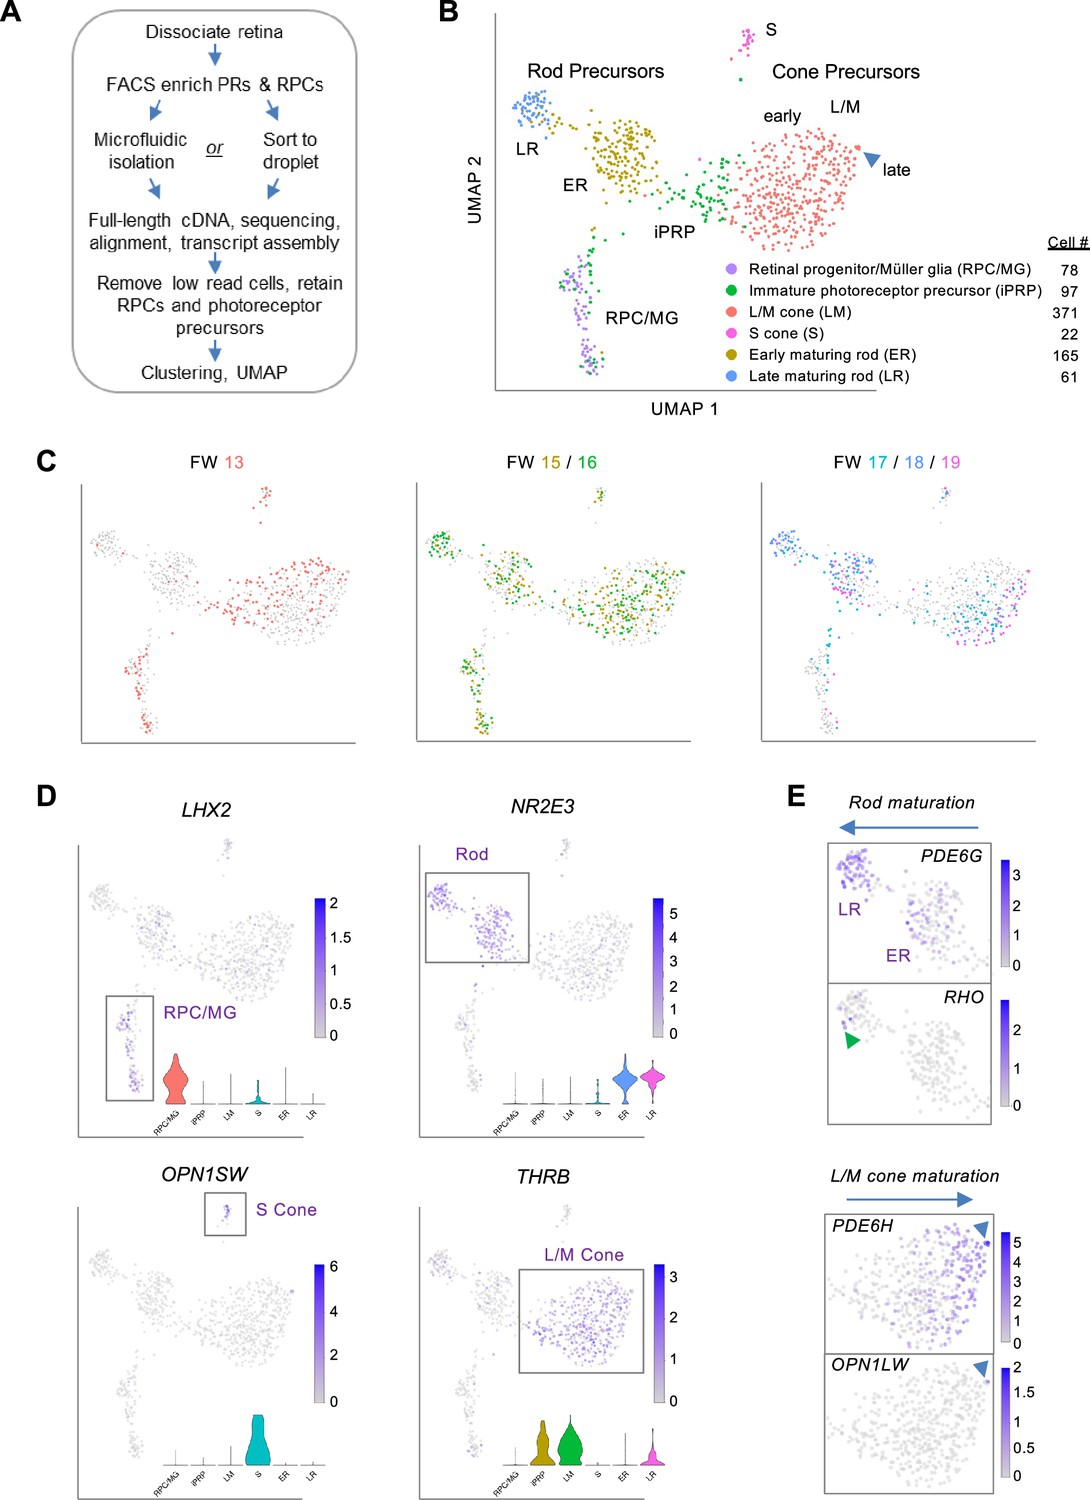
Photoreceptor-enriched full-length scRNA-seq of developing human retina.
(A) Overview of sample collection and sequencing. (B, C) UMAP plots showing low-resolution cell type clusters (B) and ages (C). (D) Expression of marker genes for RPC/MGs (LHX2), rods (NR2E3), S cones (OPN1SW), L/M cones (THRB). Insets: Gene expression violin plots (from left to right): RPC/MG (red), iPRP (brown), LM cone (green), S cone (teal), early rod (blue), late rod (pink). (E) Expression of markers of rod maturation (PDE6G, RHO) and cone maturation (PDE6H, OPN1LW). Arrowheads: Late-maturing RHO+ rods (top), late-maturing OPN1LW+ cones (bottom). See Figure 1—figure supplement 2 for additional examples. UMAP and violin plots for any gene or transcript isoform can be produced at https://docker.saban.chla.usc.edu/cobrinik/app/seuratApp/.
Figure 1—figure supplement 1
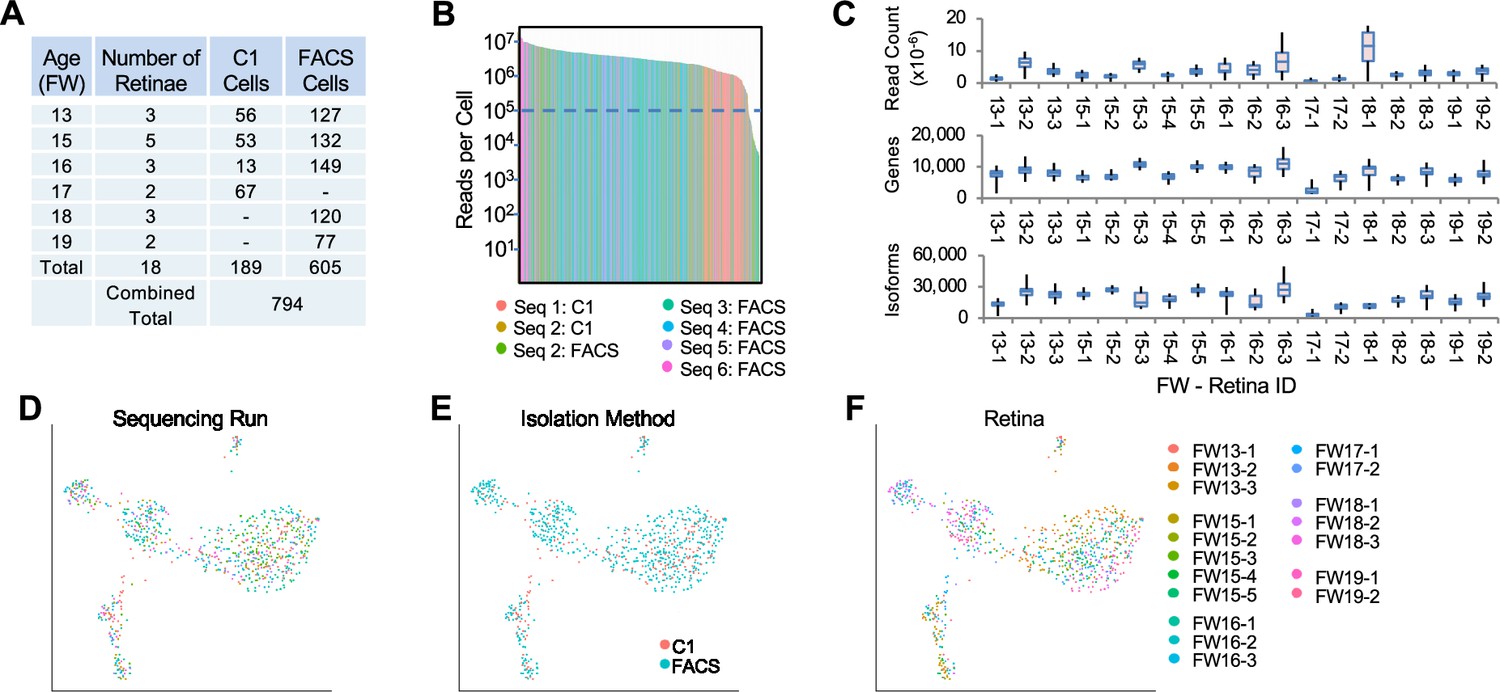
scRNA-seq sample and sequencing summary.
(A) Retinae and cell numbers examined at each age. (B) Histogram of total read counts for each cell, colored by sequencing run. Seq 1 cells were isolated by C1, Seq 2 cells by FACS or C1 as indicated, and all others by FACS. Dotted line: 100,000 read cutoff for cell exclusion. (C) Box plots of read counts, genes detected, and Ensembl transcript isoforms detected per cell ordered by fetal age and specimen number. (D-F) UMAP plots colored by sequencing run (D), isolation method (E), or retina ID (F).
Figure 1—figure supplement 2
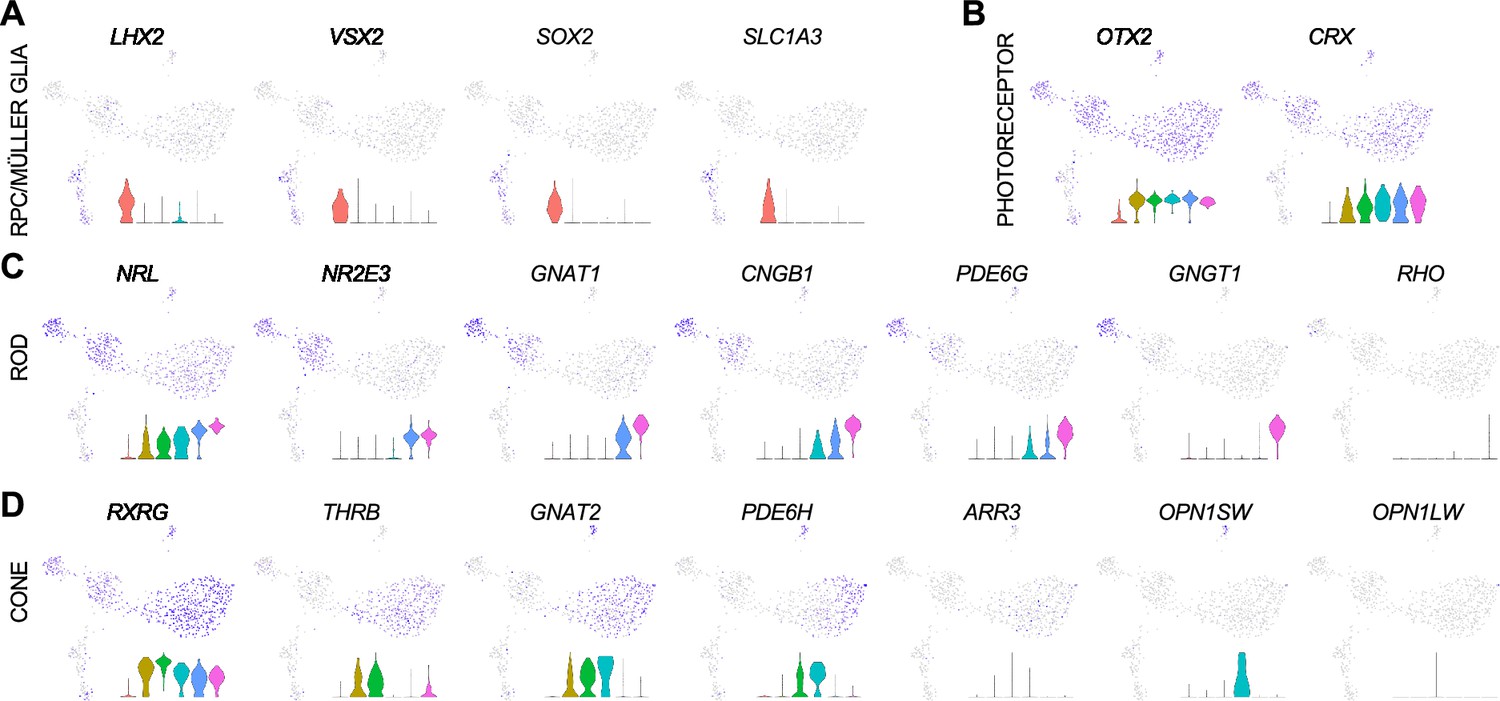
Expression of marker genes of RPCs, Müller glia, photoreceptors, rods, and cones.
Insets: Gene expression violin plots (from left to right): RPC/MG (red), iPRP (brown), LM cone (green), S cone (teal), early rod (blue), late rod (pink). UMAP and violin plots for any gene or Ensembl transcript can be produced at https://docker.saban.chla.usc.edu/cobrinik/app/seuratApp/.
Figure 1—figure supplement 3
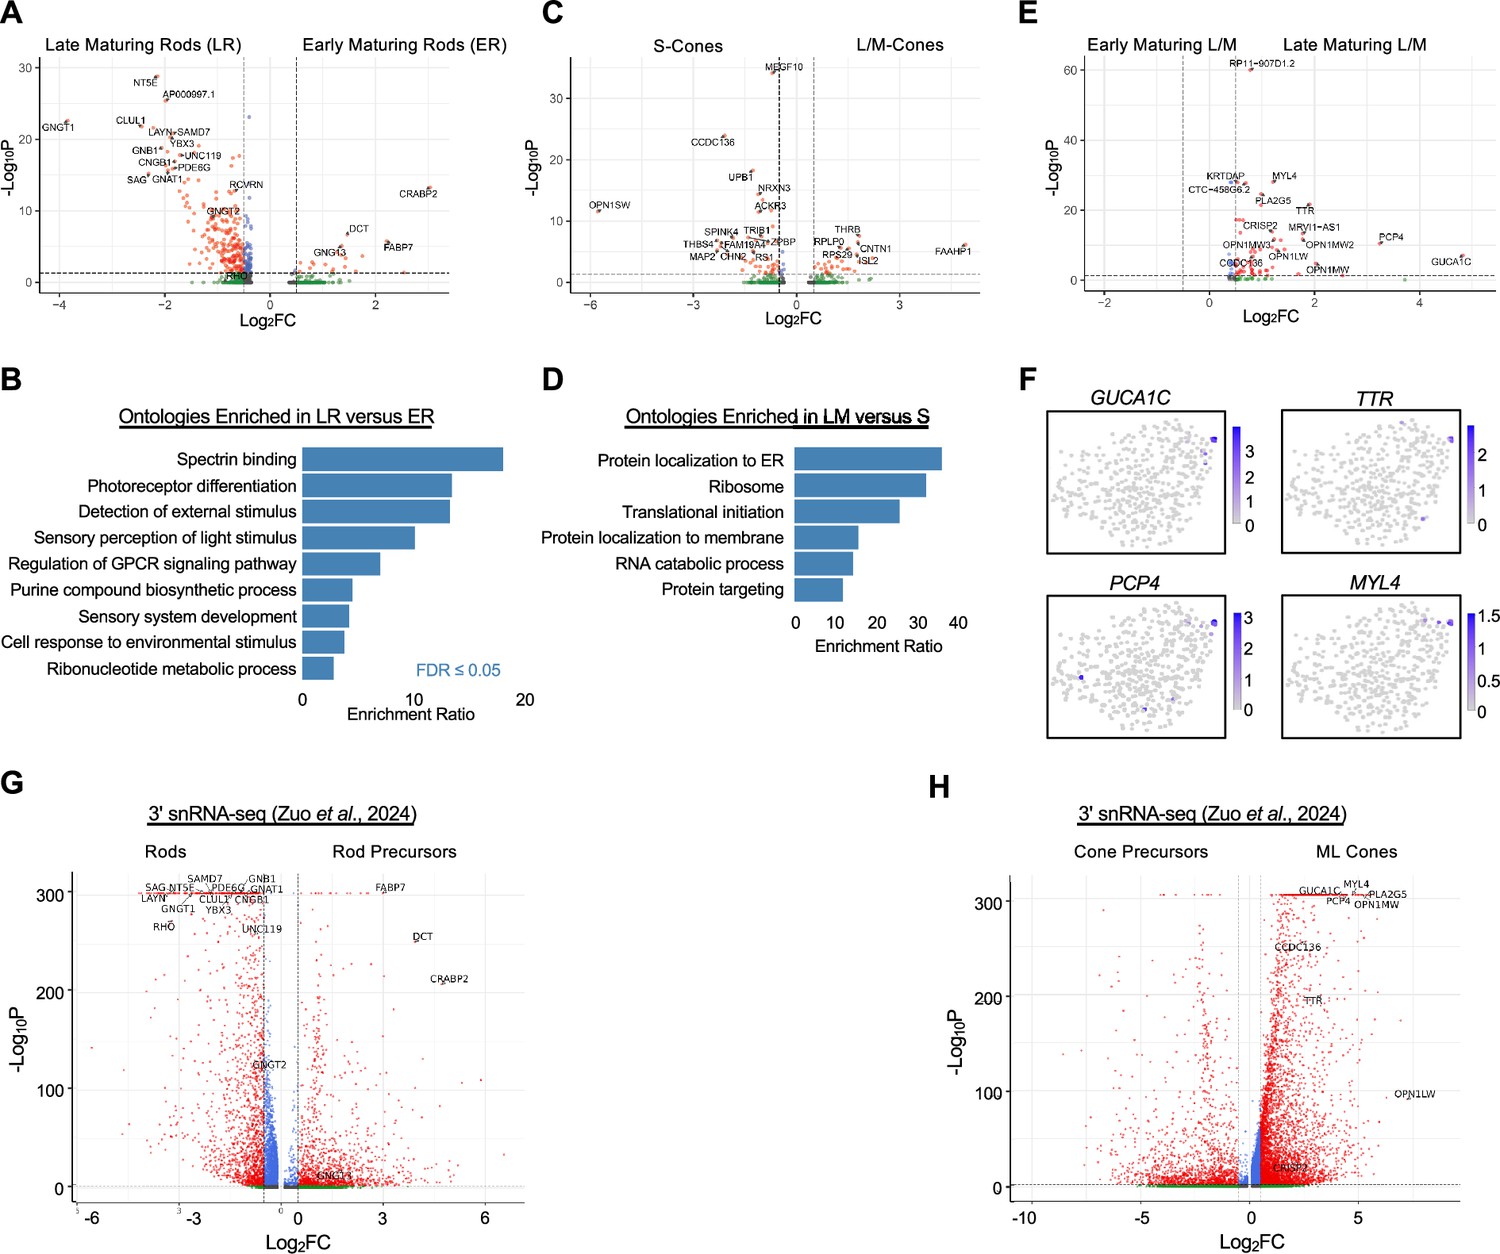
Differential expression between rod and cone maturation states.
(A, C, E) Volcano plots of differential expression (pAdj <0.05, log2FC >|0.5|) between ER and LR (A), LM and S (C), and spatially separated late-maturing L/M cones and remaining LM cluster (E). Labels indicate genes with highest significance and fold change. (B,D) Overrepresentation of molecular function ontologies for genes upregulated in LR over ER (B) or upregulated in LM over S (D).(F) UMAP plots of upregulated genes in the late-maturing L/M cone group. (G, H) Volcano plots of differential expression (pAdj <0.01, log2FC >|0.5|) between Rod and Rod Precursor (G) and ML Cone and Cone Precursor (H) subclasses as defined Figure 3 of Zuo et al., 2024. Late rod- and late cone-enriched genes labeled in (A) and (E) are also labeled when present in (G) and (H).
Figure 2
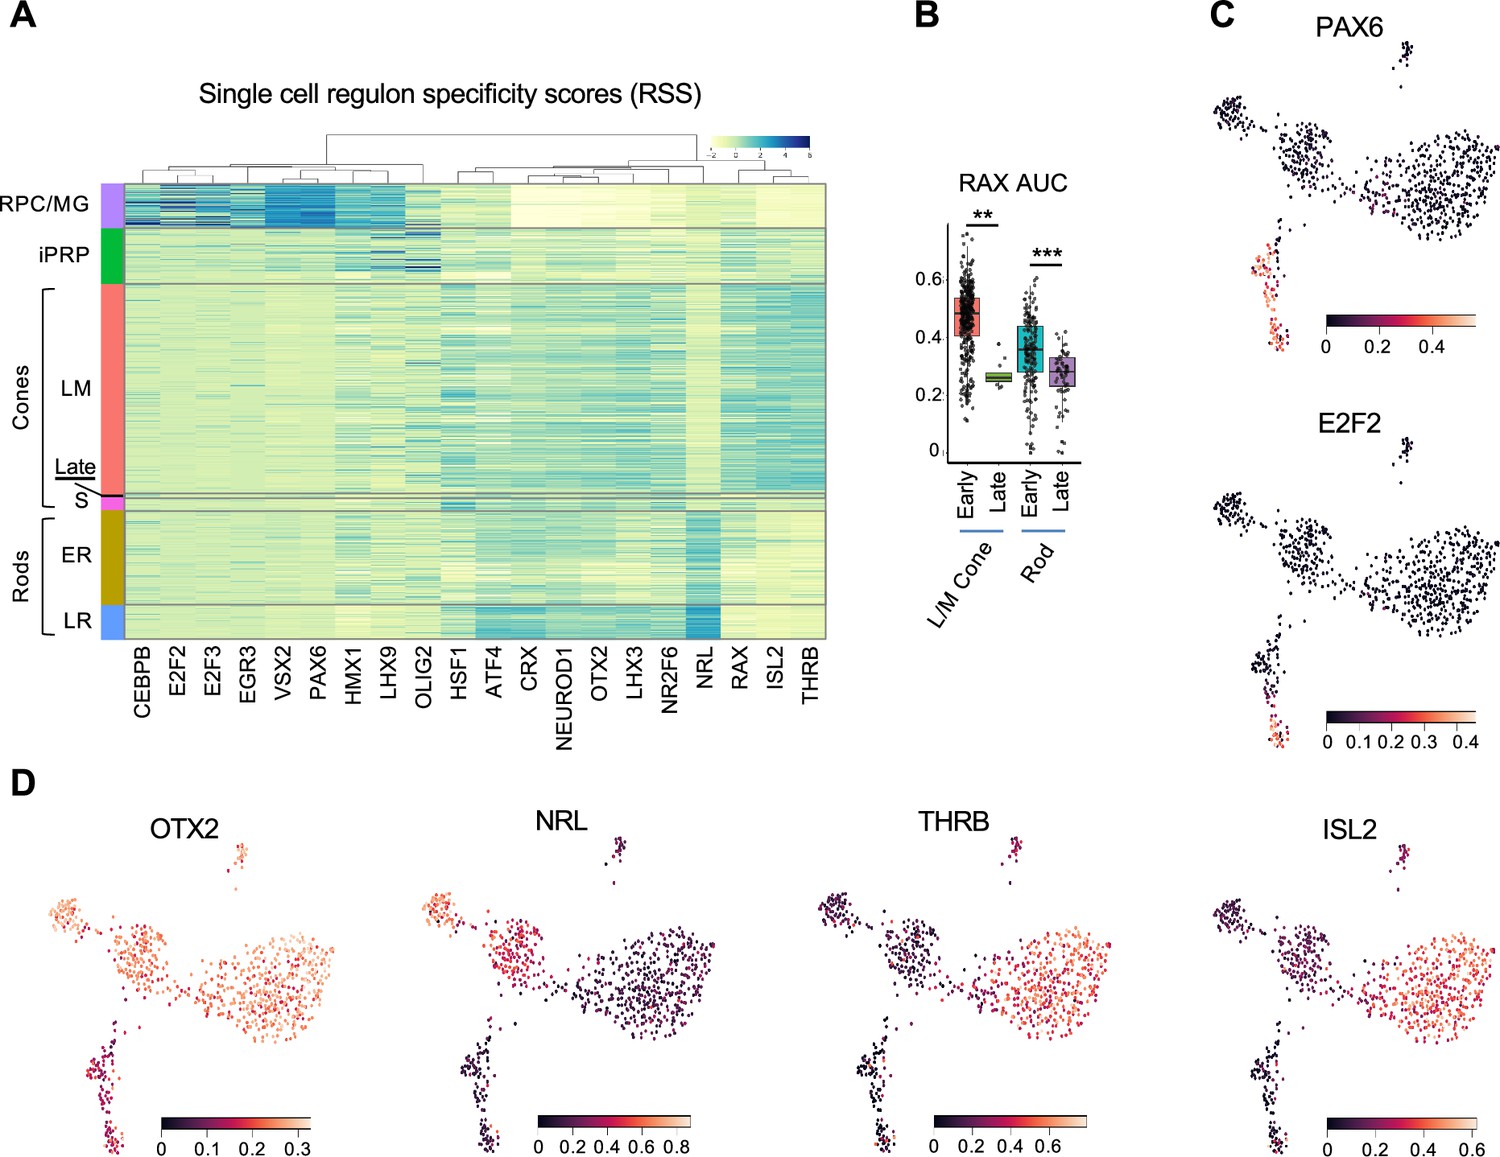
Regulon-defined RPC and photoreceptor precursor states.
(A) Ward-clustered heatmap of the highest scoring SCENIC regulons in each cluster, displaying Z-score normalized regulon activities. Late = late-maturing L/M cones. (B) Box plot of RAX regulon area under the curve (AUC) values for early and late L/M cones and rods. *, p<0.005; ***, p<0.0005, Dunn test. (C,D) UMAP plots of regulon AUC values for (C) PAX6 (RPC/MG) and E2F2 (RPC), and (D) OTX2 (photoreceptors and photoreceptor-committed RPCs), NRL (rod) and THRB and ISL2 (L/M cone).
Figure 3 with 2 supplements
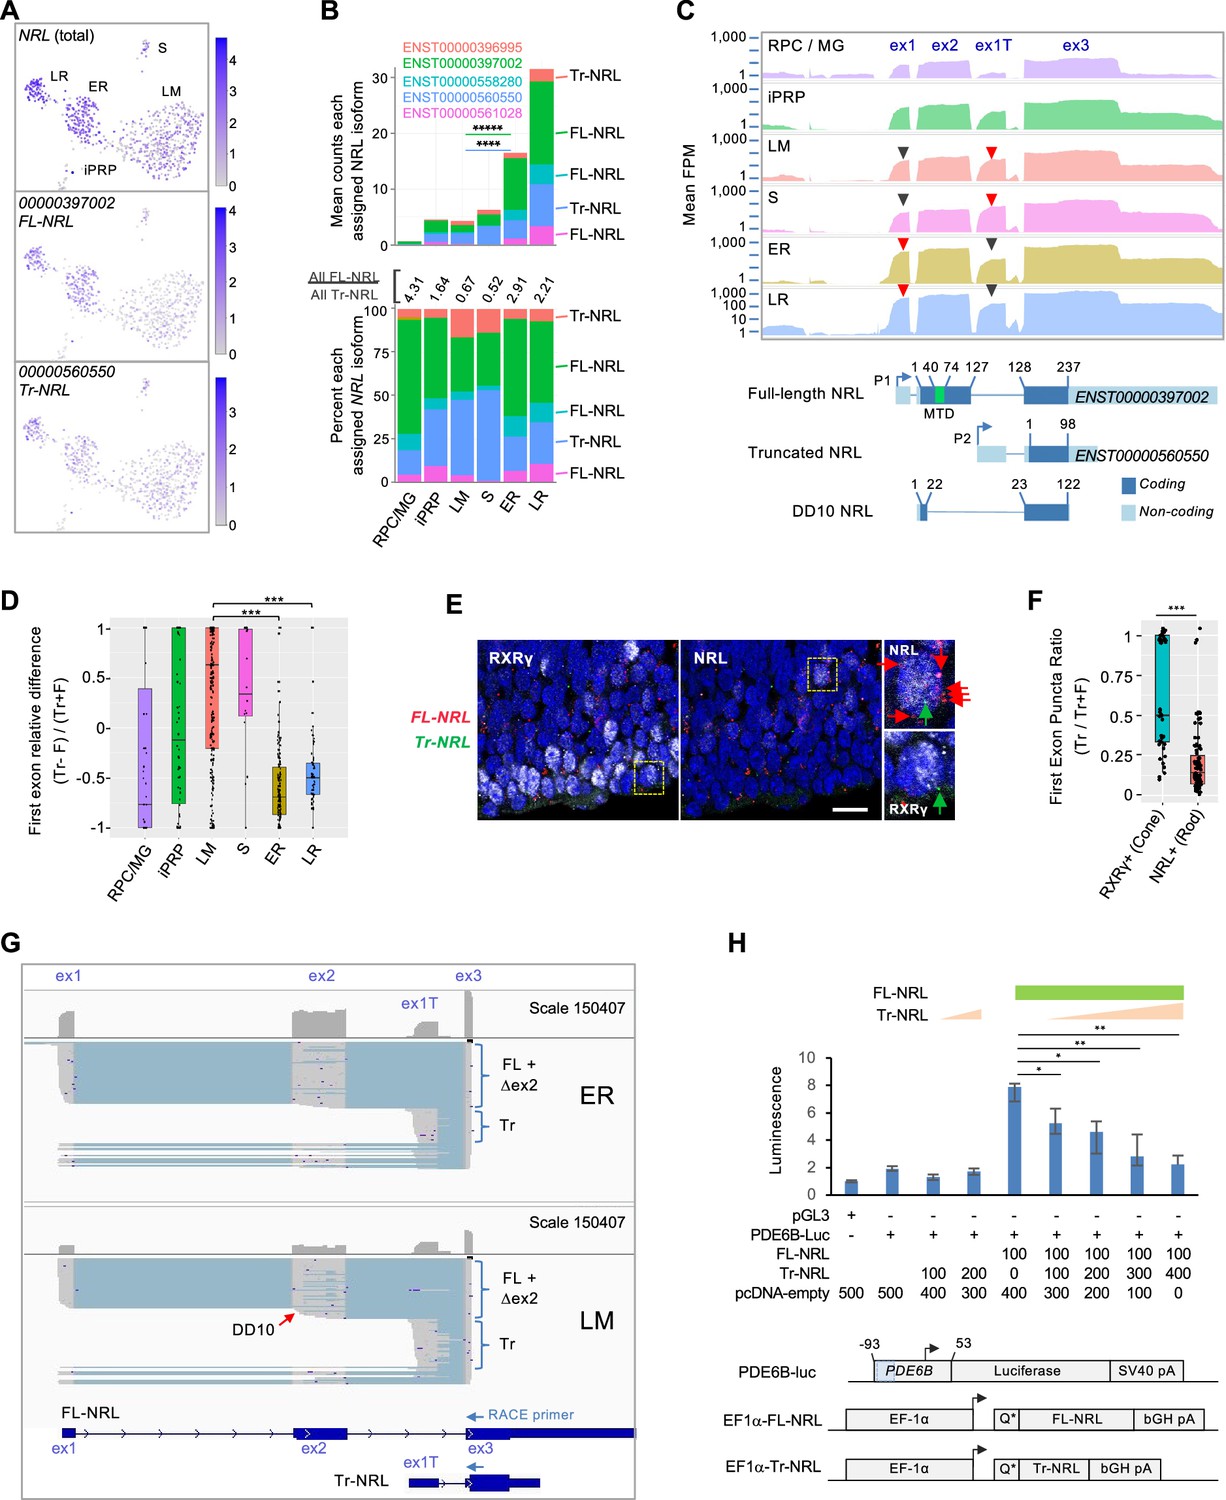
Differential expression of NRL isoforms in rod and cone precursors.
(A) Expression of NRL gene and the most highly assigned Ensembl isoforms ENST00000397002 (FL-NRL) and ENST00000560550 (Tr-NRL). (B) Mean NRL isoform assignments for clusters defined in Figure 1B, presented as total counts (top) and percentage of total counts (bottom). Significance for LM vs. ER fold change, colored by isoform. ****, p<0.0002; *****, <0.000001 (bootstrapped Welch’s t-test). Ensemble transcript IDs shown in color with structures shown in Figure 3—figure supplement 1B. (C) Top: Mean read counts (fragments per million, FPM) across Ensembl NRL exons for each cluster. Bottom: Transcript structures numbered according to amino acid positions. Minimal transactivation domain (MTD) in green. Arrowheads: Red/black: First exons where red is higher of two peaks. (D) Relative difference box plot of raw reads mapping to truncated (Tr) and full length (F) transcript first exons in each cell, according to cluster. Relative difference is the difference in reads mapping to truncated and full-length NRL first exons (Tr-F) divided by the sum of both (Tr + F). Values >0 indicate more reads assigned to truncated isoform, values <0 indicate more reads assigned to full-length isoform. ***, p<0.0001 (post-hoc Dunn test). (E) NRL and RXRγ immunostaining and RNA FISH with probes specific to truncated Tr-NRL exon 1T (green puncta) and FL-NRL exons 1 and 2 (red puncta) in FW16 retina. Boxed regions enlarged at right show an RXRγlo, NRL+ rod with one Tr-NRL and six FL-NRL puncta (top) and an RXRγhi, NRL– cone with one Tr-NRL and no FL-NRL puncta (bottom), indicated with same-color arrows. Scale bar: 10 µm. (F) Ratio of fluorescent puncta observed in experiment depicted in (E) for NRL+ or RXRγhi cells where Tr puncta >0. ***; p<0.0005 (Welch’s t-test). (G) Long-read nanopore sequencing of pooled 5' RACE reactions initiated with NRL exon 3 primers and performed on cDNA libraries from 23 ER cells (top) and 21 LM cells (bottom). Each schematic shows total exon coverage (above) and individual transcripts (below), where expressed sequences are gray and introns light blue. Full-length (FL), alternatively spliced or internally initiated exon 2 (△ex2), and truncated (Tr) transcripts are indicated by brackets. Red arrow: Transcripts resembling DD10, with internal exon 2 transcription initiation and premature splicing to exon 3. Ensembl FL-NRL and Tr-NRL transcript isoforms and RACE primer positions are shown below. (H) Top: PDE6B-luciferase reporter activity in NIH-3T3 cells transfected with indicated amounts (ng) of pcDNA4-C-EF1α and derived FL-NRL and Tr-NRL constructs. Bottom: PDE6B-luc reporter and pcDNA4-C-EF1α expression constructs. Blue box = NRL response element. Error bars = standard deviation of triplicate measurements. *, p<0.05; **, <0.005 (Student’s t-test). Data representative of two experiments in NIH-3T3 and one in HEK-293T.
Figure 3—figure supplement 1
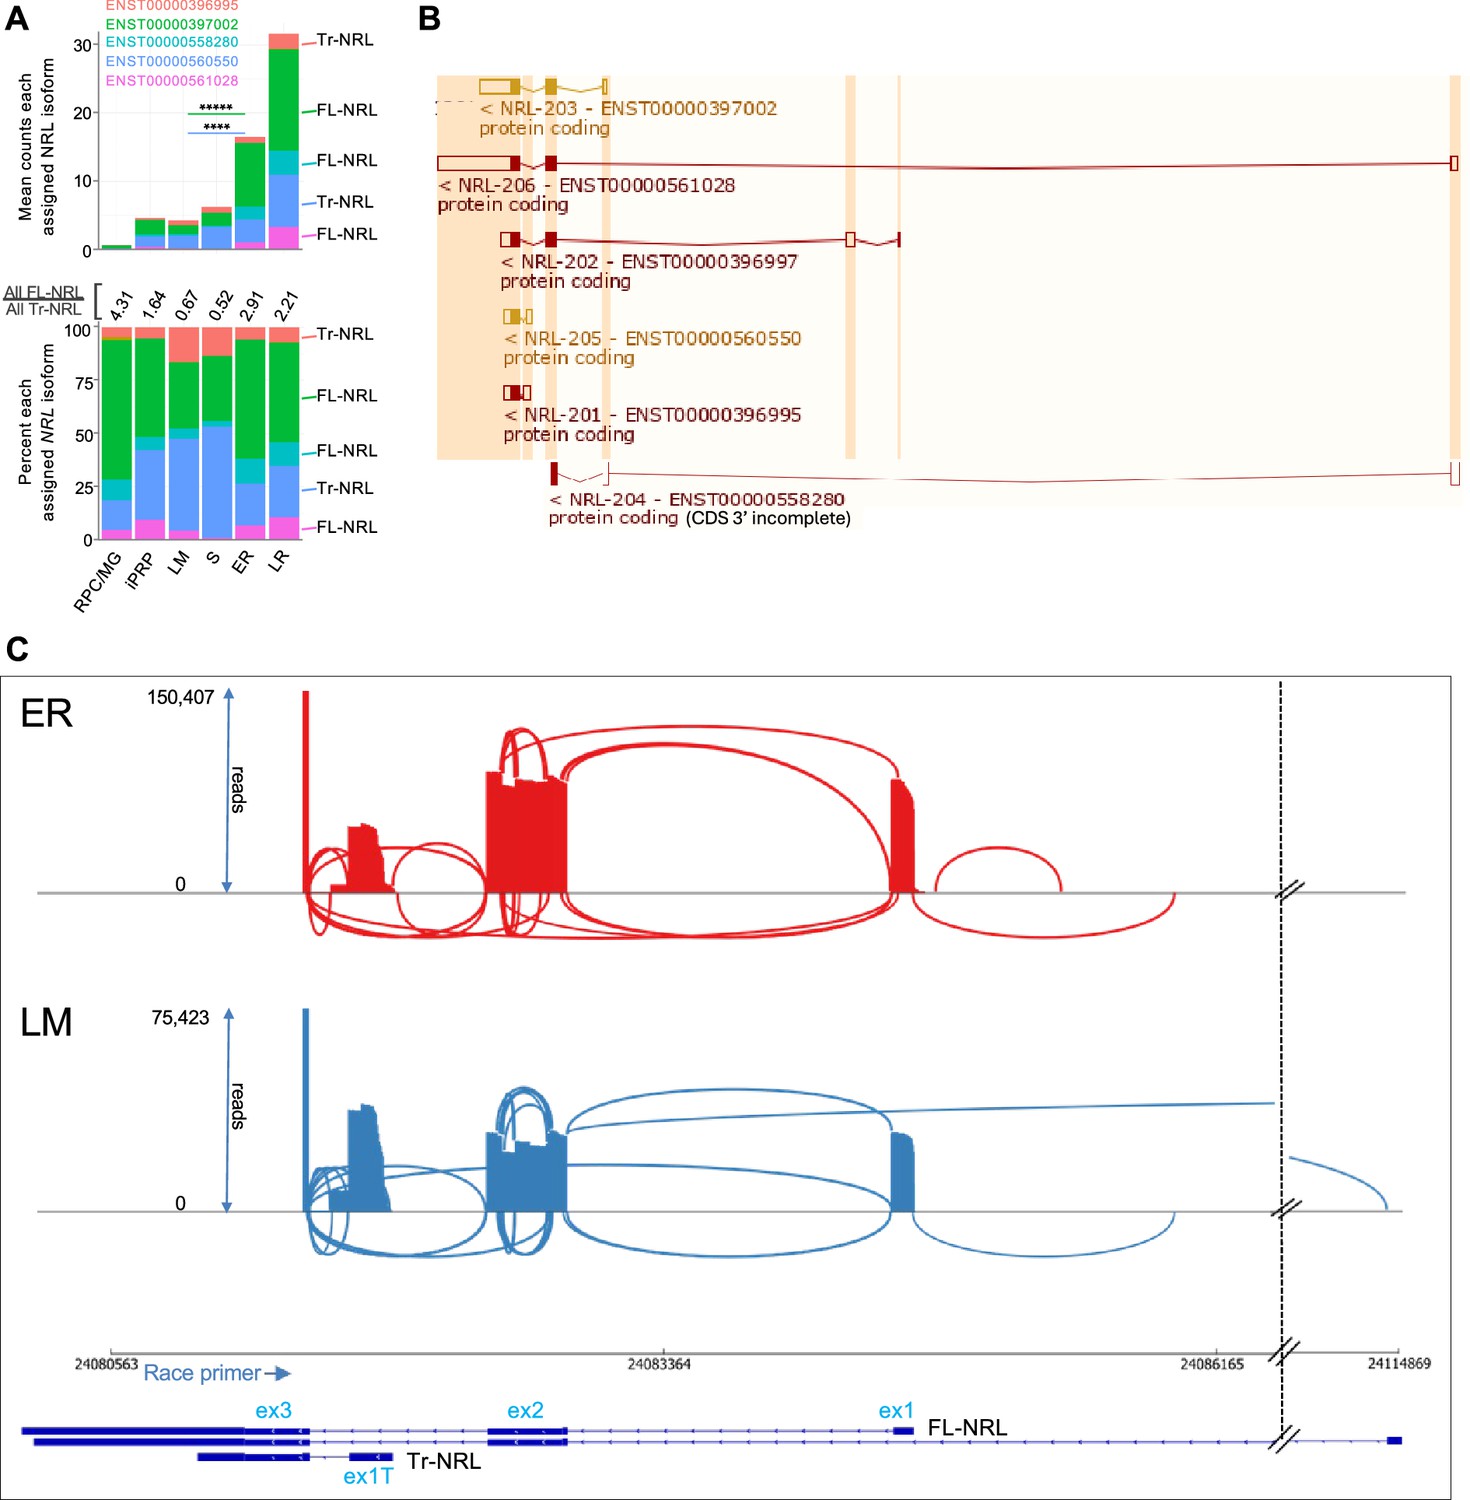
Differential NRL transcript isoform expression in early rod and cone precursors.
(A) Mean NRL isoform counts for each cluster based on short-read full-length cDNA sequencing (top) and percentage of total counts (bottom), as in Figure 3B. (B) NRL Ensemble isoforms. (C) Top: Sashimi plots of NRL transcript splicing based on nanopore long read sequencing of 5' RACE reactions from 23 ER cells and 21 LM cells. The minimum number of reads required to display transcript isoforms was set at 20 for ER cells and at 10 for LM cells, proportional to the total NRL reads in each sample. Bottom: Exon structures of FL-NRL70(ENST00000397002) and Tr-NRL (ENST00000560550) isoforms and RACE primer location. The NRL gene is oriented relative to chromosome 14 coordinates. Hash marks indicate sequences preceding a rarely used far upstream first exon in ENST00000561028. Note increased intra-exon 2 splicing and ex1T use in the LM population.
Figure 3—figure supplement 2
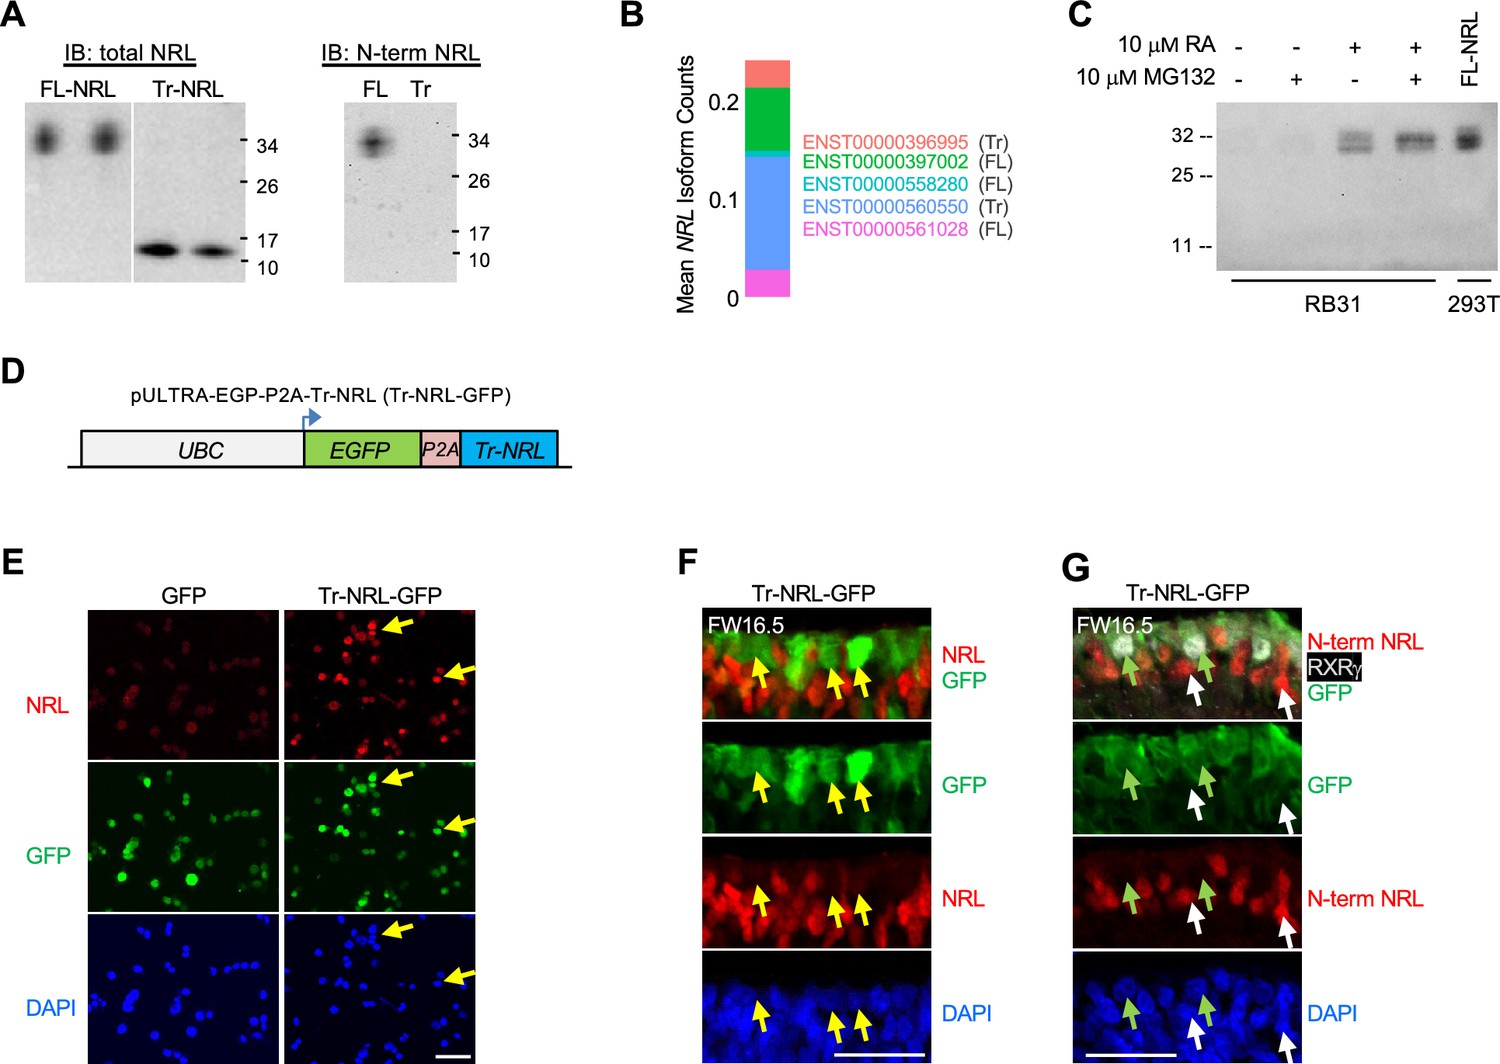
Cell-type-specific NRL protein expression.
(A) NRL antibody validation by immunoblot (IB) of ectopic FL-NRL and Tr-NRL in HEK293T. Left: anti-total NRL. Right: anti-N-terminal NRL specific to FL-NRL. (B) Average assigned NRL isoform expression in scRNA-seq of RB31 retinoblastoma cell line. (C) Immunoblot of endogenous total NRL in RB31 cells treated with or without 10 µM retinoic acid (RA) and 10 µM proteasome inhibitor MG132 and in FL-NRL transfected HEK293T. Numbers to the sides of the images in panels A and C indicate molecular mass of marker proteins (kDa). (D) pULTRA-EGFP-P2A-Tr-NRL lentiviral vector used for explanted retina transduction. (E) NRL Immunofluorescent staining of HEK293T cells 48 hr after lentiviral transduction of Tr-NRL-GFP. Scale bar = 50 µm. (F,G) Immunostaining of total NRL (F) or N-terminal-NRL (G) in explanted FW16.5 fetal retina 7 d after lentiviral transduction of Tr-NRL-GFP. Arrows: Yellow = GFP+, NRL-. Green = GFP+ ,RXRγ+. White = GFP-, FL-NRL+. Scale bar, 25 µm.
-
Figure 3—figure supplement 2—source data 1
PDF file containing original western blots for Figure 3—figure supplement 2, indicating the relevant bands and treatments.
- https://cdn.elifesciences.org/articles/101918/elife-101918-fig3-figsupp2-data1-v1.zip
-
Figure 3—figure supplement 2—source data 2
Original files for western blot analysis displayed in Figure 3—figure supplement 2.
- https://cdn.elifesciences.org/articles/101918/elife-101918-fig3-figsupp2-data2-v1.zip
Figure 4 with 3 supplements
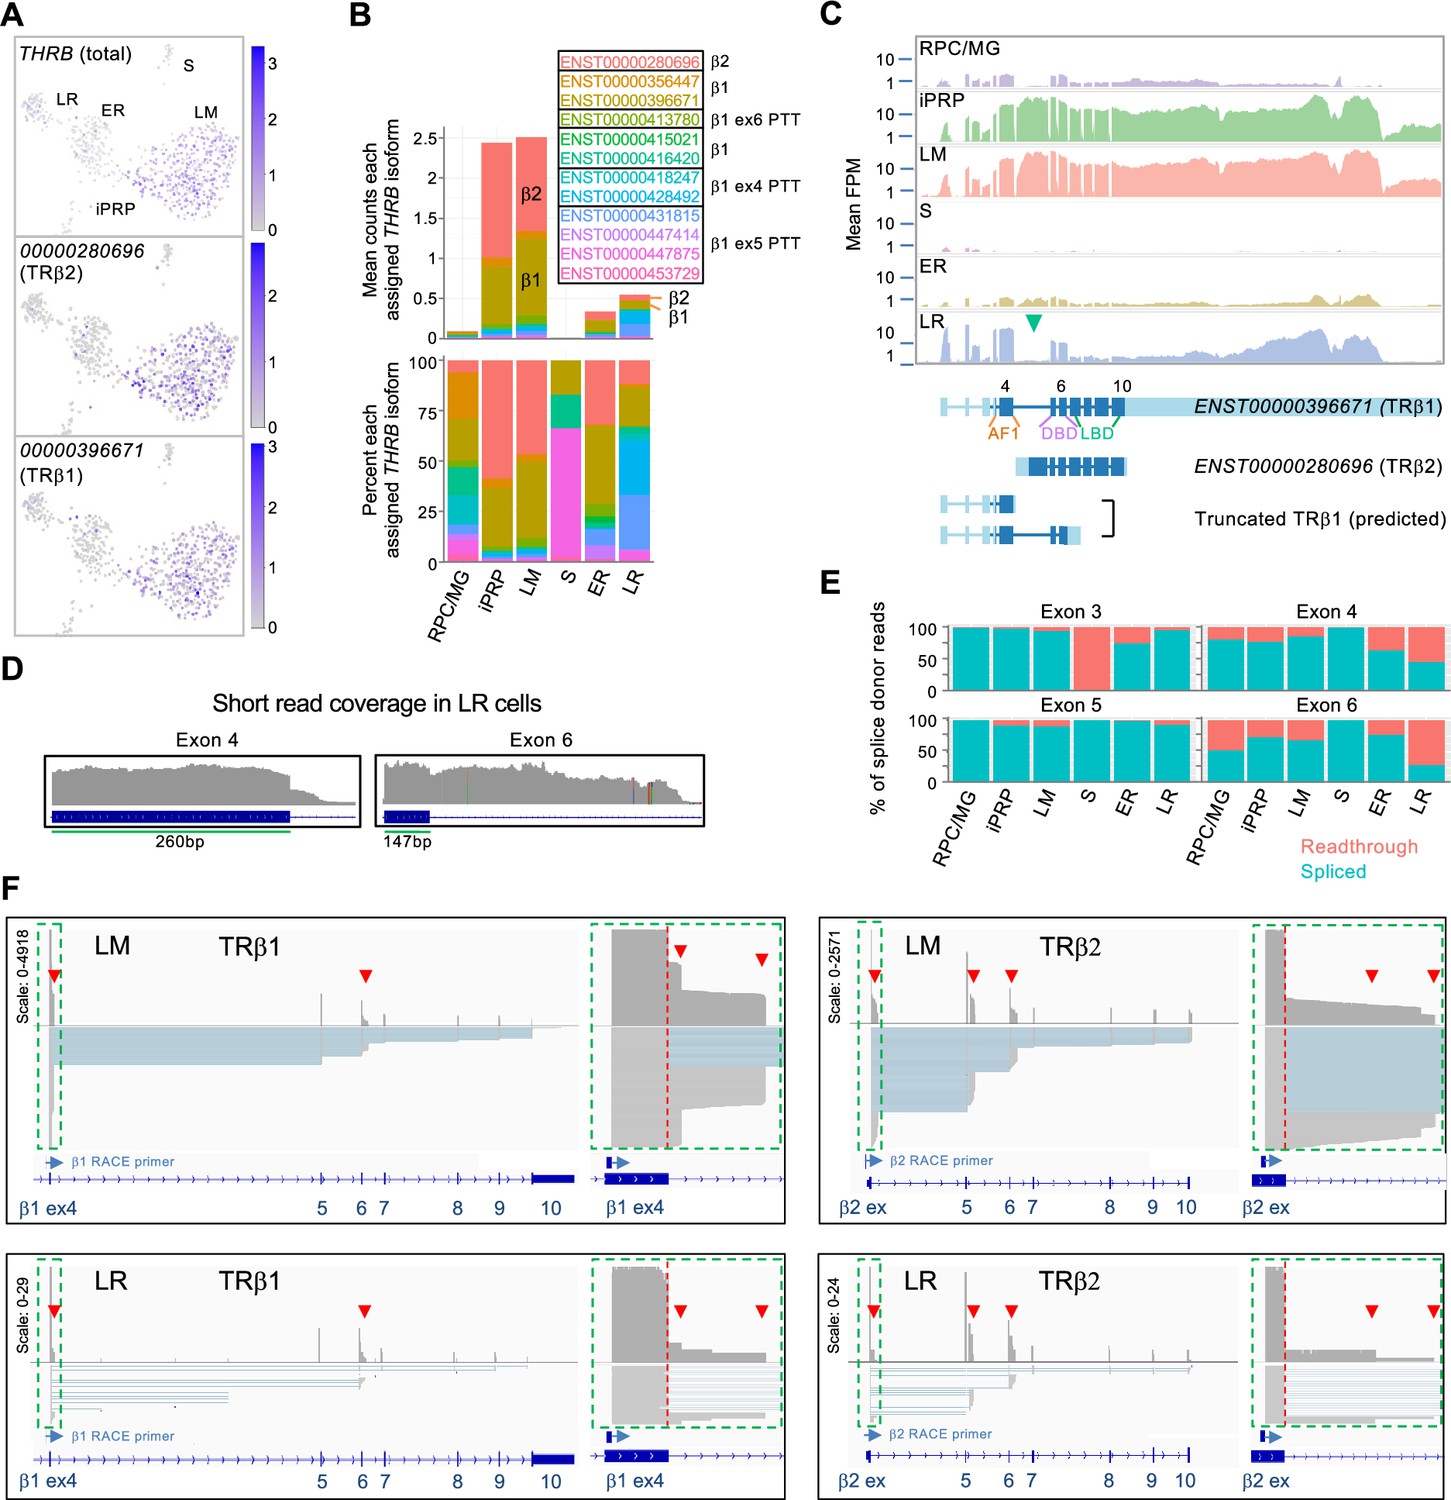
Differential expression of THRB isoforms in rod and cone precursors.
(A) Expression of THRB and highly assigned isoforms ENST00000280696 (encoding TRβ2) and ENST00000396671 (TRβ1). (B) Mean THRB isoform assignments for each cluster presented as counts (top) and percentage of counts (bottom); Ensemble transcript IDs shown in color with β2, β1, and β1 PTT isoform structures as in Figure 4—figure supplement 1. (C) Top: Mean read counts across Ensembl THRB exons. Bottom: Transcript structures for TRβ1, TRβ2, and two TRβ1 truncations. Green arrowhead: First TRβ2 exon. ENST00000396671 exon numbers are indicated above and protein domains (AF1, DNA-binding (DBD), and ligand binding (LBD)) below. (D) Read coverage for LR cells across THRB exons 4 and 6 splice donor sites. (E) Percentage of exon splice donor reads that are spliced or readthrough to the subsequent intron. (F) Long-read sequencing of pooled 3' RACE reactions initiated with exon 4 (left) or TRβ2 exon 1 (right) performed on cDNA libraries from 21 LM cells (top) and 5 LR cells (bottom). Schematics show total coverage (above) and individual transcripts (below). TRβ1 and TRβ2 first exons (green boxes) are enlarged at right. Red arrowheads: intronic premature transcription termination (PTT).
Figure 4—figure supplement 1
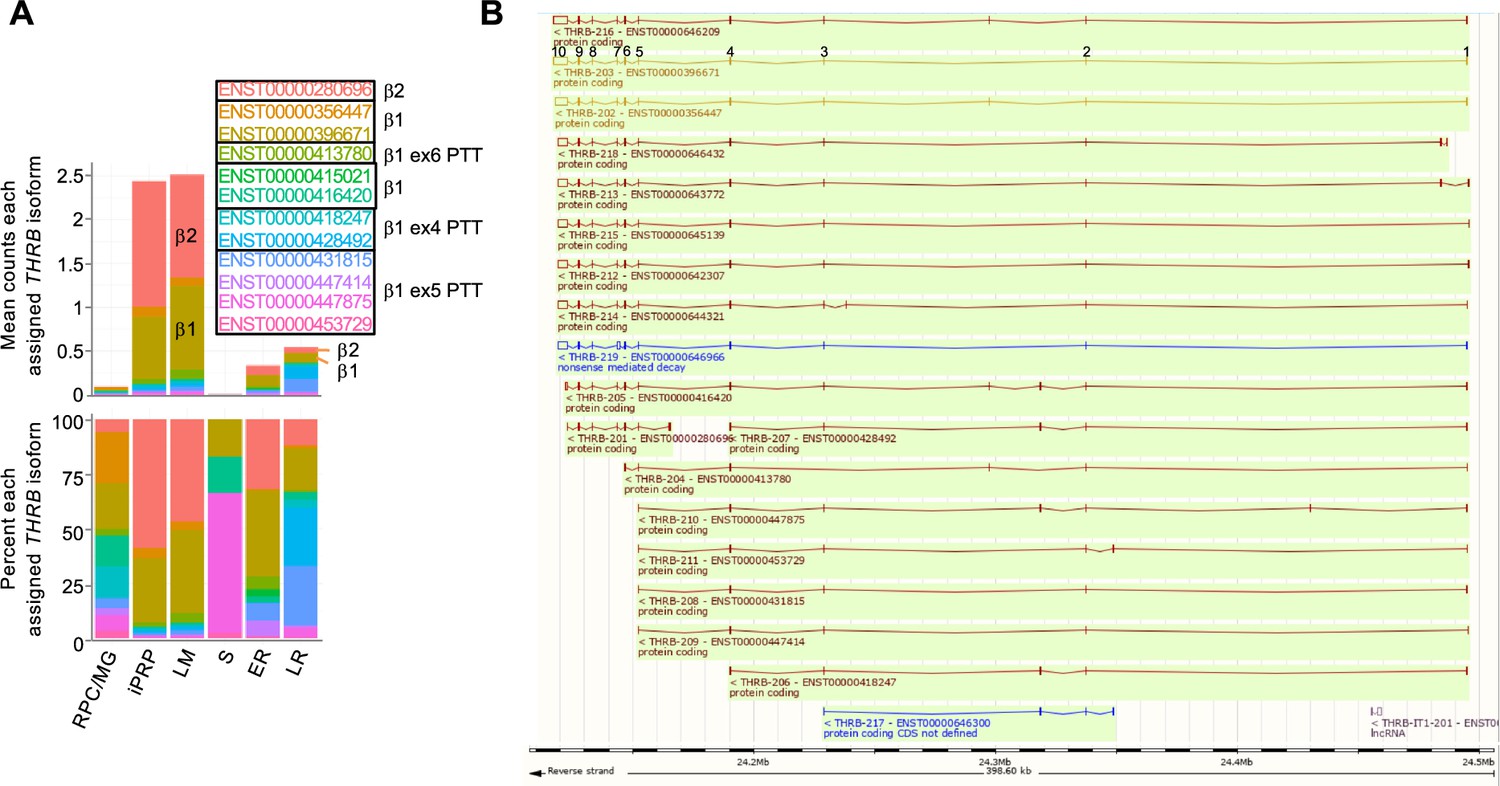
Differential THRB isoform assignments in rod and cone precursors.
(A). Mean THRB isoform assignments for each cluster presented as total transcript counts (top) and percentage of total counts (bottom) as in Figure 4B, with isoforms grouped according to capacity to encode full-length canonical TRβ1 or TRβ2 or to have PTT following ex4, ex5, or ex6 (exons numbered as for ENST00000396671) regardless of differences in 5' noncoding exons and 3' poly(A) sites. (B) THRB Ensemble isoforms identified in panel A with ENST00000396671 exon numbers indicated, accessed June 22, 2024, at: http://useast.ensembl.org/Homo_sapiens/Gene/Summary?g=ENSG00000151090;r=3:24117153-24495756.
Figure 4—figure supplement 2
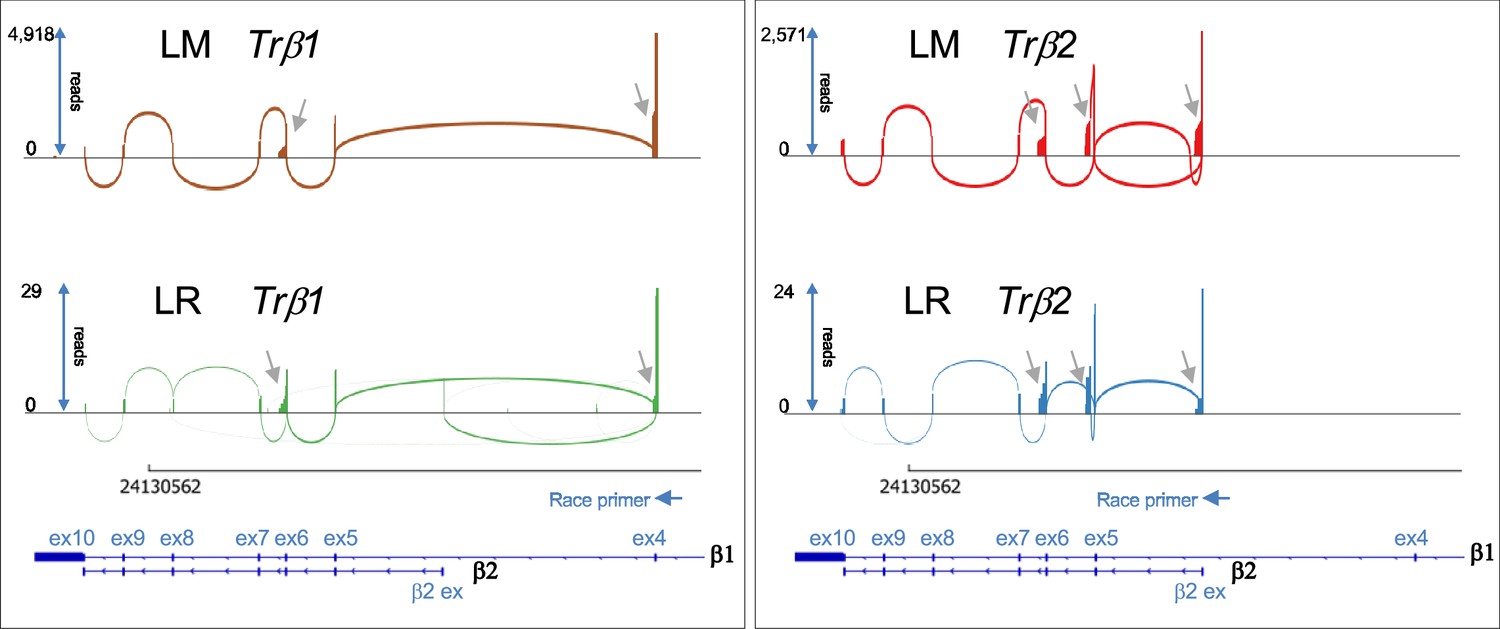
THRB isoforms and premature transcription termination in cone and rod precursors.
Top: Sashimi plots of THRB transcript splicing based on long read nanopore sequencing of 3' RACE reactions from 23 LM cells and 5 LR cells. RACE reactions were initiated from primers specific to TRβ1 exon 4 (left) or specific to the unique TRβ2 exon (right). Gray arrows: premature transcription termination following TRβ1 exon 4, the TRβ2 first exon, the shared exon 6, and a novel exon used solely in TRβ2 transcripts. Bottom: TRβ1 and TRβ2 exon structures and RACE primer positions. The THRB gene is oriented relative to chromosome 3 coordinates.
Figure 4—figure supplement 3
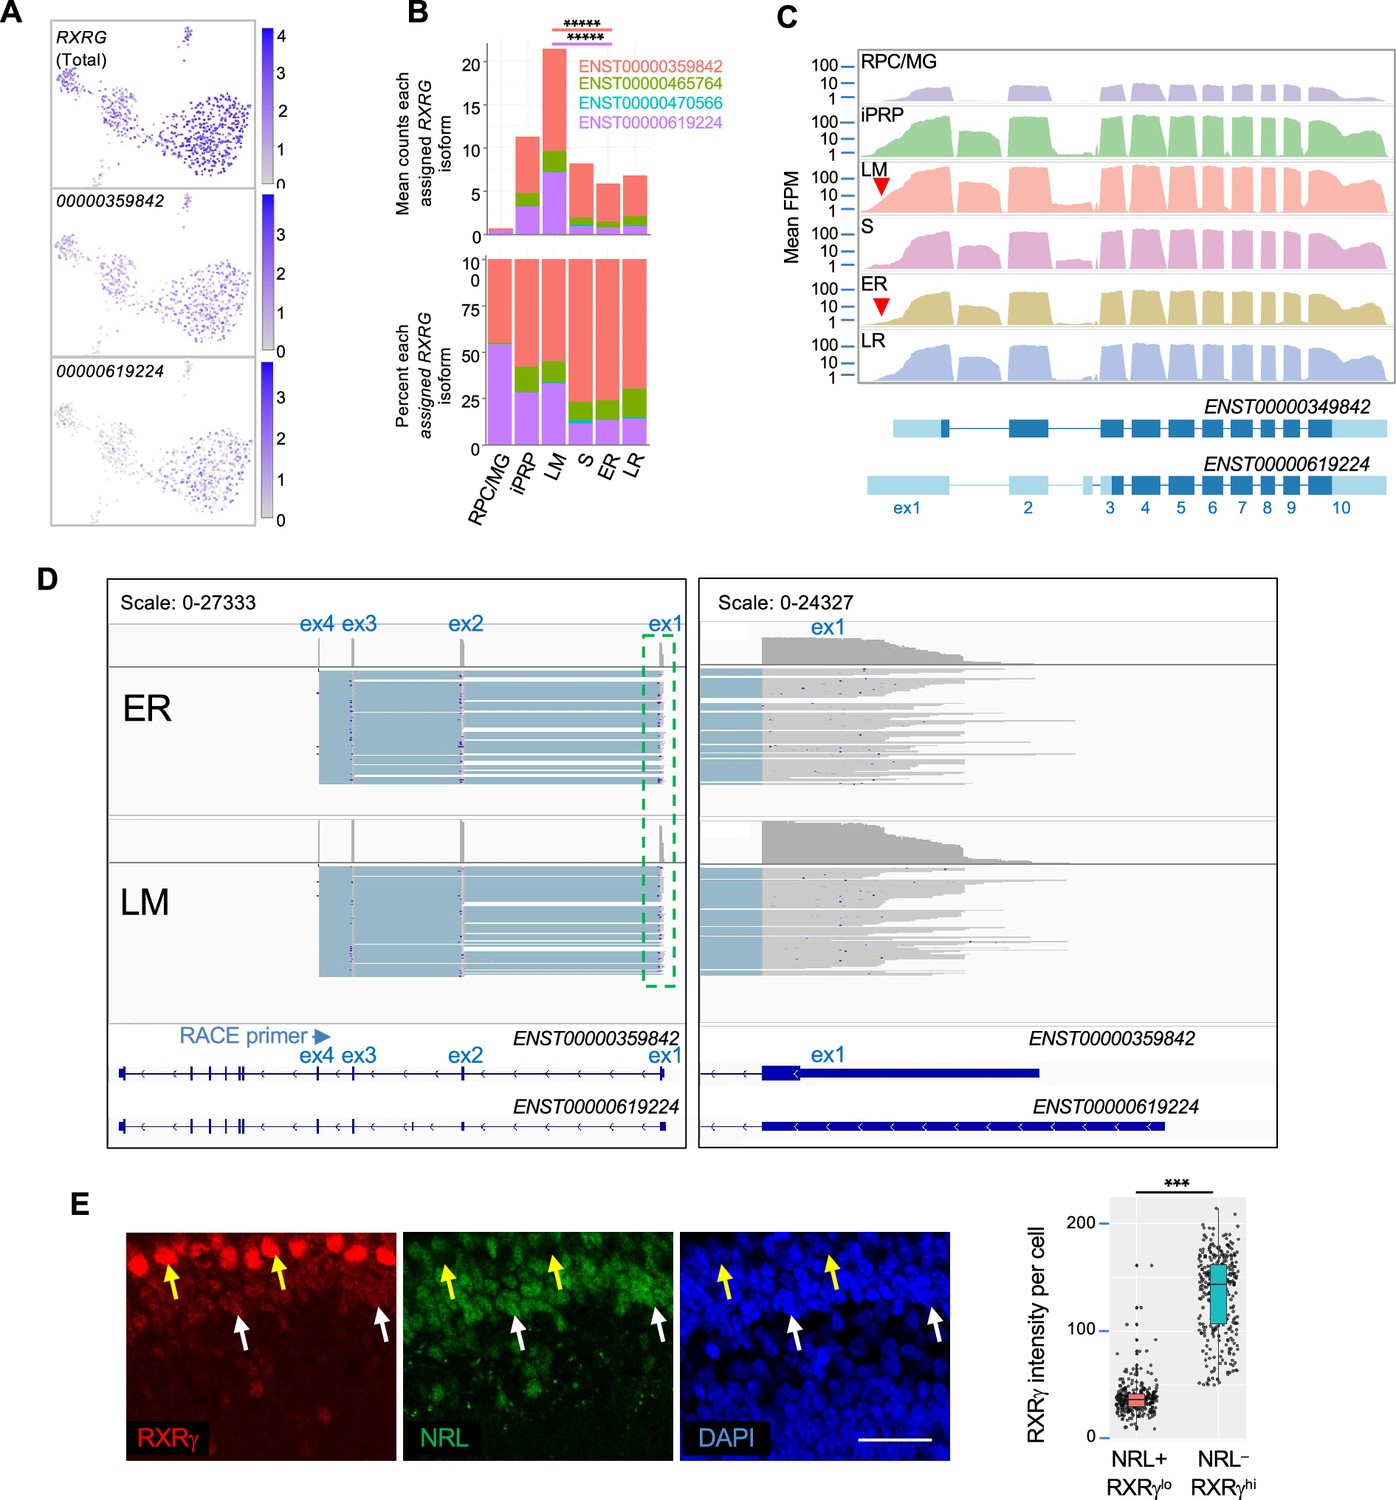
RXRG isoform expression in rod and cone precursors.
(A) Expression of RXRG and the two most highly assigned RXRG isoforms (ENST00000359842 and ENST00000619224). (B) Mean RXRG isoform assignments for each cluster presented as total counts (top) and as a percentage of total counts (bottom). Lines indicate significant LM vs. ER fold change, colored by isoform. *****, p<0.000001 (bootstrapped Welch’s t-test). (C) Top: Mean read counts across Ensembl RXRG exons. Bottom: Structures for ENST00000359842 and ENST00000619224. Red arrowheads: Extended RXRG 5' UTR. (D) Long-read nanopore sequencing of pooled 5' RACE initiated with RXRG exon 4 primers from 23 ER cells (top) and 21 LM cells (bottom). The schematic shows total exon coverage (above) and individual transcripts (below). Panels at left show RXRG locus with exon 1 in green box enlarged at right, revealing a similar range of RNA 5' ends in ER and LM populations. (E) Immunohistochemical analysis of RXRγ and NRL in FW16 retina. Arrows: Yellow = RXRγ-high cone. White = NRL + rod with weak RXRγ. Scale bar = 25 µm. Right: Boxplot of RXRγ mean gray values in NRL+,RXRγlo and NRL–,RXRγhi cells. ***, p<0.0001 (Welch’s T-test).
Figure 5 with 3 supplements
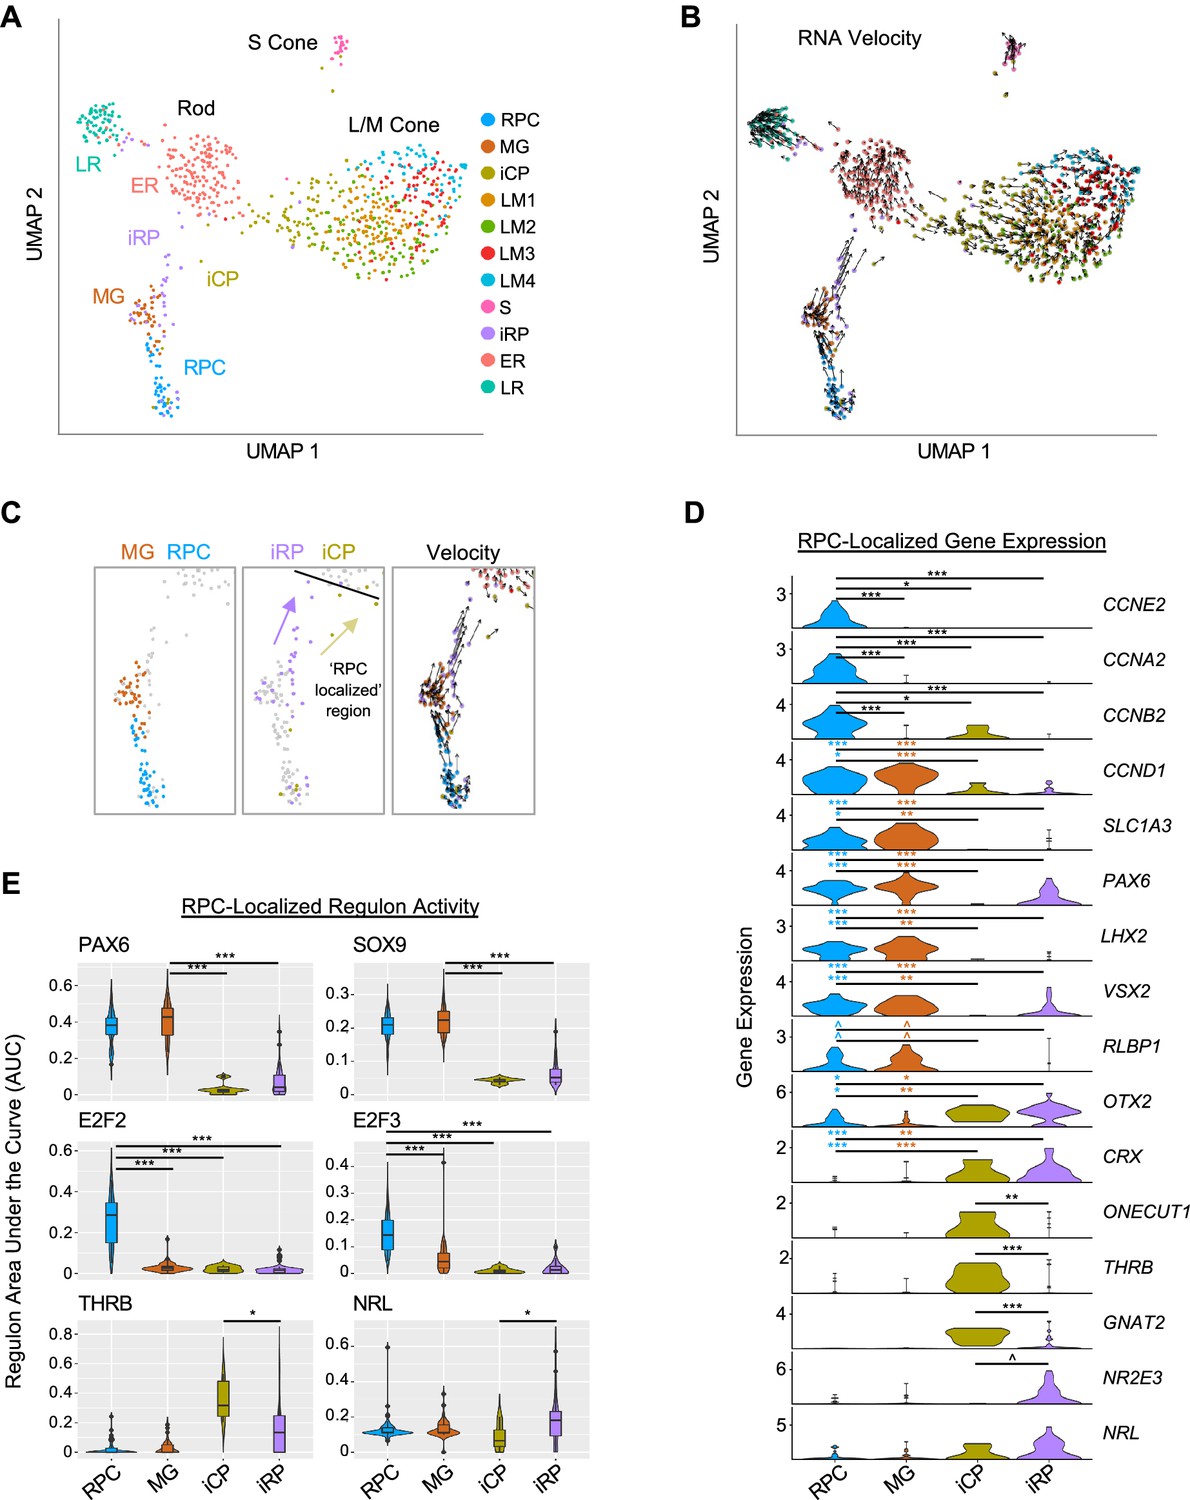
Two post-mitotic photoreceptor precursor populations expressing rod or cone markers.
(A) UMAP plot colored by high resolution clusters. (B) RNA velocity plots with cell clusters as in A. (C) Enlarged view highlighting RPC and MG clusters (left), RPC-localized iCP and iRP clusters (middle), and RNA velocity (right). Black line: limit of RPC-localized region. Arrows depict inferred trajectories. (D) Violin plots depict expression of selected genes in RPC, MG, and RPC-localized iCP and iRP cells. Colored asterisks compare clusters of the same color to the cluster at the right of the line. (E) SCENIC regulon violin and box plots for RPC-localized cells in each cluster, selected from most specific regulons for MG, RPC, ER, and LM clusters. ^, pAdj <0.1; *, <0.05; **, <0.005; ***, <0.0005 (post-hoc Dunn test).
Figure 5—figure supplement 1
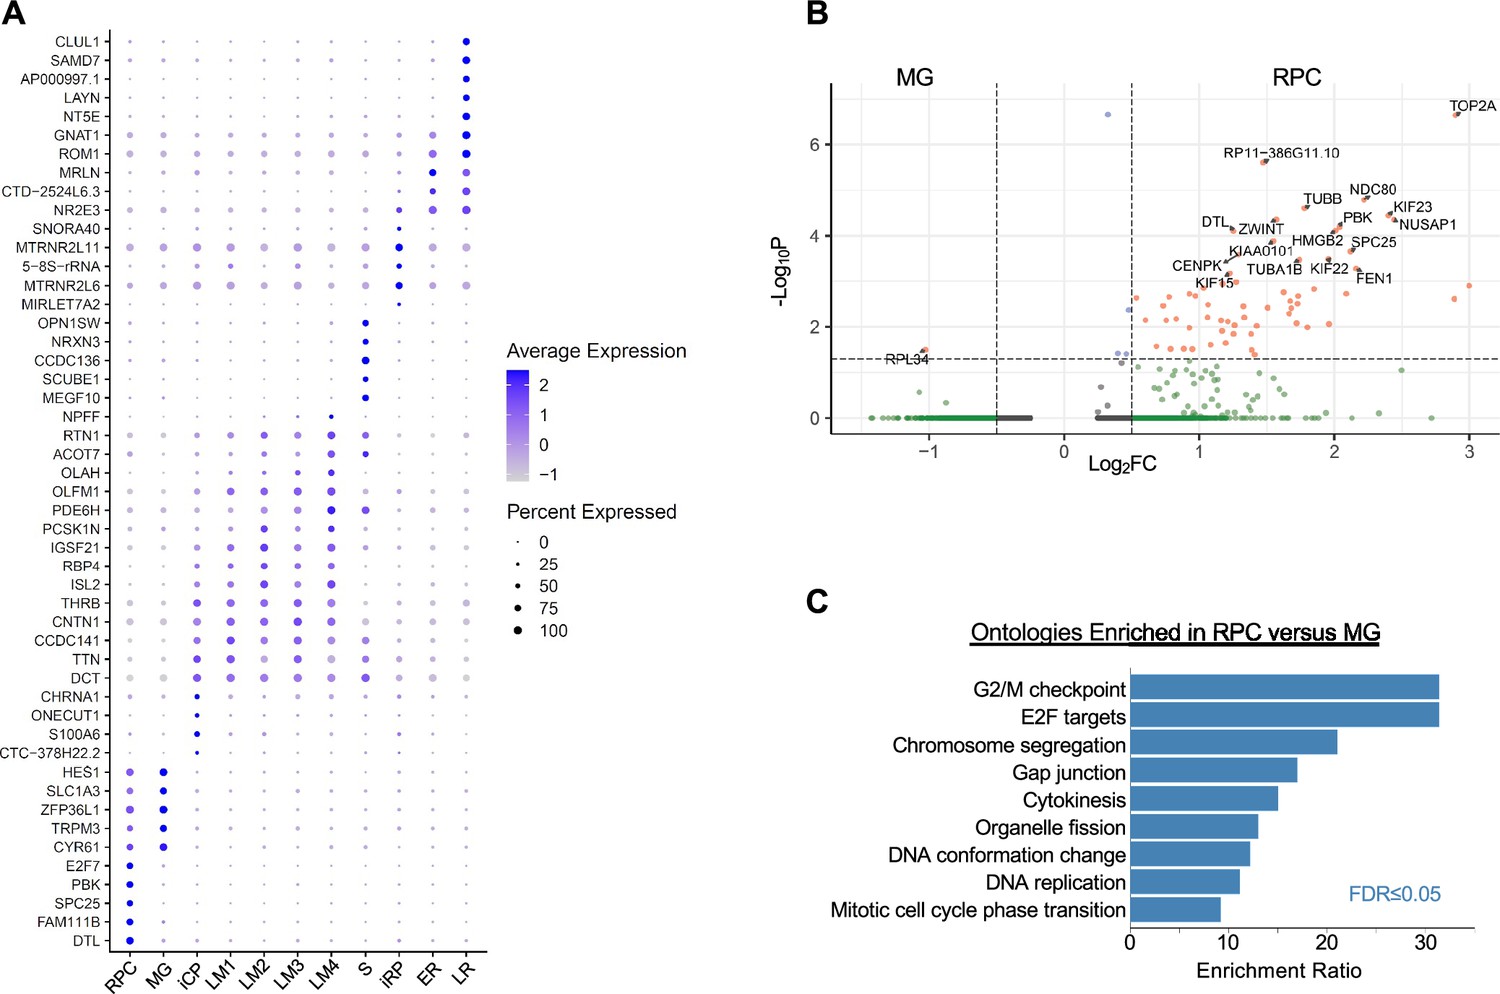
High-resolution cluster marker genes and differential RPC versus MG gene expression.
(A) Marker gene dot plot for high resolution Louvain clusters. Dot size: Percent of cells expressing gene. (B) Volcano plot of differential expression (pAdj <0.05, log2FC >|0.5|) between MG and RPC clusters with genes labeled when p < 10–4 except for RPL34. (C) Overrepresentation analysis for genes upregulated in RPC above pAdj and log2FC cutoff.
Figure 5—figure supplement 2
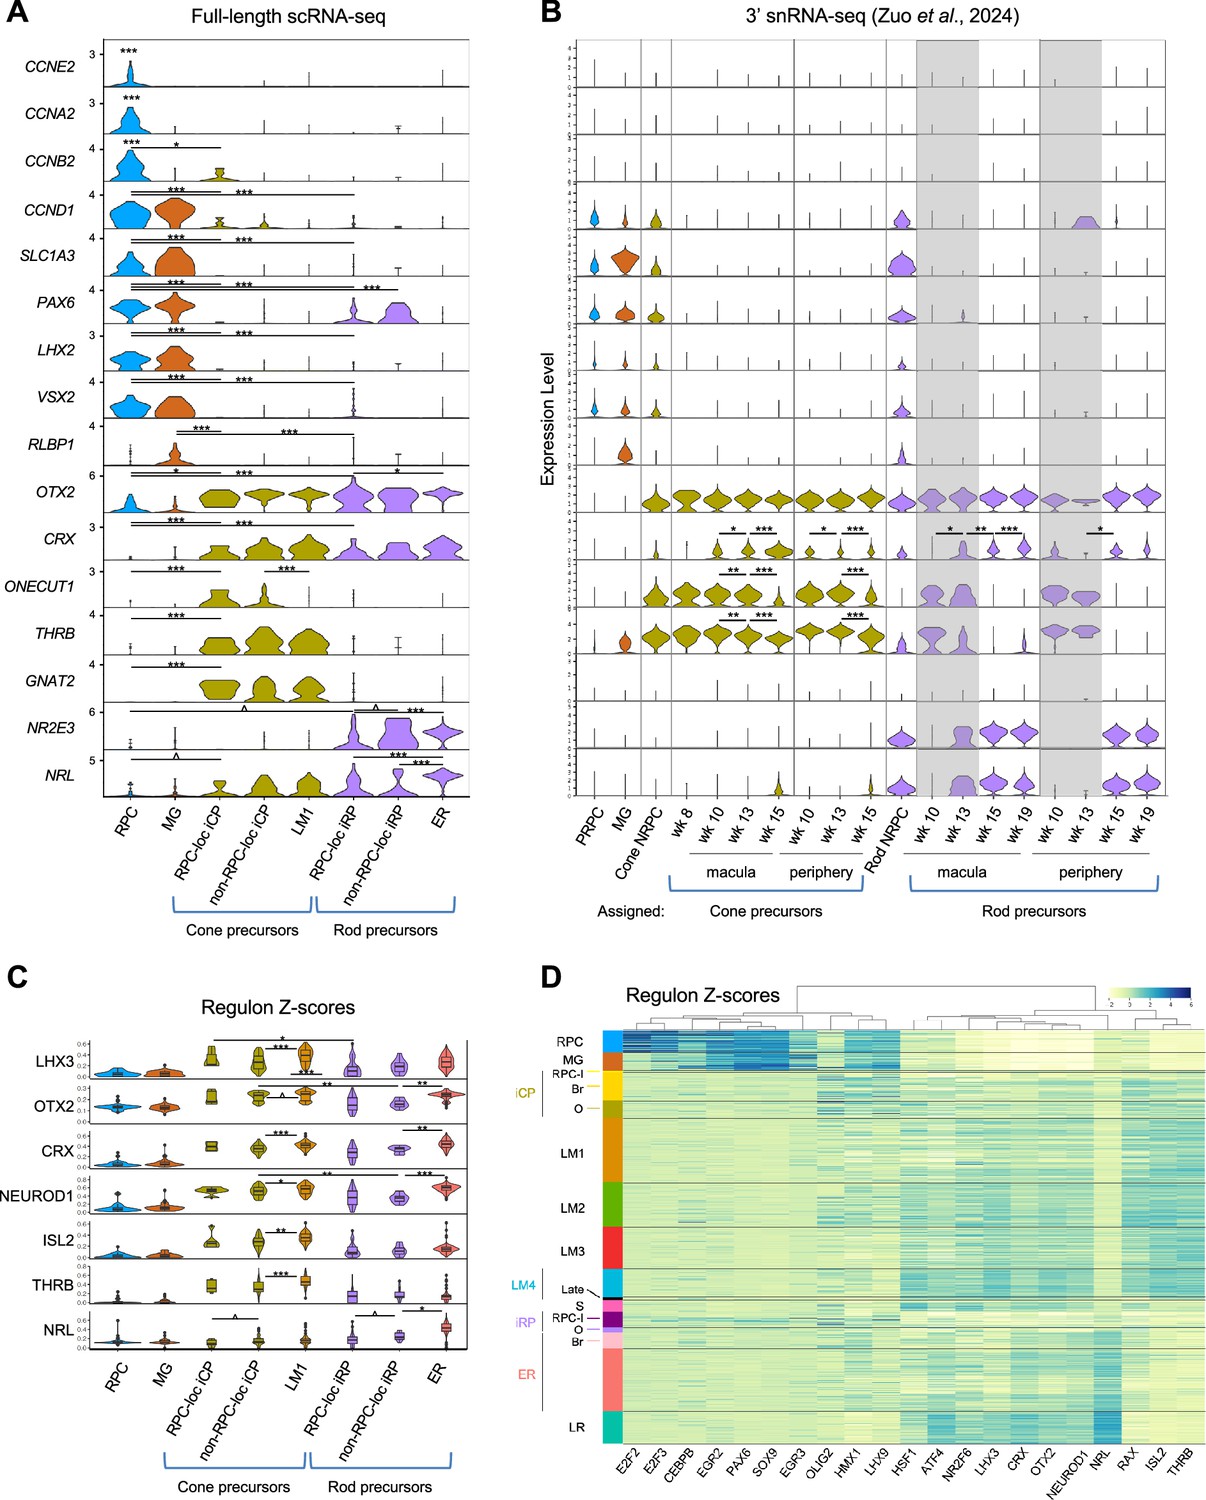
Immature photoreceptor precursor populations identified with deep full-length scRNA-seq and 3' snRNA-seq.
(A) Violin plots based on full-length scRNA-seq depicting gene expression in RPCs, MG, RPC-localized and non-RPC-localized iCPs and iRPs, and the early maturing LM1 cone and ER clusters as designated in Figure 5A and C. (B) Violin plots based on 3' snRNA-seq depicting expression of the same genes as in (A) in PRPCs, MG, cone- and rod-fated NRPCs, and cone and rod precursors at the indicated ages and macular versus peripheral retinal positions as designated in Zuo et al., 2024. Gray boxes = potential mixed cone plus rod precursor populations as shown in Figure 11. (C,D) Regulon activities based on full-length scRNA-seq in high-resolution RPC and photoreceptor precursor states. (C) Violin plot depicting selected Z-score normalized regulon activities in the indicated cell populations. Significant differences (p<0.05) between corresponding iCP and iRP states are indicated for pan-photoreceptor regulons LHX3, OTX2, CRX, and NEUROD1, and significant differences between successive iCP – LM1 and iRP – ER states are indicated for all regulons. Activities of all regulons except NRL also increased in RPC-localized iCPs and iRPs relative to RPCs (p<0.05 for all). (D) Ward-clustered heatmap of the highest scoring SCENIC regulons in each high-resolution cluster, displaying Z-score normalized regulon activities. Subcluster labels: RPC-l=RPC-localized, Br = Bridge-localized, O=Other/remainder of original cluster, Late = late-maturing LM4 cones. ^<0.1; *,<0.05; ** ,<0.005; ***,<0.0005 (post-hoc Dunn test).
Figure 5—figure supplement 3
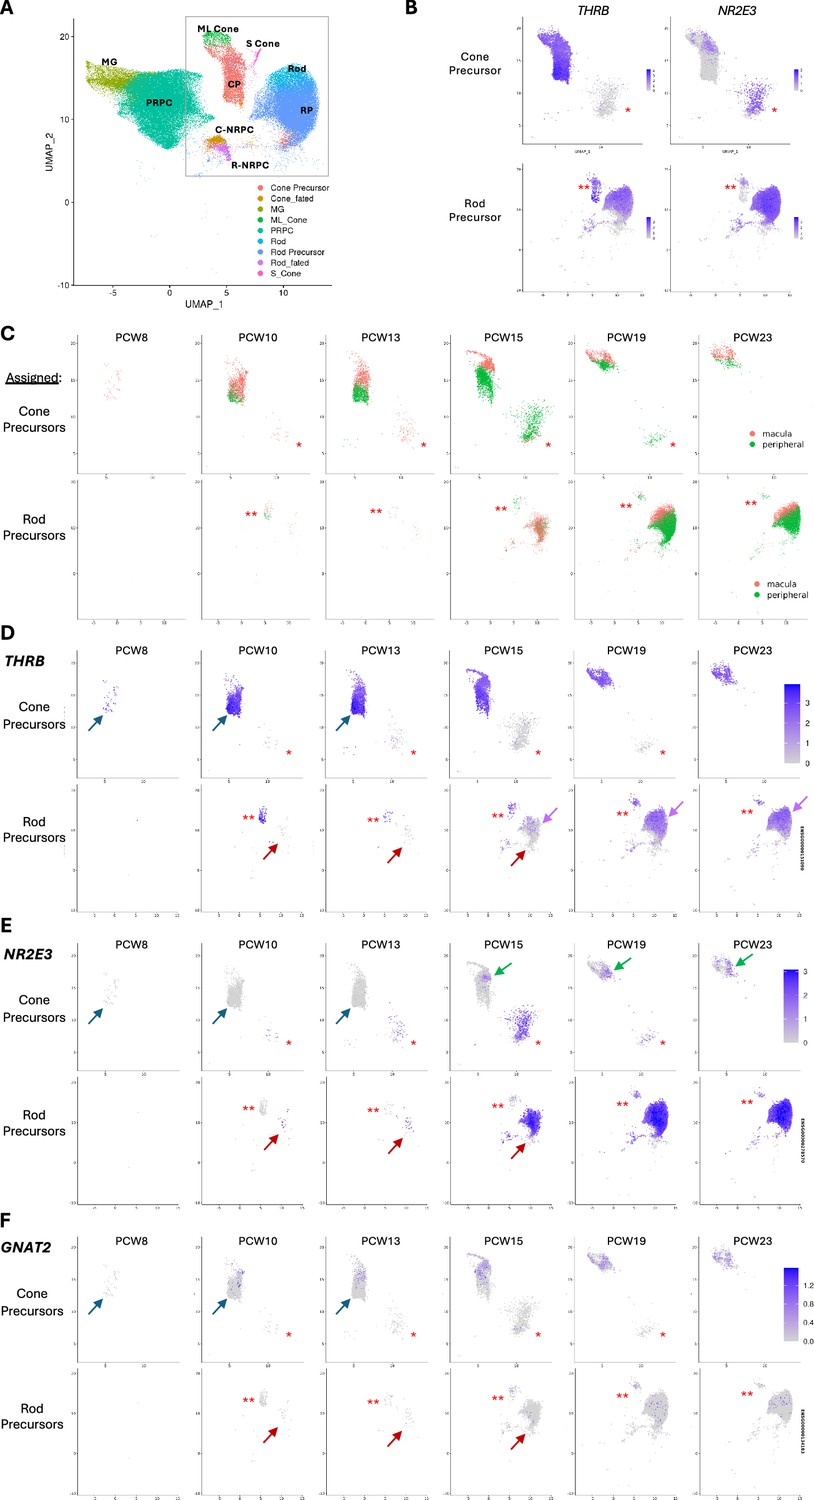
Cone and rod precursor cell type assignments, UMAP positions, and gene expression in a large 3' snRNA-seq analysis.
(A) UMAP positions of cell populations as assigned in Zuo et al., 2024. MG = Muller glia; PRPC = primary retinal progenitor cells; C- and R-NRPC = cone and rod neurogenic retinal progenitor cells, CP = cone precursor, RP = rod precursor. Box = region enlarged in Cone Precursor UMAP plots in panels B-F. (B) Expression of THRB and NR2E3 overlaying UMAP plots of pcw 8–23 cone or rod precursors. *=possible rod precursors mis-assigned as cone precursors based on UMAP position, high NR2E3, and minimal THRB. **=possible cone precursors mis-assigned as rod precursors based on UMAP position, high THRB, and low NR2E3. (C) UMAP plots of assigned cone and rod precursors in macula (orange) and peripheral retina (green) at each age. (D-F) Expression of THRB (D), NR2E3 (E), and GNAT2 (F) overlaying UMAP plots of assigned cone or rod precursors at each age. Blue arrows = major cone precursor population at pcw 8, 10, 13 expressing THRB but not NR2E3. Red arrows = major rod precursor population at pcw 10, 13, 15 expressing NR2E3 but not THRB. Purple arrows = later rod precursors with THRB co-expression at pcw 15, 19, 23. Green arrows = later cone precursors with NR2E3 co-expression at pcw 15, 19, 23. Scale bars at right apply to all plots in each panel. Asterisks in (C-F) are as in panel (B).
Figure 6
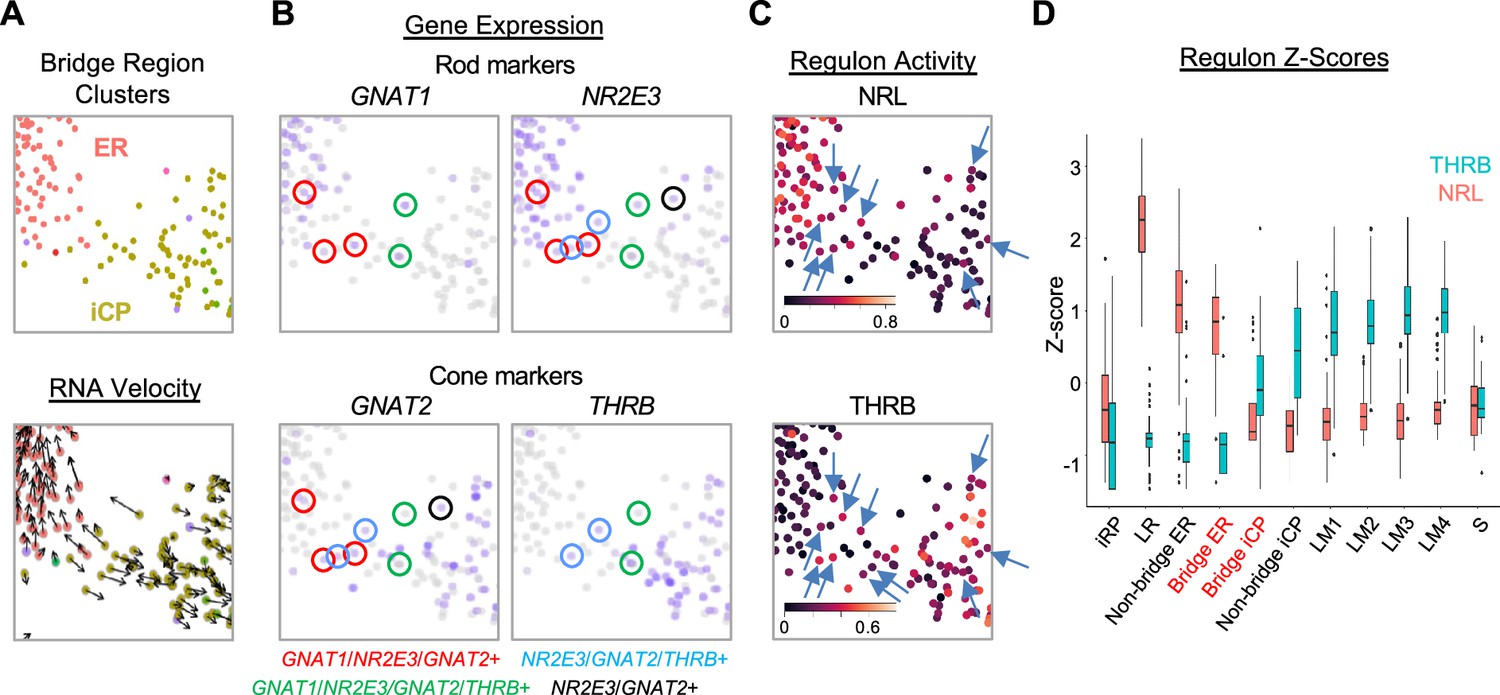
An iCP sub-population with cone- and rod-related RNA co-expression.
(A–C) UMAP ‘bridge’ region cells colored by ER and iCP cluster and RNA velocity (A), rod and cone marker gene expression (B), and NRL and THRB regulon activity (C, arrows indicate cells with both regulon signals). (D) Box plot of Z-score-normalized NRL and THRB regulon AUCs for each cluster; Bridge ER and Bridge iCP represent cells present in the UMAP region in panels (A-C).
Figure 7 with 1 supplement
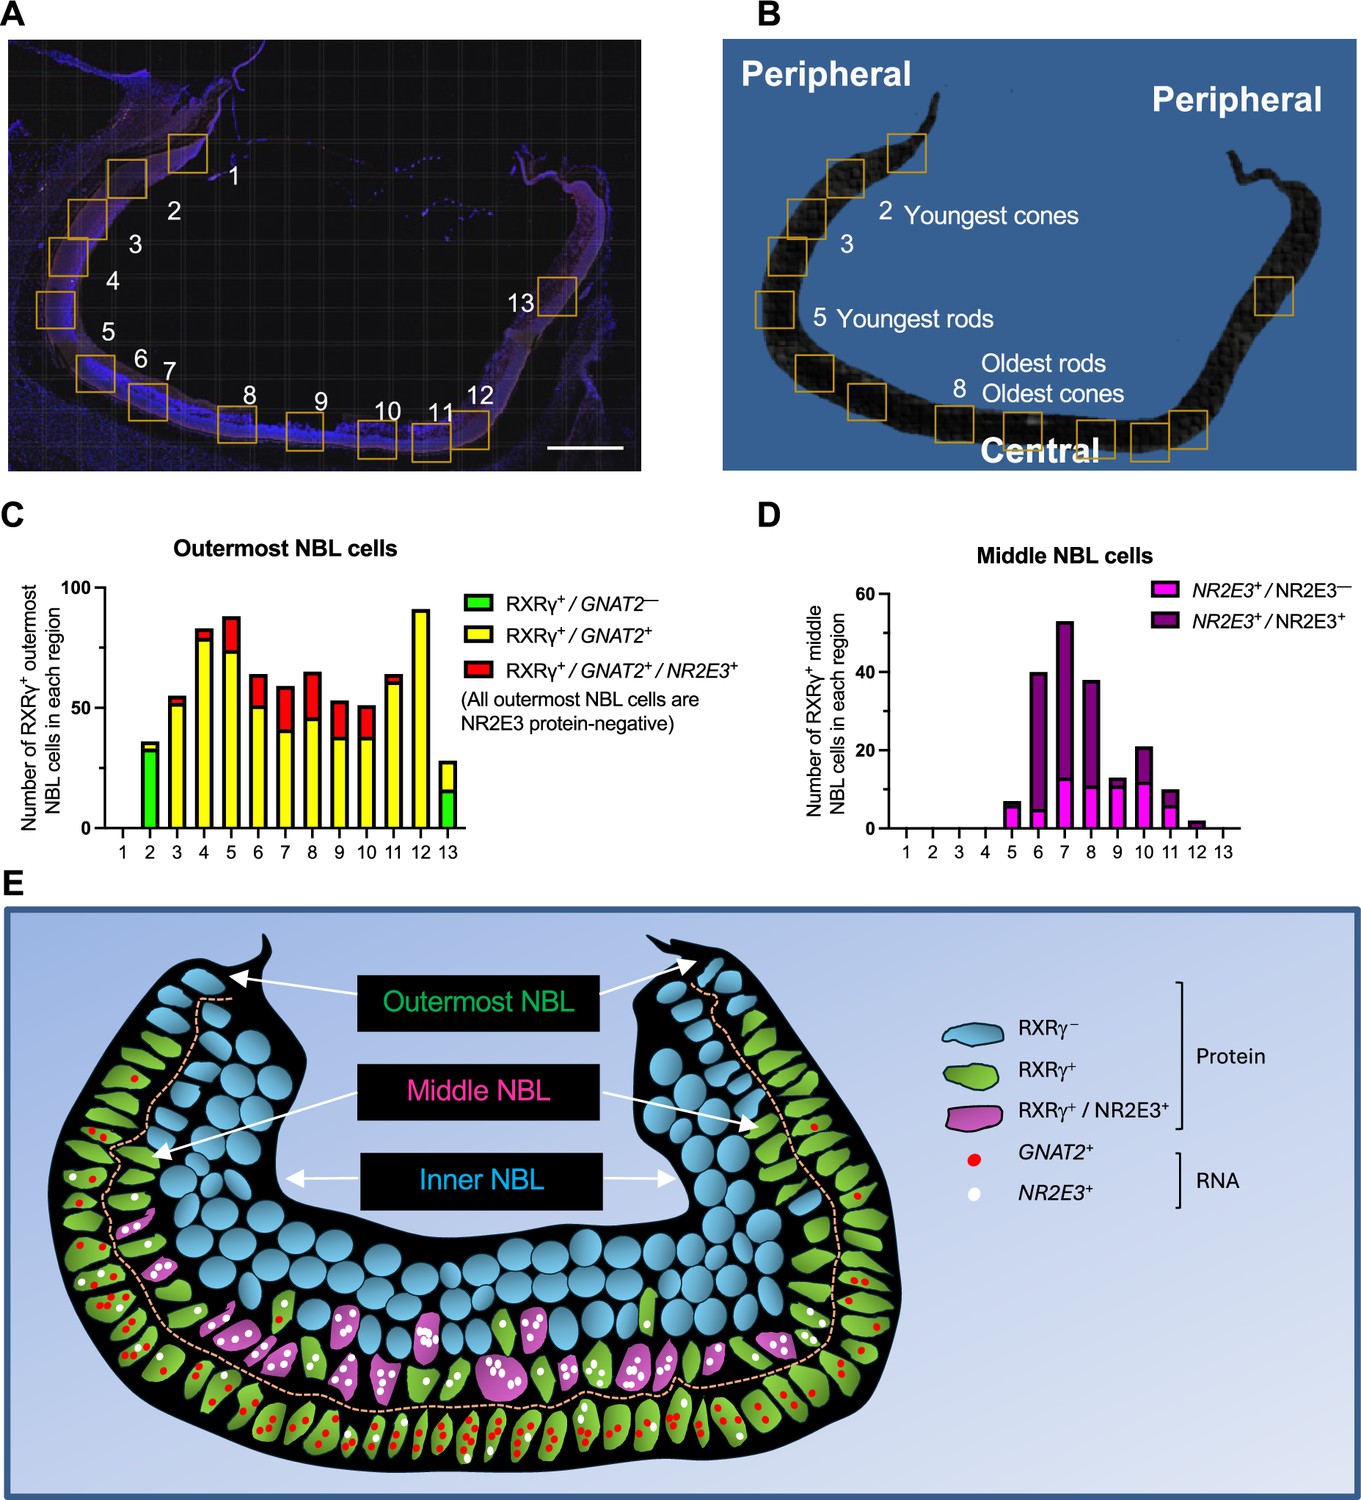
Cone-related GNAT2 and rod-related NR2E3 RNA co-expression in human cone precursors.
(A, B) Tiled composite fluorescence image of FW14 retinal section after immunofluorescence staining of RXRγ and NR2E3 and RNA FISH of GNAT2 and NR2E3 (A) and diagram of the same section indicating the most peripheral (i.e., youngest and least mature) and most central (i.e., oldest and most mature) rods and cones (B). Scale bar in A = 500 µm. Boxes indicate regions further evaluated as shown in Figure 7—figure supplement 1 and quantitated in panels C and D. (C, D). Quantitation of (C) outermost and (D) middle (i.e. sub-outermost) NBL photoreceptor precursors expressing combinations of RXRγ and NR2E3 proteins and GNAT2 and NR2E3 RNAs (n.b., italics are used for RNAs, non-italics for proteins). (E) Patterns of GNAT2 and NR2E3 RNA and RXRγ and NR2E3 protein expression inferred from in situ hybridization and immunofluorescence staining. RXRγ is expressed in the outermost NBL starting in the far periphery, consistent with cone precursors, and in middle NBL cells, starting more centrally, consistent with rod precursors. GNAT2 and NR2E3 RNA co-expression in outermost NBL cells lacked NR2E3 protein, representing putative cone precursors. RXRγ+ retinal ganglion cells in the inner NBL and ganglion cell layer are not shown.
Figure 7—figure supplement 1
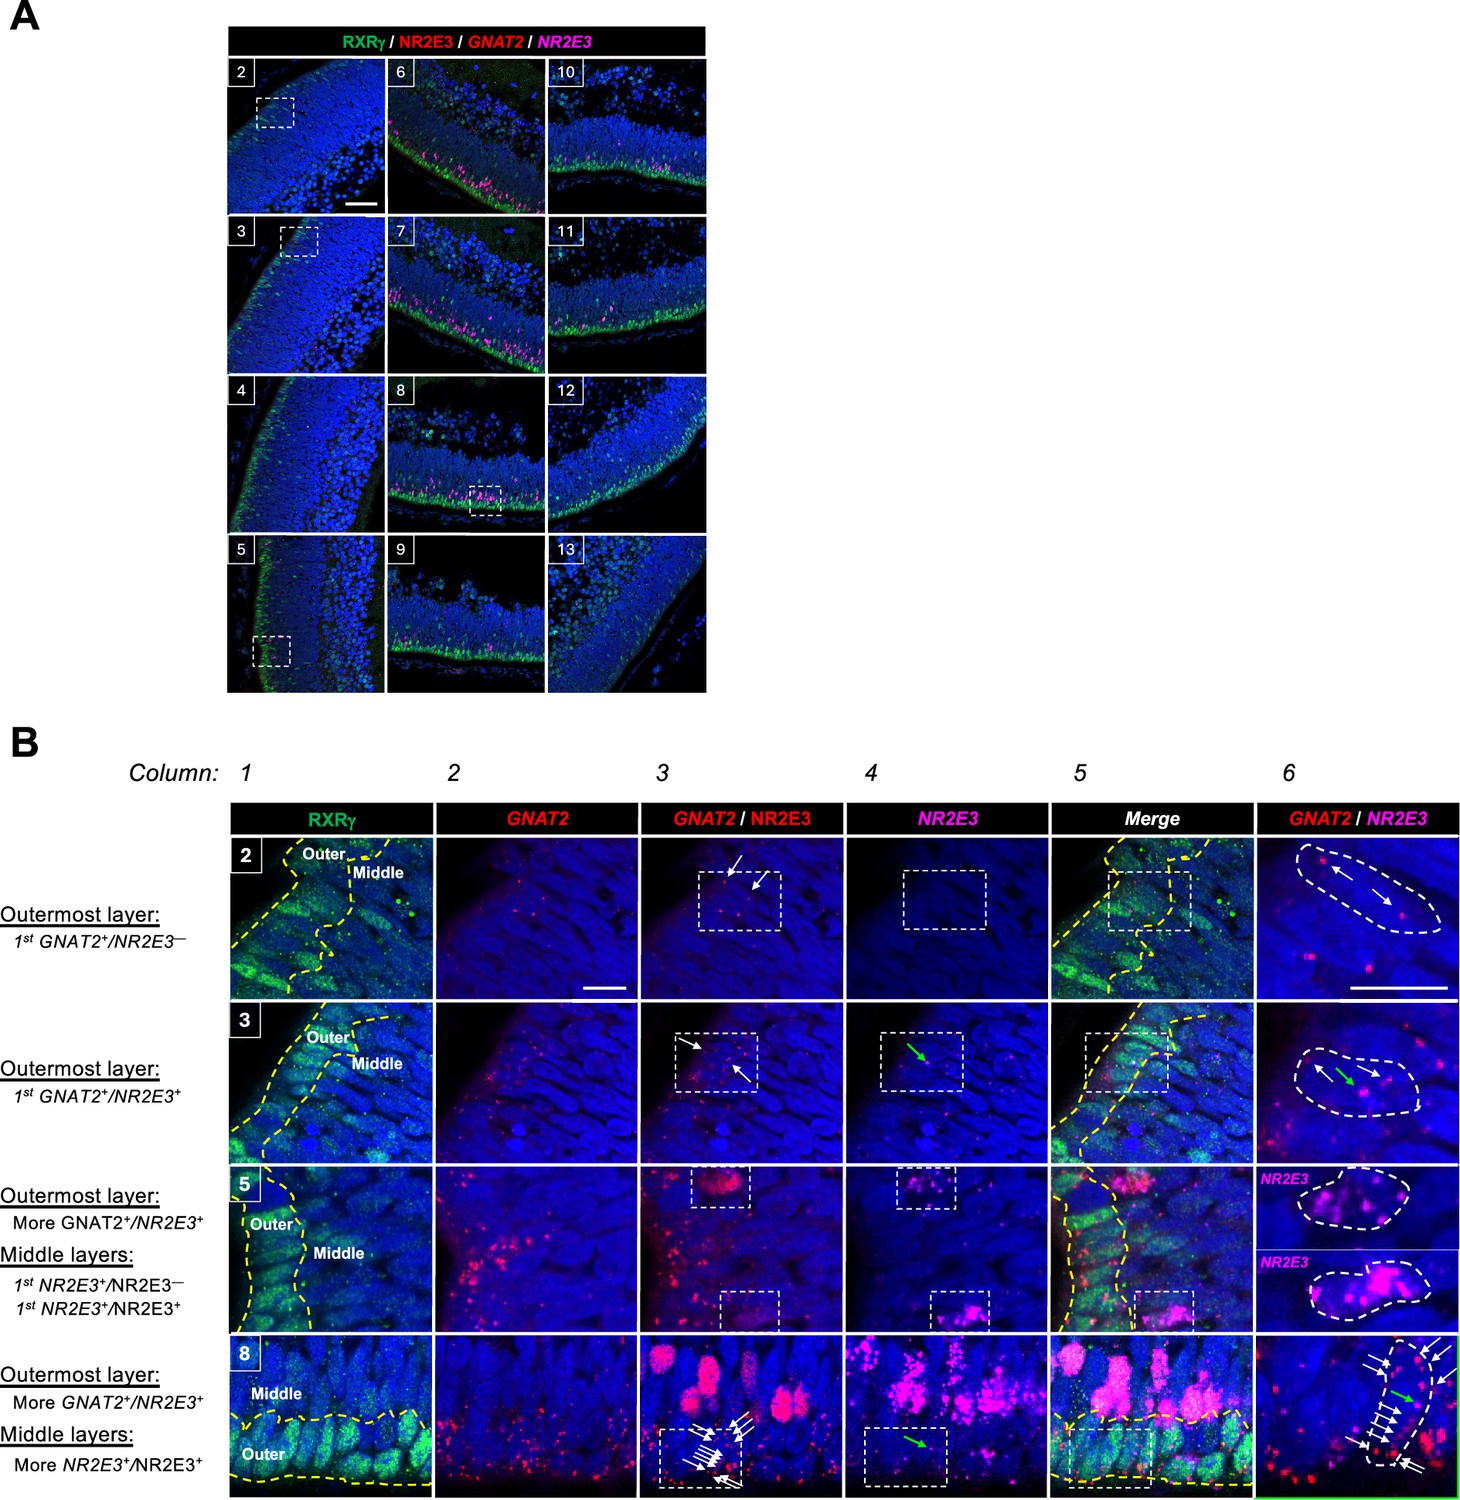
NR2E3 and GNAT2 co-expression in photoreceptor precursors.
(A) Composite images of combined RXRγ and NR2E3 immunofluorescence staining and GNAT2 and NR2E3 RNA FISH in boxed regions 2–13 of Figure 7A. Scale bar = 50 µm. (B) Enlarged images of boxed regions in Figures 2, 3, 5 and 8 in panel A, as indicated at upper left of images in column 1. Dotted yellow lines demarcate the outermost and middle (sub-outermost) NBL cells analyzed separately in Figure 7C and D. White arrows = GNAT2 puncta in boxed regions of interest. Green arrows = NR2E3 puncta. Boxed regions in column 3 (GNAT2 RNA plus NR2E3 protein) and column 4 (NR2E3 RNA) are enlarged in column 6 (GNAT2 RNA plus NR2E3 RNA) and illustrate (region 2) initial expression of GNAT2 RNA without NR2E3 RNA in outermost NBL nascent cones; (region 3) initial co-expression of GNAT2 and NR2E3 RNA in early outermost NBL cones; (region 5) initial expression of NR2E3 RNA with or without co-expressed NR2E3 protein; and (region 8) co-expression of high GNAT2 and low NR2E3 RNA without NR2E3 protein in RXRγhi outermost NBL cones. Scale bars in columns 2 and 6 = 10 µm.
Figure 8 with 2 supplements
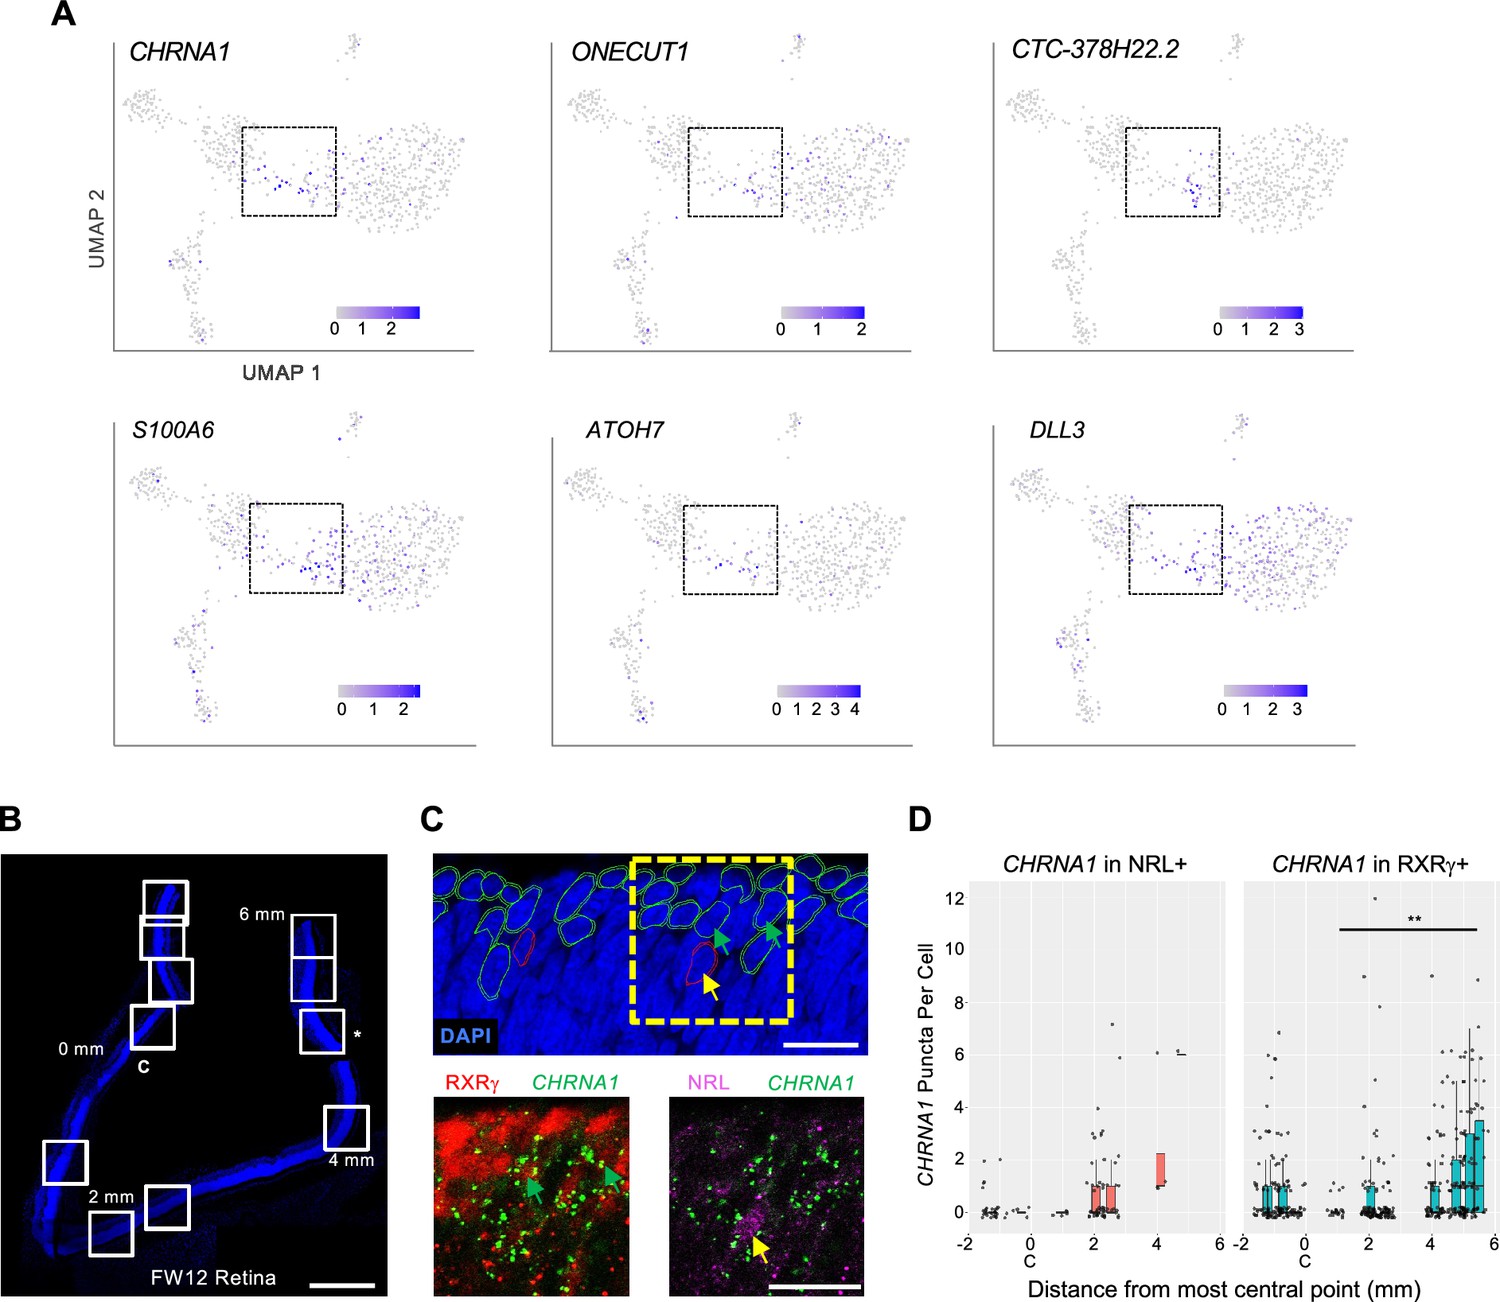
Developmental expression of early cone and rod precursor markers.
(A) UMAP plots of iCP marker genes CHRNA1, ONECUT1, CTC-378H22.2, and S100A (see Figure 5—figure supplement 1A) and previously identified photoreceptor precursor markers ATOH7 and DLL3. (B–D) Combined RXRγ/NRL immunohistochemical staining and CHRNA1 RNA FISH of FW12 retina. (B) Tiled images of retina section with nuclei stained with DAPI. White boxes: fields used for quantitative fluorescent imaging. Distances along apical edge of tissue marked in mm from midpoint of central image (0 mm, C). *: Imaged region shown in C. Scale bar = 500 µm. (C) Top: Retinal nuclear and cellular segmentation and identification of cells as RXRγ+ (green outline) or NRL+ (red outline). Yellow box: Field shown below. Bottom: RXRγ or NRL immunofluorescence staining with CHRNA1 FISH. Arrows: RXRγ+, CHRNA1+ (green), NRL+, CHRNA1+ (yellow). Scale bars = 15 µm. (D) Quantitation of fluorescent puncta in RXRγ+ and NRL+ cells by image field. X-axis: Distance from the midpoint of each image to retina center (0 mm, C). **, p<0.005 (Wald test, images from 0 to 6 mm).
Figure 8—figure supplement 1
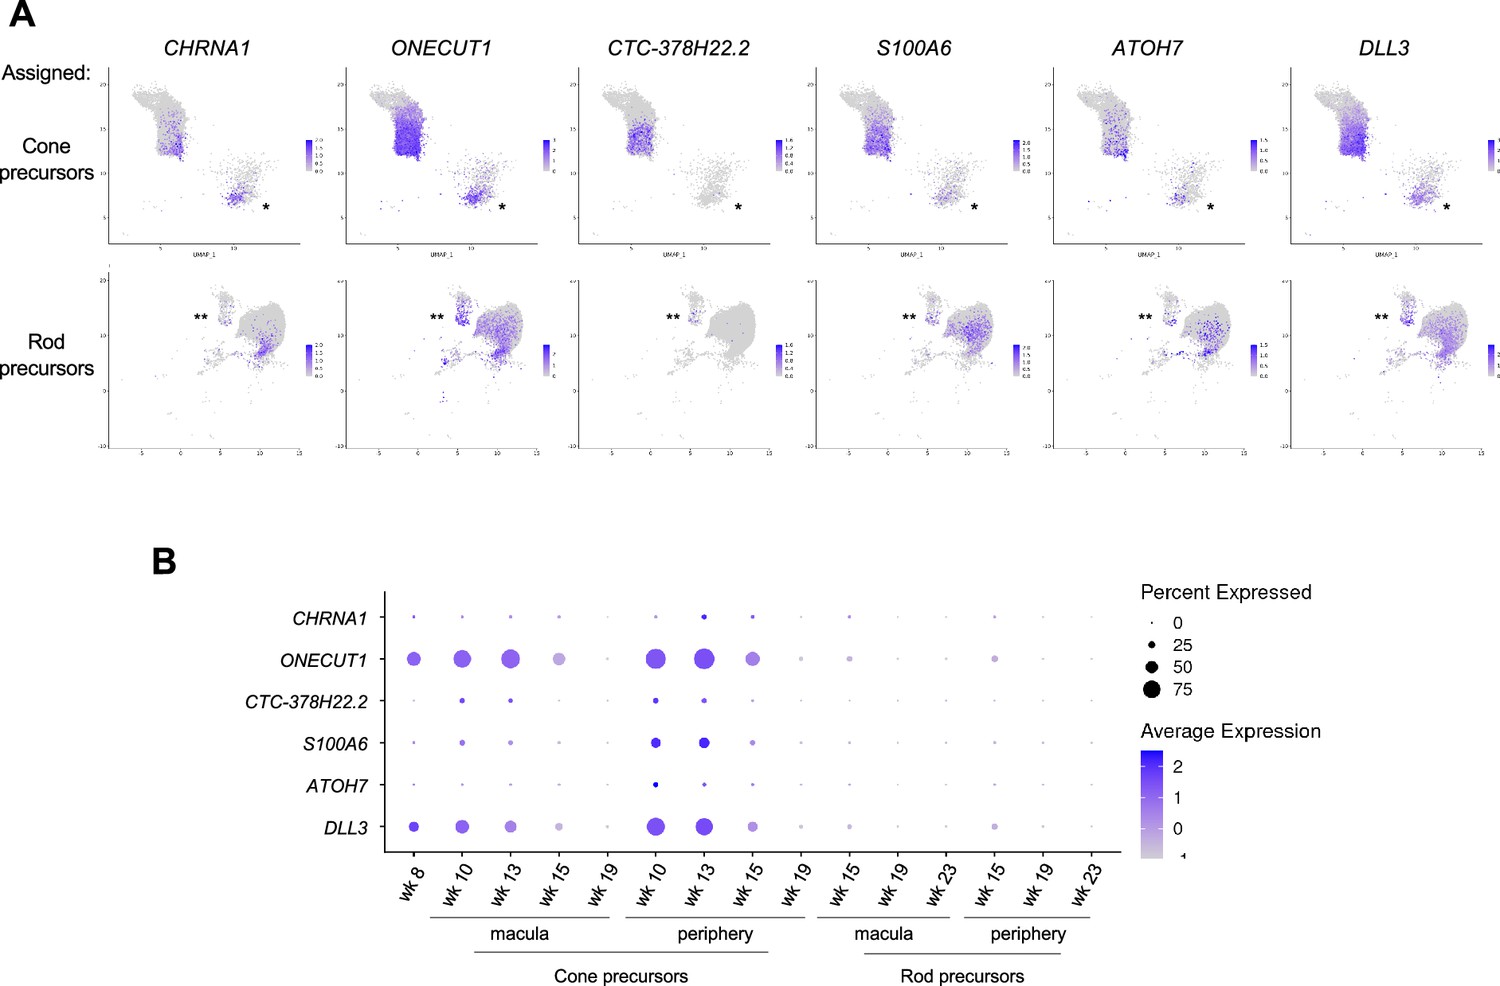
Developmental expression of photoreceptor precursor markers in a large 3' snRNA-seq dataset.
(A) Expression of selected markers in pcw 8–23 cone precursors (top) and rod precursors (bottom), as assigned in Zuo et al., 2024. *=possible rod precursors misassigned as cone precursors; **=possible cone precursors misassigned as rod precursors. (B) Dot plot depicting the percentage of cells expressing each gene and average expression levels in assigned macular and peripheral cone and rod precursors at each age.
Figure 8—figure supplement 2
iCP-enriched regulon activities.
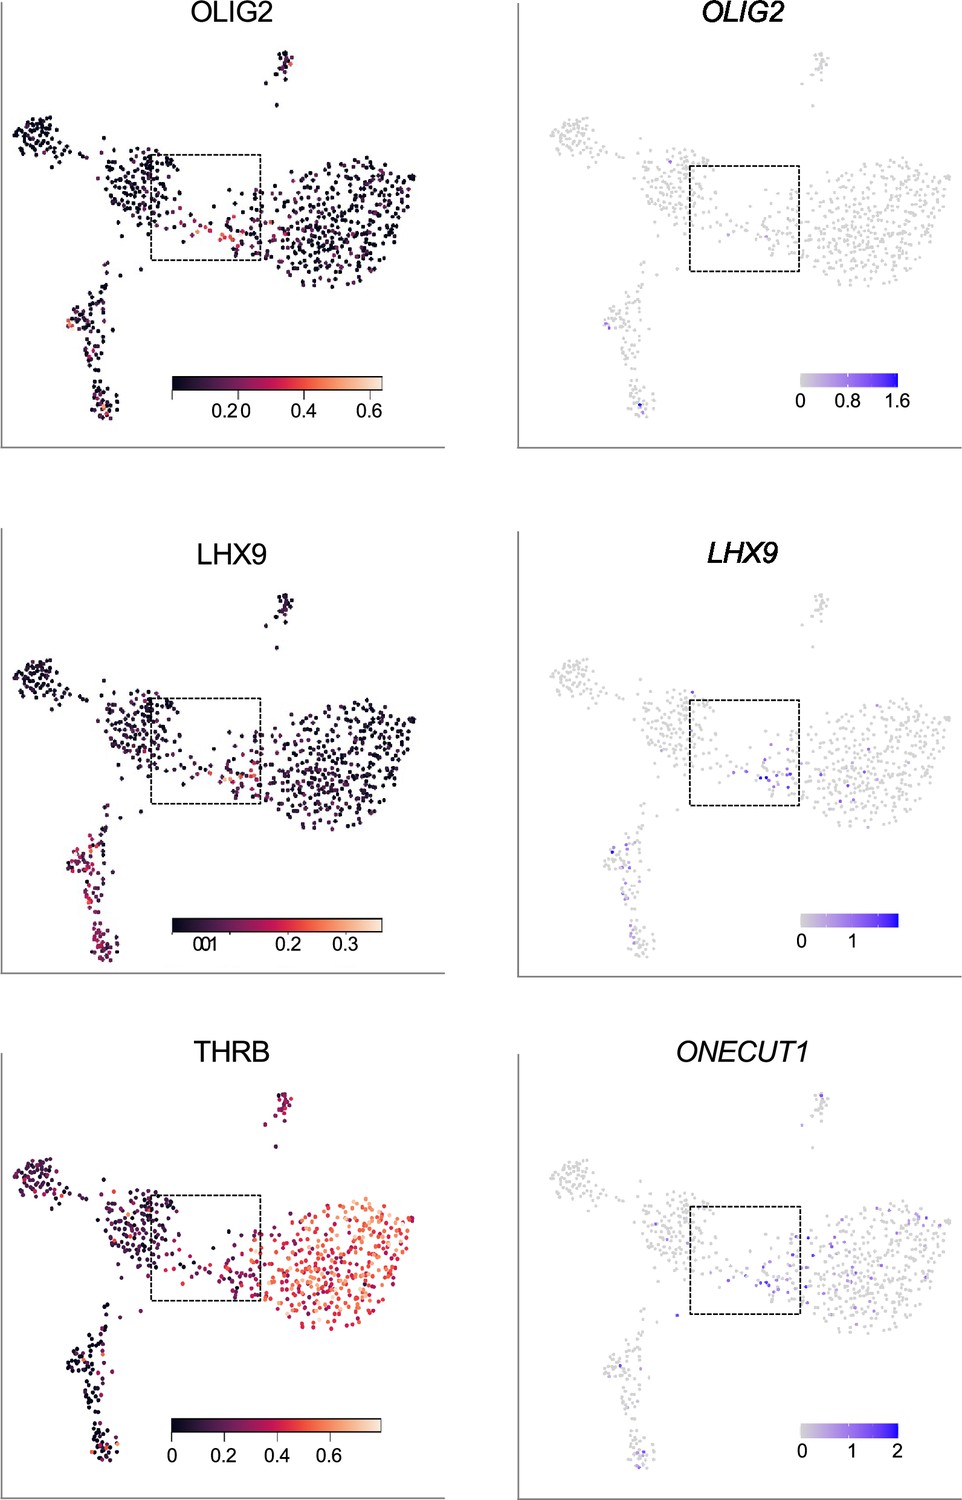
UMAP plots of OLIG2, LHX9, and THRB regulon activities (left) and OLIG2, LHX9, and ONECUT1 gene expression (right), illustrating high OLIG2 regulon activity with minimal OLIG2 gene expression, concurrent LHX9 regulon activity and LHX9 gene expression, and ONECUT1 gene expression in iCP cells preceding increased THRB regulon activity in early LM cones. Boxes indicate the bridge region.
Figure 9 with 1 supplement
L/M cone subcluster marker genes, regulons, and pseudotemporal trajectory with successive lncRNA gene expression.
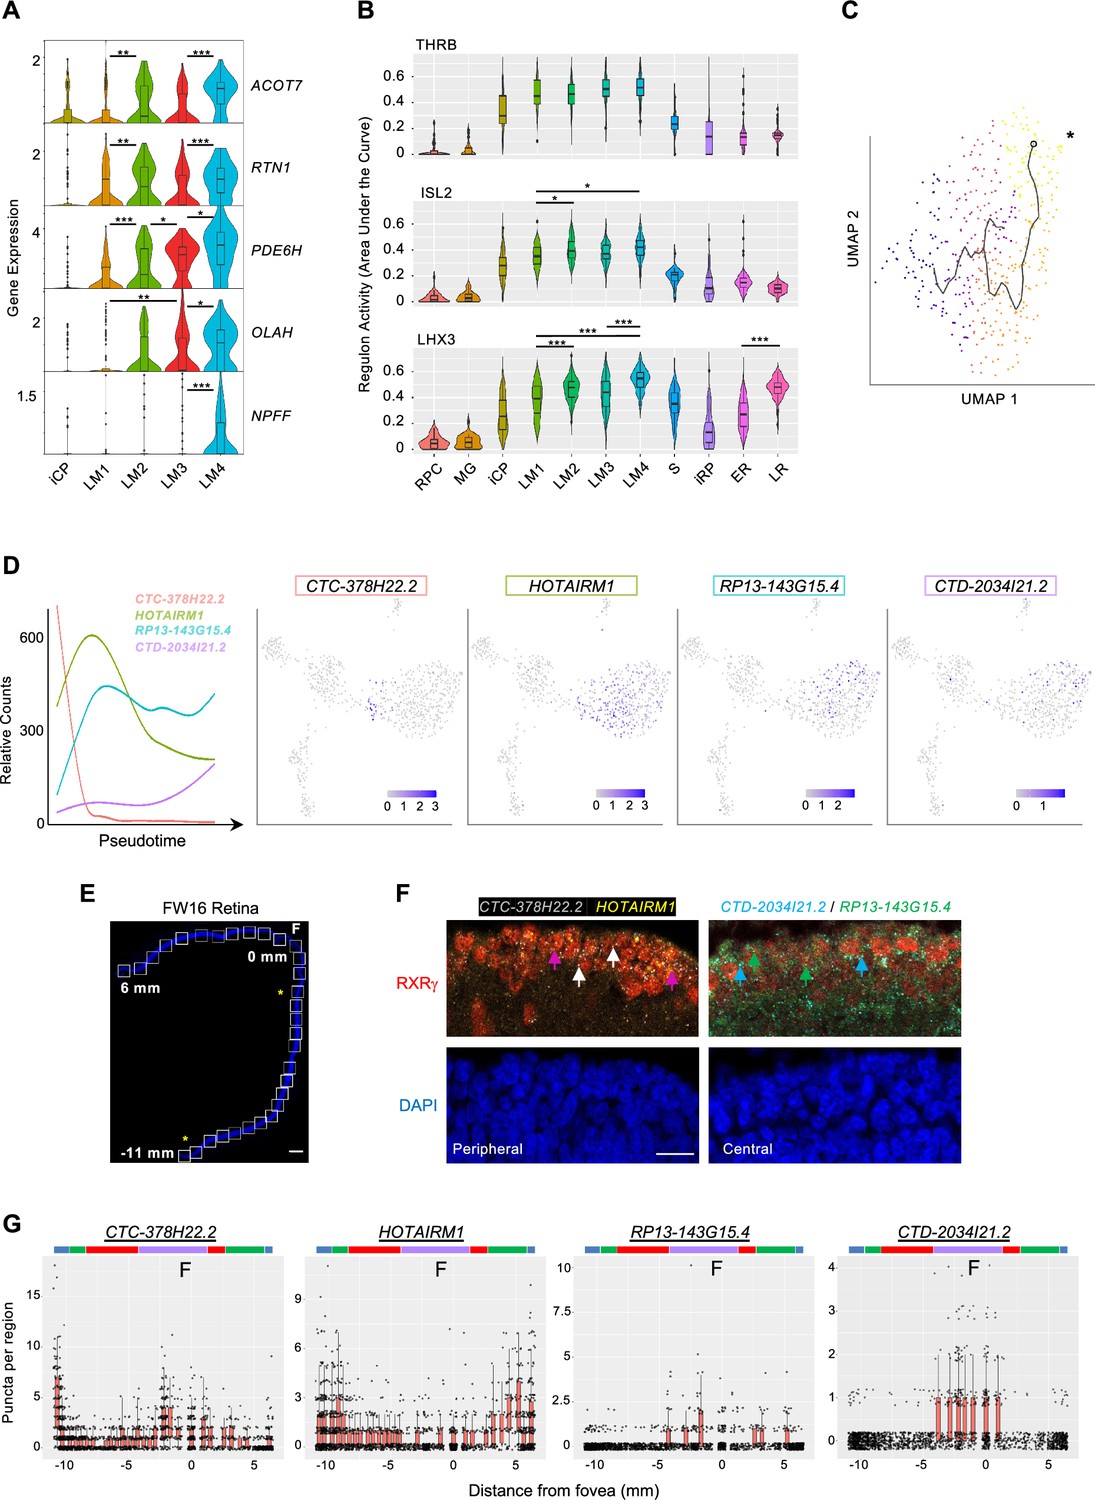
(A) Violin plots of high-resolution cone cluster marker genes with increasing maturation-associated expression. All significant differences between adjacent clusters are indicated. (B) Violin plots of regulons with highest LM1-4 cone cluster specificity scores. *, p<0.05; **,<0.005; ***,<0.0005 (post-hoc Dunn test). (C) Pseudotemporal trajectory through the L/M cone population derived with Monocle 3. *: Root cell used to define endpoint. The pseudotime trajectory may be related to LM1-LM4 subcluster distributions in Figure 5A. (D) Trendlines of relative count expression (left) and UMAP plots for lncRNAs correlating with early or late-upregulating modules. Line color matched to labels. (E, F) Combined RXRγ immunohistochemical staining and FISH of lncRNAs on FW16 retina. (E) Tiled images of retina with nuclei stained with DAPI. White boxes: fields used for quantitative fluorescent imaging. Distances along the apical edge of tissue marked in mm from fovea to ciliary margins. Scale bar = 500 µm. Asterisks identify fields shown in F. (F) Combined RXRγ immunostaining and multiplex FISH for four lncRNAs, of which two are shown in peripheral and central retina regions. Arrows: White: RXRγ/CTC-378H22.2+. Magenta: RXRγ/HOTAIRM1+. Blue: RXRγ/CTD-2034I21.2+. Green: RXRγ/RP13-143G15.4+. Scale bar = 15 µm. (G) Quantitation of lncRNA fluorescent puncta assigned to RXRγ+ cells after segmentation. Colored bars mark lncRNA expression regions as described in the text.
Figure 9—figure supplement 1
Heatmaps of coregulated gene modules across cone precursor pseudotime.
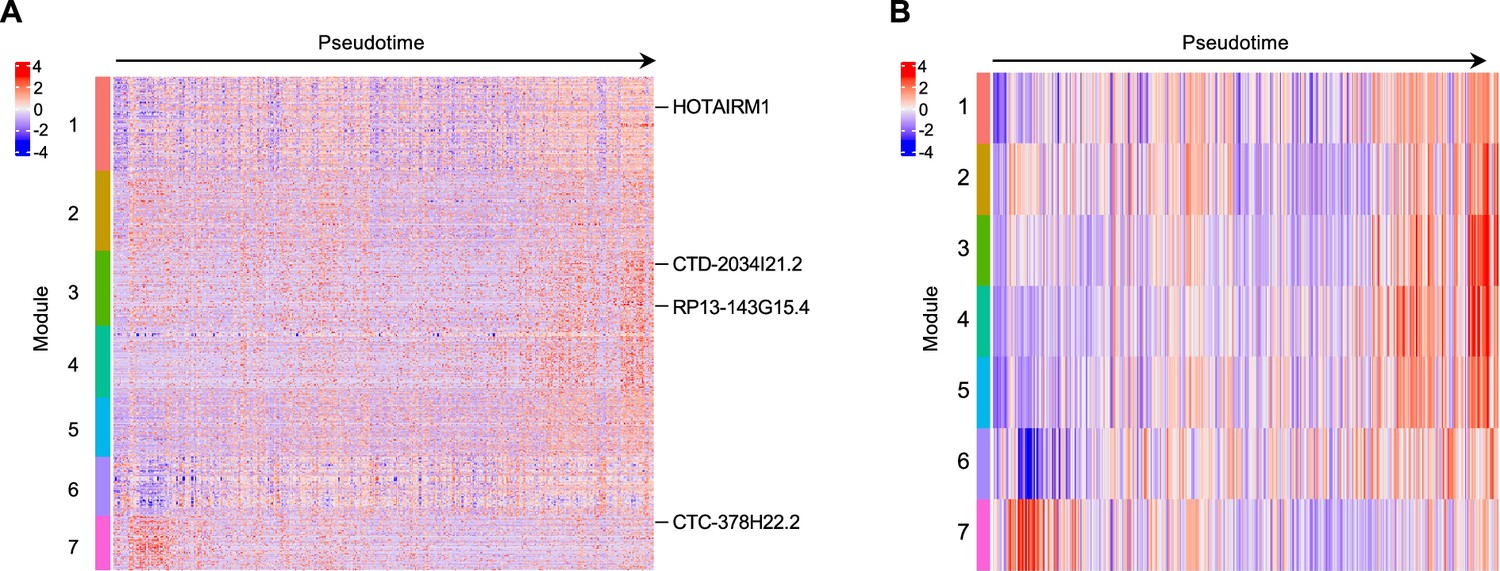
(A) Heatmaps of individual genes in each module across the pseudotime trajectory shown in Figure 6C. lncRNA genes of interest are labeled. (B) Heatmap of averaged gene module expression across pseudotime.
Figure 10 with 1 supplement
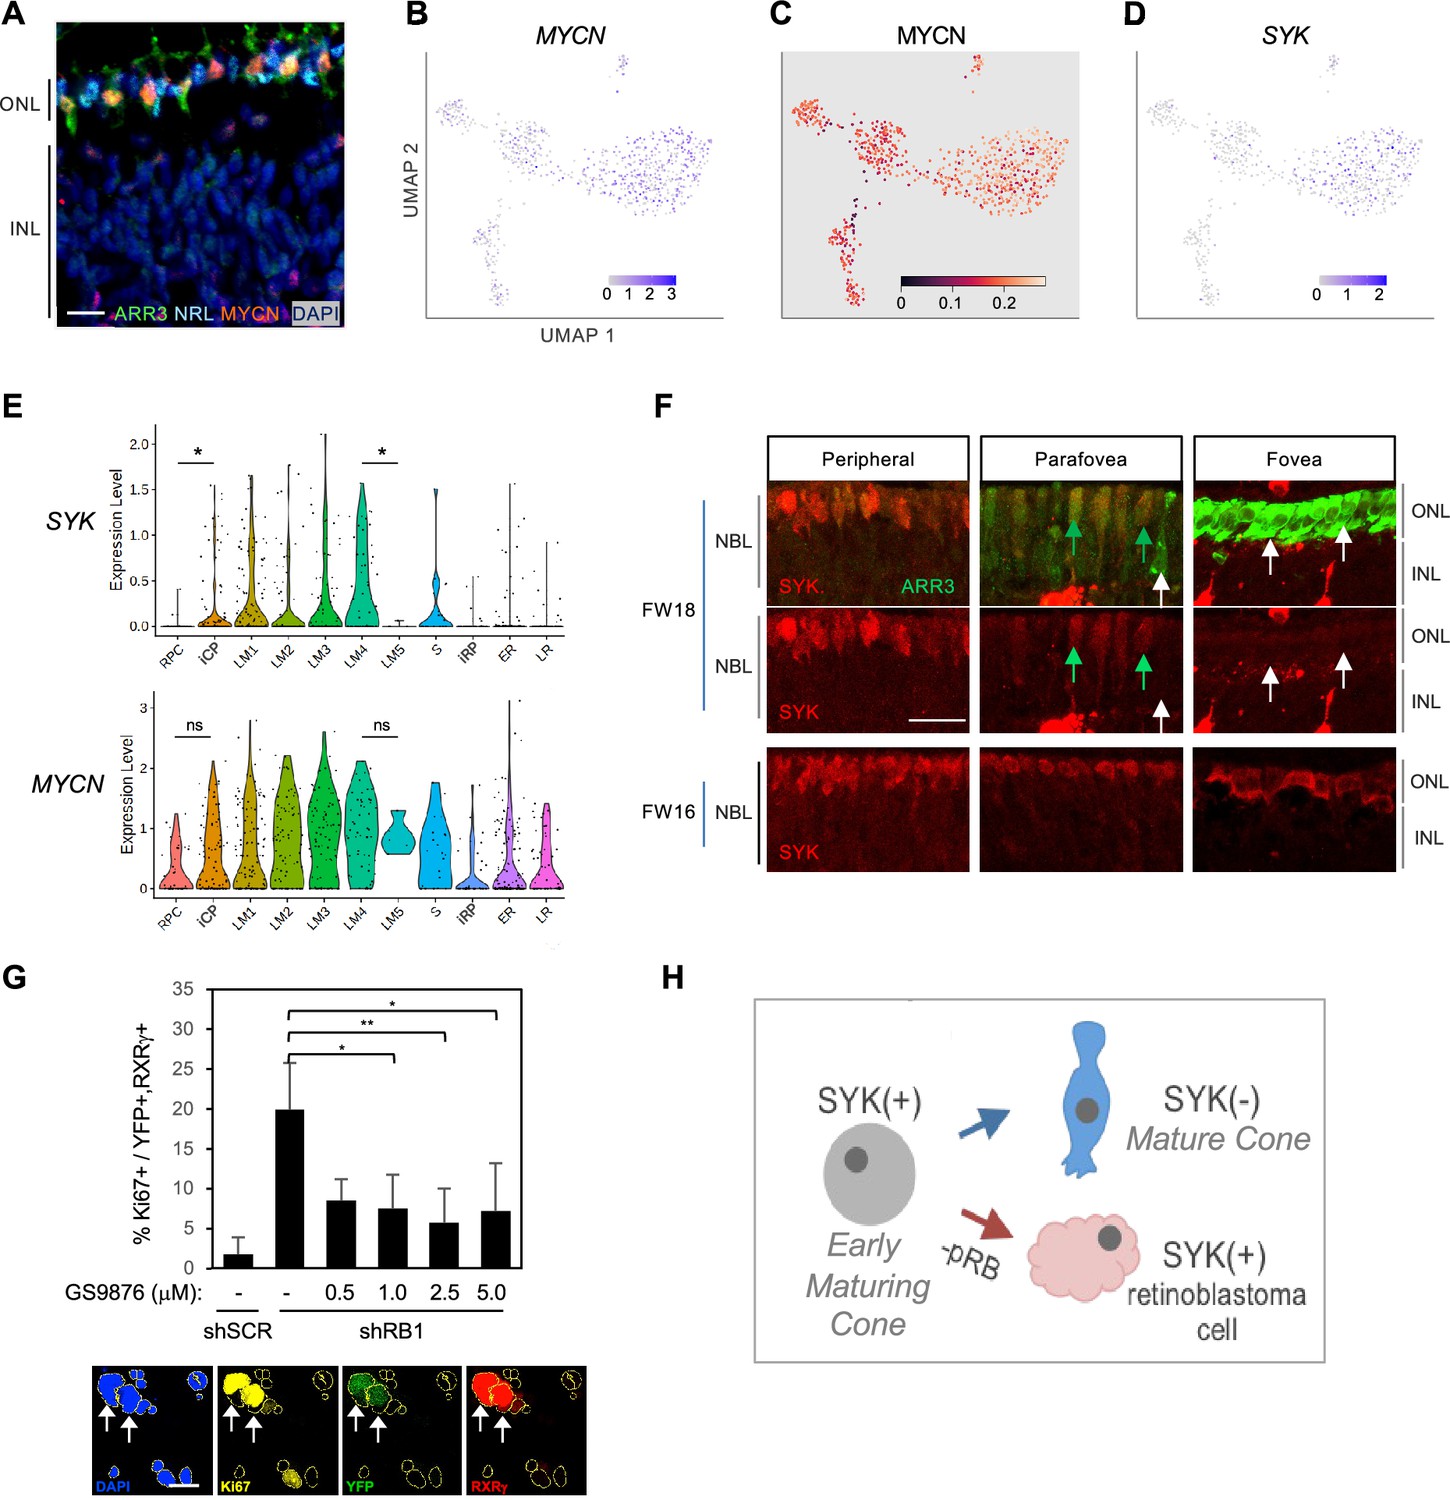
Cone intrinsic MYCN and SYK associated with proliferative response to pRB loss.
(A) Immunofluorescent staining shows high MYCN in ARR3+ cones but not in NRL+ rods in FW18 retina. Scale bar = 10 µm. (B–D) UMAP plots of MYCN expression (B), MYCN regulon activity (C), and SYK expression (D). (E) SYK and MYCN gene expression violin plots by cluster. *, p<0.05; ns = not significant (t-test). (F) Immunohistochemical staining of SYK and cone arrestin (ARR3) in FW18 and FW16 retinae. Green arrow: ARR3+, SYK+. White arrow: ARR3+, SYK–. Scale bar = 25 µm. (G) Top: Effect of SYK inhibitor GS-9876 on Ki67 expression in RXRγ+ cones from FW16.5 retina co-transduced with YFP and shRB1- or control shSCR-shRNA. Values represent means of three analyses from two treatment replicates. Error bars: standard deviation. *, p<0.05; **,<0.005 (Student’s T-test with equal variance, 2-tailed). RXRγ+ cells: Experiment 1, n=1340. Experiment 2, n=804. Range 107–366 cells per condition. Bottom: Example of Ki67, YFP, and RXRγ co-immunostaining with DAPI+ nuclei (yellow outlines). Arrows: Ki67+, YFP+, RXRγ+ nuclei. Scale bar = 20 µm. (H) Model of SYK expression in cone maturation and retinoblastoma development.
Figure 10—figure supplement 1
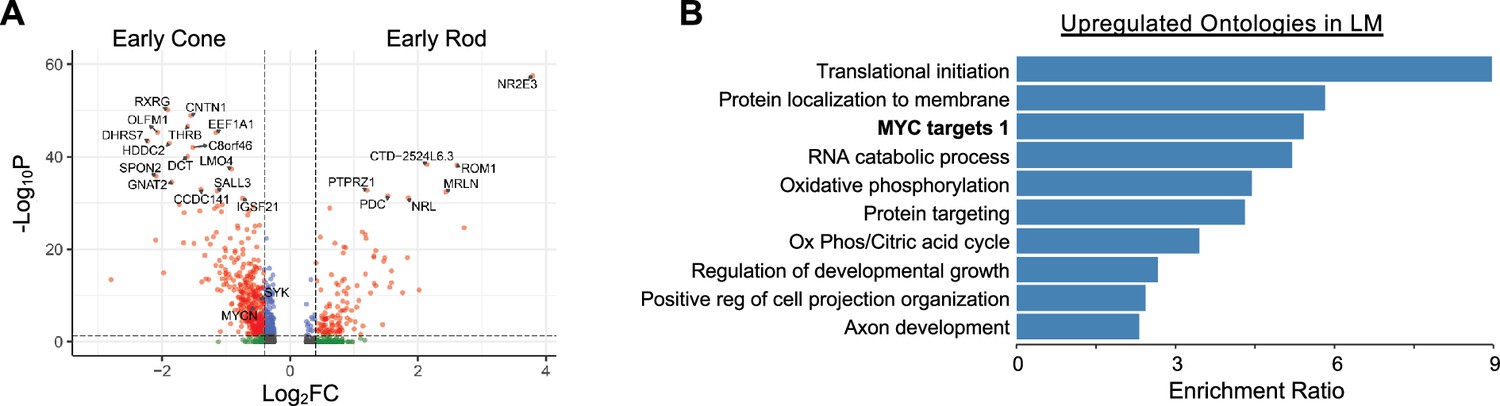
Differential gene expression in early cone and rod precursors.
(A) Volcano plot of differential expression between early rod cluster ER and cone LM, excluding the 5 cell late-maturing population. pAdj cutoff = 0.05, log2FC cutoff = |0.4|. Labeled genes: pAdj <10e-32, except for SYK and MYCN. (B). Overrepresentation analysis of cone-enriched genes pAdj <0.05, log2FC ≥ |0.4|.
Figure 11
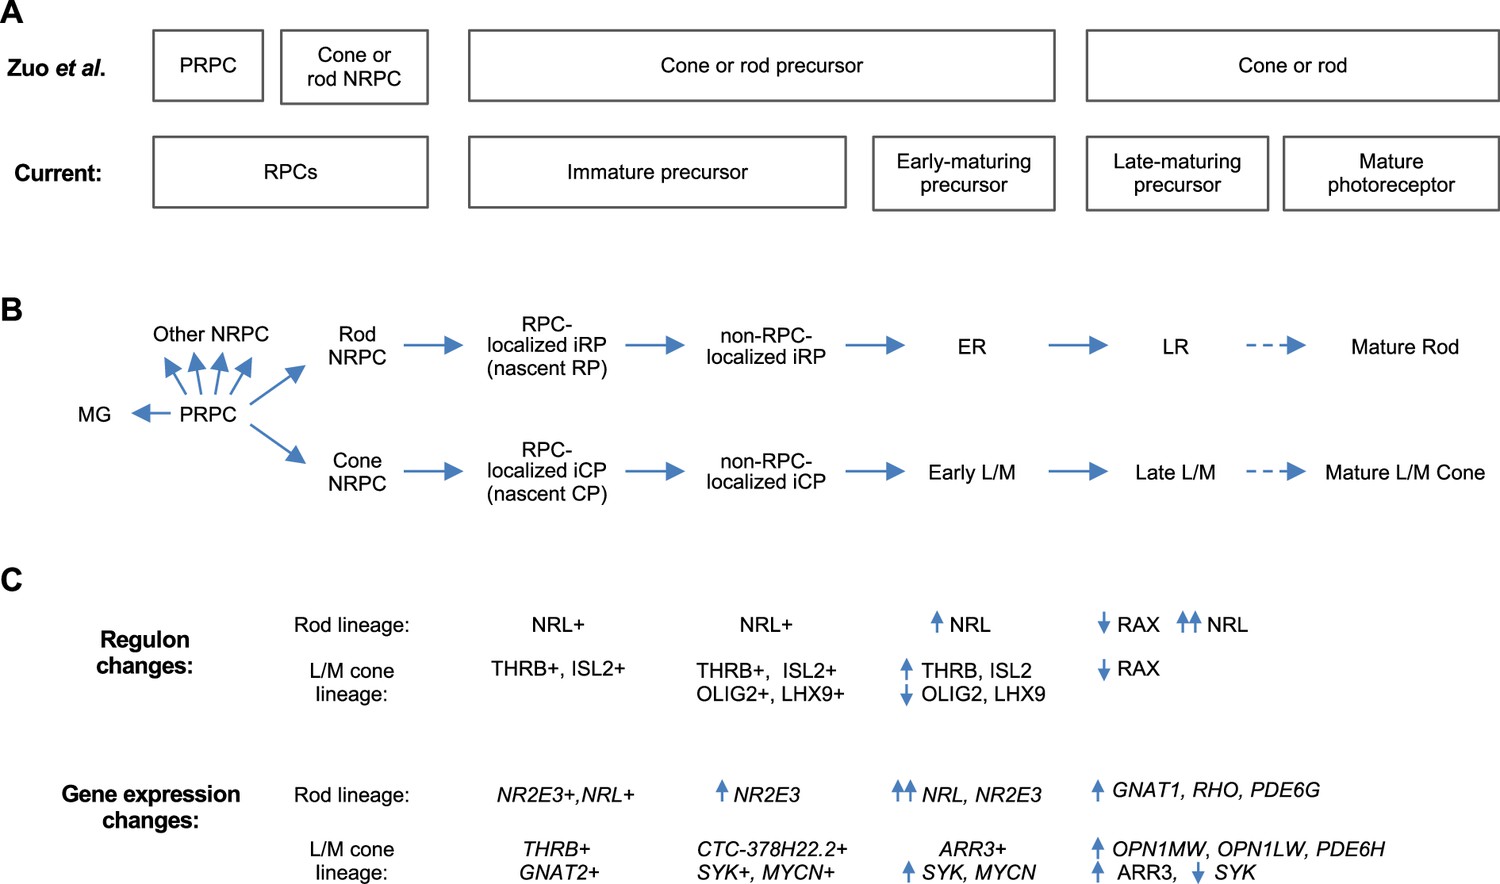
Proposed cell state trajectories in human L/M cone and rod development.
(A) L/M cone and rod developmental stages discerned in the 3' snRNA-seq analysis of Zuo et al., 2024 (top) and in the current deep, full-length scRNA-seq study (bottom). Note the discrimination of PRPC and NRPC populations in Zuo et al. and the discrimination of immature and early-maturing precursors in the current work. Late maturing precursors in fetal retina are hypothesized to be distinguishable from fully mature photoreceptors in postnatal retina. (B) RPC and L/M cone and rod developmental states referred to in the current study. (C) Selected cell state features identified in the current work.
Tables
Key resources table
| Reagent type (species) or resource | Designation | Source or reference | Identifiers | Additional information |
|---|---|---|---|---|
| Strain, strain background (Escherichia coli) | NEB 10-beta | New England Biolabs | C3019H | Competent cells |
| Cell line (Homo sapiens) | CHLA-VC-RB31 | Stachelek et al., 2023; https://doi.org/10.1002/gcc.23120 | Authenticated by STR analysis | |
| Cell line (Mus musculus) | NIH-3T3 | American Type Culture Collection (ATCC) | CRL-1658.2 | Authenticated by STR analysis |
| Cell line (Homo sapiens) | HEK-293T | American Type Culture Collection (ATCC) | CRL-11268 | Authenticated by STR analysis |
| Biological sample (Human) | Fetal eyes | Family Planning Associates, Los Angeles, CA | Isolated from fetal tissue | |
| Biological sample (Human) | Fetal eyes | Advanced Bioscience Resources, Alameda, CA | Isolated from fetal tissue | |
| Antibody | anti-NRL (Goat polyclonal) | R&D Systems | CAT# AF2945, RRID:AB_2155098 | WB: 1:2000–4000 |
| Antibody | anti-NRL (Mouse monoclonal) | Santa Cruz Biotechnology | CAT# SC-374277, RRID:AB_10991100 | WB:1:250, IF:1:50 |
| Antibody | anti-RXRγ (Mouse monoclonal) | Santa Cruz Biotechnology | CAT# SC-514134, RRID:AB_2737293 | IF: 1:200 |
| Antibody | anti-SYK (Mouse monoclonal) | Santa Cruz Biotechnology | CAT# SC1240, RRID:AB_628308 | IF:(1:200) |
| Antibody | anti-ARR3 (Rabbit polyclonal) | Zhang et al., 2001; Li et al., 2003; https://doi.org/10.1167/iovs.02-0434; Lou et al., 2012; https://doi.org/10.1007/978-1-4615-1355-1_33 | LUMI-F - hCAR | IF: (1:5000) Cheryl Craft |
| Antibody | anti-RXRγ (Rabbit polyclonal) | Santa Cruz Biotechnology | CAT# SC-555, RRID:AB_2269865 | IF: (1:800) |
| Antibody | anti-KI67 (Mouse monoclonal) | BD Bioscience | CAT# 550609, RRID:AB_393778 | IF: (1:200) |
| Antibody | anti-GFP and YFP (Goat polyclonal) | Abcam | CAT# ab6673, RRID:AB_305643 | IF: (1:500) |
| Antibody | anti-CD133-PE (Mouse monoclonal) | Miltenyi Biotec | CAT# 130-113-108, RRID:AB_2725937 | FACS: (1:50) |
| Antibody | Mouse monoclonal anti-CD44-FITC (1:50) | BD Biosciences | CAT# 555478, RRID:AB_395870 | FACS: (1:50) |
| Antibody | Mouse monoclonal anti-PNR/NR2E3 (1:50) | R&D Systems | CAT# PP-H7223-00, RRID:AB_ 2155481 | IF: (1:50) |
| Antibody | Mouse monoclonal anti-CD49b-FITC (1:10) | BD Biosciences | CAT# 555498, RRID:AB_395888 | FACS: (1:10) |
| Antibody | anti-goat IgG Alexa Fluor 488 (1:300) | Jackson Laboratories | CAT# 705-545-147, RRID:AB_2336933 | IF: (1:300) |
| Antibody | anti-mouse IgG Alexa Fluor 680 (Donkey polyclonal) | Life Technologies | CAT# A10038, RRID:AB_2534014 | IF: (1:500) |
| Antibody | Donkey polyclonal anti-mouse IgG Alexa Fluor 680 (Donkey polyclonal) | Invitrogen | CAT# A11057, RRID:AB_2534104 | IF: (1:500) |
| Recombinant DNA reagent | pLKO.1C-YFP-shSCR | Lee and Cobrinik, 2020; https://doi.org/10.2144/btn-2019-0155 | RRID:Addgene_139647 | |
| Recombinant DNA reagent | pLKO.1C-YFP-shRB1-733 | Lee and Cobrinik, 2020; https://doi.org/10.2144/btn-2019-0155 | RRID:Addgene_244458 | |
| Recombinant DNA reagent | pcDNA4-His-Max-C-Nrl | Cheng et al., 2004; https://academic.oup.com/hmg/article-abstract/13/15/1563/581552?redirectedFrom=fulltext&login=false | Gift from A. Swaroop. | |
| Recombinant DNA reagent | pcDNA4-His-Max-C-EF1α-FL-NRL | This paper | RRID:Addgene_239094 | See Materials and methods NRL isoform analyses |
| Recombinant DNA reagent | pcDNA4-C-EF1α-FL-NRL | This paper | RRID:Addgene_239095 | See Materials and methods NRL isoform analyses |
| Recombinant DNA reagent | pcDNA4-C-EF1α-Tr-NRL | This paper | RRID:Addgene_239096 | See Materials and methods NRL isoform analyses |
| Recombinant DNA reagent | pcDNA4-C-EF1α | This paper | RRID:Addgene_239097 | See Materials and methods NRL isoform analyses |
| Recombinant DNA reagent | pGL3-SV40 | Promega | AT# E1761, RRID:Addgene_173953 | |
| Recombinant DNA reagent | pGL3-PDE6B-146 | This paper | RRID:Addgene_239098 | See Materials and methods NRL isoform analyses |
| Recombinant DNA reagent | pGL3-empty | This paper | RRID:Addgene_239099 | See Materials and methods NRL isoform analyses |
| Recombinant DNA reagent | pUltra-EGFP-P2A-Tr-NRL | This paper | RRID:Addgene_239100 | See Materials and methods NRL isoform analyses |
| Recombinant DNA reagent | pUltra-EGFP | Lou et al., 2012 | RRID:Addgene_24129 | |
| Sequence-based reagent | Gipc1_F | This paper | PCR primers | GGGAAAGGACAAAAGGAACCC |
| Sequence-based reagent | Gipc1_R | This paper | PCR primers | CAGGGCATTTGCACCCCATGCC |
| Sequence-based reagent | Subcloning PCR primer | Integrated DNA Technologies | Del-His F | 5'- CCGAAACCATGGCCCTGCCCCCCAGC |
| Sequence-based reagent | Subcloning PCR primer | Integrated DNA Technologies | Del-His R | 5'- GGGCCATGGTTTCGGAGGCCGTCCG |
| Sequence-based reagent | Subcloning PCR primer | Integrated DNA Technologies | NRL-no-His F | 5'- CCGAAACCATGTCTGTGCGGGAGCTAAACC |
| Sequence-based reagent | Subcloning PCR primer | Integrated DNA Technologies | NRL-no-His R | 5'- CAGACATGGTTTCGGAGGCCGTCCG |
| Sequence-based reagent | Subcloning PCR primer | Integrated DNA Technologies | pcDNA del NRL F | 5'- CCGAAACCGCCGTTCAGAGCACCTTGTGG |
| Sequence-based reagent | Subcloning PCR primer | Integrated DNA Technologies | pcDNA del NRL R | 5'- GAACGGCGGTTTCGGAGGCCGTCCG |
| Sequence-based reagent | Subcloning PCR primer | Integrated DNA Technologies | PDE –93 F IF | 5'- TCTTACGCGTGCTAGAGCGCAGGCCCCCATTTG |
| Sequence-based reagent | Subcloning PCR primer | Integrated DNA Technologies | PDE +53 R IF | 5'- CTTAGATCGCAGATCGGTGGCTGCCTGTCCCTG |
| Sequence-based reagent | Subcloning PCR primer | Integrated DNA Technologies | pGL3-sv40 SDM F | 5'- CTGCGATCAAGCTTGGCATTCCGGTACTG |
| Sequence-based reagent | Subcloning PCR primer | Integrated DNA Technologies | pGL3-sv40 SDM R | 5'- CAAGCTTGATCGCAGATCGGTGGCTG |
| Sequence-based reagent | Subcloning PCR primer | Integrated DNA Technologies | pGL3 del SV40 R | 5'- CAAGCTTGATCGCAGATCTCGAGCCC |
| Sequence-based reagent | Subcloning PCR primer | Integrated DNA Technologies | Tr-NRL IF pU-G F | 5'- GCCTTCTAGAGGATCCATGTCTGTGCGGGAGCTAAACC |
| Sequence-based reagent | Subcloning PCR primer | Integrated DNA Technologies | Tr-NRL IF pU-G R | 5'-- CGCCGGAGCCGGATCCTCAGAGGAAGAGGTGGGAGGG |
| Sequence-based reagent | SmartSeq library amplification primer | Integrated DNA Technologies | 5' PCR Primer II A | 5'- AAGCAGTGGTATCAACGCAGAGT |
| Sequence-based reagent | RACE primer | Integrated DNA Technologies | 5' RACE primer for SmartSeq cDNA | 5'- AAGCAGTGGTATCAACGCAGAGTACGGG |
| Sequence-based reagent | NRL reverse primer for 5' RACE | Integrated DNA Technologies | Rev NRL-Full ex3 | 5'- GGTTTAGCTCCCGCACAGACATCGAGAC |
| Sequence-based reagent | RXRG reverse primer for 5' RACE | Integrated DNA Technologies | Rev RXR ex5 | 5'- GAAGAACCCTTTGCAGCCTTCACAACTG |
| Sequence-based reagent | RACE primer | Integrated DNA Technologies | 3' RACE primer for SmartSeq cDNA | 5'- AAGCAGTGGTATCAACGCAGAGTACTTTT |
| Sequence-based reagent | THRB1 forward primer for 3' RACE | Integrated DNA Technologies | Forw TRb1 ex4 | 5'- GCCTTACAGCCTGGGACAAACC |
| Sequence-based reagent | THRB2 forward primer for 3' RACE | Integrated DNA Technologies | Forw TRb2 ex1 | 5'-CCCTGGAAACATGTTTAAAAGCAAGGACT |
| Sequence-based reagent | In situ hybridization chain reaction probes | Molecular Instruments Inc | FL-NRL exon 1, 2 | Target sequence Ensembl ID: ENST00000619224.1 |
| Sequence-based reagent | hybridization chain reaction probes | Molecular Instruments Inc | CHRNA1 | Target sequence NCBI accession number: NM_000079.4 |
| Sequence-based reagent | hybridization chain reaction probes | Molecular Instruments Inc | RP13-143G15.4 | |
| Sequence-based reagent | hybridization chain reaction probes | Molecular Instruments Inc | CTC-378H22.2 | Target sequence Ensembl ID: ENST00000559786.1 |
| Sequence-based reagent | hybridization chain reaction probes | Molecular Instruments Inc | HOTAIRM1 | Target sequence NCBI accession number: NR_038366.1 |
| Sequence-based reagent | hybridization chain reaction probes | Molecular Instruments Inc | CTD-2034I21.2 | Target sequence NCBI accession number: XR_001752169.1 |
| Sequence-based reagent | hybridization chain reaction probes | Molecular Instruments Inc | GNAT2 | Target sequence NCBI accession number: NM_005272.5 |
| Sequence-based reagent | hybridization chain reaction probes | Molecular Instruments Inc | NR2E3 | Target sequence NCBI accession number: NM_01249.4 |
| Commercial assay or kit | In-Fusion HD Cloning | Clontech | Clontech:639647 | |
| Commercial assay or kit | SMARTer Ultra Low RNA Kit for the Fluidigm C1 System | Clontech (Takara Bio) | CAT# 634835/634935 | |
| Commercial assay or kit | SMART-Seq V4 Ultra Low Input RNA Kit | Takara Bio | CAT# 63891 | |
| Commercial assay or kit | Nextera XT DNA Library Preparation Kit | Illumina | CAT# FC-131–1096 | |
| Commercial assay or kit | CloneAmp HiFi PCR Premix | Clontech (Takara Bio) | Takara Bio #639298 | |
| Commercial assay or kit | Quant-iT PicoGreen dsDNA Assay Kit | Life Technologies | CAT# P11496 | |
| Commercial assay or kit | Nano-Glo Dual-Luciferase Reporter Assay System | Promega, Inc | CAT# N1610 | |
| Chemical compound, drug | GS-9876 (SYK inhibitor) | MedChemExpress | CAT# HY-109091 | |
| Software, algorithm | TrimGalore | Krueger, 2018 | RRID:SCR_011847 | https://github.com/FelixKrueger/TrimGalore |
| Software, algorithm | Cutadapt | Martin, 2011; https://journal.embnet.org/index.php/embnetjournal/article/view/200 | https://cutadapt.readthedocs.io/en/stable/ | |
| Software, algorithm | HISAT2 | Kim et al., 2019; https://www.nature.com/articles/s41587-019-0201-4 | RRID:SCR_015530, version 2.1.0 | https://github.com/DaehwanKimLab/hisat2 |
| Software, algorithm | StringTie | Pertea et al., 2015; https://www.nature.com/articles/nbt.3122 | https://ccb.jhu.edu/software/stringtie/ | |
| Software, algorithm | Snakemake/ARMOR | Orjuela et al., 2019; https://www.nature.com/articles/nbt.3122; Soneson et al., 2025 | https://github.com/cobriniklab/ARMOR | |
| Software, algorithm | Minimap2 | Li, 2018; https://academic.oup.com/bioinformatics/article/34/18/3094/4994778?login=false | https://lh3.github.io/minimap2/ | |
| Software, algorithm | WebGestalt | Liao et al., 2019; https://academic.oup.com/nar/article/47/W1/W199/5494758?login=false | http://www.webgestalt.org/ | |
| Software, algorithm | pySCENIC | Van de Sande et al., 2020; Van de Sande and Flerin, 2025; https://www.nature.com/articles/s41596-020-0336-2 | RRID:SCR_025802 | https://github.com/aertslab/pySCENIC |
| Software, algorithm | Tximport | Soneson et al., 2015; https://f1000research.com/articles/4-1521/v1 | https://bioconductor.org/packages/release/bioc/html/tximport.html | |
| Software, algorithm | Seurat v3 (full-length scRNA-seq), Seurat v5 (3' snRNA-seq) | Stuart et al., 2019; https://www.cell.com/cell/fulltext/S0092-8674(19)30559-8?_returnURL=https%3A%2F%2Flinkinghub.elsevier.com%2Fretrieve%2Fpii%2FS0092867419305598%3Fshowall%3Dtrue | https://satijalab.org/seurat/index.html | |
| Software, algorithm | EnhancedVolcano | Blighe et al., 2018 | RRID:SCR_018931 | https://github.com/kevinblighe/EnhancedVolcano |
| Software, algorithm | genesorteR (v0.4.3) | Ibrahim and Kramann, 2019; Ibrahim, 2021; https://doi.org/10.1101/676379 | http://github.com/mahmoudibrahim/genesorteR | |
| Software, algorithm | Wiggleplotr (v1.13.1) | Alasoo, 2025; Alasoo, 2022; Bioconductor package | https://github.com/kauralasoo/wiggleplotr | |
| Software, algorithm | DEXSeq | Anders et al., 2012, https://genome.cshlp.org/content/22/10/2008 | https://bioconductor.org/packages/release/bioc/html/DEXSeq.html | |
| Software, algorithm | velocytoR | La Manno et al., 2018; https://www.nature.com/articles/s41586-018-0414-6 | https://velocyto.org/ | |
| Software, algorithm | Monocle3 | Cao et al., 2019; https://www.nature.com/articles/s41586-019-0969-x | https://cole-trapnell-lab.github.io/monocle3/ | |
| Software, algorithm | QuPath | Bankhead et al., 2017; https://www.nature.com/articles/s41586-019-0969-x | https://qupath.github.io/ | |
| Software, algorithm | StarDist (QuPath implementation) | Schmidt et al., 2018; https://www.nature.com/articles/s41586-019-0969-x | https://qupath.readthedocs.io/en/stable/docs/advanced/stardist.html |
Additional files
-
Supplementary file 1
Source data Excel files for selected figures.
(A) Differentially expressed genes for low resolution rod clusters. (B) Differentially expressed genes for low resolution cone clusters. (C) Differentially expressed genes for low resolution late- vs early-maturing L/M cone populations. (D) Differentially expressed genes in rods vs rod precursors in a 3' snRNA-seq dataset (data of Zuo et al. PMID 39117640). (E) Differentially expressed genes in cones vs cone precursors in a 3' snRNA-seq dataset data of Zuo et al. PMID 39117640. (F) SCENIC regulon specificity scores for low resolution clusters. (G) Differentially expressed genes for high resolution MG and RPC clusters. (H) SCENIC regulon specificity scores for high resolution clusters. (I) Pseudotime-correlated genes and gene modules. (J) Differentially expressed genes for low resolution early rod and L/M cone clusters.
- https://cdn.elifesciences.org/articles/101918/elife-101918-supp1-v1.xlsx
-
MDAR checklist
- https://cdn.elifesciences.org/articles/101918/elife-101918-mdarchecklist1-v1.docx
Download links
A two-part list of links to download the article, or parts of the article, in various formats.
Downloads (link to download the article as PDF)
Open citations (links to open the citations from this article in various online reference manager services)
Cite this article (links to download the citations from this article in formats compatible with various reference manager tools)
Identification and characterization of early human photoreceptor states and cell-state-specific retinoblastoma-related features
eLife 13:RP101918.
https://doi.org/10.7554/eLife.101918.3


