Structure of human PIEZO1 and its slow-inactivating channelopathy mutants
- Laboratory of Cell Fate Control, School of Life Sciences, Westlake University, China
- Westlake Laboratory of Life Sciences and Biomedicine, Hangzhou, China
- Fudan University, China
Figures
Figure 1 with 4 supplements
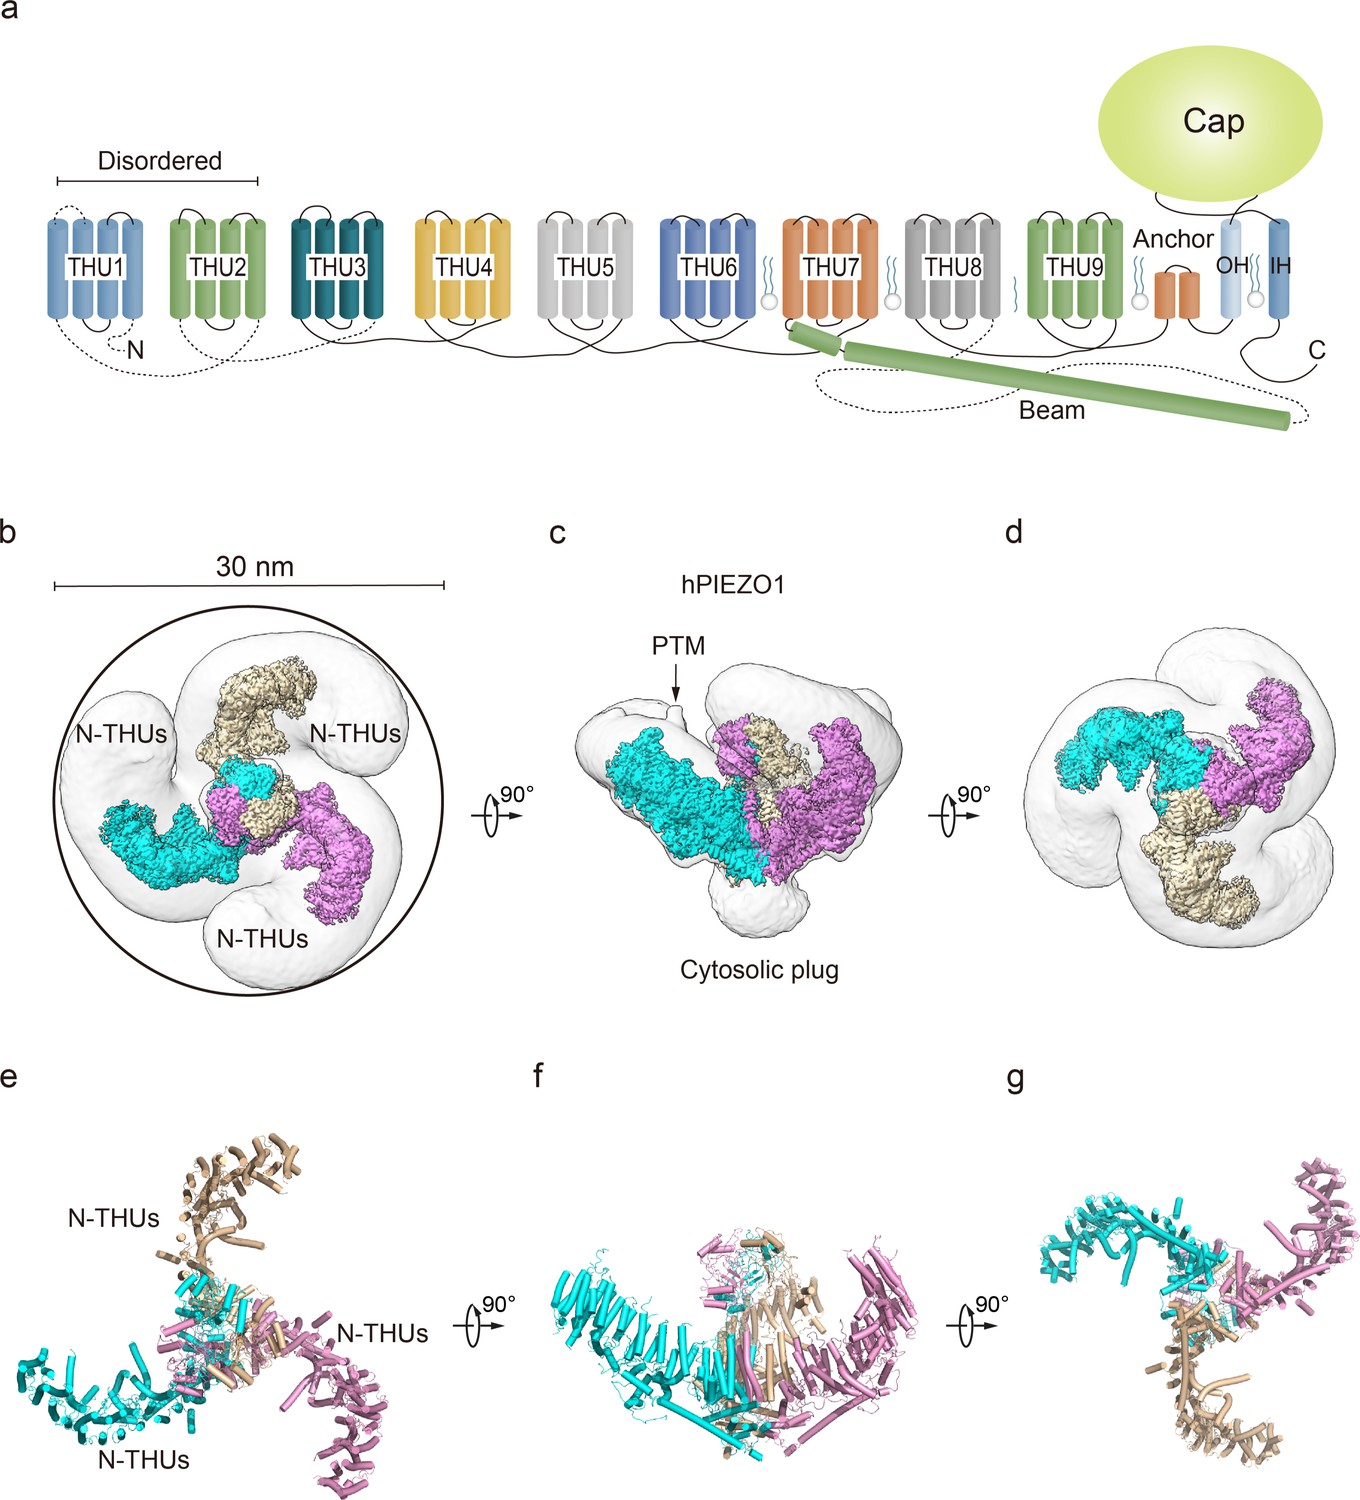
Structure of full-length human PIEZO1 (hPIEZO1) channel.
(a) 38-TM topology model of a single hPIEZO1 subunit. The nine transmembrane helix units (THUs), a long beam helix, an anchor domain, and two pore module helices (OH and IH, respectively). Each THU contains four transmembrane helices. THU1 and THU2 are likely disordered and therefore not visible in the hPIEZO1 cryo-EM density map. (b) The 3.3 Å cryo-EM density map of hPIEZO1 at the top view. The density of each single subunit is colored in cyan, wheat, and pink, respectively. Around 30 nm digitonin disk is shown as gray density by low pass filtering. (c) The 3.3 Å cryo-EM density map of hPIEZO1 at side view. The density of each single subunit is colored in cyan, wheat, and pink, respectively. The potential posttranslational modification (PTM) at the THUs region is indicated. A flexible density binds to the cytosolic plug, which may stand for an additional hPIEZO1 auxiliary. (d) The 3.3 Å cryo-EM density map of hPIEZO1 at the bottom view. The density of each single subunit is colored in cyan, wheat, and pink, respectively. (e) The cartoon model of hPIEZO1 at the top view. Each single subunit is colored in cyan, wheat, and pink, respectively. (f) The cartoon model of hPIEZO1 at the side view. Each single subunit is colored in cyan, wheat, and pink, respectively. (g) The cartoon model of hPIEZO1 at the bottom view. Each single subunit is colored in cyan, wheat, and pink, respectively.
Figure 1—figure supplement 1
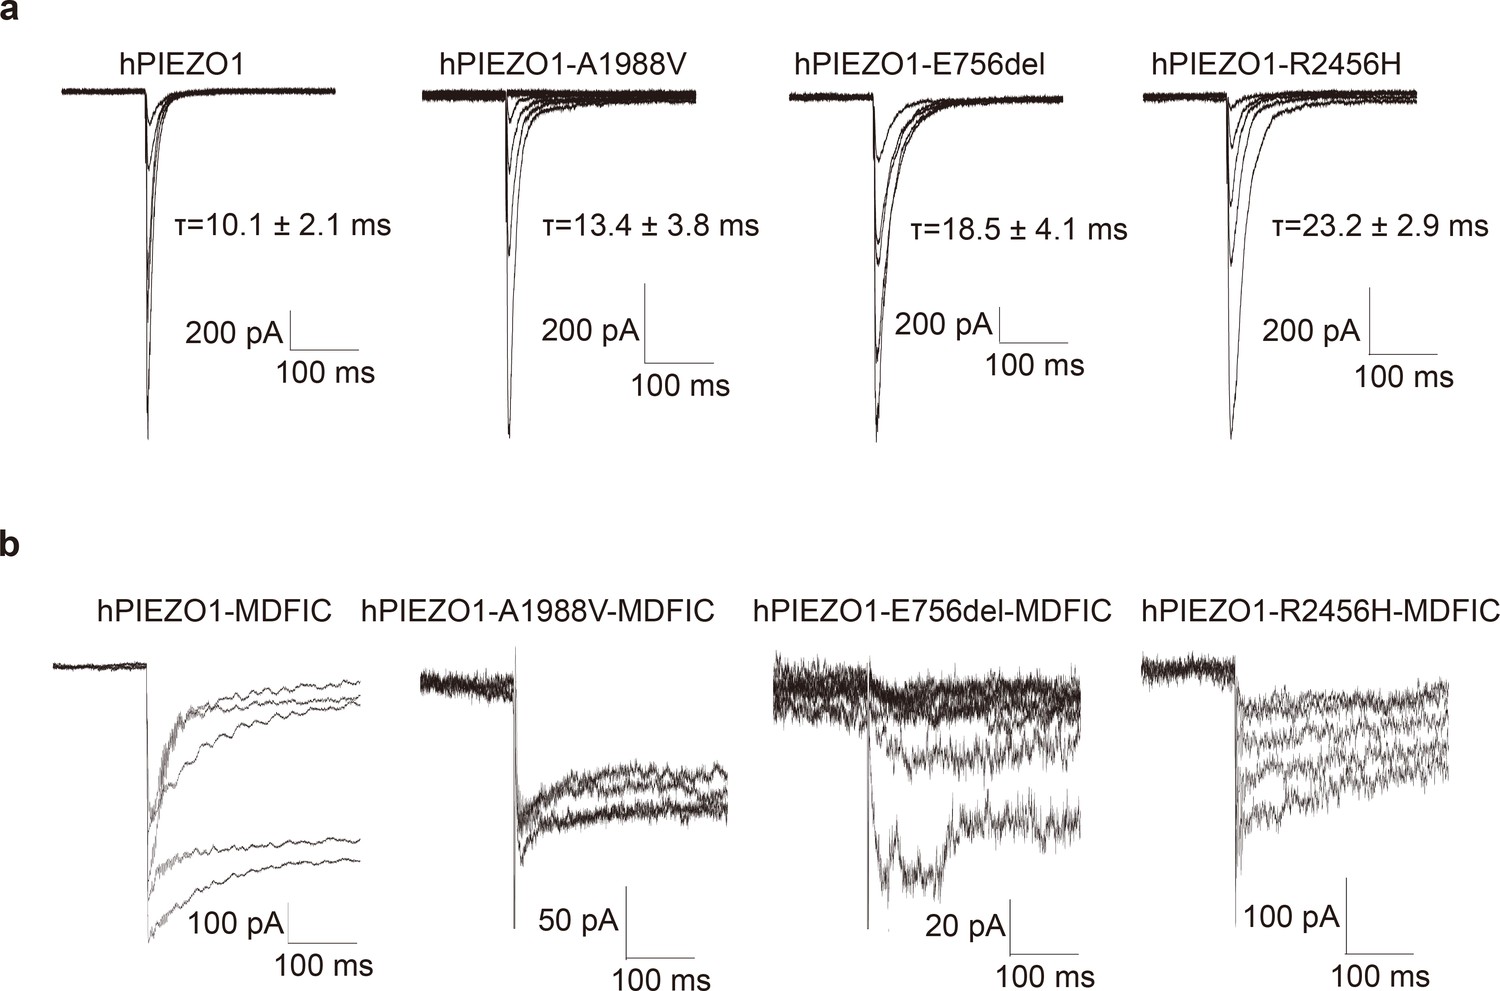
The whole-cell poking evoked currents of wild-type human PIEZO1 (hPIEZO1), the gain-of-function (GOF) channelopathy mutants with or without MDFIC.
(a) The representative traces of whole-cell poking evoked currents of wild-type hPIEZO1, hPIEZO1-A1988V, hPIEZO1-E756del, and hPIEZO1-R2456H subjected to a series of mechanical steps in 1 µm increments from 5 μm at a holding potential of −60 mV in HEK293T-PIEZO1-KO cells. The hPIEZO1 shows a very fast inactivation behavior with a half inactivation time of 10.1±2.1 ms. At the same time, the channelopathy mutants A1988V, E756del, and R2456H present a slow inactivation rate with half inactivation time of 13.4±3.8 ms, 18.5±4.1 ms, and 23.2±2.9 ms, respectively. (b) The representative traces of whole-cell poking evoked currents of wild-type hPIEZO1, hPIEZO1-A1988V, hPIEZO1-E756del, and hPIEZO1-R2456H co-expressed with the auxiliary subunit MDFIC subjected to a series of mechanical steps in 1 µm increments from 8 μm at a holding potential of −60 mV in HEK293T-PIEZO1-KO cells. The evoking MS currents were negligible even with large increments, presenting significant slow inactivation behavior. Therefore, the MDFIC may attenuate the mechanosensitivity of wild-type hPIEZO1 and GOF channelopathy mutants. All data are replicated at least three times, and the statistic is based on the mean ± SEM.
-
Figure 1—figure supplement 1—source data 1
SDS-PAGE gel sorce data of purifed hPIEZO1 and its channelopathy mutants with or without hMDFIC.
- https://cdn.elifesciences.org/articles/101923/elife-101923-fig1-figsupp1-data1-v1.xlsx
Figure 1—figure supplement 2
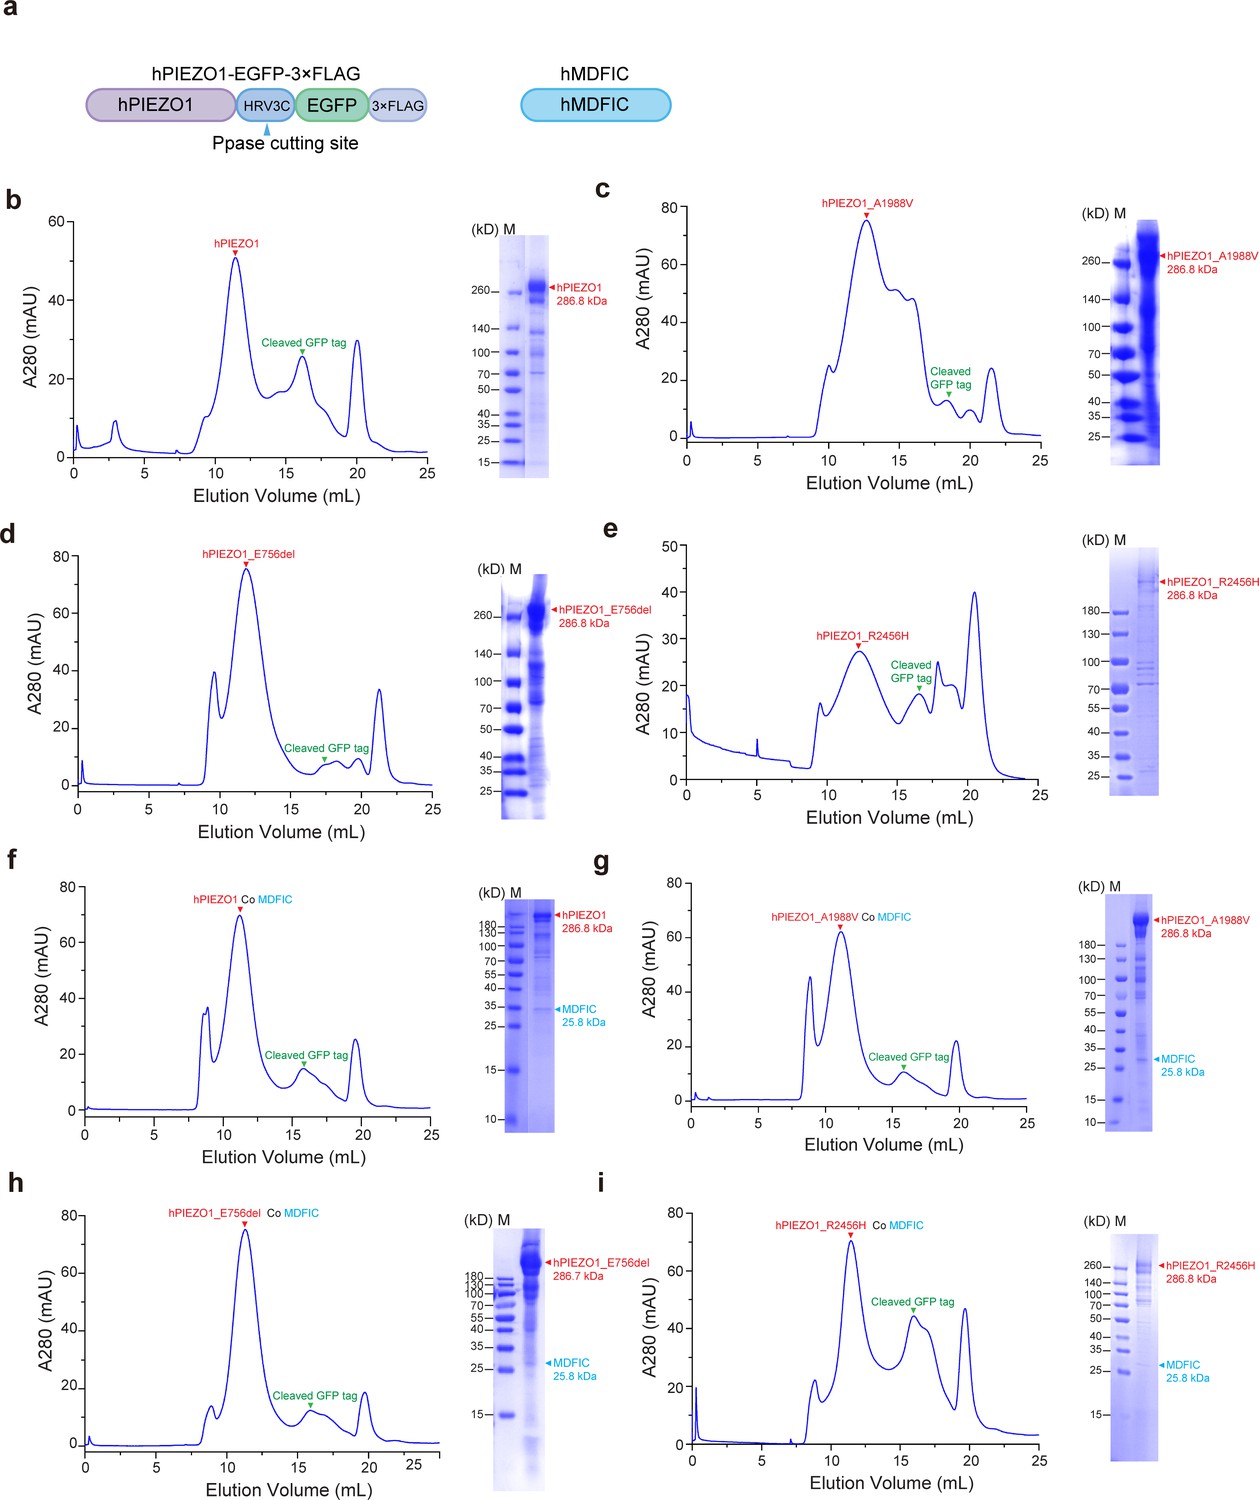
Purification procedures of human PIEZO1 (hPIEZO1), the channelopathy mutants with or without MDFIC proteins.
(a) A schematic diagram of the hPIEZO1-GFP-3×FLAG construct for protein purifications and electrophysiological studies. (b–e) Representative size-exclusion chromatography (SEC) traces and Coomassie staining SDS-PAGE analysis of purified wild-type (WT) hPIEZO1 (b), hPIEZO1-R2456H (c), hPIEZO1-A1988V (d), and hPIEZO1-E756del (e) protein samples. Red arrows denote the peak positions and bands of hPIEZO1 and its mutants. Green arrows denote the peak positions of cleaved GFP tag. (f–g) Representative size-exclusion chromatography (SEC) traces and Coomassie staining SDS-PAGE analysis of purified WT hPIEZO1 co hMDFIC (b), hPIEZO1-R2456H co hMDFIC (c), hPIEZO1-A1988V co hMDFIC (d), and hPIEZO1-E756del co hMDFIC (e) protein samples. The peak positions and bands of hPIEZO1 and its mutants are denoted by red arrows. Green arrows indicate the peak positions of cleaved GFP tag. Blue arrows represent the bands of hMDFIC.
Figure 1—figure supplement 3
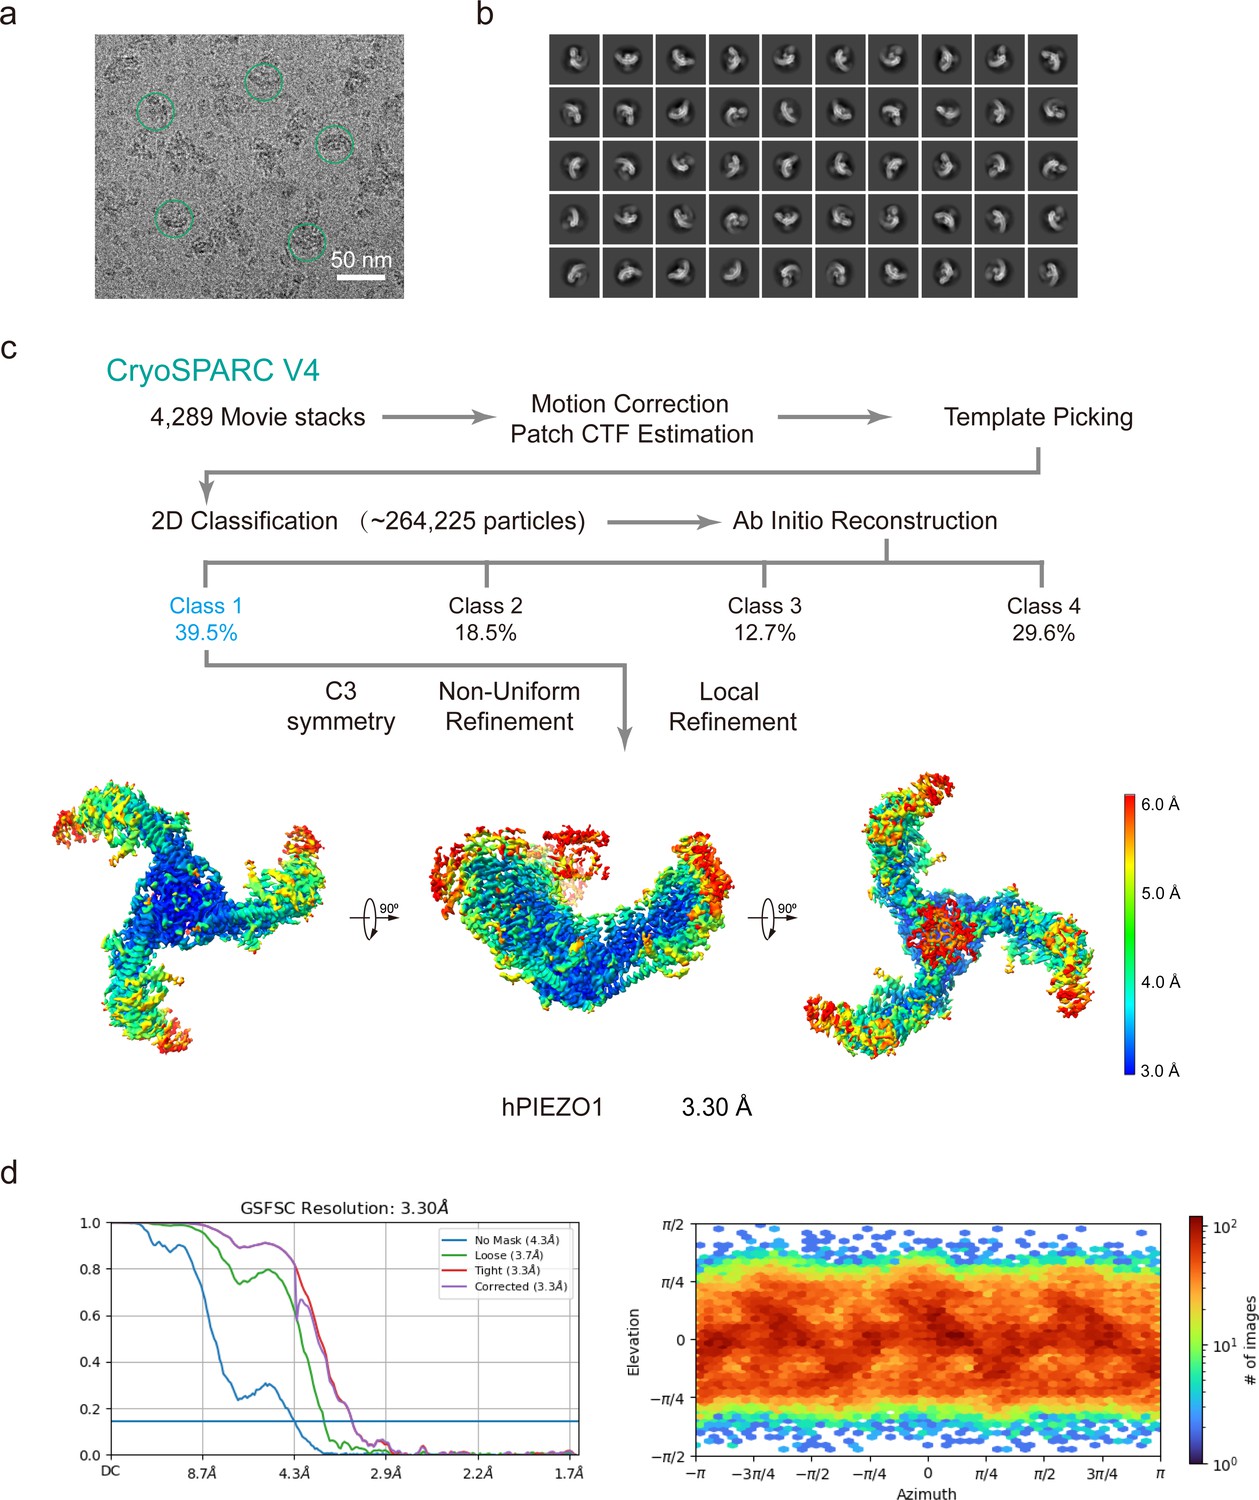
Cryo-EM data processing procedure of wild-type (WT) human PIEZO1 (hPIEZO1).
(a) Representative raw micrograph of hPIEZO1. (b) Representative 2D class averages of the cryo-EM particles of hPIEZO1. (c) Flowchart of the image processing procedure for hPIEZO1. Resolution estimation for the tight masked map is based on the criterion of a Fourier shell correlation (FSC) cutoff of 0.143. (d–e) Gold standard FSC curves of the final refined maps (d) and angular distribution histogram (e) of the final hPIEZO1 reconstruction. This is a standard output from cryoSPARC v4.
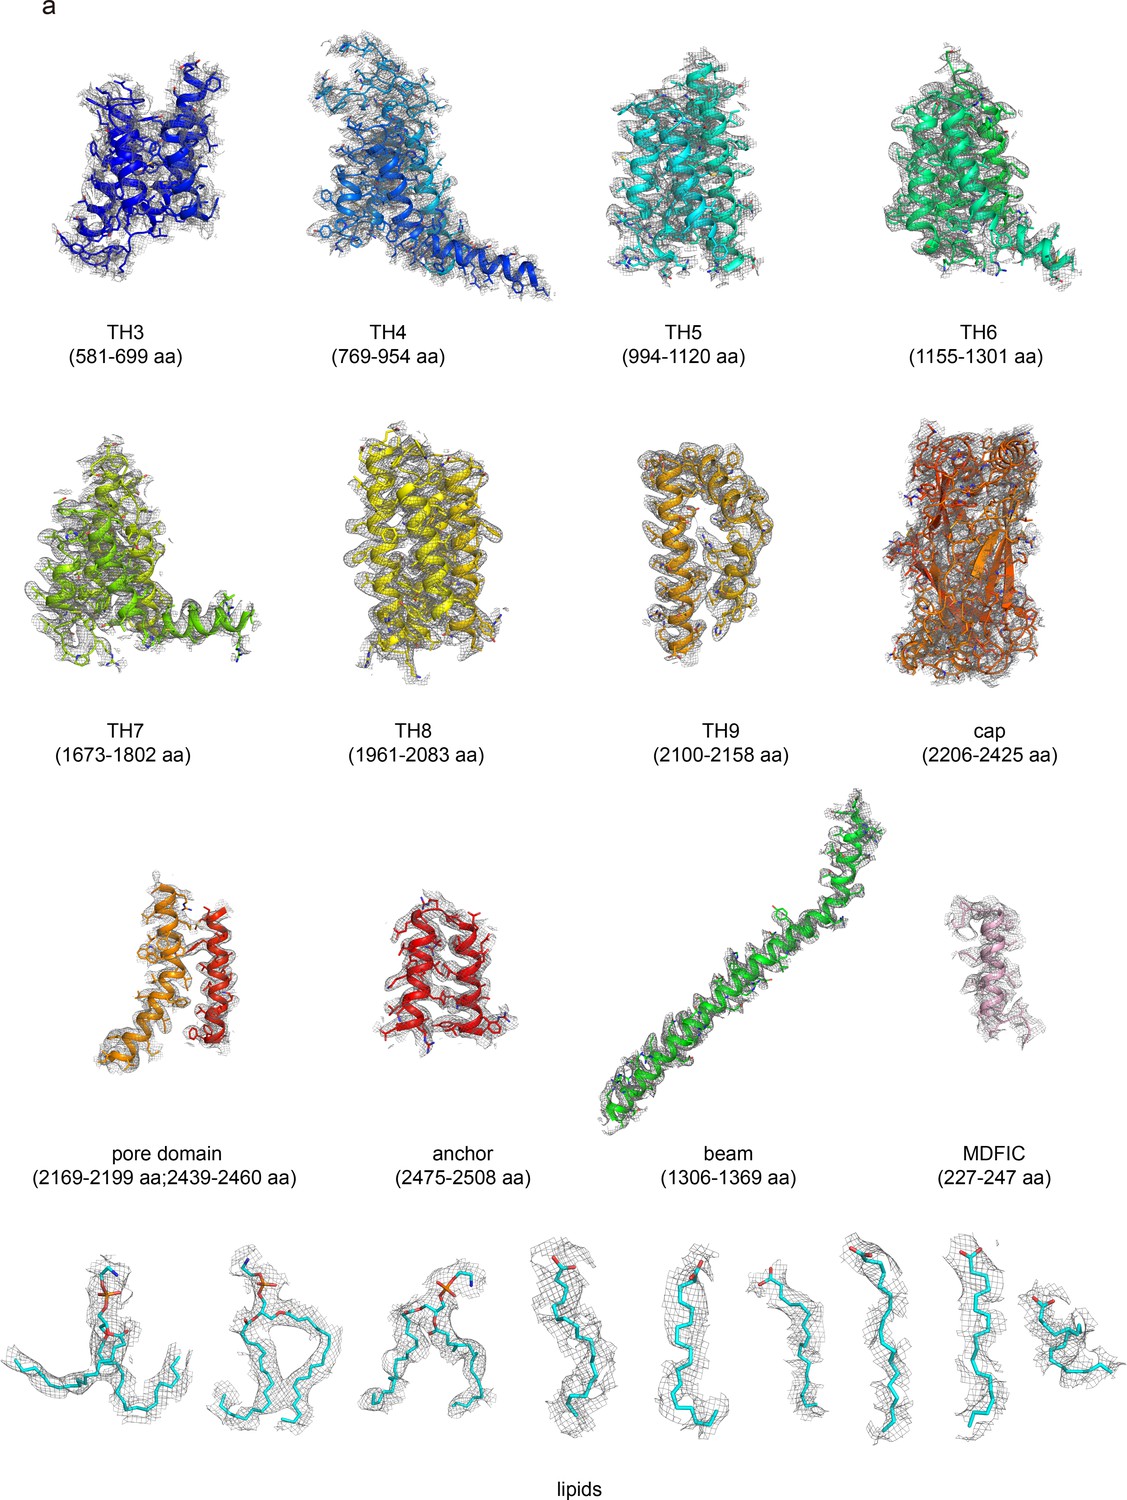
Figure 1—figure supplement 4
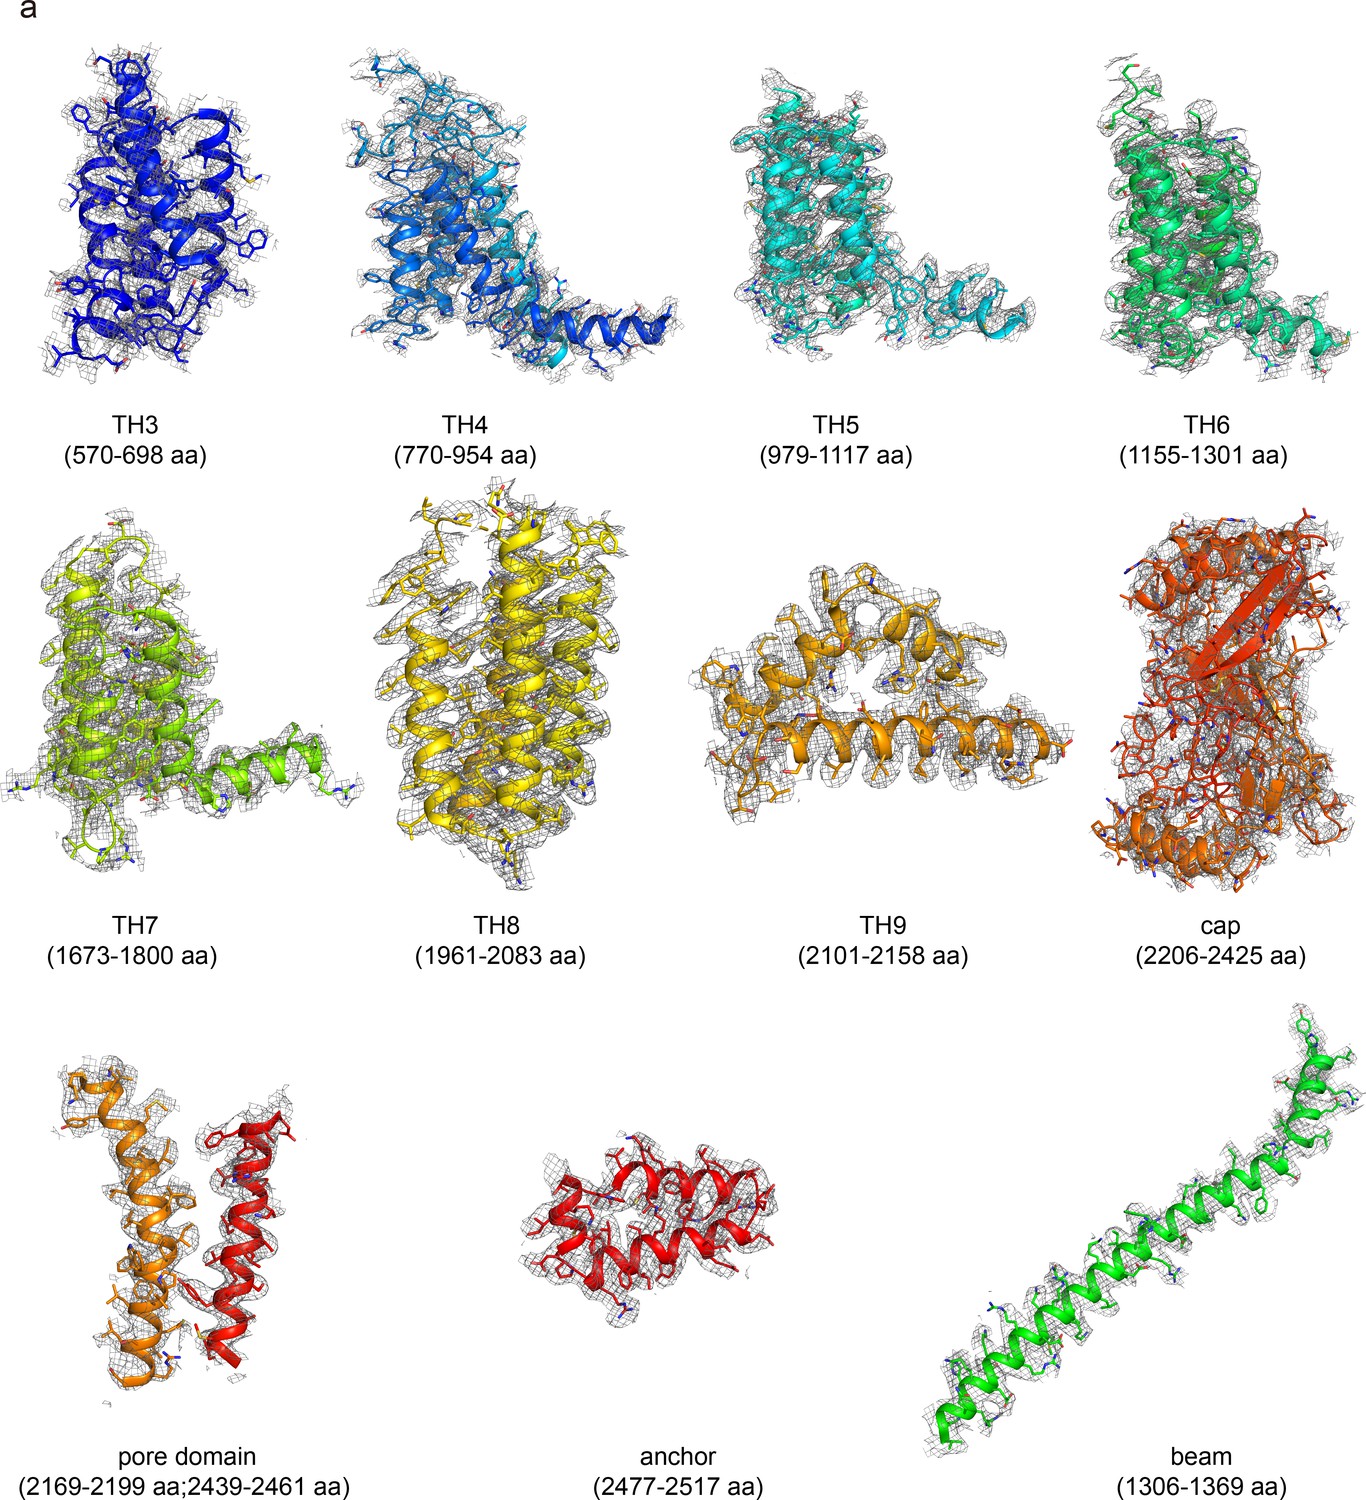
The EM density of wild-type (WT) human PIEZO1 (hPIEZO1).
The EM density segments of the transmembrane helices domain (TH3-TH9), cap domain, pore domain, anchor, and beam of WT hPIEZO1.
Figure 2
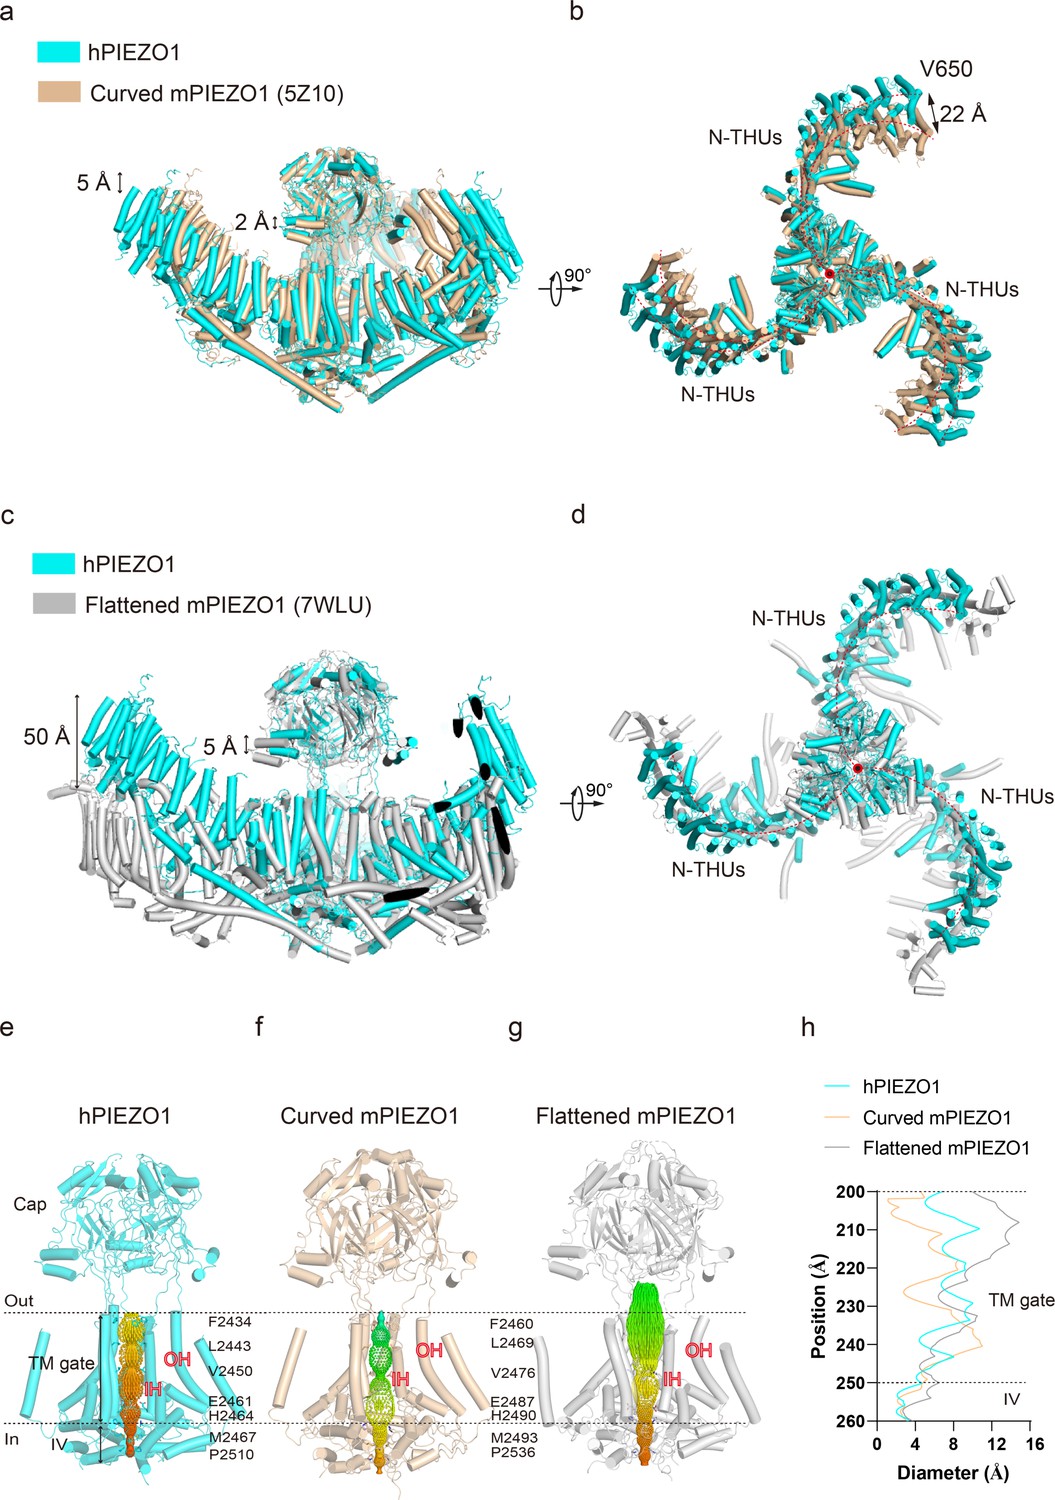
Structural comparison of human PIEZO1 (hPIEZO1) and mouse PIEZO1 (mPIEZO1).
(a) Structural comparison of hPIEZO1 (this study) and curved mPIEZO1 (5Z10) at side view. The distance of the distal blade between curved mPIEZO1 and hPIEZO1 is measured as 5 Å, and the distance of the cap between curved mPIEZO1 and hPIEZO1 is measured as 2 Å. (b) Structural comparison of hPIEZO1 (this study) and curved mPIEZO1 (5Z10) at top view. The distance between V650 residue in hPIEZO1 and the corresponding residue in curved mPIEZO1 is around 22 Å; therefore, the blades of hPIEZO1 present a contracted state from the top view. The blade center lines are shown as red dashed lines. (c) Structural comparison of hPIEZO1 (this study) and flattened mPIEZO1 (7WLU) at side view. Compared to the flattened mPIEZO1, the mimic membrane curvature of hPIEZO1 is between the curved and flattened mPIEZO1. (d) Structural comparison of hPIEZO1 (this study) and curved mPIEZO1 (5Z10) at top view. hPIEZO1 presents a similar extended state with the flattened mPIEZO1. (e) The cartoon model of the hPIEZO1 pore module with calculated pore. (f) The cartoon model of curved mPIEZO1 pore module with calculated pore. (g) The cartoon model of flattened mPIEZO1 pore module with calculated pore. (h) The calculated pore diameter of hPIEZO1 (cyan), curved mPIEZO1 (wheat), and flattened mPIEZO1 (gray) along the z axis.
Figure 3 with 2 supplements
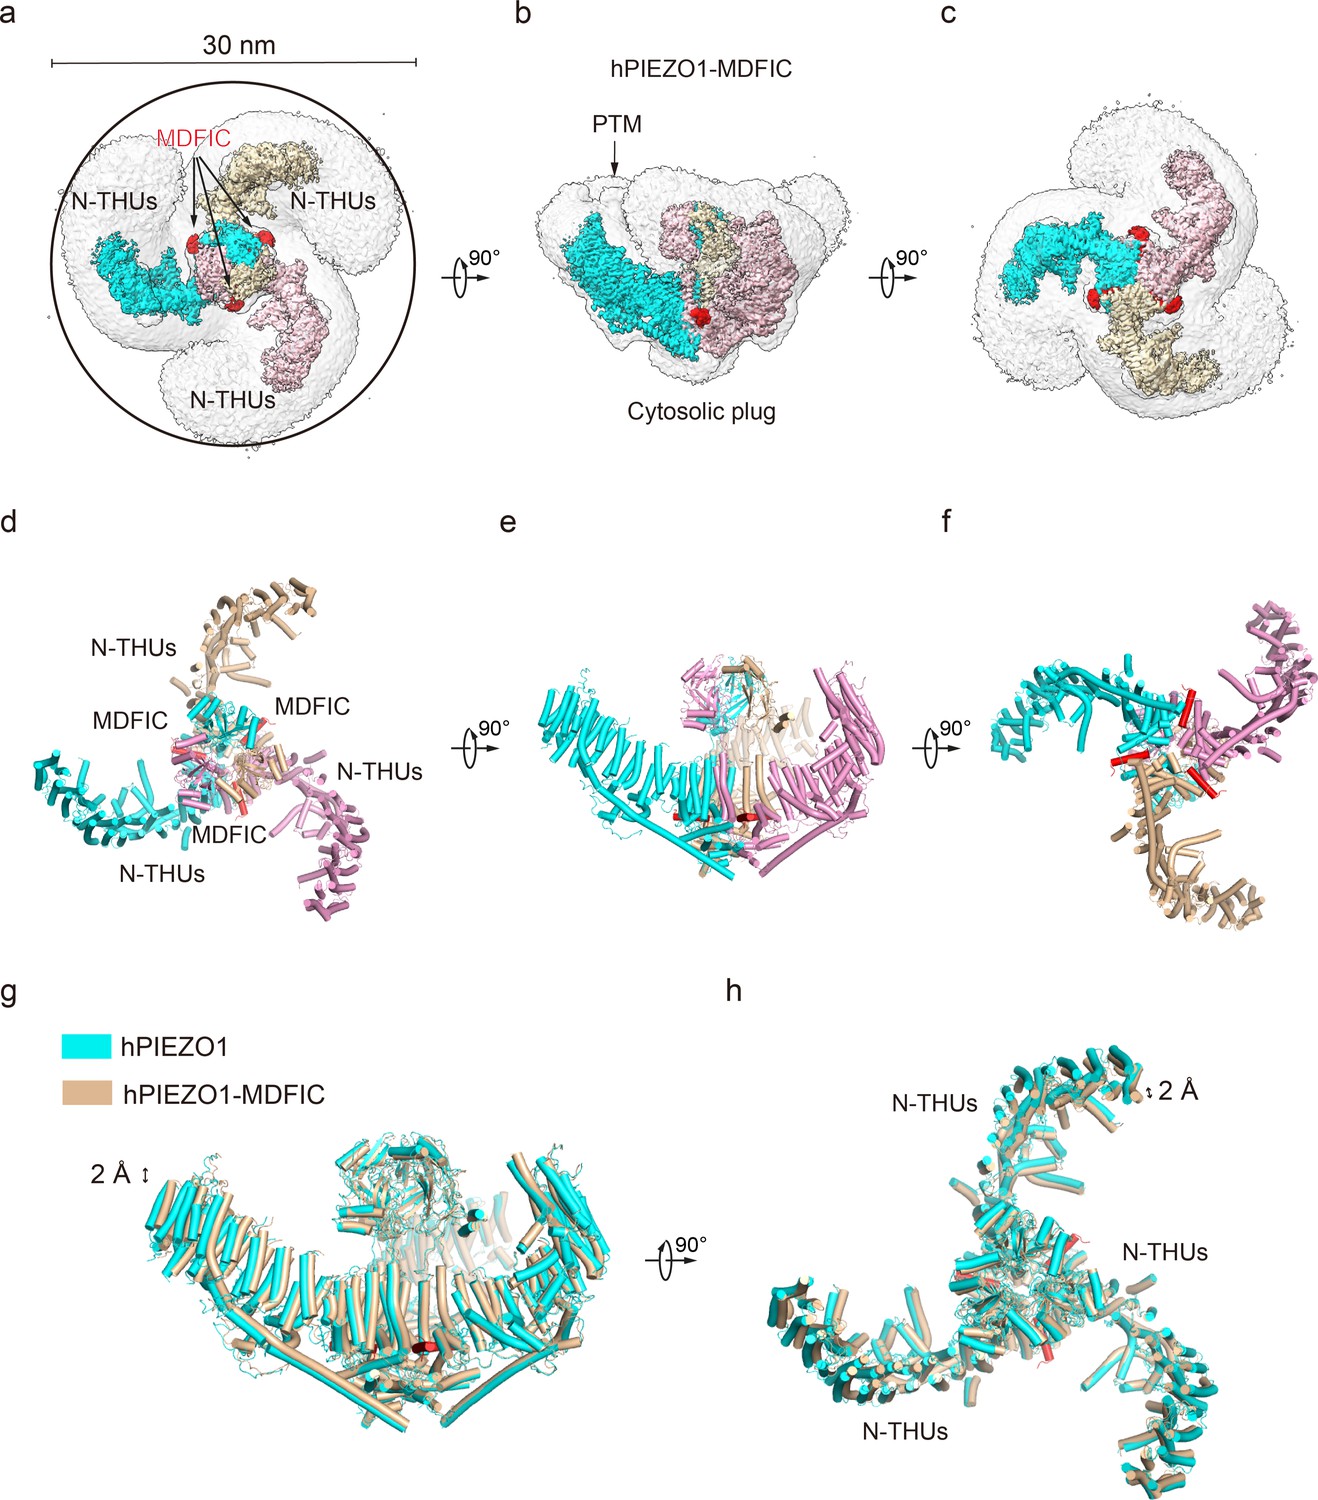
Structure of full-length human PIEZO1 (hPIEZO1)-MDFIC complex.
(a) The 3.0 Å cryo-EM density map of hPIEZO1-MDFIC at top view. The density of each single subunit is colored in cyan, wheat, and pink, respectively. The density of the three C-terminal helices of MDFIC is colored in red. Around 30 nm digitonin disk is shown as gray density by low pass filtering. (b) The 3.0 Å cryo-EM density map of hPIEZO1-MDFIC at the side view. The density of each single subunit is colored in cyan, wheat, and pink, respectively. The density of the three C-terminal helices of MDFIC is colored in red. The potential posttranslational modification (PTM) at the transmembrane helix units (THUs) region is indicated. A flexible density binds to the cytosolic plug, which may stand for an additional hPIEZO1 auxiliary subunit. (c) The 3.0 Å cryo-EM density map of hPIEZO1-MDFIC at bottom view. The density of each single subunit is colored in cyan, wheat, and pink, respectively. The density of three C-terminal helices of MDFIC is colored in red. (d) The cartoon model of hPIEZO1-MDFIC at the top view. Each single subunit is colored in cyan, wheat, and pink, respectively. Three C-terminal helices of MDFIC are colored in red. (e) The cartoon model of hPIEZO1-MDFIC at the side view. Each single subunit is colored in cyan, wheat, and pink, respectively. Three C-terminal helices of MDFIC are colored in red. (f) The cartoon model of hPIEZO1-MDFIC at the bottom view. Each single subunit is colored in cyan, wheat, and pink, respectively. Three C-terminal helices of MDFIC are colored in red. (g) Structural comparison of hPIEZO1 and hPIEZO1-MDFIC at side view. The motion of the distal blade between hPIEZO1 and hPIEZO1-MDFIC is around 2 Å from the side view. (h) Structural comparison of hPIEZO1 and hPIEZO1-MDFIC at top view. The motion of the distal blade between hPIEZO1 and hPIEZO1-MDFIC is around 2 Å from the top view.
Figure 3—figure supplement 1
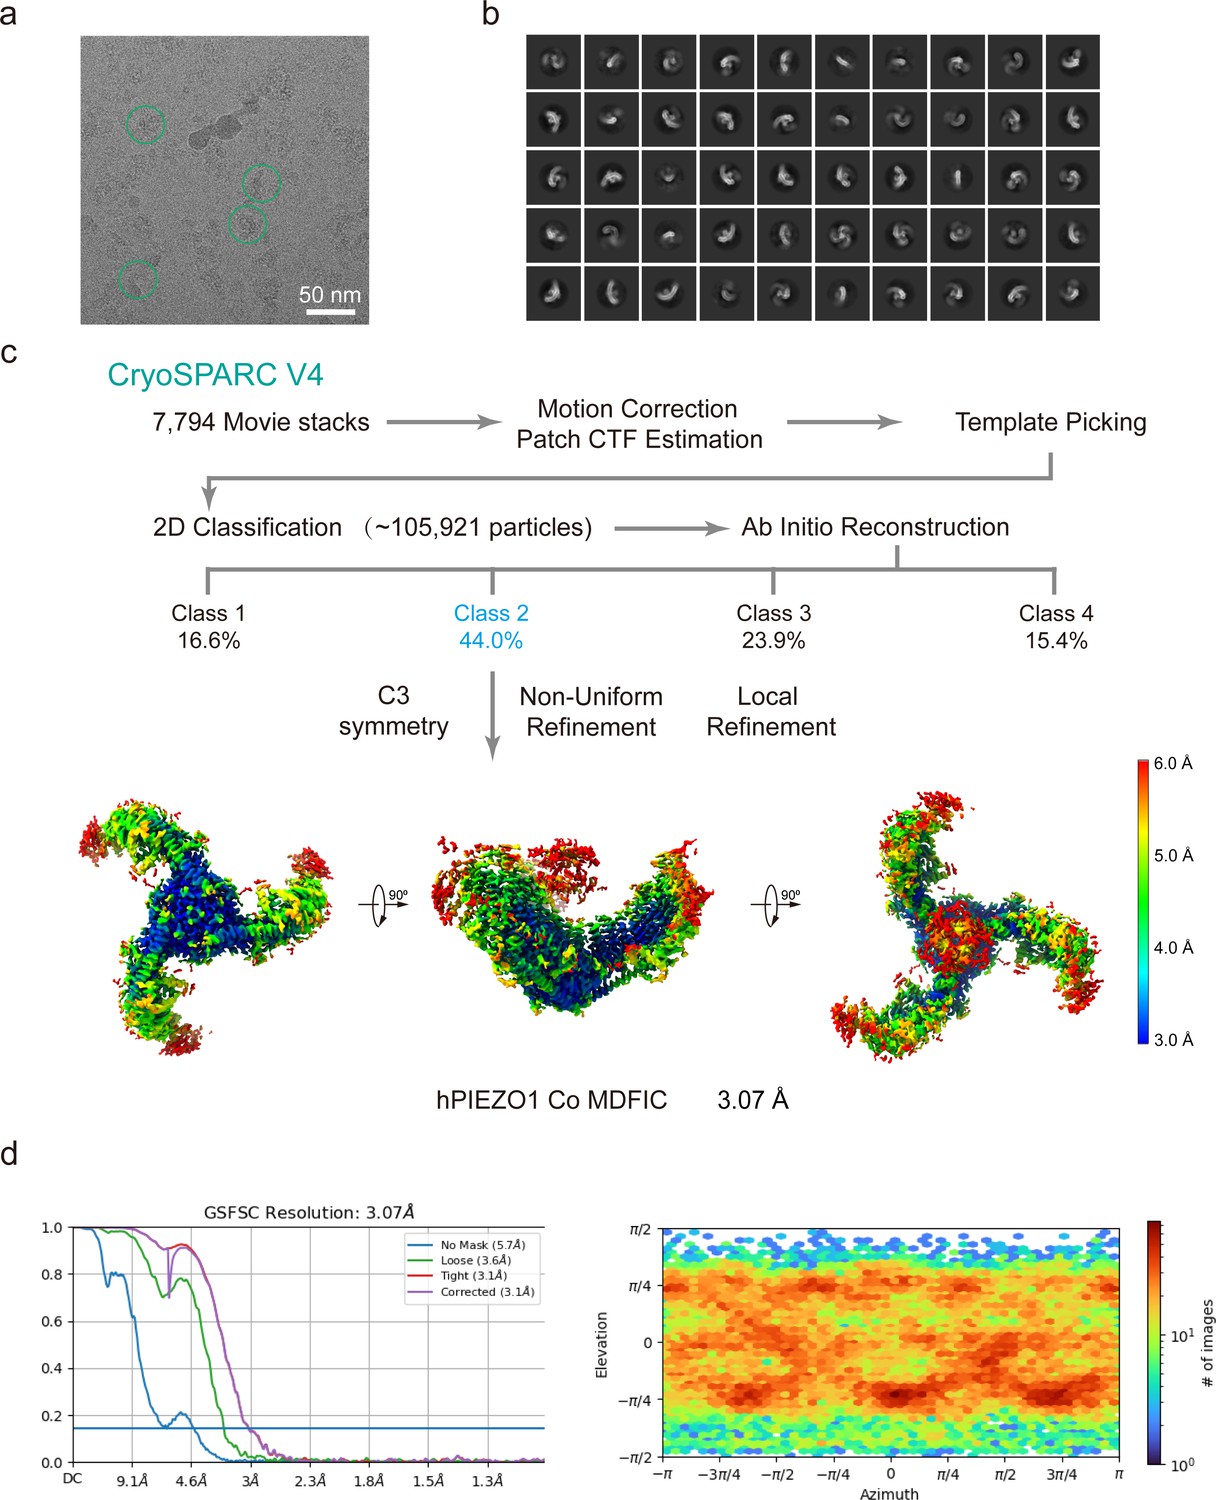
Cryo-EM data processing procedure of human PIEZO1 (hPIEZO1) co MDFIC.
(a) Representative raw micrograph of hPIEZO1 co MDFIC. (b) Representative 2D class averages of the cryo-EM particles of hPIEZO1 co MDFIC. (c) Flowchart of the image processing procedure for hPIEZO1 co MDFIC. Resolution estimation for the tight masked map is based on the criterion of a Fourier shell correlation (FSC) cutoff of 0.143. (d–e) Gold standard FSC curves of the final refined maps (d) and angular distribution histogram (e) of the final hPIEZO1 co MDFIC reconstruction. This is a standard output from cryoSPARC v4.
Figure 3—figure supplement 2
The EM density of human PIEZO1 (hPIEZO1)-E756del-MDFIC.
The EM density segments of the transmembrane helices domain (TH3-TH9), cap domain, pore domain, anchor, and beam of hPIEZO1-E756del. The EM density of the auxiliary subunit MDFIC and the bound lipids is also shown.
Figure 4 with 5 supplements
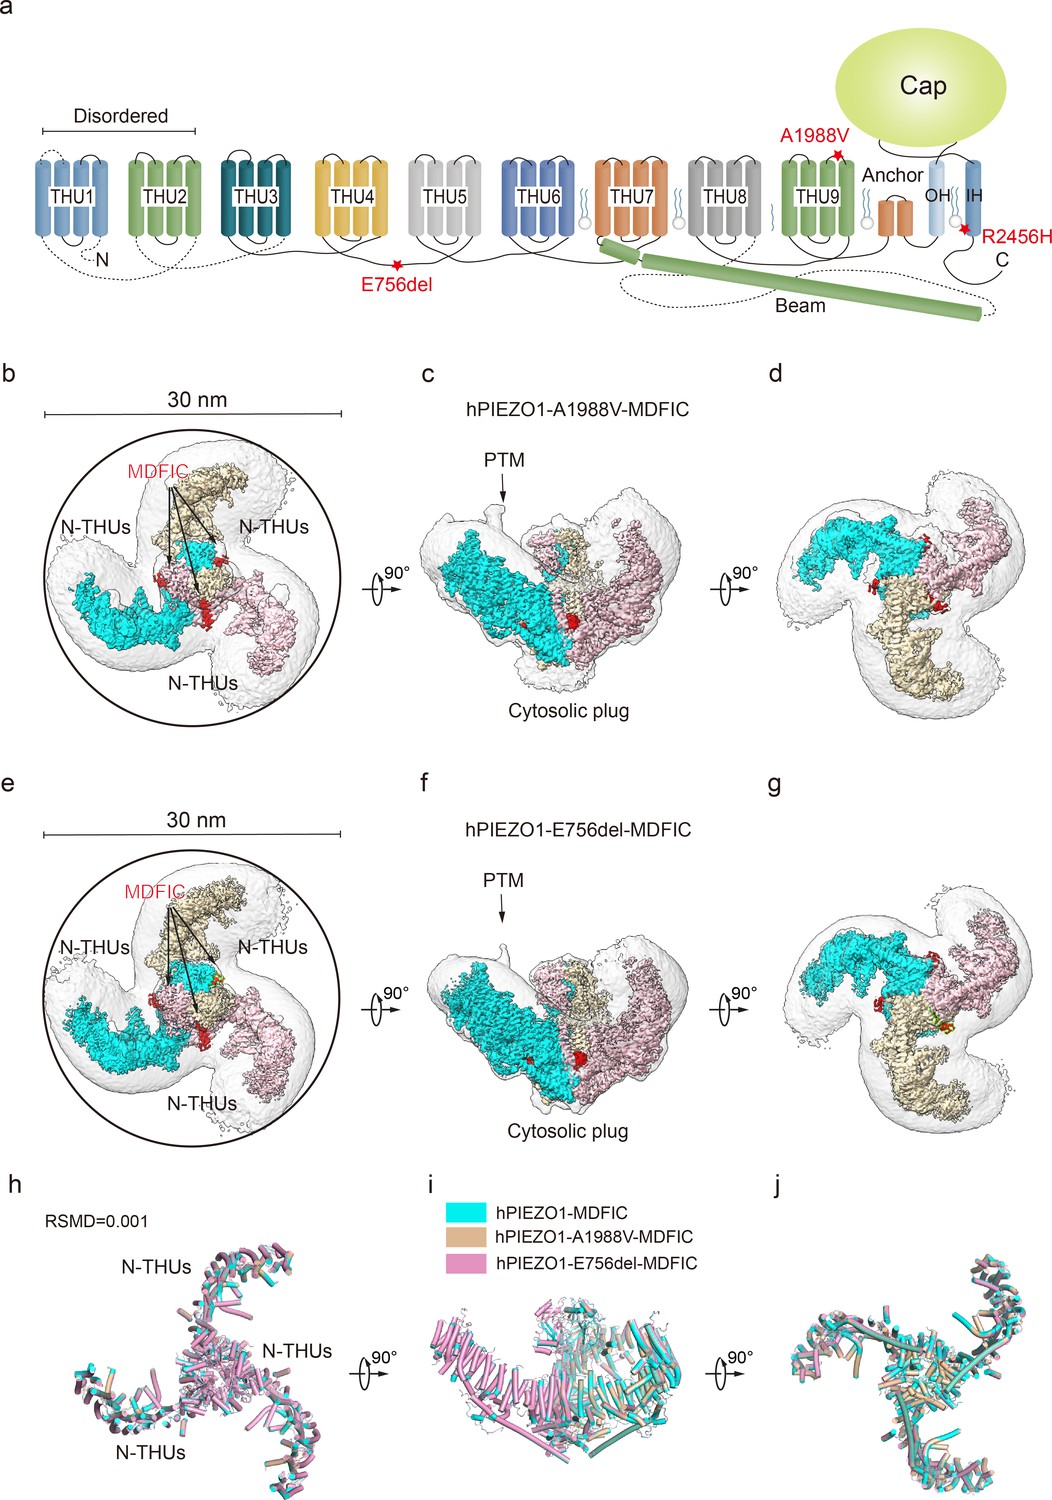
Structure of human PIEZO1 (hPIEZO1)-A1988V-MDFIC and hPIEZO1-E756del-MDFIC complex.
(a) 38-TM topology model of a single hPIEZO1 subunit. The E756del mutation is located at the THU4 and THU5 linker, the A1988V mutation is located at the THU9 linker, and the R2456H mutation is located at the IH of the pore module. (b) The 3.1 Å cryo-EM density map of hPIEZO1-A1988V-MDFIC at top view. The density of each single subunit is colored in cyan, wheat, and pink, respectively. The density of the three C-terminal helices of MDFIC is colored in red. Around 30 nm digitonin disk is shown as gray density by low pass filtering. (c) The 3.1 Å cryo-EM density map of hPIEZO1-A1988V-MDFIC at the side view. The density of each single subunit is colored in cyan, wheat, and pink, respectively. The density of the three C-terminal helices of MDFIC is colored in red. The potential posttranslational modification (PTM) at the transmembrane helix units (THUs) region is indicated. A flexible density binds to the cytosolic plug, which may represent an additional hPIEZO1 auxiliary. (d) The 3.1 Å cryo-EM density map of hPIEZO1-A1988V-MDFIC at the bottom view. The density of each single subunit is colored in cyan, wheat, and pink, respectively. (e) The 2.8 Å cryo-EM density map of hPIEZO1-E756del-MDFIC at top view. The density of each single subunit is colored in cyan, wheat, and pink, respectively. The density of the three C-terminal helices of MDFIC is colored in red. Around 30 nm digitonin disk is shown as gray density by low pass filtering. (f) The 2.8 Å cryo-EM density map of hPIEZO1-E756del-MDFIC at the side view. The density of each single subunit is colored in cyan, wheat, and pink, respectively. The density of the three C-terminal helices of MDFIC is colored in red. The potential PTM at the THUs region is indicated. A flexible density binds to the cytosolic plug, which may represent an additional hPIEZO1 auxiliary. (g) The 2.8 Å cryo-EM density map of hPIEZO1-E756del-MDFIC at the bottom view. The density of each single subunit is colored in cyan, wheat, and pink, respectively. (h) Superimposed cartoon models of hPIEZO1-MDFIC (cyan), hPIEZO1-A1988V-MDFIC (wheat), and hPIEZO1-E756del-MDFIC (pink) at top view. The RSMD is around 0.001, indicating that they are almost identical. (i) Superimposed cartoon models of hPIEZO1-MDFIC (cyan), hPIEZO1-A1988V-MDFIC (wheat), and hPIEZO1-E756del-MDFIC (pink) at the side view. (j) Superimposed cartoon models of hPIEZO1-MDFIC (cyan), hPIEZO1-A1988V-MDFIC (wheat), and hPIEZO1-E756del-MDFIC (pink) at bottom view.
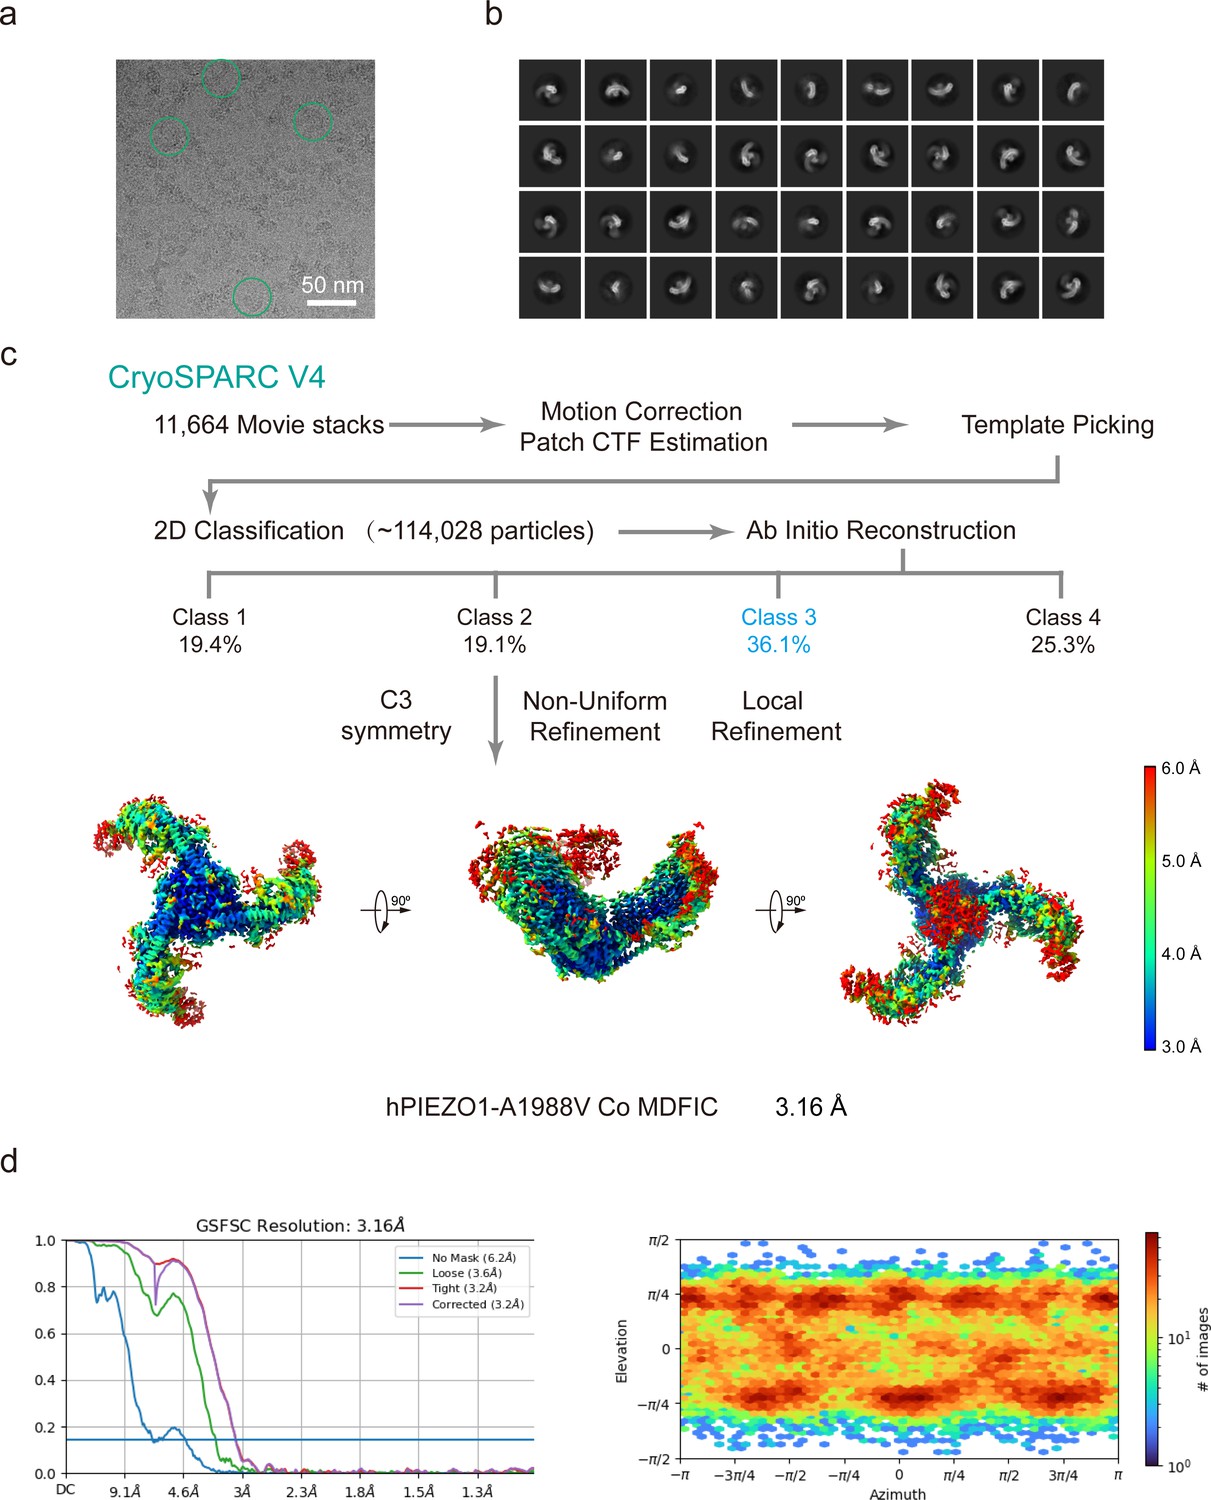
Figure 4—figure supplement 1
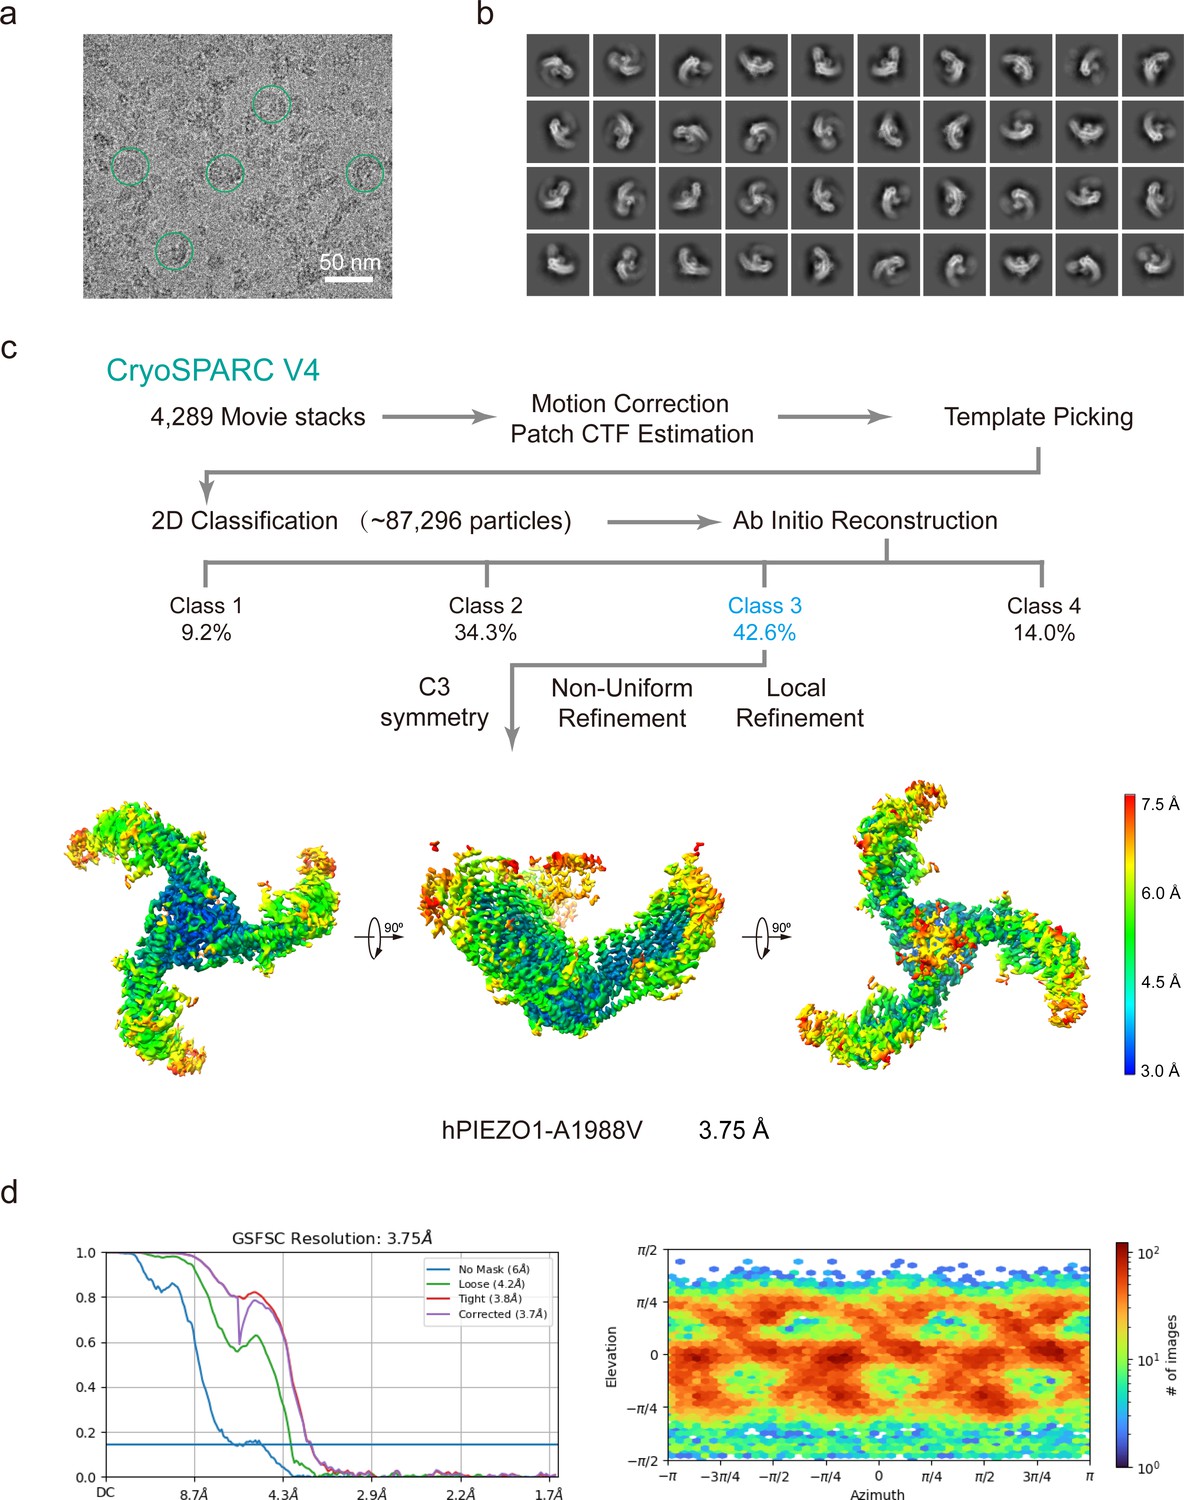
Cryo-EM data processing procedure of human PIEZO1 (hPIEZO1)-A1988V mutant.
(a) Representative raw micrograph of hPIEZO1-A1988V. (b) Representative 2D class averages of the cryo-EM particles of hPIEZO1- A1988V. (c) Flowchart of the image processing procedure for hPIEZO1-A1988V. Resolution estimation for the tight masked map is based on the criterion of a Fourier shell correlation (FSC) cutoff of 0.143. (d–e) Gold standard FSC curves of the final refined maps (d) and angular distribution histogram (e) of the final hPIEZO1-A1988V reconstruction. This is a standard output from cryoSPARC v4.
Figure 4—figure supplement 2
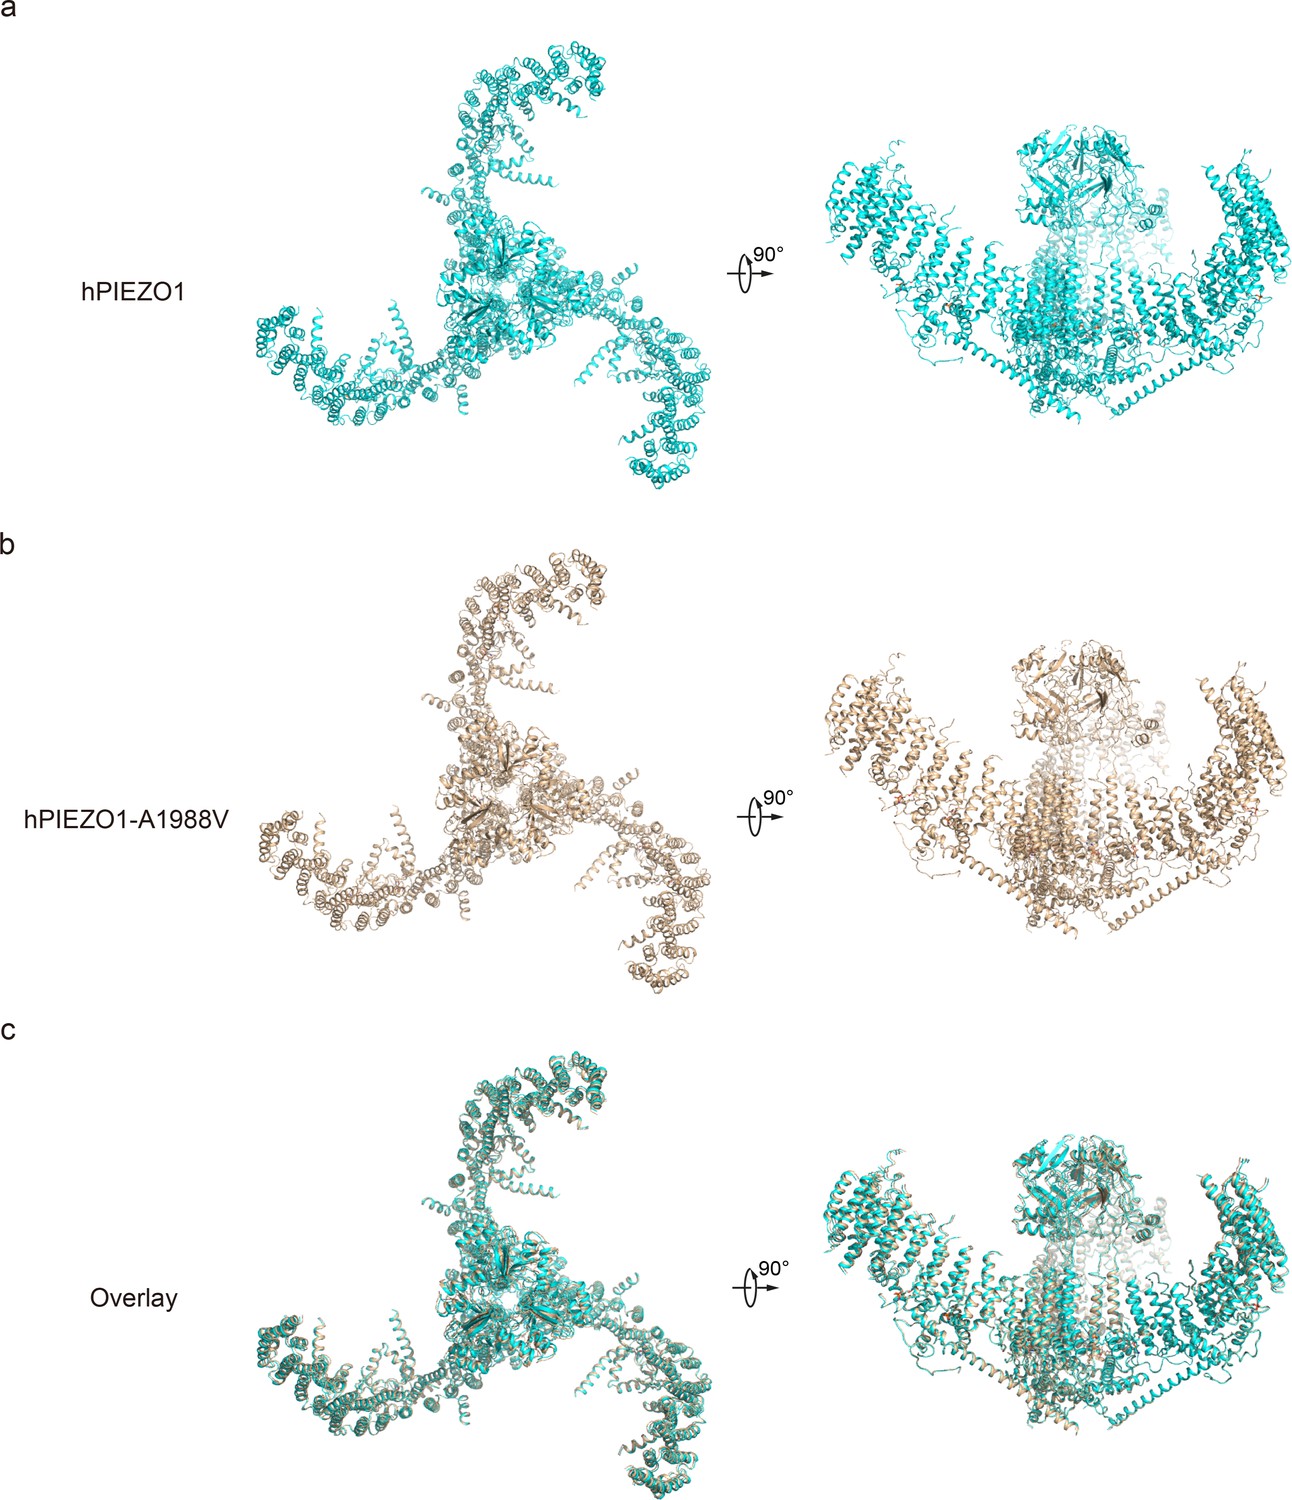
Structural comparison of human PIEZO1 (hPIEZO1) and hPIEZO1-A1988V.
(a) Overall structure of hPIEZO1 viewed from top (left) and side (right). (b) Overall structure of hPIEZO1-A1988V viewed from top (left) and side (right). (c) Overall structural comparison of hPIEZO1 (cyan) and hPIEZO1-A1988V (brown) viewed from top (left) and side (right).
Figure 4—figure supplement 3
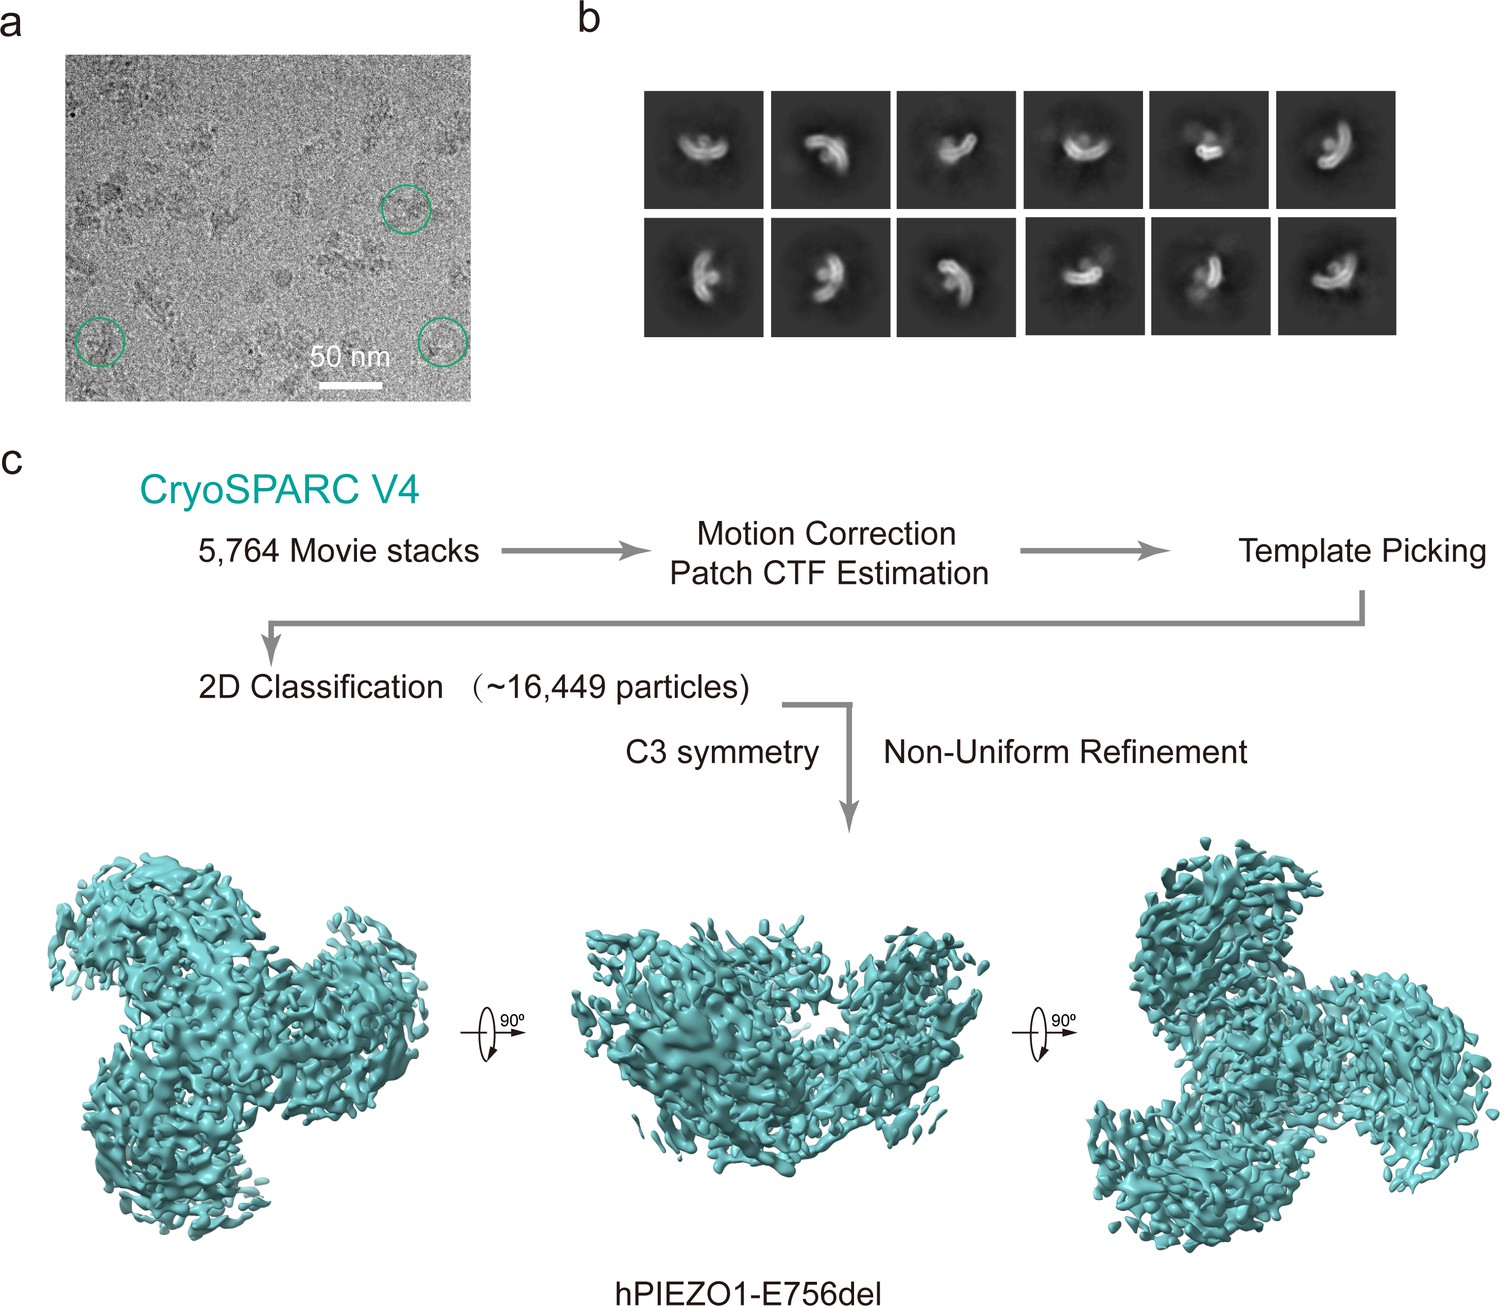
Cryo-EM data processing procedure of human PIEZO1 (hPIEZO1)-E756del mutant.
(a) Representative raw micrograph of hPIEZO1-E756del. (b) Representative 2D class averages of the cryo-EM particles of hPIEZO1-E756del. (c) Flowchart of the image processing procedure for hPIEZO1-E756del. This is a standard output from cryoSPARC v4.
Figure 4—figure supplement 4
Cryo-EM data processing procedure of human PIEZO1 (hPIEZO1)-A1988V co MDFIC.
(a) Representative raw micrograph of hPIEZO1-A1988V co MDFIC. (b) Representative 2D class averages of the cryo-EM particles of hPIEZO1-A1988V co MDFIC. (c) Flowchart of the image processing procedure for hPIEZO1-A1988V co MDFIC. Resolution estimation for the tight masked map is based on the criterion of a Fourier shell correlation (FSC) cutoff of 0.143. (d–e) Gold standard FSC curves of the final refined maps (d) and angular distribution histogram (e) of the final hPIEZO1-A1988V co MDFIC reconstruction. This is a standard output from cryoSPARC v4.
Figure 4—figure supplement 5
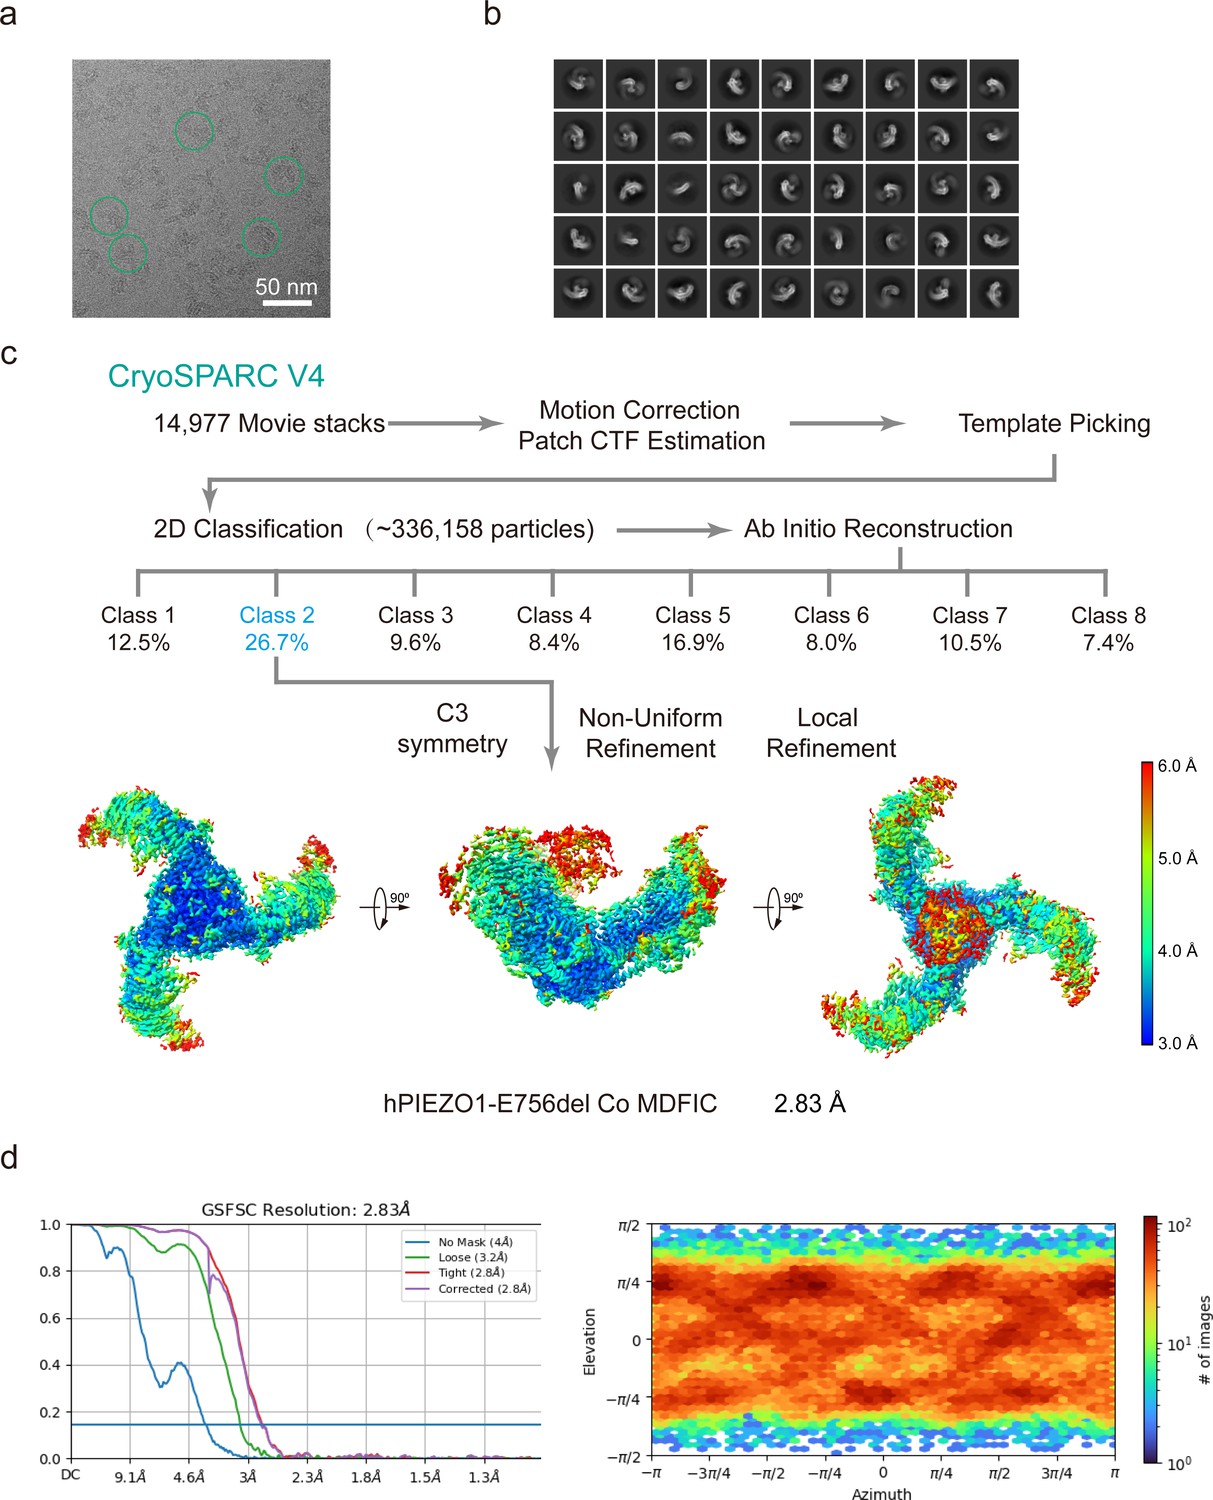
Cryo-EM data processing procedure of human PIEZO1 (hPIEZO1)-E756del co MDFIC.
(a) Representative raw micrograph of hPIEZO1-E756del co MDFIC. (b) Representative 2D class averages of the cryo-EM particles of hPIEZO1-E756del co MDFIC. (c) Flowchart of the image processing procedure for hPIEZO1-E756del co MDFIC. Resolution estimation for the tight masked map is based on the criterion of a Fourier shell correlation (FSC) cutoff of 0.143. (d–e) Gold standard FSC curves of the final refined maps (d) and angular distribution histogram (e) of the final hPIEZO1-E756del co MDFIC reconstruction. This is a standard output from cryoSPARC v4.
Figure 5 with 3 supplements
Structure of human PIEZO1 (hPIEZO1)-R2456H-MDFIC complex.
(a) The 4.5 Å cryo-EM density map of hPIEZO1-R2456H-MDFIC at top view. The density of each single subunit is colored in cyan, wheat, and pink, respectively. The density of the three C-terminal helices of MDFIC is colored in red. Around 25 nm digitonin disk of hPIEZO1-R2456H-MDFIC is shown as gray density by low pass filtering, smaller than the wild-type hPIEZO1-MDFIC. (b) The 4.5 Å cryo-EM density map of hPIEZO1-R2456H-MDFIC at the side view. The density of each single subunit is colored in cyan, wheat, and pink, respectively. The density of the three C-terminal helices of MDFIC is colored in red. The potential posttranslational modification (PTM) at the transmembrane helix units (THUs) region is indicated. A flexible density binds to the cytosolic plug, which may represent an additional hPIEZO1 auxiliary. (c) The 4.5 Å cryo-EM density map of hPIEZO1-R2456H-MDFIC at the bottom view. The density of each single subunit is colored in cyan, wheat, and pink, respectively. The density of the three C-terminal helices of MDFIC is colored in red. (d) The cartoon model of hPIEZO1-R2456H-MDFIC at the top view. Each single subunit is colored in cyan, wheat, and pink, respectively. Three C-terminal helices of MDFIC are colored in red. (e) The cartoon model of hPIEZO1-R2456H-MDFIC at the side view. Each single subunit is colored in cyan, wheat, and pink, respectively. Three C-terminal helices of MDFIC are colored in red. (f) The cartoon model of hPIEZO1-R2456H-MDFIC at the bottom view. Each single subunit is colored in cyan, wheat, and pink, respectively. Three C-terminal helices of MDFIC are colored in red. (g) Structural comparison of hPIEZO1-R2456H-MDFIC and hPIEZO1-MDFIC at side view. The motion of the distal blade between hPIEZO1-R2456H-MDFIC and hPIEZO1-MDFIC is around 7 Å from the side view. (h) Structural comparison of hPIEZO1-R2456H-MDFIC and hPIEZO1-MDFIC at top view. The motion of the distal blade between hPIEZO1-R2456H-MDFIC and hPIEZO1-MDFIC is around 7 Å from the top view. (i) The cartoon model of hPIEZO1 pore module with calculated pore. (j) The cartoon model of hPIEZO1-MDFIC pore module with calculated pore. (k) The cartoon model of hPIEZO1-R2456H-MDFIC pore module with calculated pore. (l) The calculated pore diameter of hPIEZO1 (cyan), hPIEZO1-MDFIC (pink), and flattened hPIEZO1-R2456H-MDFIC (wheat) along the z axis. The hPIEZO1-R2456H-MDFIC presents a more extended extracellular side pore.
Figure 5—figure supplement 1
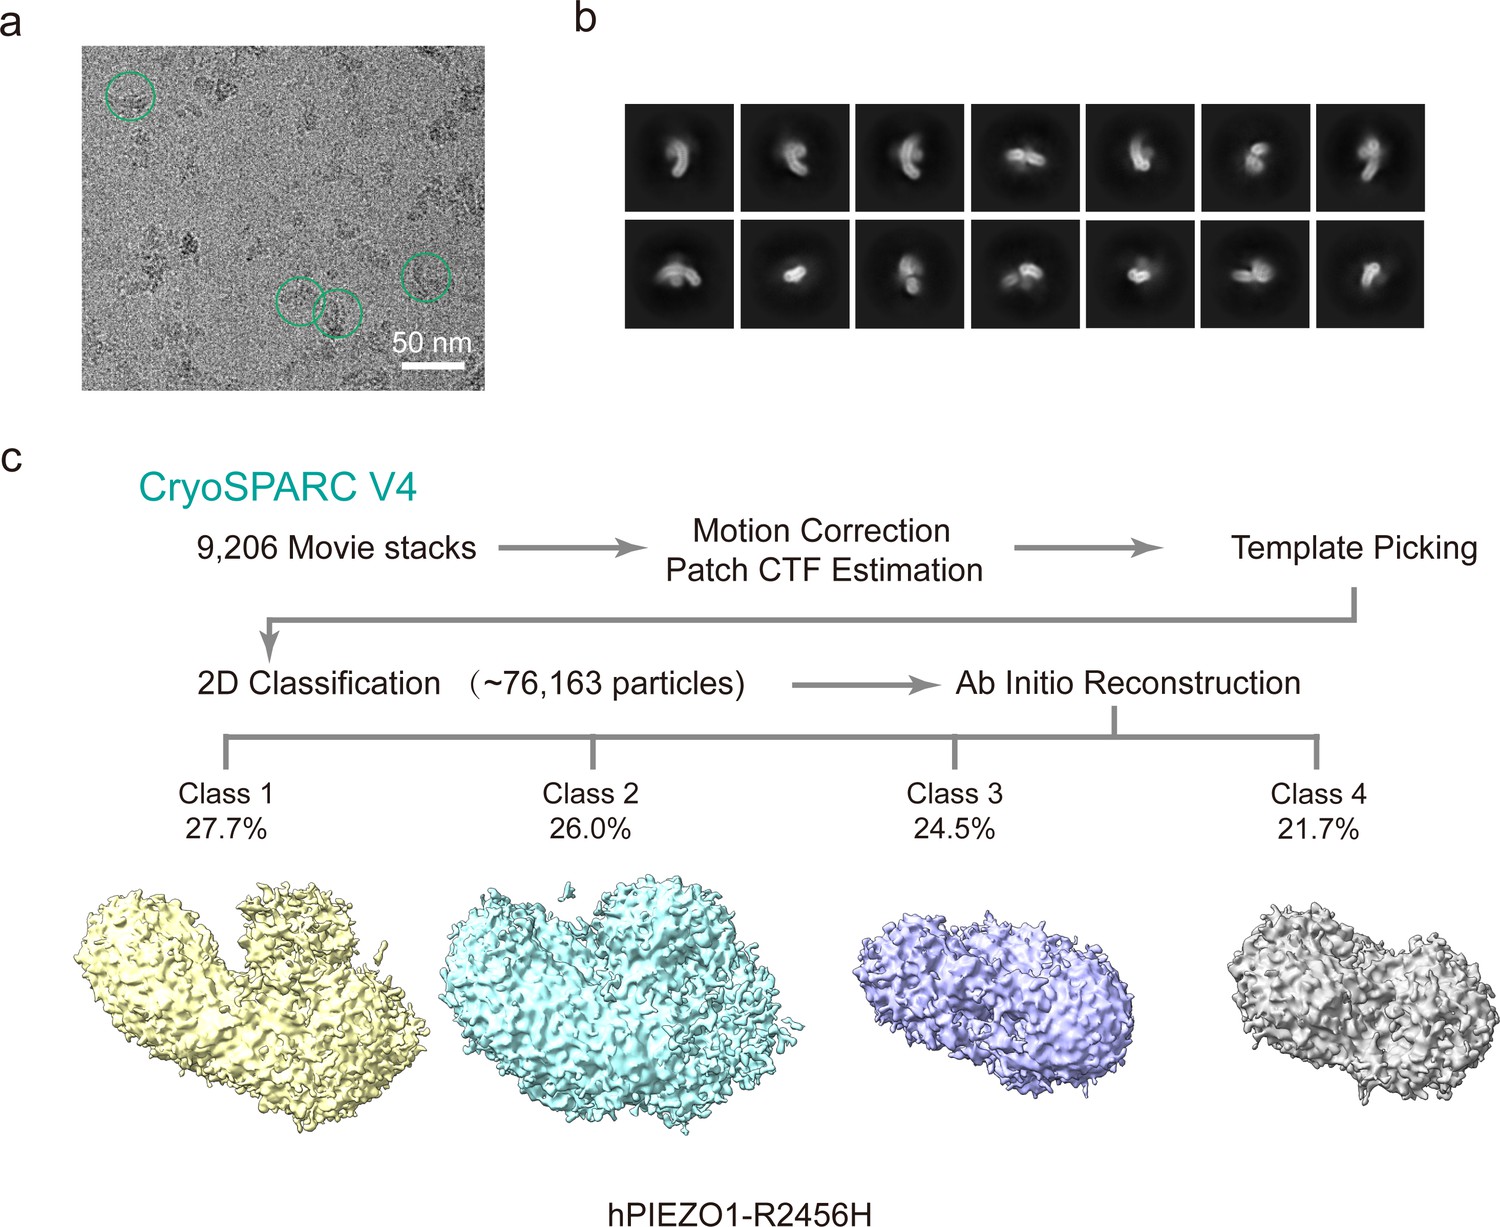
Cryo-EM data processing procedure of human PIEZO1 (hPIEZO1)-R2456H mutant.
(a) Representative raw micrograph of hPIEZO1-R2456H. (b) Representative 2D class averages of the cryo-EM particles of hPIEZO1-R2456H. (c) Flowchart of the image processing procedure for hPIEZO1-R2456H. This is a standard output from cryoSPARC v4.
Figure 5—figure supplement 2
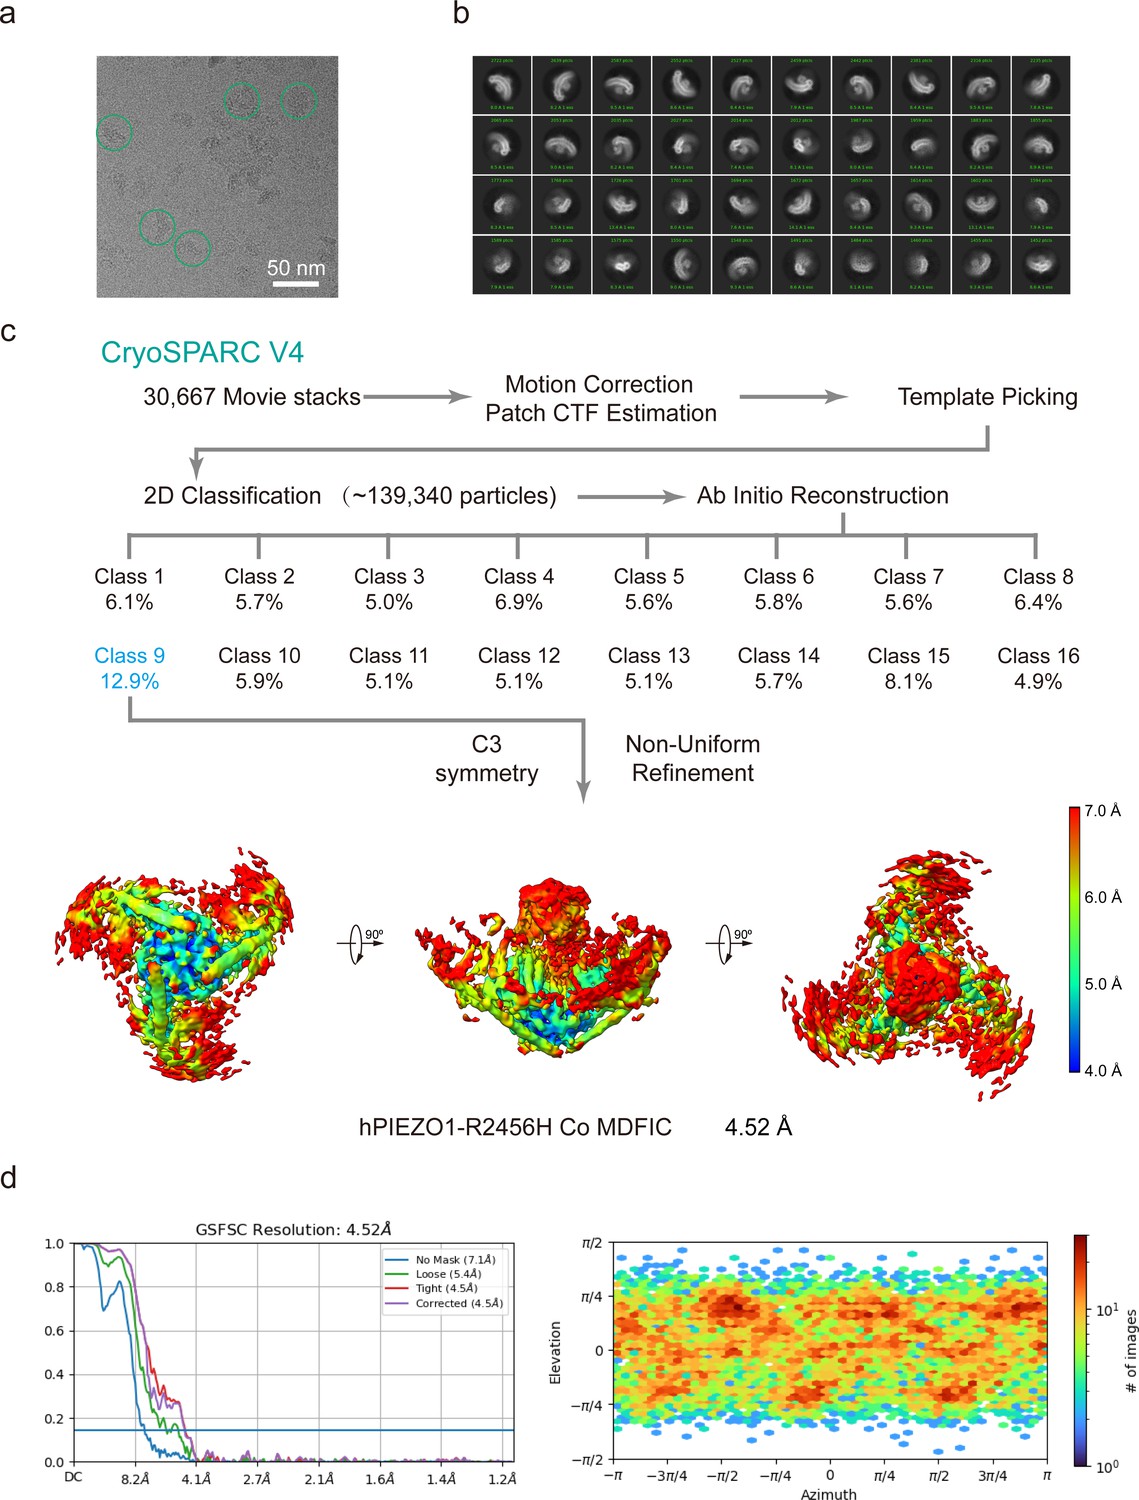
Cryo-EM data processing procedure of human PIEZO1 (hPIEZO1)-R2456H co MDFIC.
(a) Representative raw micrograph of hPIEZO1-R2456H co MDFIC. (b) Representative 2D class averages of the cryo-EM particles of hPIEZO1-R2456H co MDFIC. (c) Flowchart of the image processing procedure for hPIEZO1-R2456H co MDFIC. Resolution estimation for the tight masked map is based on the criterion of a Fourier shell correlation (FSC) cutoff of 0.143. (d–e) Gold standard FSC curves of the final refined maps (d) and angular distribution histogram (e) of the final hPIEZO1-R2456H co MDFIC reconstruction. This is a standard output from cryoSPARC v4.
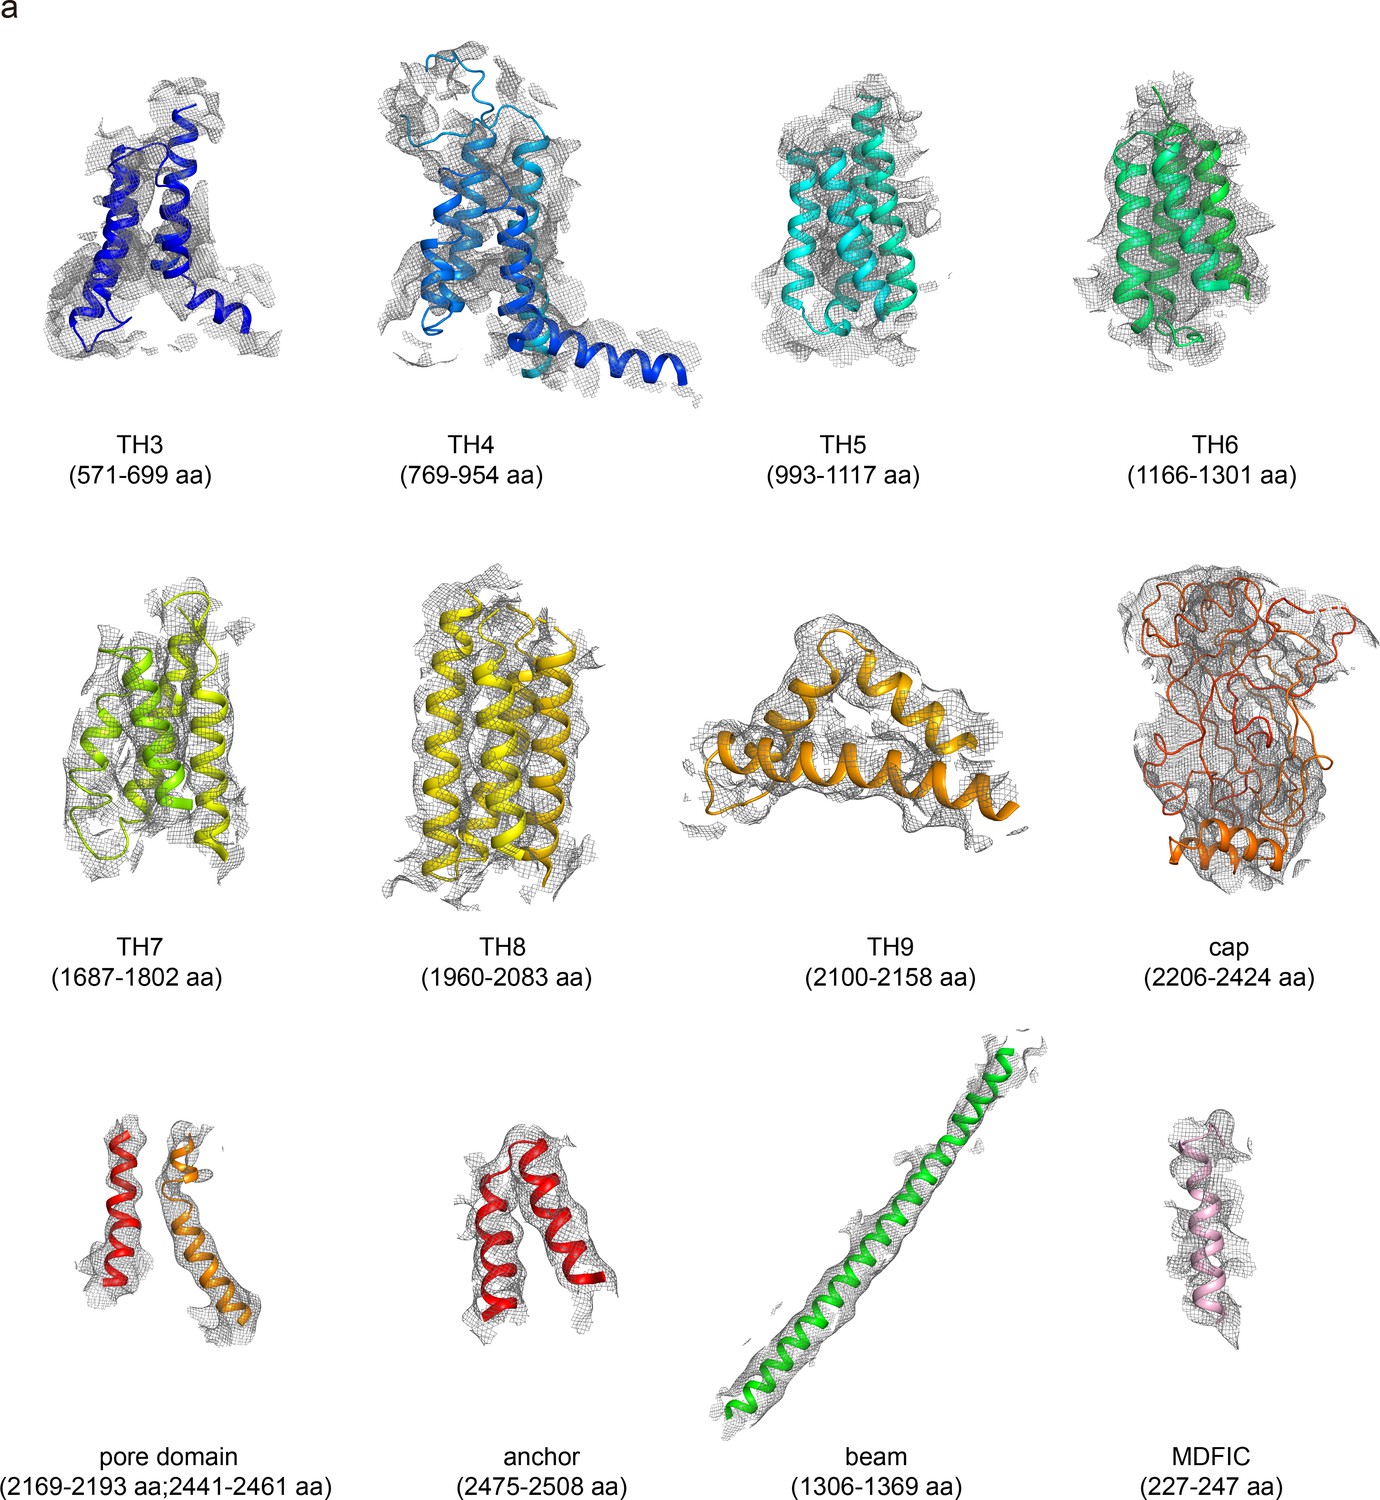
Figure 5—figure supplement 3
The EM density of human PIEZO1 (hPIEZO1)-R2456H co MDFIC.
The EM density segments of the transmembrane helices domain (TH3-TH9), cap domain, pore domain, anchor, and beam of hPIEZO1-R2456H co MDFIC. The EM density of the auxiliary subunit MDFIC and the bound lipids is also shown.
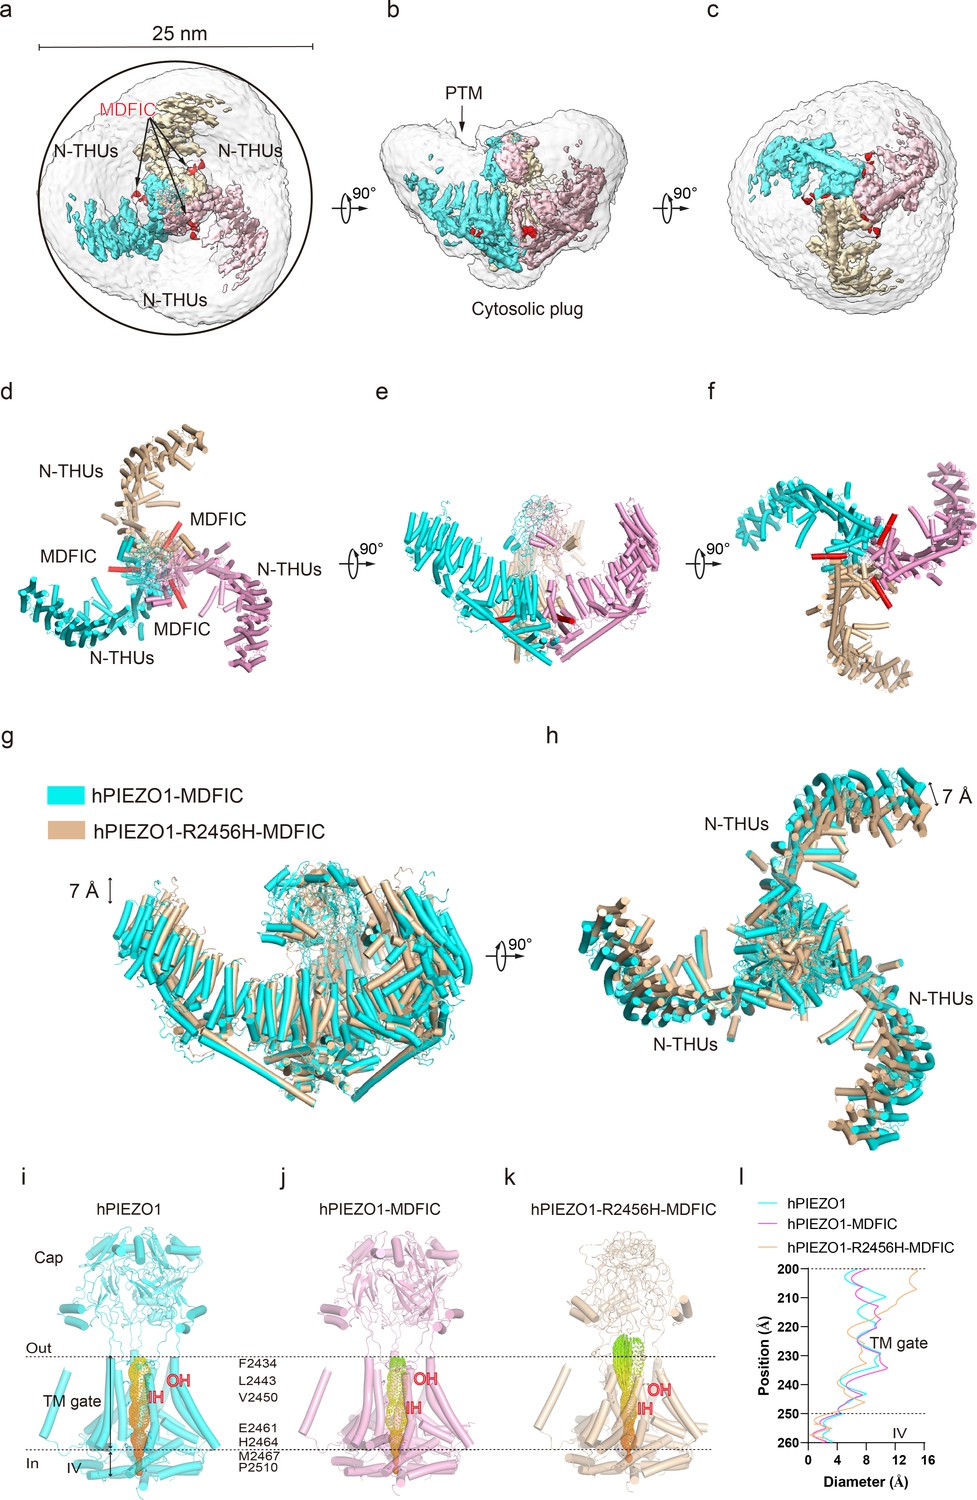
Figure 6
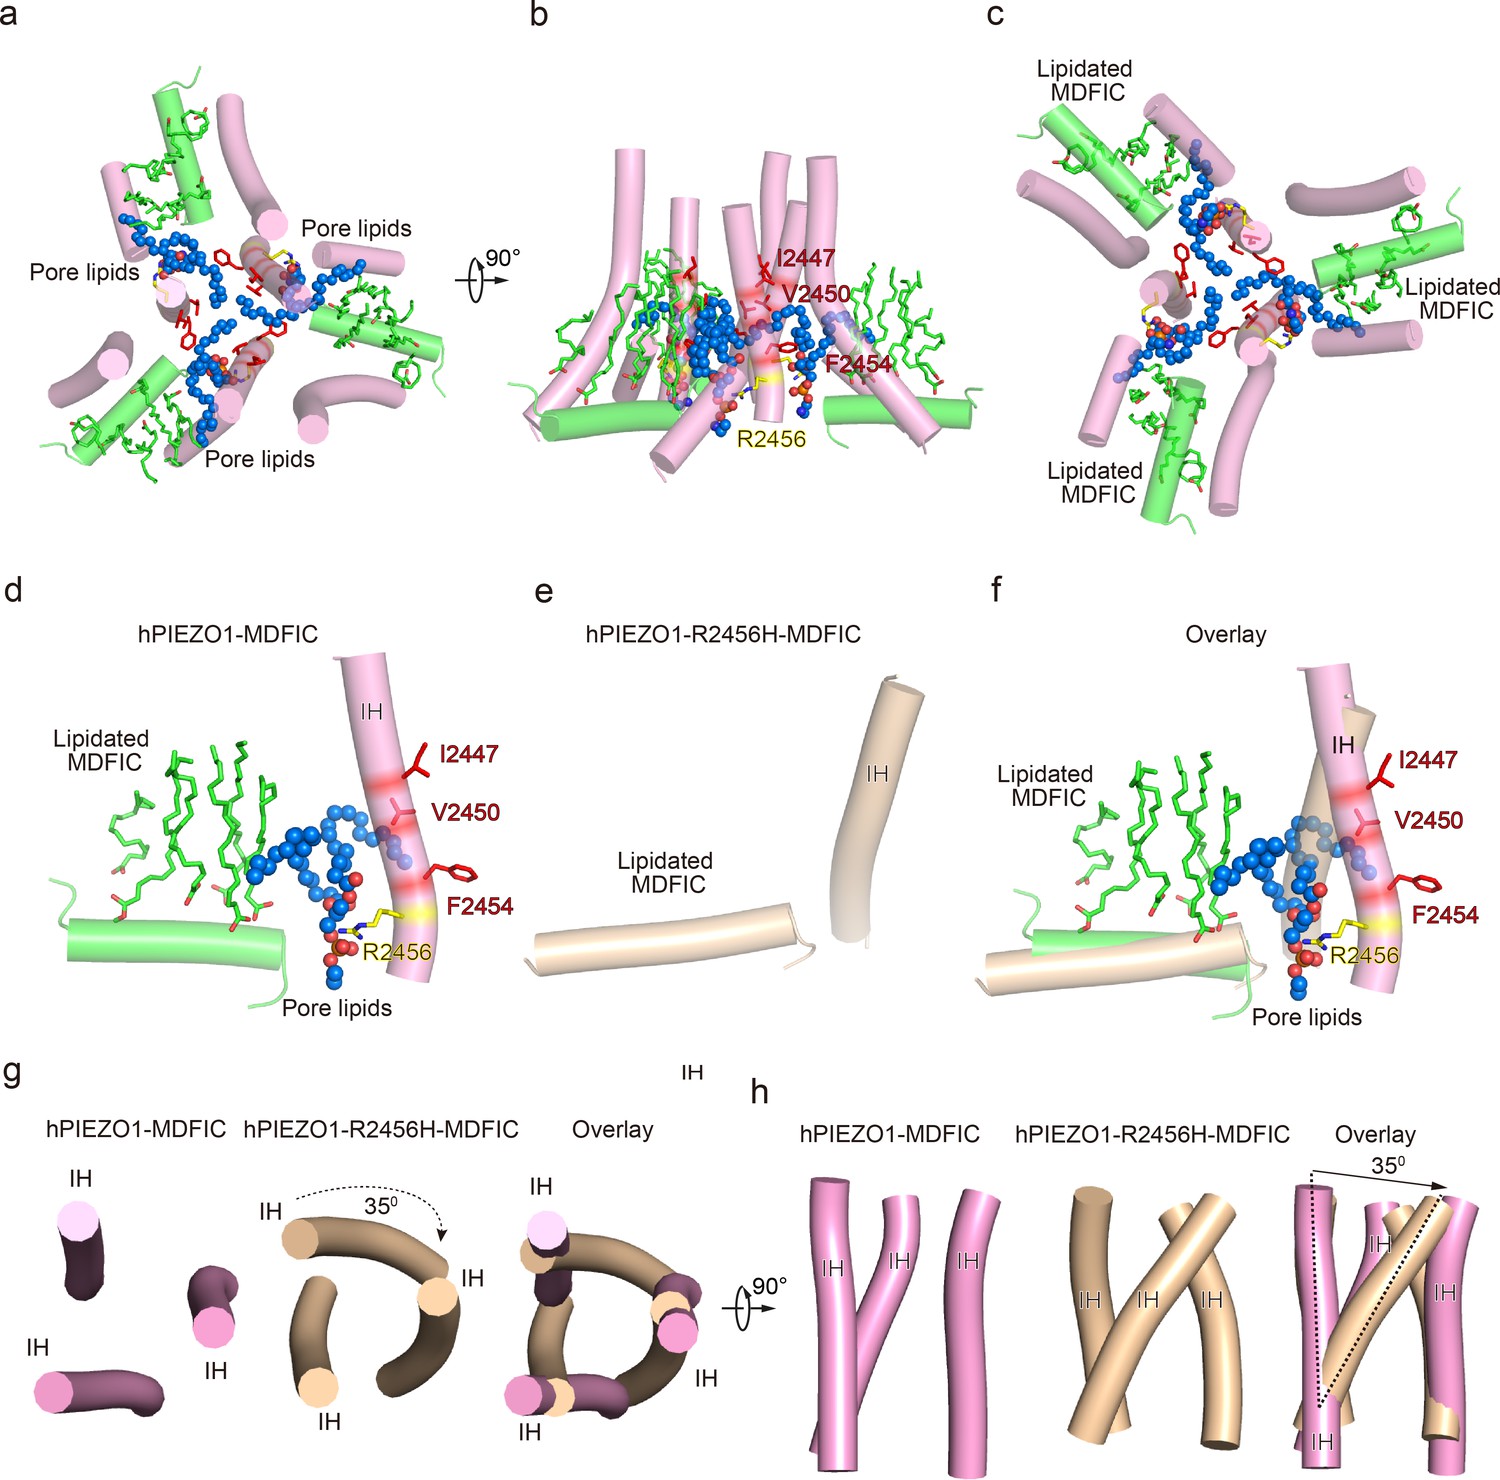
The pore module, multi-lipidated MDFIC and pore lipid interaction, and the pore remodeling of the hereditary erythrocytosis (HX) pathogenesis R2456H mutant.
(a) The cartoon model of human PIEZO1 (hPIEZO1)-MDFIC/hPIEZO1-A1988V-MDFIC/hPIEZO1-E756del-MDFIC pore module at top view. The marine spheres present the pore lipids. (b) The cartoon model of hPIEZO1-MDFIC/hPIEZO1-A1988V-MDFIC/hPIEZO1-E756del-MDFIC pore module at side view. The hydrophobic pore region formed by I2447, V2450, and F2454 is marked by red. The R2456 on the lateral side of the inner helix of the pore is marked by yellow. (c) The cartoon model of hPIEZO1-MDFIC/hPIEZO1-A1988V-MDFIC/hPIEZO1-E756del-MDFIC pore module at bottom view. The multi-lipidated MDFIC subunits are colored in green and marked. One hydrophobic fatty acid chain of the pore lipid occupies the hydrophobic pore region. Another hydrophobic fatty acid chain of the pore lipid interacts with the fatty acid chains of the MDFIC-covalently linked lipids. In contrast, the hydrophilic head of the pore lipid directly interacts with the R2456 on the lateral side of the inner helix of the pore, thus forming a stable hPIEZO1-multi-lipidated MDFIC-pore lipid complex. The pore lipids seal the pore and prevent ion flow. (d) The cartoon model of hPIEZO1-MDFIC/hPIEZO1-A1988V-MDFIC/hPIEZO1-E756del-MDFIC IH, pore lipid, and multi-lipidated MDFIC interactions. The multi-lipidated MDFIC subunits are colored in green. The marine spheres present the pore lipids. The hydrophobic pore region formed by I2447, V2450, and F2454 is marked by red. The R2456 on the lateral side of the inner helix of the pore is marked by yellow. (e) The cartoon model of twisted IH and MDFIC in hPIEZO1-R2456H-MDFIC. (f) The overlay cartoon model of IH and MDFIC in hPIEZO1-MDFIC/hPIEZO1-A1988V-MDFIC/hPIEZO1-E756del-MDFIC and hPIEZO1-R2456H-MDFIC. (g) The cartoon model of TM pore in hPIEZO1-MDFIC/hPIEZO1-A1988V-MDFIC/hPIEZO1-E756del-MDFIC and hPIEZO1-R2456H-MDFIC at top view. The TM pore of hPIEZO1-R2456H-MDFIC presents a twisted and extended state. (h) The cartoon model of TM pore in hPIEZO1-MDFIC/hPIEZO1-A1988V-MDFIC/hPIEZO1-E756del-MDFIC, and hPIEZO1-R2456H-MDFIC at side view. The TM pore of hPIEZO1-R2456H-MDFIC presents a twisted and extended state.
Figure 7
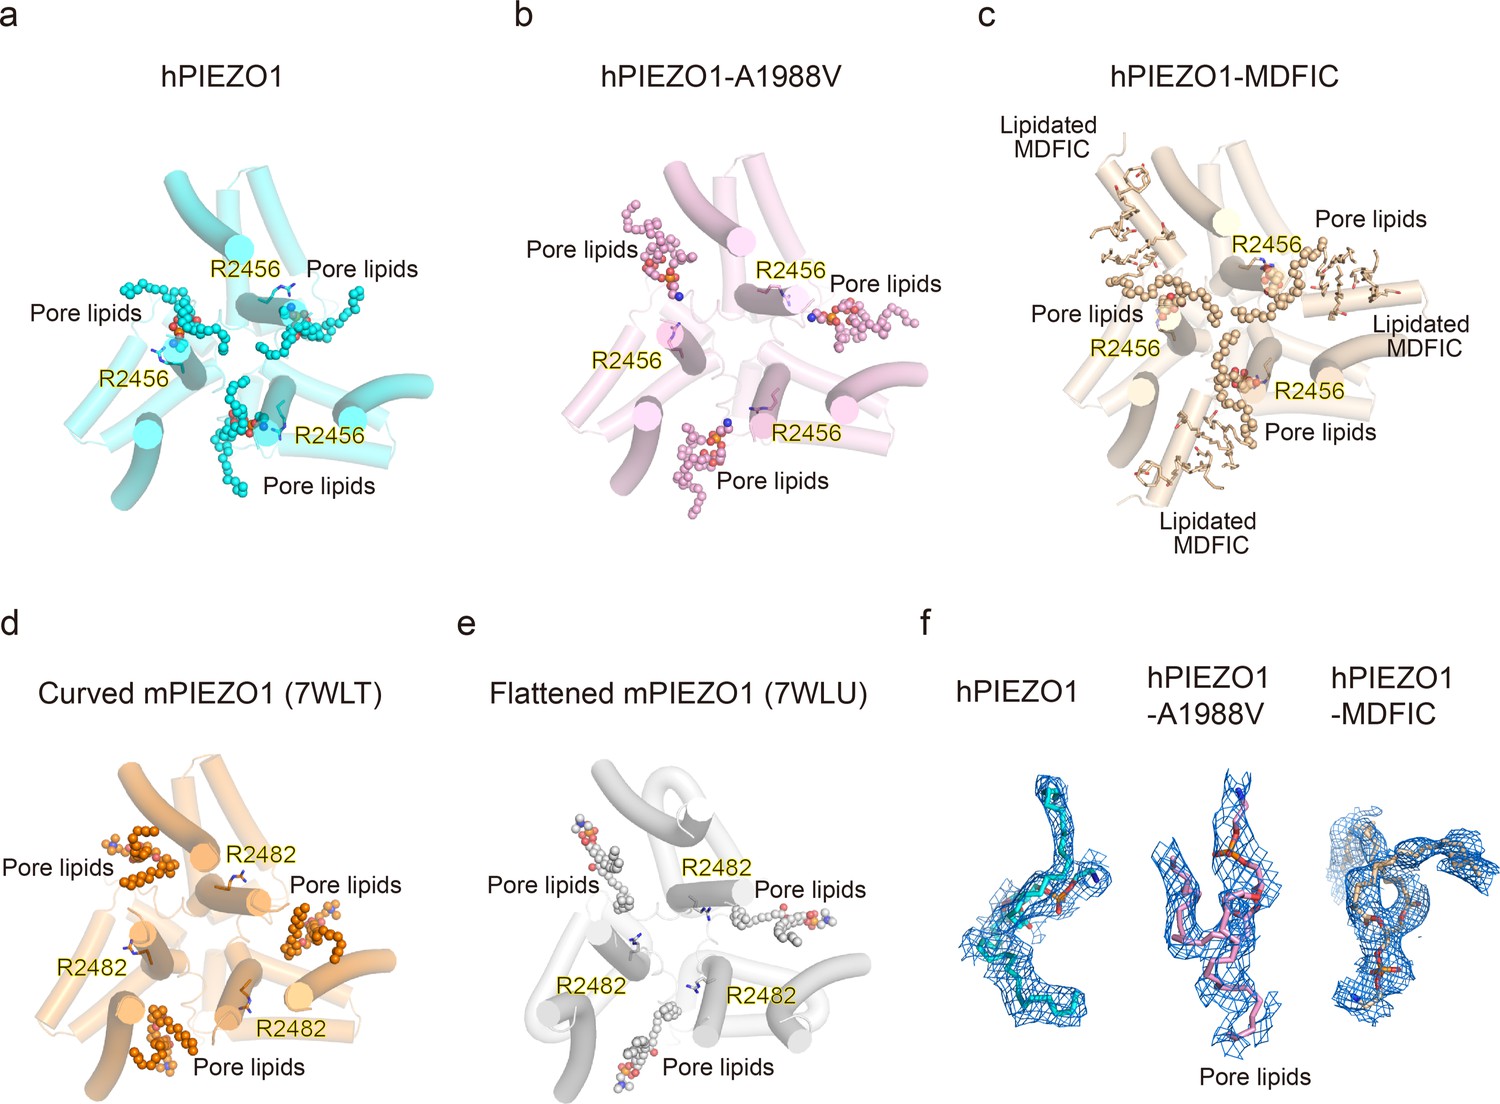
Occupancy pattern of pore lipids in human PIEZO1 (hPIEZO1) underlying fast inactivation.
(a) Top view of hPIEZO1 pore domain. The pore helices are shown as cylinders, and the pore lipid sealing the hydrophobic pore region is shown as spheres. The residue R2456s in inner helices, interacting with pore lipids, is labeled. (b) Top view of hPIEZO1-A1988V pore domain. Pore lipids are retracted from the hydrophobic pore region. (c) Top view of hPIEZO1-MDFIC pore domain. Lipidated MDFICs are shown as sticks. (d) Top view of curved mouse PIEZO1 (mPIEZO1) (PDB: 7WLT). The residues R2482s, responding to R2456 in hPIEZO1, are labeled. Pore lipids are modeled in the latency side of the IH pore. (e) Top view of flattened mPIEZO1 (PDB: 7WLU). Pore lipids are also located in the latency side of the IH pore. (f) Cryo-EM density of pore lipids in WT hPIEZO1 (cyan), hPIEZO1-A1988V (pink), and hPIEZO1-MDFIC (brown). The cryo-EM density is shown as blue mesh.
Figure 8
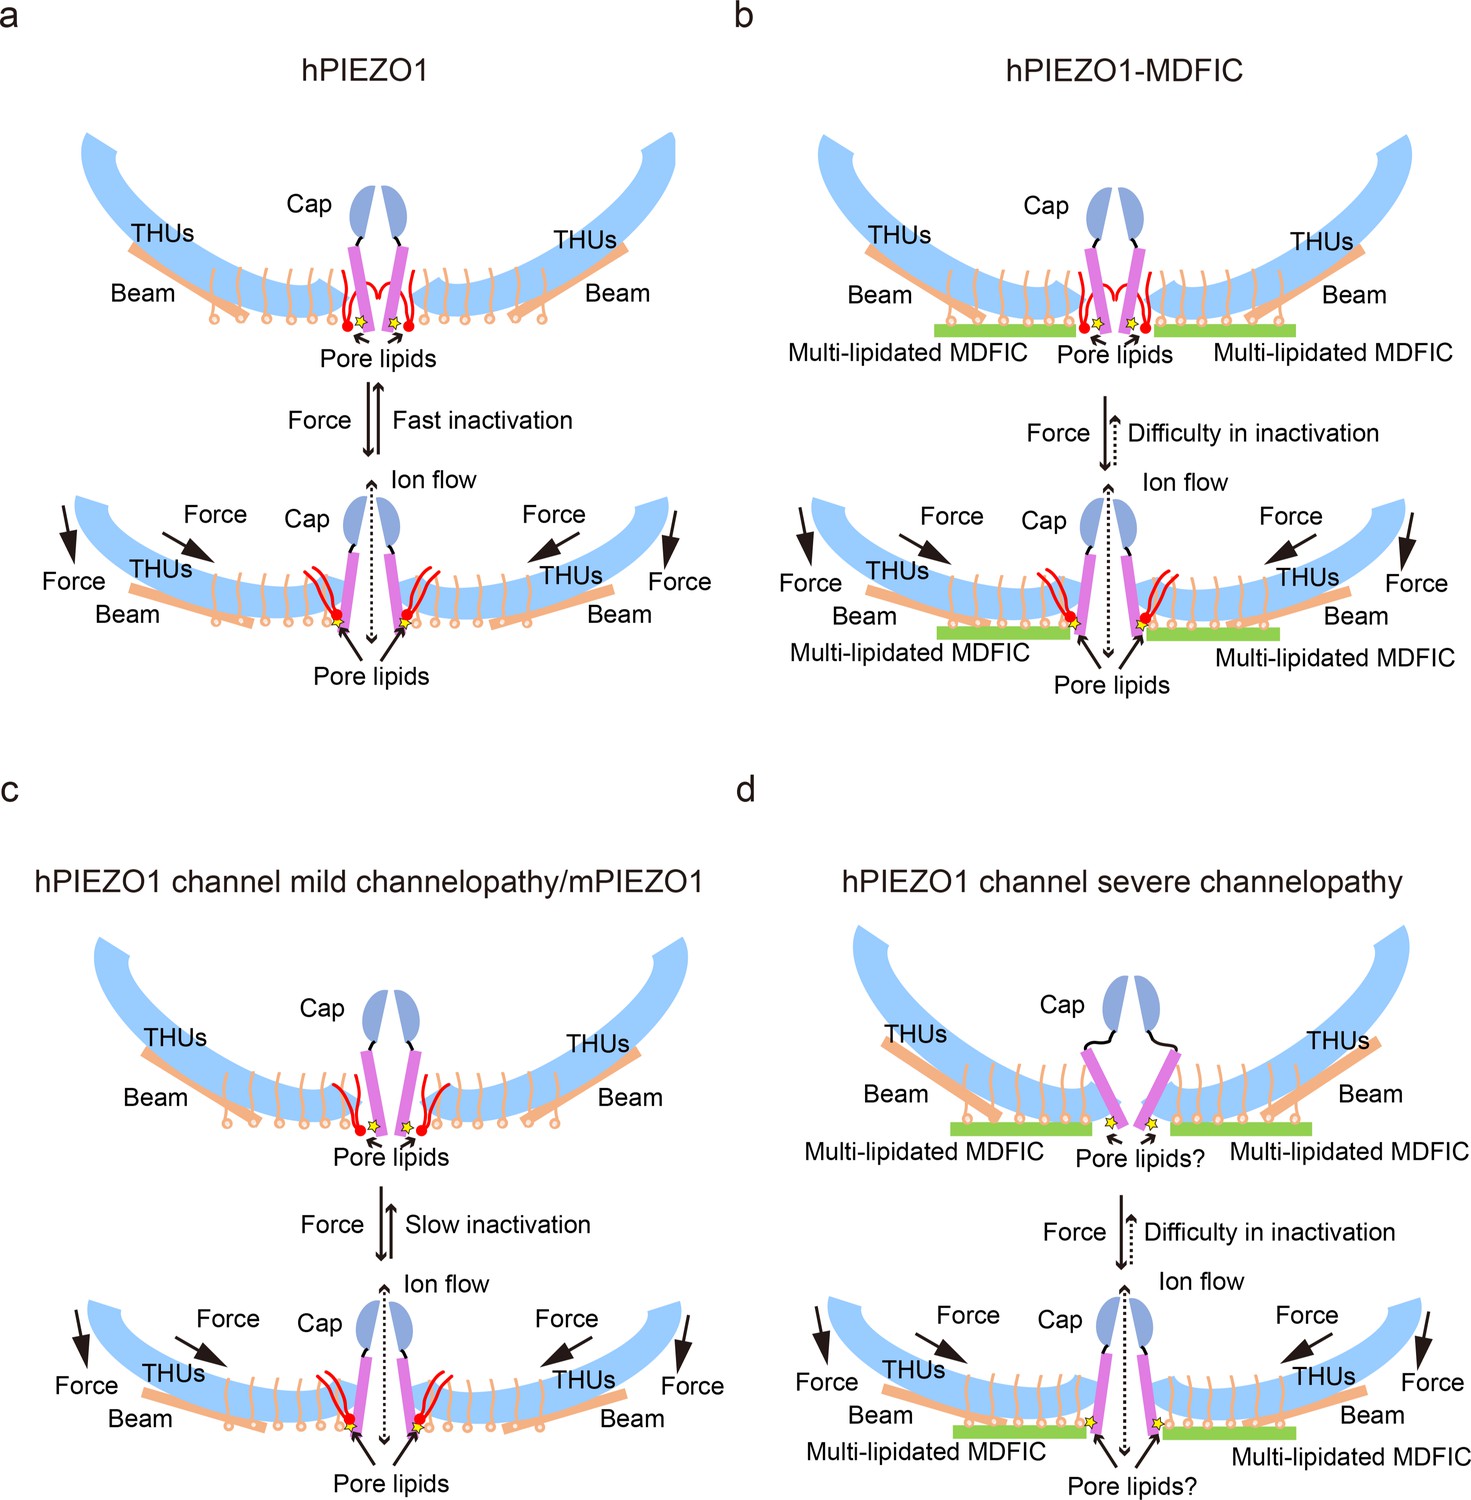
The proposed fast inactivation model of PIEZO1 channel.
(a) Cartoon representation of the fast inactivation model of the human PIEZO1 (hPIEZO1) channel. Two of the three subunits are shown for clarity. The cap (purple semicircle), pore helices (pink rectangle), transmembrane helix units (THUs) (blue arc), beam (brown rectangle), and pore lipids (red) are present. The pore lipids interacting with R2456 (yellow star) seal the TM pore. The membrane force can reduce the membrane curvature and transduce the force to the pore region, removing the barrier created by the pore lipids, which might induce the channel pore to open. The pore lipids then rapidly return to the hydrophobic pore, exhibiting a fast-inactivation pattern. (b) Cartoon diagram of the slow inactivation model of the hPIEZO1-MDFIC complex. Multi-lipidated MDFICs are shown as green rectangles. The fatty acid chains of the covalently linked MDFIC lipids can stabilize the pore lipids. Therefore, the hPIEZO1-MDFIC complex exhibits a very stable deep resting state. Once a higher threshold of mechanical force removes the pore lipids, it is also tricky for them to return to the hydrophobic pore region and reform the stable nonconducting pore module, thus exhibiting the prolonged slow inactivation phenotype. (c) Cartoon diagram of the slow inactivation model of hPIEZO1 channel mild channelopathy or mouse PIEZO1 (mPIEZO1). Mild channelopathy mutants or mPIEZO1 show the pore lipids retracted from the pore and thus exhibit a slow inactivation pattern. (d) Cartoon representation of the slow inactivation model of the hPIEZO1 channel hereditary erythrocytosis (HX) pathogenesis mutant R2456H with MDFIC auxiliary subunit. The R2456H channelopathy mutant probably disrupts the IH pore and the pore lipid interaction. Due to the stabilizing effect of the MDFIC auxiliary subunit, the pore has a twisted shape, and the overall architecture of hPIEZO1-R2456H-MDFIC has a more curved and contracted bowl-like shape.
Author response image 1

Author response image 2
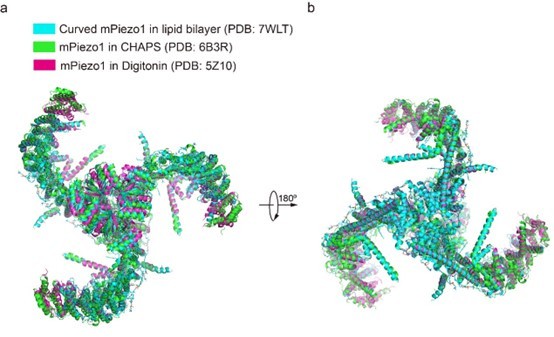
Overall structural comparison of curved mPIEZO1 in the lipid bilayer (PDB: 7WLT), mPiezo1 in CHAPS (PDB: 6B3R) and mPiezo1 in Digitonin (PDB: 5Z10).
Tables
Table 1
Cryo-EM data collection, refinement, and validation statistics.
| hPIEZO1 | hPIEZO1-A1988V | hPIEZO1 Co MDFIC | hPIEZO1-A1988V CoMDFIC | hPEIZO1-E756del Co MDFIC | hPEIZO1-R2456H Co MDFIC | |
|---|---|---|---|---|---|---|
| Data collection and processing | ||||||
| Microscope | FEI Titan Krios | FEI Titan Krios | FEI Titan Krios | FEI Titan Krios | FEI Titan Krios | FEI Titan Krios |
| Magnification | 105000 | 215000 | 215000 | 215000 | 215000 | 215000 |
| Voltage (KV) | 300 | 300 | 300 | 300 | 300 | 300 |
| Detector | Gatan K3 | Falcon 4i | Falcon 4i | Falcon 4i | Falcon 4i | Falcon 4i |
| Electron exposure (e-/ Å2) | 60 | 60 | 40 | 40 | 40 | 40 |
| Defocus range (μm) | –0.9 to –1.3 | –0.9 to –1.3 | –0.9 to –1.3 | –0.9 to –1.3 | –0.9 to –1.3 | –0.9 to –1.3 |
| Pixel size (Å) | 0.849 | 0.849 | 0.57 | 0.57 | 0.57 | 0.57 |
| Symmetry imposed | C3 | C3 | C3 | C3 | C3 | C3 |
| Initial particle images (no.) | 264225 | 87296 | 105921 | 114028 | 336158 | 139340 |
| Final particle images (no.) | 87369 | 37188 | 46605 | 41164 | 89754 | 15975 |
| Map resolution (Å) | 3.3 | 3.75 | 3.07 | 3.16 | 2.83 | 4.52 |
| FSC threshold | 0.143 | 0.143 | 0.143 | 0.143 | 0.143 | 0.143 |
| Refinement | ||||||
| Initial model used (PDB code) | 7WLT | 7WLT | 7WLT | 7WLT | 7WLT | 7WLT |
| Model resolution (Å) | 3.3 | 3.8 | 3 | 3.2 | 2.8 | 4.6 |
| FSC threshold | 0.143 | 0.143 | 0.143 | 0.143 | 0.143 | 0.143 |
| Map sharpening B factor (Å2) | 79 | 96 | 52 | 52 | 63 | 108 |
| Model composition | ||||||
| Non-hydrogen atoms | 31695 | 31695 | 32145 | 32145 | 32145 | 32124 |
| Protein residues | 3852 | 3852 | 3915 | 3915 | 3915 | 3915 |
| Water | 0 | 0 | 0 | 0 | 0 | 0 |
| Ions | 0 | 0 | 0 | 0 | 0 | 0 |
| B factors | ||||||
| Protein | 182.42 | 192.52 | 144.47 | 142.11 | 143.26 | 717.62 |
| Ligand | / | / | / | / | / | / |
| Water | / | / | / | / | / | / |
| R.m.s. deviations | ||||||
| Bond lengths (Å) | 0.012 | 0.013 | 0.011 | 0.011 | 0.011 | 0.017 |
| Bond angles (°) | 1.172 | 1.184 | 1.139 | 1.137 | 1.13 | 2.002 |
| Valiation | ||||||
| MolProbity score | 2.21 | 2.23 | 2.2 | 2.2 | 2.2 | 2.92 |
| Clash score | 15.69 | 16.01 | 15.98 | 15.38 | 15.92 | 59 |
| Poor rotamers (%) | 0.03 | 0.03 | 0.03 | 0.03 | 0.03 | 0 |
| Ramachandran plot | ||||||
| Favored (%) | 91.19 | 90.34 | 91.77 | 91.95 | 91.94 | 84.19 |
| Allowed (%) | 8.07 | 8.32 | 7.66 | 7.62 | 7.54 | 14.35 |
| Disallowed (%) | 0.75 | 1.34 | 0.58 | 0.53 | 0.52 | 1.47 |
Additional files
Download links
A two-part list of links to download the article, or parts of the article, in various formats.
Downloads (link to download the article as PDF)
Open citations (links to open the citations from this article in various online reference manager services)
Cite this article (links to download the citations from this article in formats compatible with various reference manager tools)
Structure of human PIEZO1 and its slow-inactivating channelopathy mutants
eLife 13:RP101923.
https://doi.org/10.7554/eLife.101923.3


