From histology to macroscale function in the human amygdala
- Montreal Neurological Institute and Hospital, McGill University, Canada
- Institute for Neuroscience and Medicine, Forschungszentrum Jülich, Germany
- Max Planck Institute for Human Cognitive and Brain Sciences, Germany
- Institute of Systems Neuroscience, Heinrich Heine University Düsseldorf, Germany
Figures
Figure 1 with 1 supplement
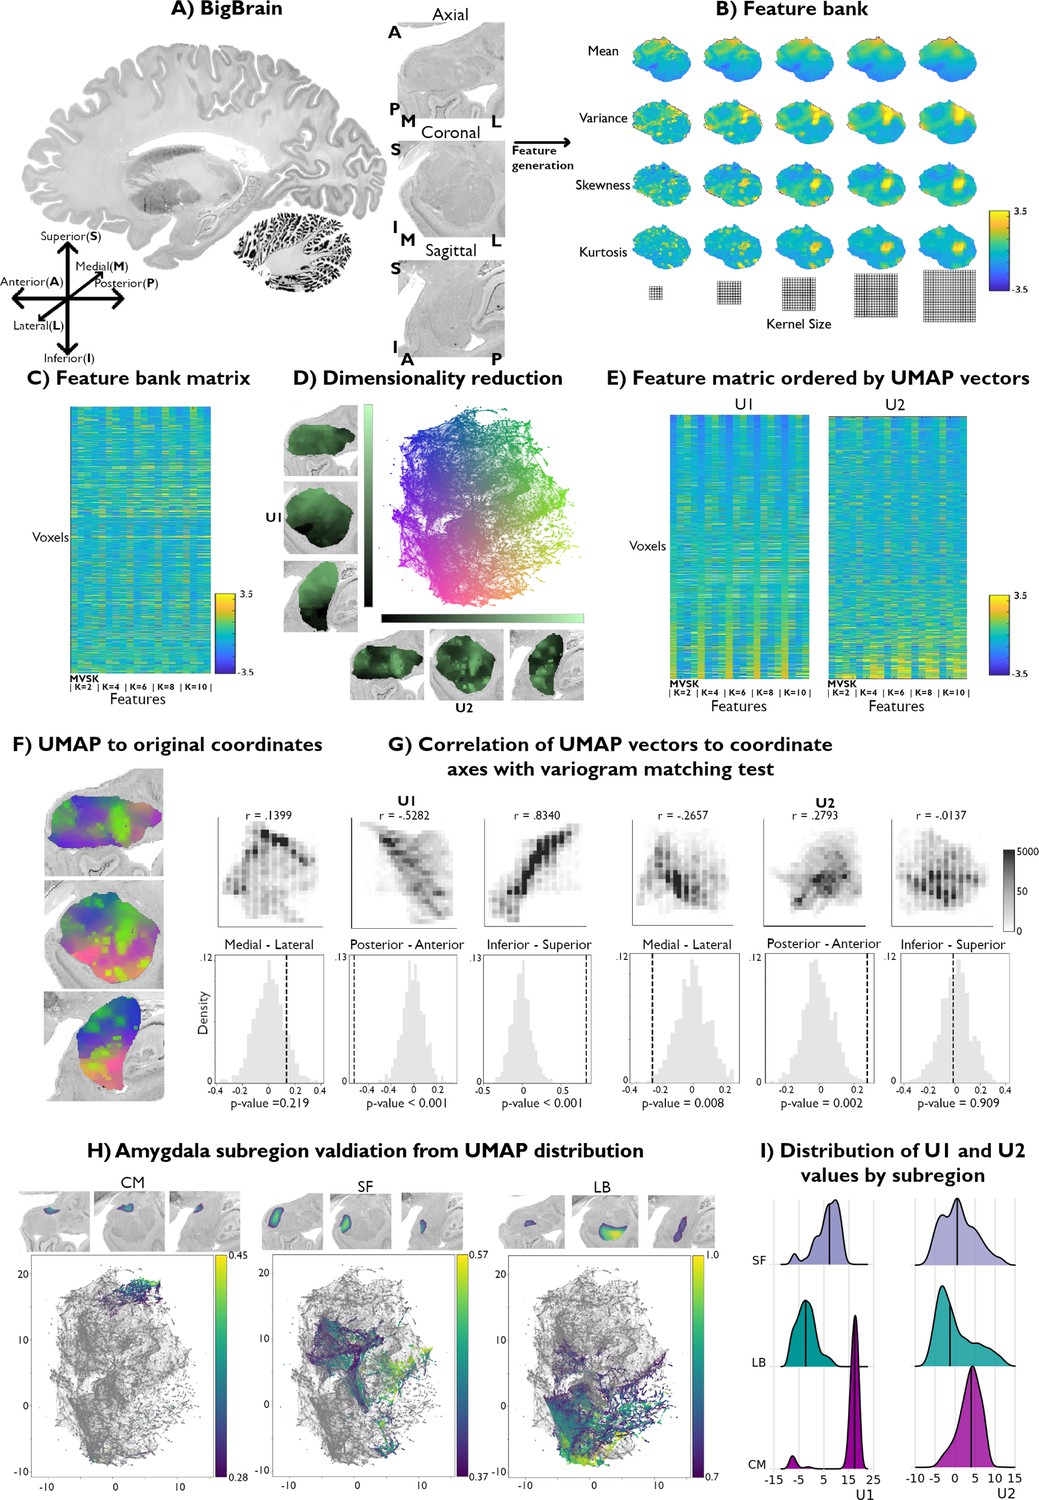
Data-driven histological mapping of the human amygdala.
(A) The amygdala was segmented from the 100 micron resolution BigBrain dataset using an existing subcortical parcellation (Xiao et al., 2019). Slice orientation of subpanels containing amygdala images is consistent across all panels in this figure. (B) Leveraging the pyRadiomics package v3.0.1 (van Griethuysen et al., 2017), we built a multiscale histological feature bank of the amygdala capturing fine-to-coarse intensity variations within this structure. Feature values were all normalized to better visualize relative intensity differences. (C) Matrix representation of the normalized feature bank shown in A. (D) We applied Uniform Manifold Approximation and Projection (UMAP) to this feature bank to derive a low-dimensional embedding of amygdala cytoarchitecture, defining a two-dimensional coordinate space (scatter plot, middle). Colors of the scatter plot represent proximity to axis limits. (E) Reordering the feature bank according to each eigenvector (U1 and U2) highlights the underlying variance in each feature captured by UMAP. (F) Coloring each amygdala voxel according to its corresponding location in the UMAP embedding space partially recovered its anatomical organization. (G) U1 and U2 were correlated to the three spatial axes and variogram matching tests assessed the statistical significance of each correlation (statistical significance threshold set at p<0.05). (H) Coloring the embedding space with openly available probabilistic map labels of the three main amygdala subregions showed that this region’s microstructural architecture could be recovered by UMAP. (I) Ridge plots of the probability values per subregion also illustrate a characterization of the subregions in U1.
Figure 1—figure supplement 1
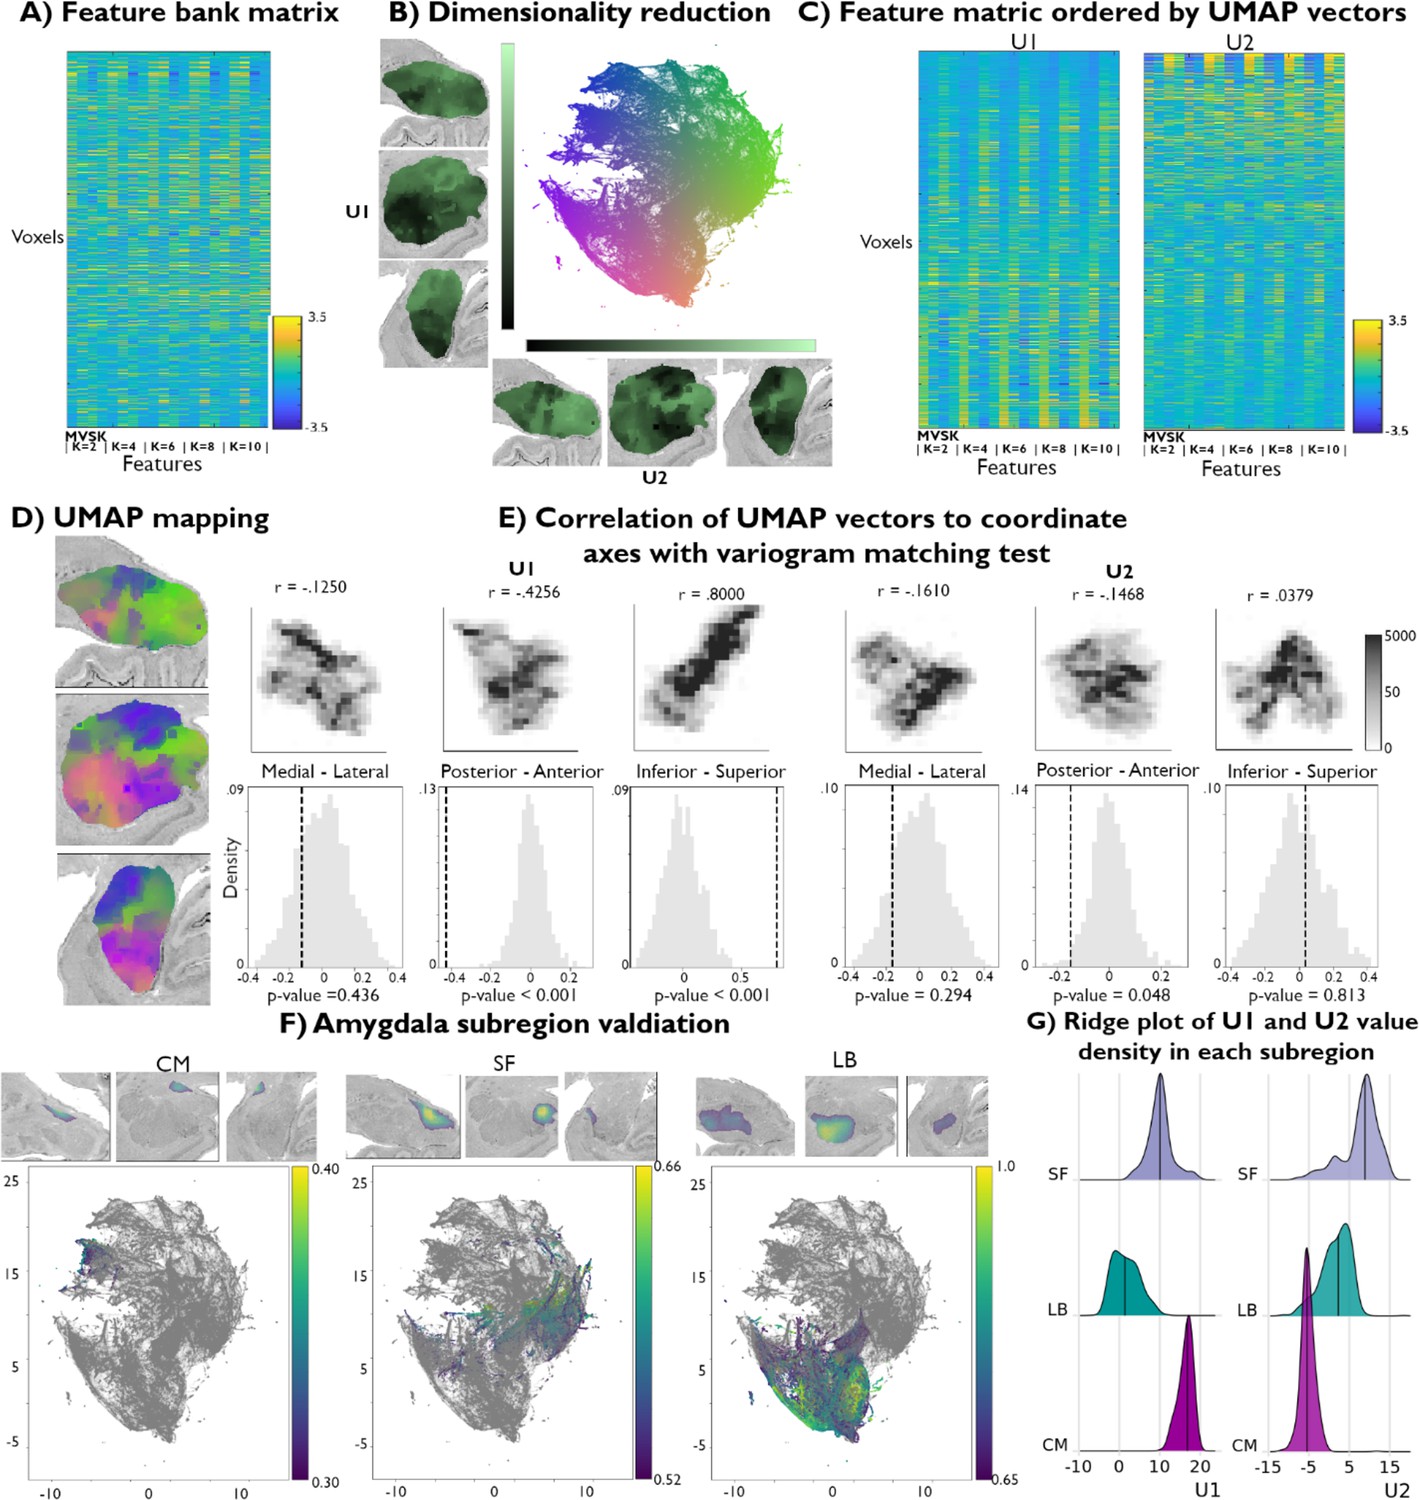
Replication of data-driven histological mapping for the right amygdala.
(A) Matrix representation of the normalized feature bank. (B) We applied Uniform Manifold Approximation and Projection (UMAP) to this feature bank to derive a low-dimensional embedding of amygdala cytoarchitecture, defining a two-dimensional coordinate space of amygdala cytoarchitecture (scatter plot, middle). Colors of the scatter plot represent proximity to axis limits. (C) Reordering the feature bank according to each eigenvector (U1 and U2) highlights the underlying variance in each feature captured by UMAP. (D) Coloring each amygdala voxel according to its corresponding location in the UMAP embedding space partially recovered its anatomical organization. (E) U1 and U2 were correlated to the three axes and a variogram matching test was done for each axis to assess the statistical significance of each correlation (statistical significance threshold set at p<0.05). (F) Coloring the embedding space with openly available probabilistic map labels of the three main amygdala subregions could recover the fully data-driven structure uncovered by UMAP. (G) Ridge plots of the probability values per subregions also illustrate a characterization of the subregions in U1.
Figure 2
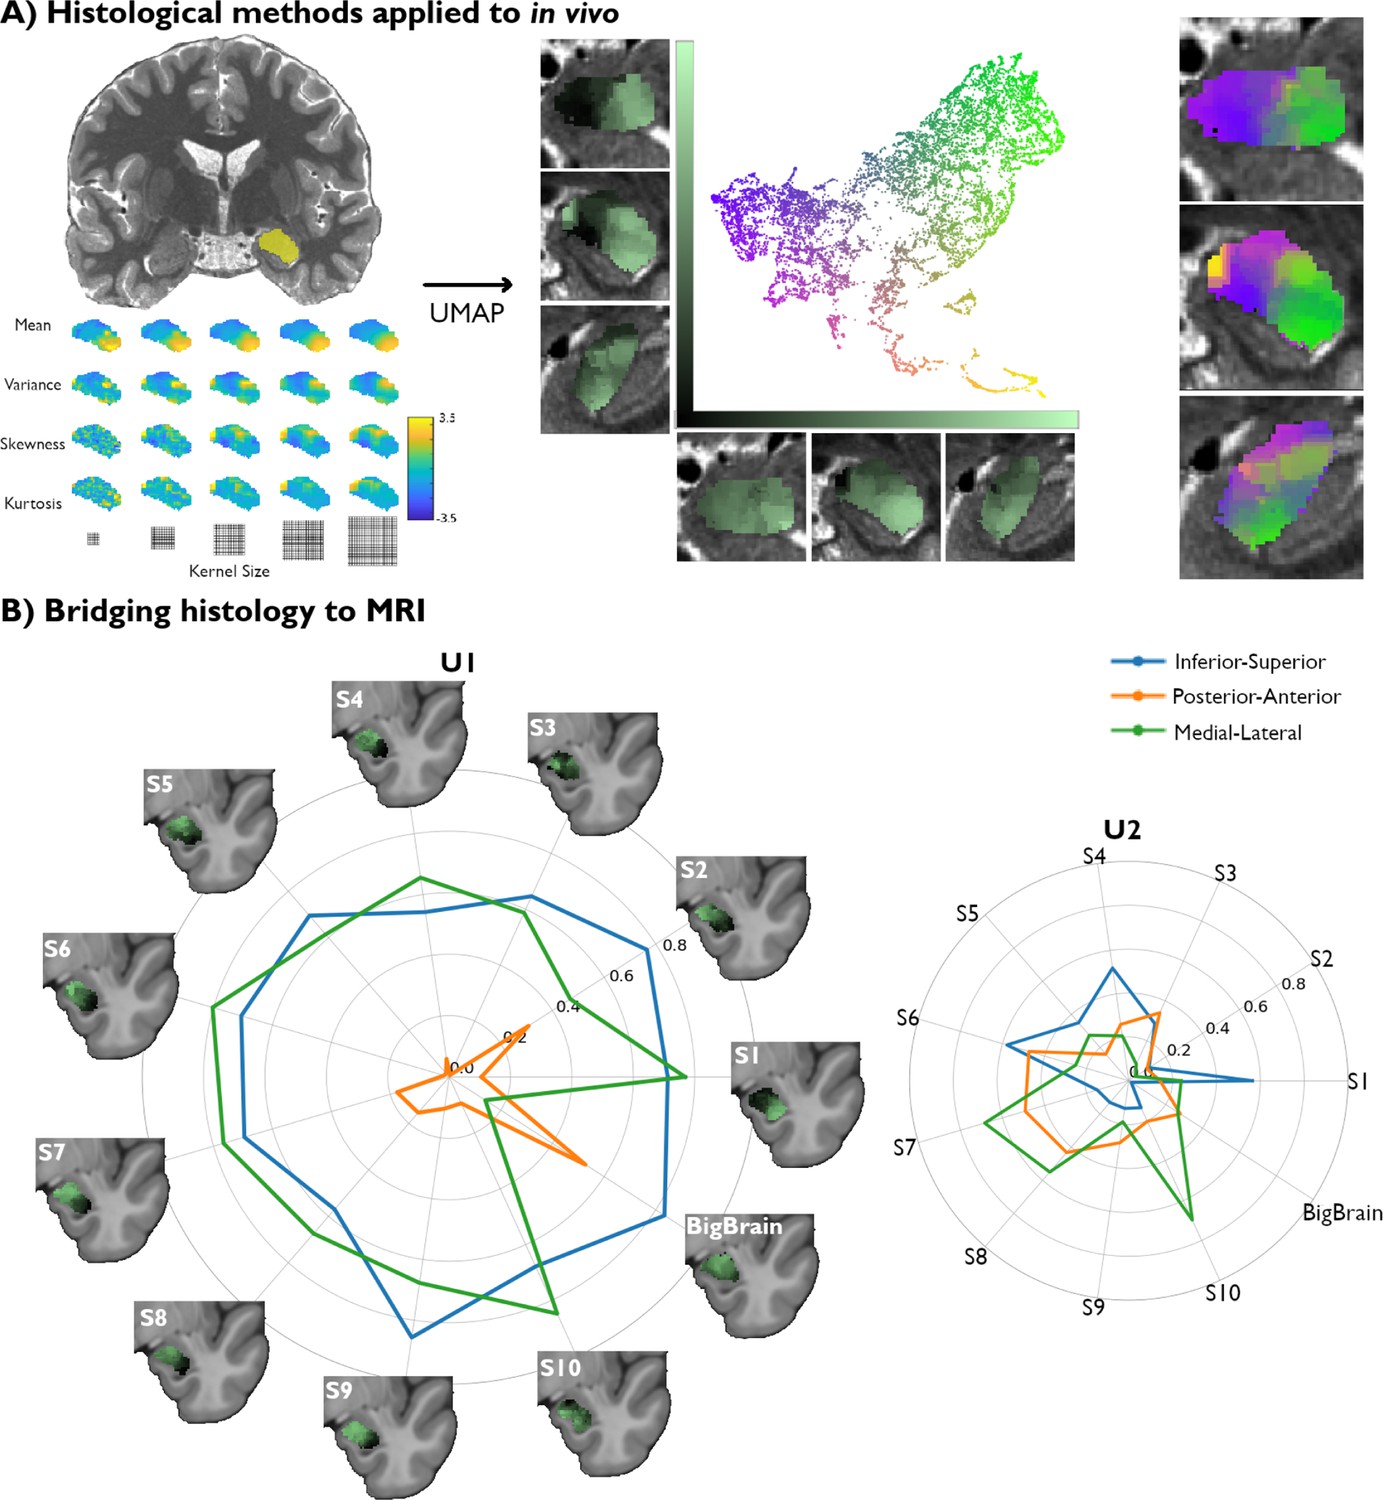
Translating amygdala histological space to in vivo, ultra-high-resolution, myelin-sensitive magnetic resonance imaging (MRI).
(A) We segmented the left and right amygdalae of individual subjects from quantitative T1 (qT1) scans, and applied the same framework as developed in post-mortem imaging to derive subject-specific, in vivo representations of amygdala microstructure. (B) Correlation values between the Uniform Manifold Approximation and Projection (UMAP) components (U1 and U2) and the three coordinate axes of the 10 MRI subjects were computed in MNI152 space and then contrasted with the correlation values found in the histological data (BigBrain transformed to MNI152 space).
Figure 3 with 1 supplement
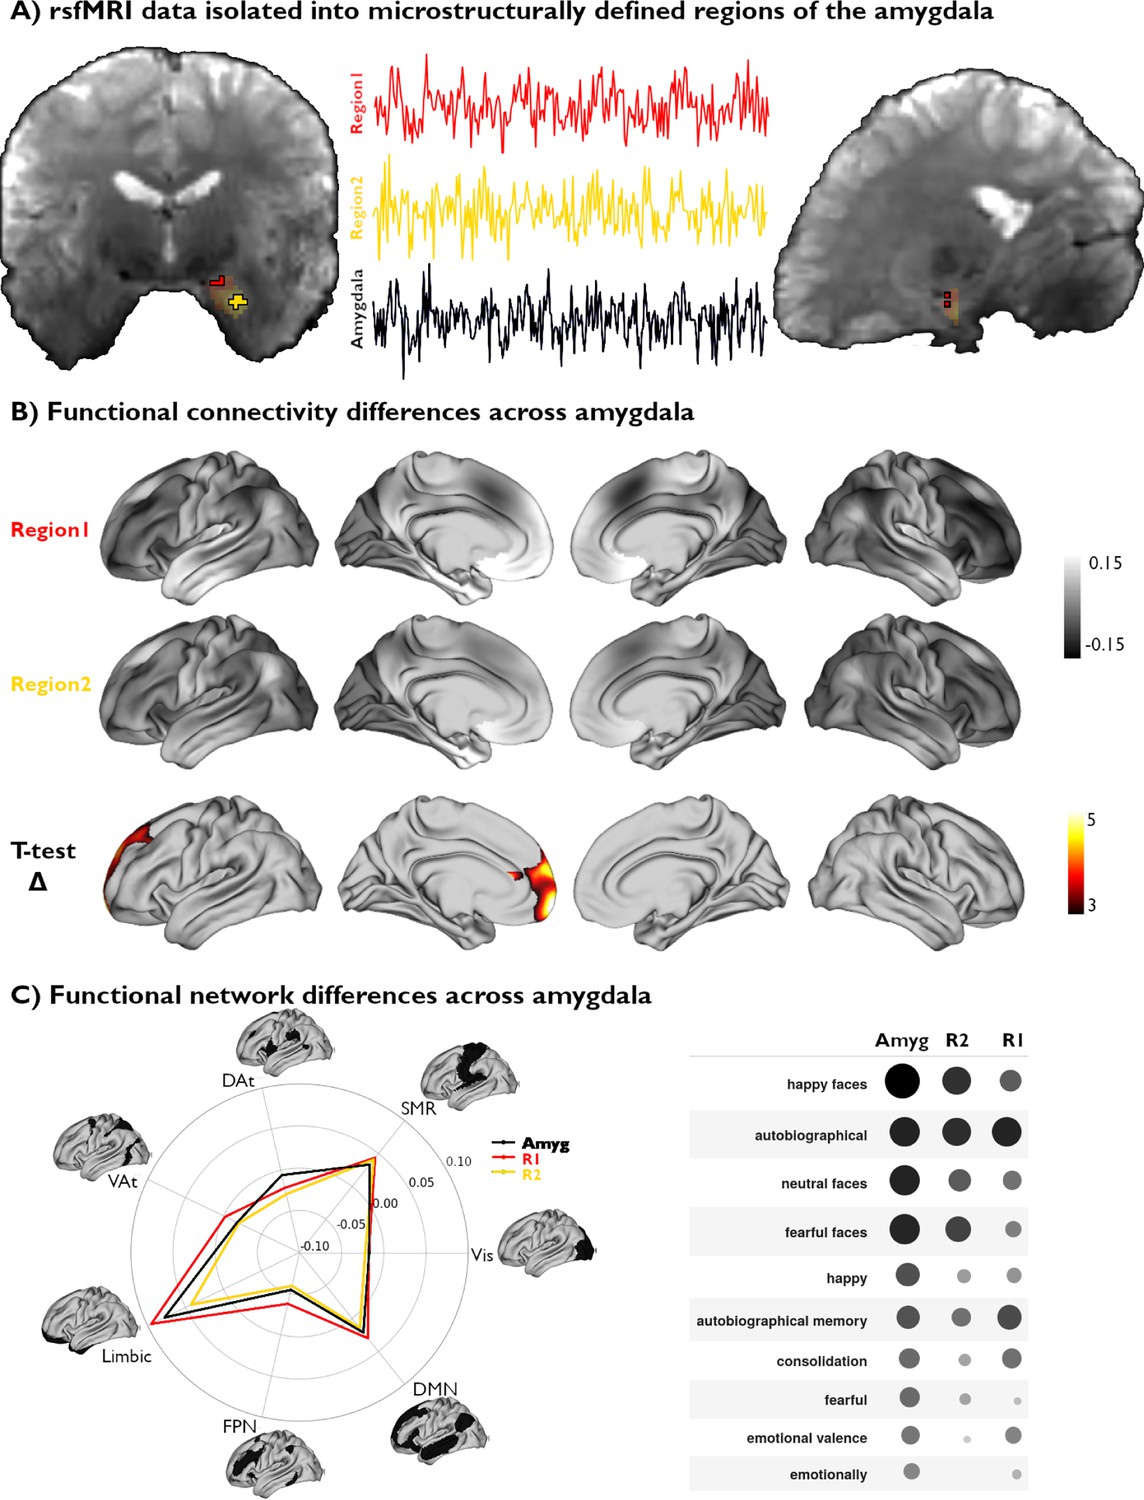
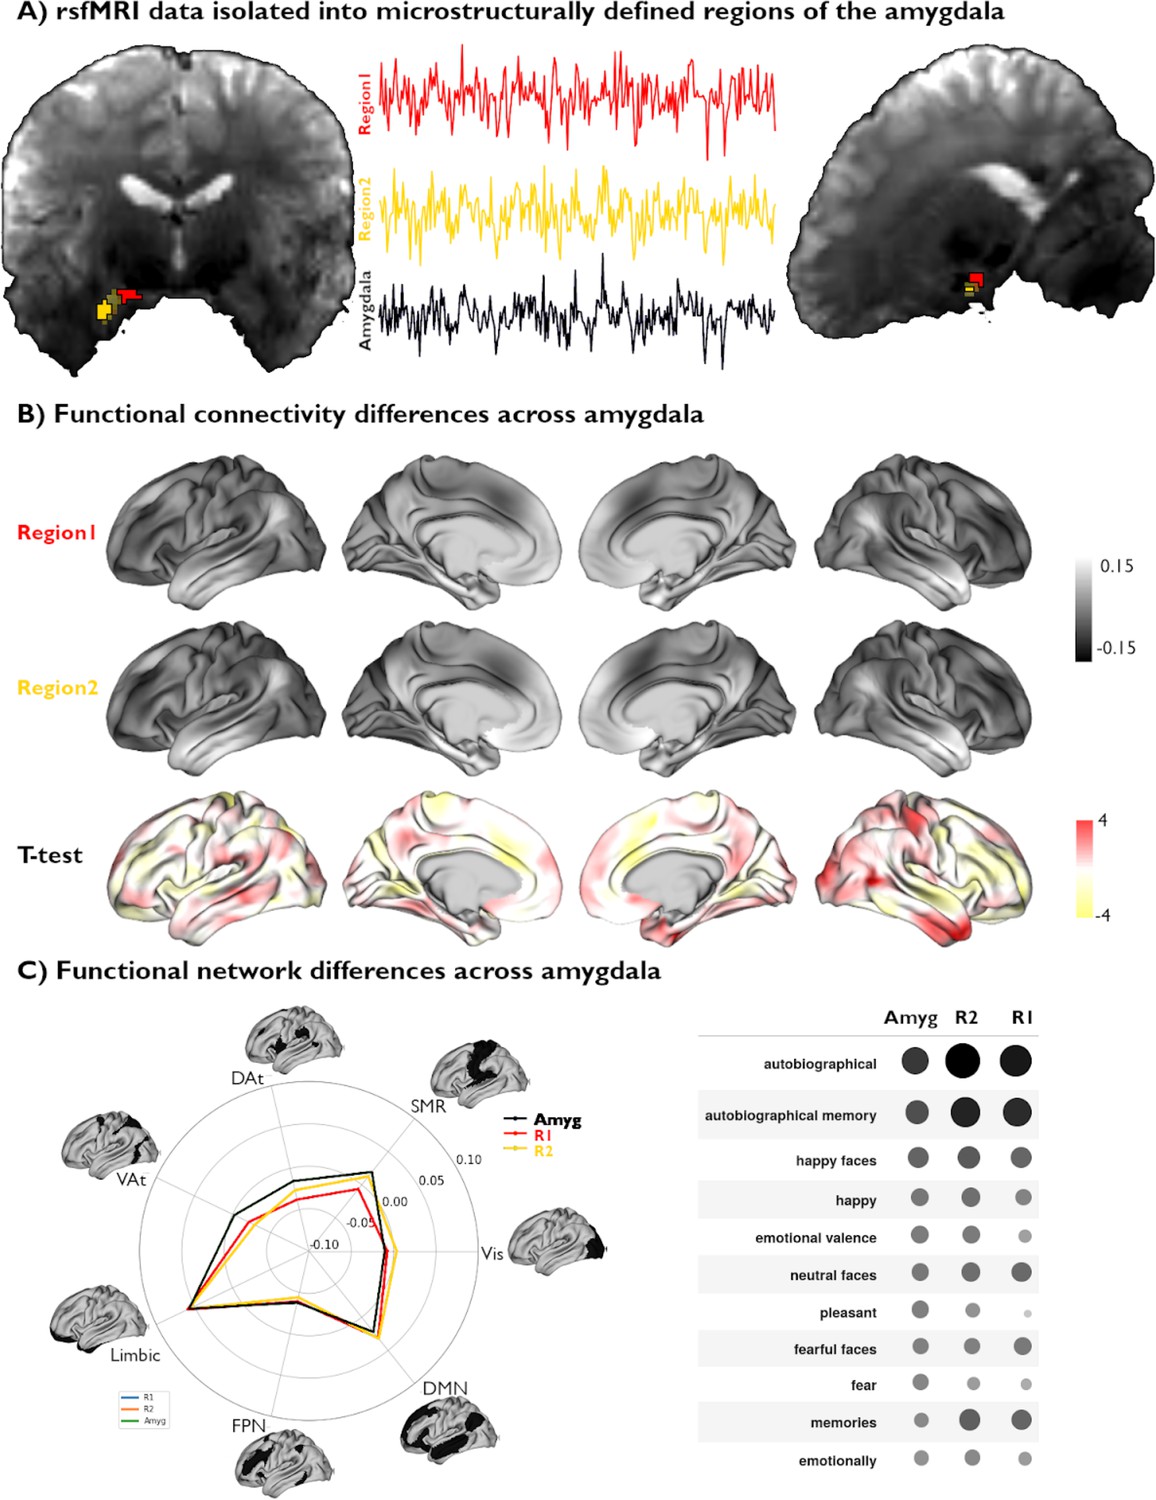
Functional network mapping of amygdala microstructural subregions.
(A) We isolated the resting-state functional magnetic resonance imaging (rsfMRI) time series of two amygdala subregions, defined from subject-specific U1 topography, as well as the whole amygdala. (B) We computed the functional connectivity of both amygdala subregions, and project resulting correlations to the cortex. We further demonstrate the differences in connectivity patterns between both subregions (t-value) and highlight the regions with significant differences (pFWE<0.05). (C) Left: The activation patterns illustrated in (B, top) were averaged within intrinsic functional communities defined by Yeo et al., 2011. Right: Meta-analytic decoding of functional connectivity patterns of both amygdala subregions and the whole amygdala dissociated cognitive and affective functional affiliations of this region.
Figure 3—figure supplement 1
Functional network mapping of amygdala microstructural subregions.
(A) We isolated the resting-state functional magnetic resonance imaging rsfMRI timeseries of two amygdala subregions (R1, R2), defined from subject-specific U1 topography, as well as the whole amygdala. (B) We computed the functional connectivity of both amygdala subregions, and projected resulting correlations to the cortex. Differences in connectivity patterns between subregions are shown as t-values across the cortex. No regions passed the statistical significance threshold of (pFWE<0.05). (C) Left: Activation patterns illustrated in (B, top) were averaged within intrinsic functional communities defined by Yeo et al., 2011 to highlight differences in connectivity of each amygdala subregion in each network. Right: Meta-analytic decoding of functional connectivity patterns of both amygdala subregions and the whole amygdala showed similar functional affiliations of analyzed connectivity patterns.
Additional files
-
Supplementary file 1
See a to d for tables cited in this study.
- https://cdn.elifesciences.org/articles/101950/elife-101950-supp1-v1.docx
-
MDAR checklist
- https://cdn.elifesciences.org/articles/101950/elife-101950-mdarchecklist1-v1.docx
Download links
A two-part list of links to download the article, or parts of the article, in various formats.
Downloads (link to download the article as PDF)
Open citations (links to open the citations from this article in various online reference manager services)
Cite this article (links to download the citations from this article in formats compatible with various reference manager tools)
From histology to macroscale function in the human amygdala
eLife 13:RP101950.
https://doi.org/10.7554/eLife.101950.3


