Social and environmental predictors of gut microbiome age in wild baboons
- Department of Biological Sciences, University of Notre Dame, United States
- Department of Biological Sciences, University of Pittsburgh, United States
- California Academy of Sciences, United States
- Program in Computational Biology and Bioinformatics, Duke University, United States
- Department of Evolutionary Anthropology, Duke University, United States
- Department of Biology, Duke University, United States
- Duke University Population Research Institute, Duke University, United States
- Department of Primate Behavior and Evolution, Max Planck Institute for Evolutionary Anthropology, Germany
- Canadian Institute for Advanced Research, Canada
- Faculty of Life Sciences, Institute of Biology, Leipzig University, Germany
- Department of Pediatrics and the Scripps Institution of Oceanography, University of California, San Diego, United States
- Section of Genetic Medicine, Department of Medicine, University of Chicago, United States
- Departments of Statistical Science, Mathematics, Computer Science, and Bioinformatics and Biostatistics, Duke University, United States
- Center for Scalable Data Analytics and Artificial Intelligence, University of Leipzig, Germany
- Max Planck Institute for Mathematics in the Natural Sciences, Germany
Figures
Figure 1
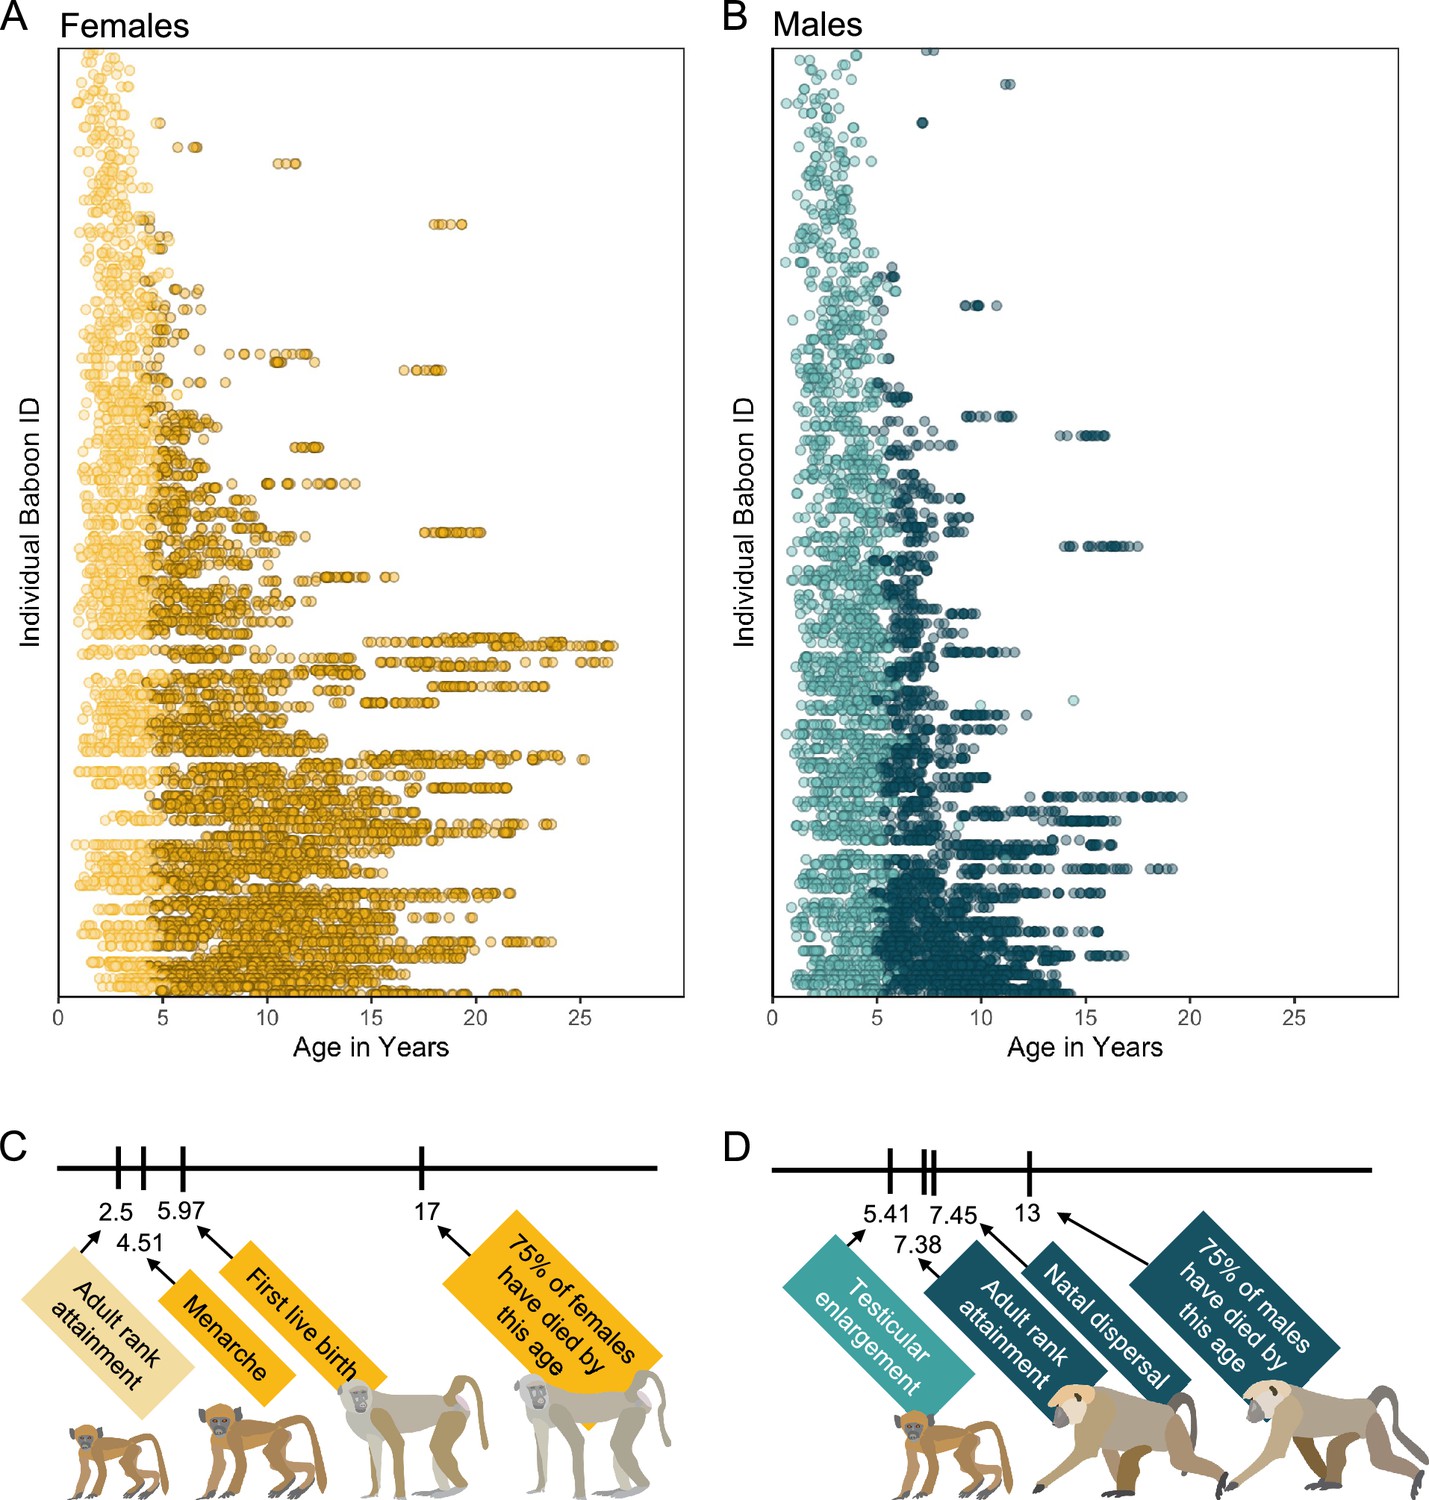
Microbiome sampling time series and developmental milestones for the Amboseli baboons.
Plot (A) shows microbiome samples from female baboons, and plot (B) shows samples from male baboons. Each point represents a microbiome sample from an individual subject (y-axis) collected at a given host age in years (x-axis; n = 8245 samples from 234 females shown in yellow; n = 5231 samples from 197 males shown in blue). Light and dark point colors indicate whether the baboon was sexually mature at the time of sampling, with lighter colors reflecting samples collected prior to menarche for females (n = 2016 samples) and prior to testicular enlargement for males (n = 2399 samples). Due to natal dispersal in males, we have fewer samples after the median age of first dispersal in males (n = 1705 samples, 12.6% of dataset) than from females after the same age (n = 4408 samples, 32.6% of dataset). The timelines below the plots indicate the median age in years at which (C) female baboons attain the developmental milestones analyzed in this paper—adult rank, menarche and first live birth—and (D) males attain adult rank, testicular enlargement, and disperse from their natal groups (Charpentier et al., 2008; Onyango et al., 2013). The age at which 75% of animals in the population have died is shown to indicate different life expectancies for females versus males (Bronikowski et al., 2011). Baboon illustrations courtesy of Emily (Lee) Nonnamaker.
Figure 2 with 2 supplements
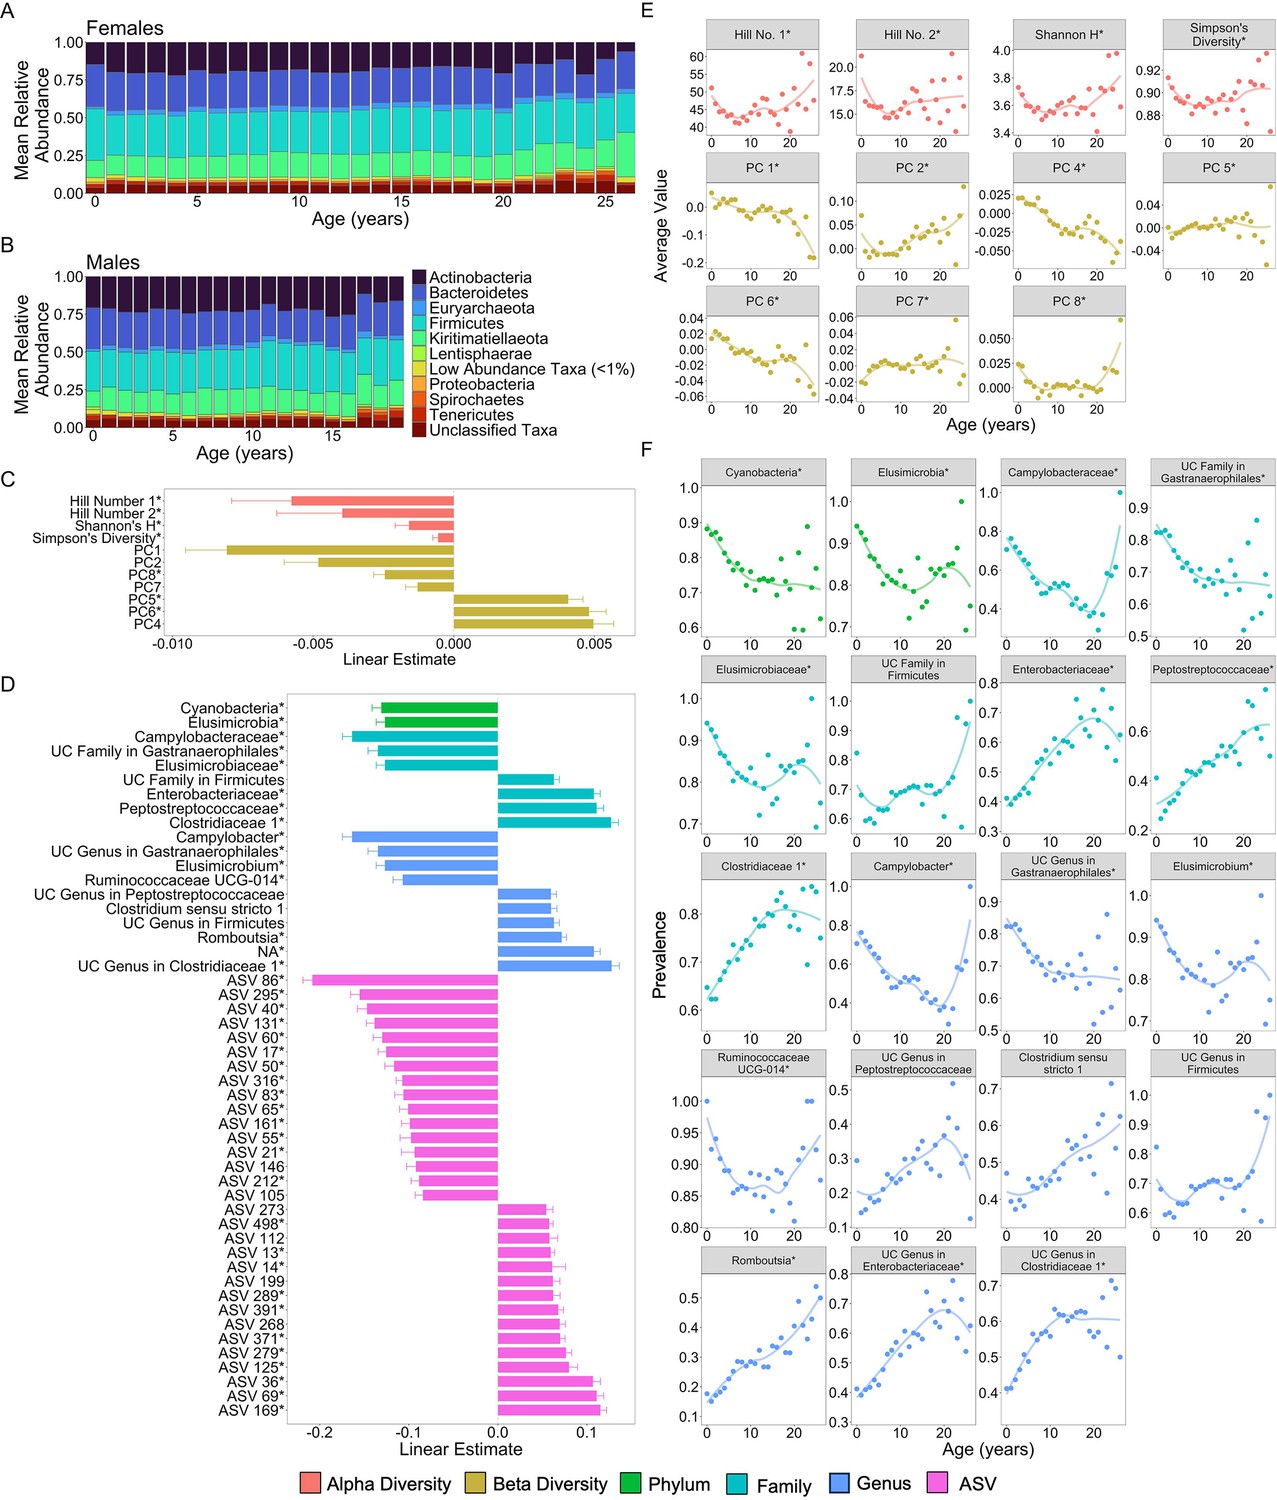
Microbiome features change with age.
(A) and (B) show the percent mean relative abundance of microbial phyla across life for females and males, respectively. Panel (C) shows the estimates of the linear associations between mean-centered age for metrics of microbiome alpha diversity and principal components of microbiome compositional variation that exhibited significant associations with age (false discovery rate [FDR] <0.05). Positive values are more abundant in older hosts. Panel (D) shows the estimate of the linear association between mean-centered age and the top 50 microbiome features that exhibited significant associations with age. Positive values are more abundant in older hosts. Panel (E) shows the average value of the microbiome features from (C) as a function of age, across all subjects. Note that sample sizes for patterns beyond age 20 years rely on 256 samples from just 18 females; hence, we interpret the pattern in these oldest animals with caution. Panel (F) shows the average prevalence of the higher taxonomic designations from (D) as a function of age, across all subjects. In (C–F), points are colored by the category of the feature (see legend). UC is an abbreviation for uncharacterized. Features that had a significant quadratic age term are indicated by * (see also Figure 2—figure supplements 1 and 2; Supplementary file 1A).
Figure 2—figure supplement 1
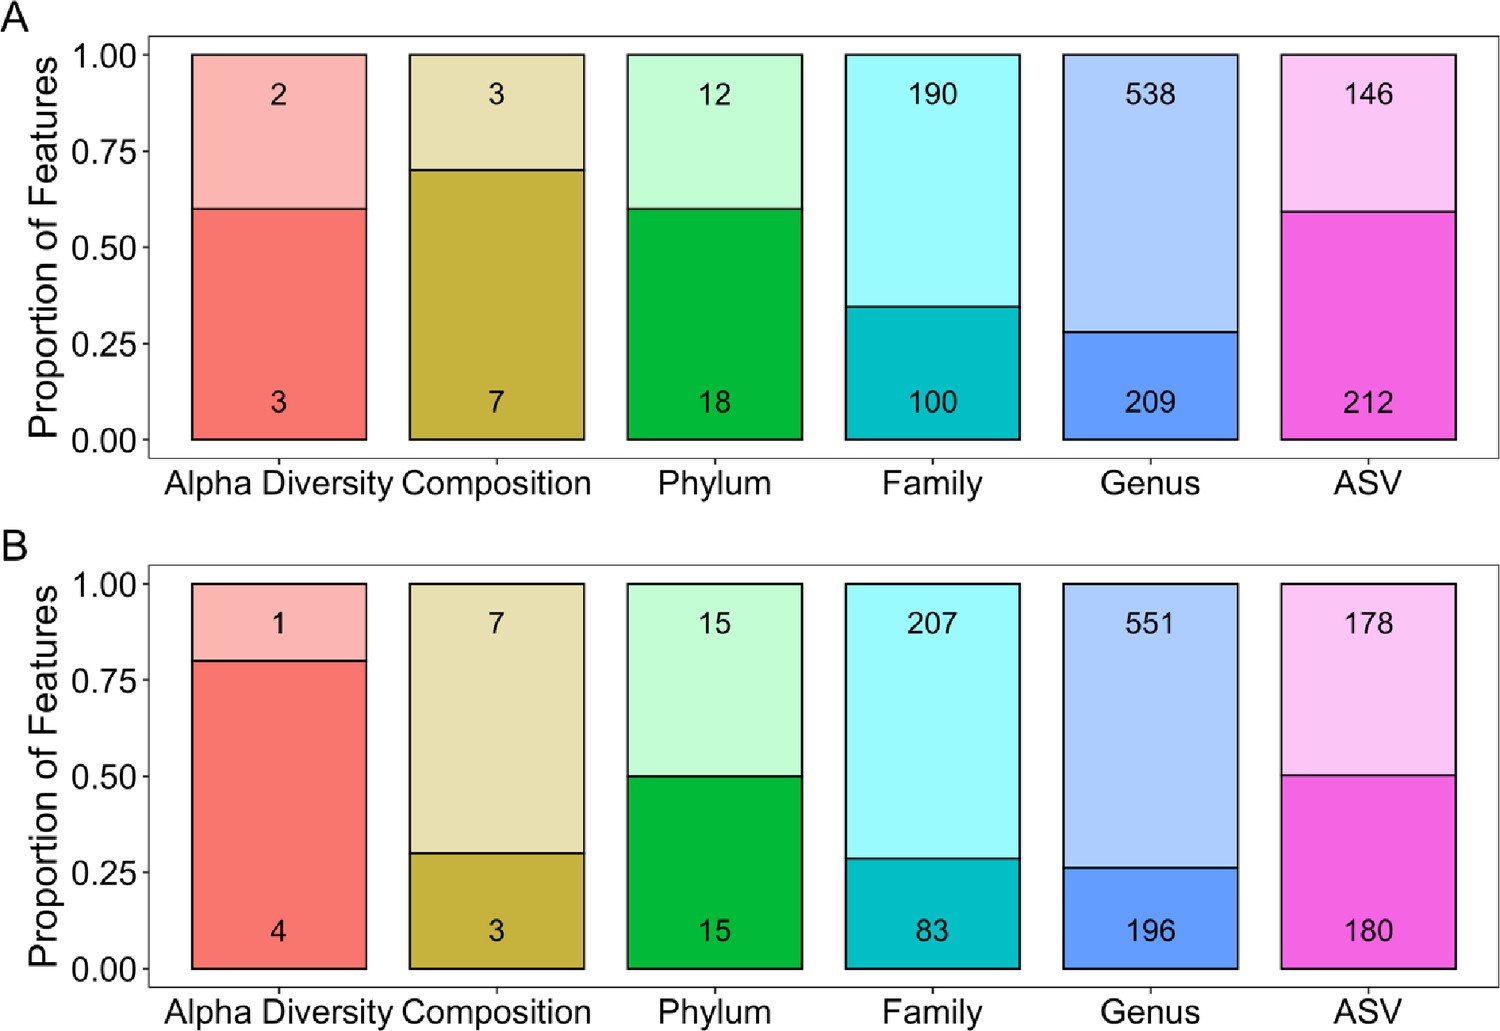
The number and proportion of each type of feature that was significantly associated with age.
In the two panels, age was modeled as (A) a linear term, or (B) a quadratic term in a linear mixed model (false discovery rate [FDR] threshold = 0.05; darker colors represent the proportion of statistically significant features). All features were modeled using Gaussian error distributions. As described in the Results, feature types included five metrics of alpha diversity, the top 10 principal components of Bray–Curtis dissimilarity (collectively labeled ‘Composition’ in the gold bar), the abundances of each microbial phylum (n = 30), family (n = 290), and genus (n = 747), and amplicon sequence variances (ASVs) detected in >25% of samples (n = 358).
Figure 2—figure supplement 2
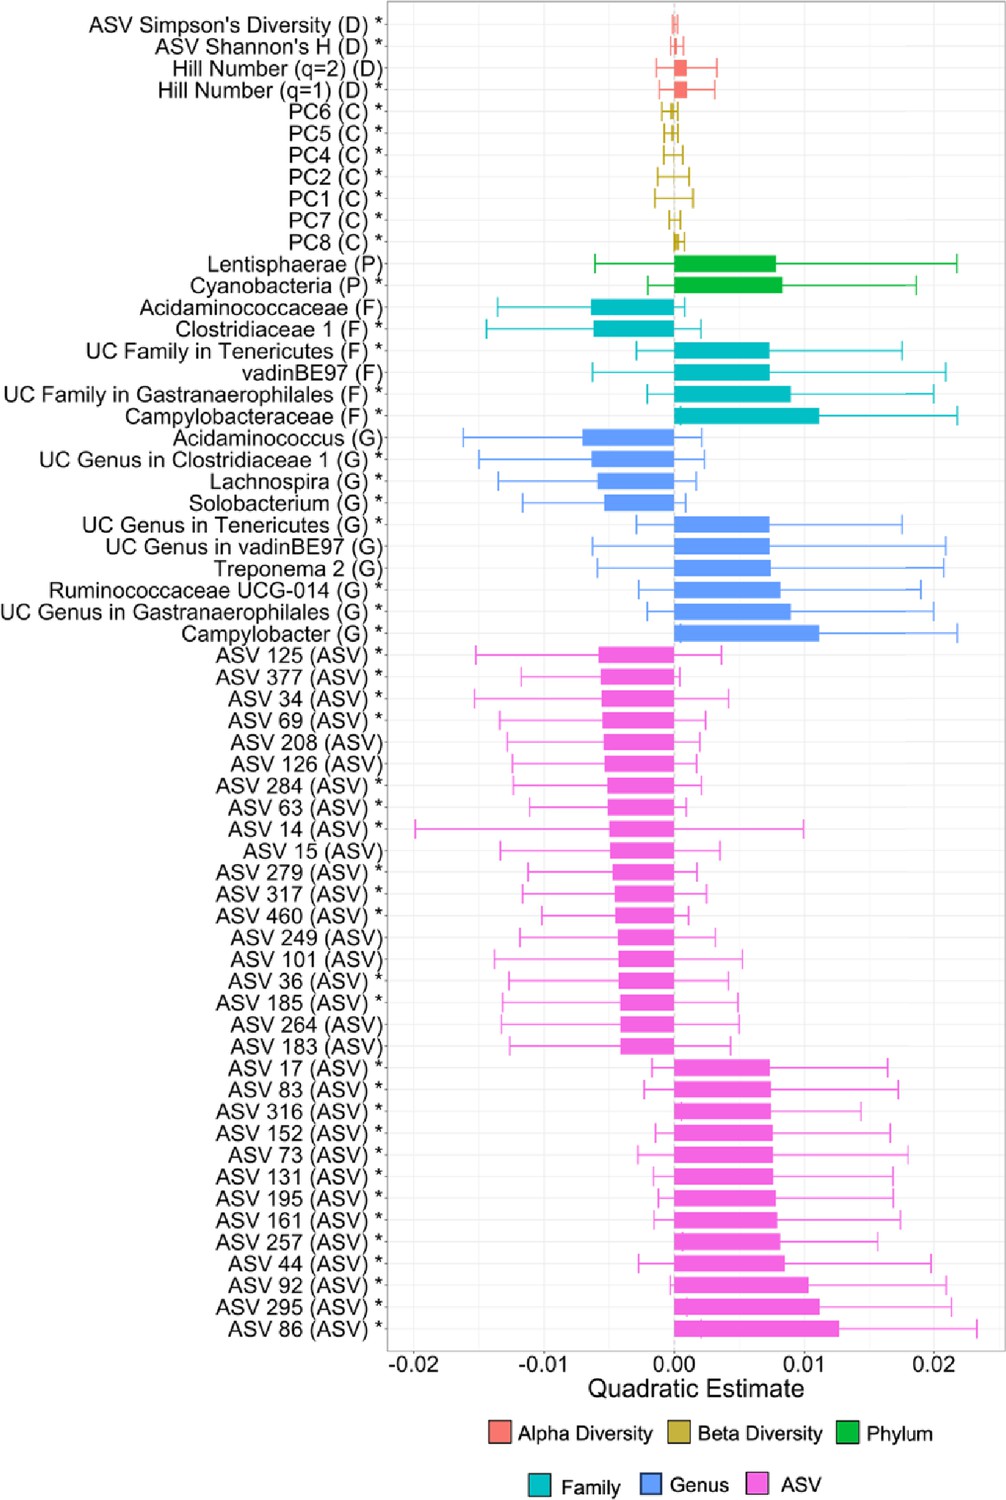
Taxa with the strongest quadratic associations with age.
Plot shows the size of the quadratic estimate for each taxon that had a significant association with age. Bars are colored by the type of feature (see legend) and indicated by the letter in parentheses, with D indicating a diversity metric, C a compositional metric (i.e., a principal component of Bray–Curtis similarity), P for phylum, F for family, G for genus, and amplicon sequence variance (ASV) for an ASV. To make our quadratic terms more interpretable, we centered our age estimates on zero by subtracting the mean of age from each age value. Specifically, when a quadratic term is negative, the curve is concave, whereas when the term is positive, the curve is convex. UC is short for uncharacterized. Features that also had a significant linear age term are indicated by a *.
Figure 3 with 2 supplements
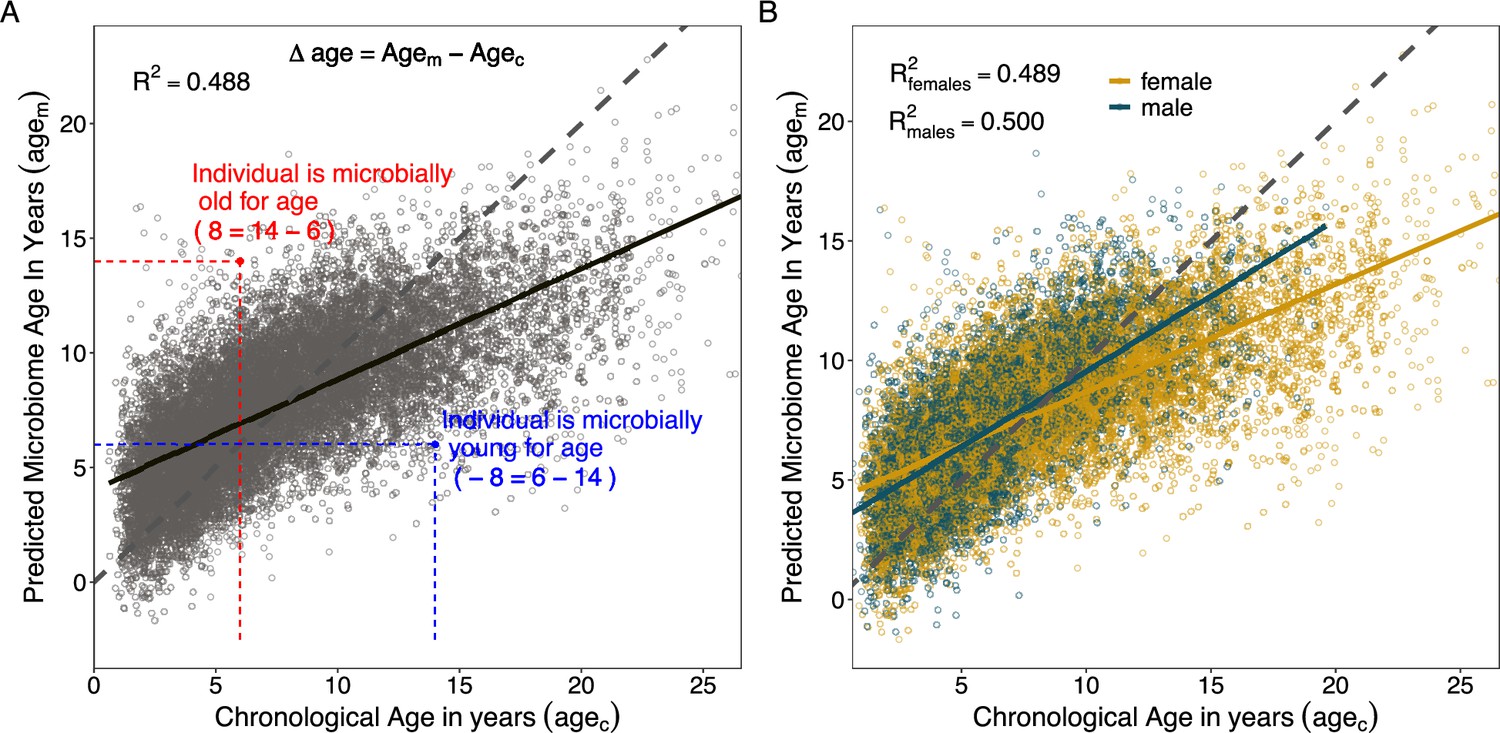
Microbiome clock age predictions in wild baboons.
Panels (A) and (B) show predicted microbiome age in years (agem) from a Gaussian process regression model, relative to each baboon’s true chronological age in years (agec) at the time of sample collection. Each point represents a microbiome sample. Panel (A) shows linear fit for all subjects in the model; (B) shows separate linear fits for each sex (Supplementary file 1D). Dashed lines show the 1-to-1 relationship between agec and agem. Panel (A) also shows the measurement of sample-specific microbiome Δage compared to chronological age. Whether an estimate is old- or young-for-chronological age is calculated for each microbiome sample as the difference between agem and agec. Because of model compression relative to the 1-to-1 line, we correct for host chronological age by including chronological age in any model. An example of an old-for-age sample is shown as a red point, with dashed lines showing the value of agec for a given sample with its corresponding agem.
Figure 3—figure supplement 1
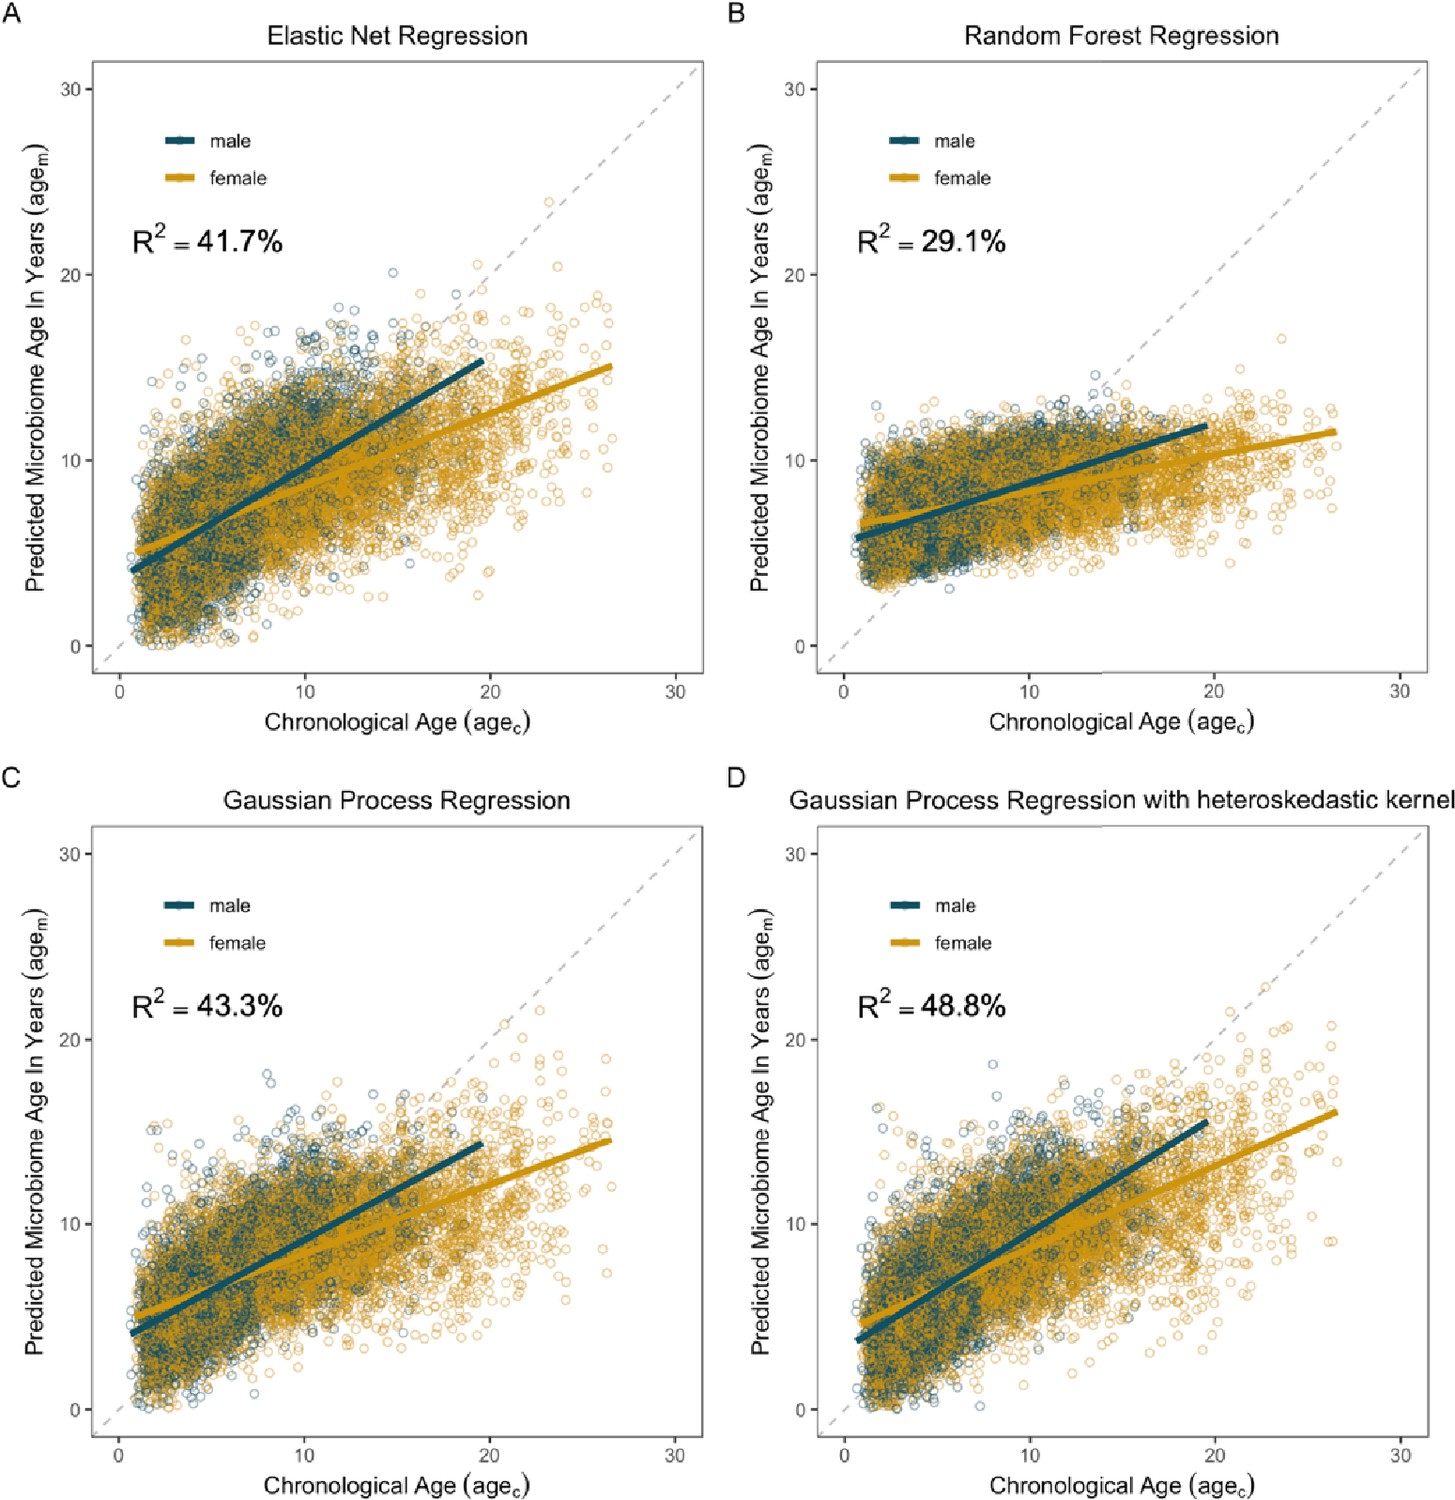
Microbiome clocks from an ensemble of machine learning algorithms.
Each plot shows predicted microbiome age (agem) relative to the true, chronological age (agec) of the baboon at the time of sample collection. (A) shows age predictions from an elastic net regression, and (B) depicts age predictions from Random Forest regression. Plots (C) and (D) show age predictions from Gaussian process regression without (C) and with (D) a kernel to account for heteroskedasticity. The most accurate age predictions (i.e., the model with the highest R2 value) were produced by a Gaussian process regression model with a kernel customized to account for heteroscedasticity (D). On each plot, points are colored by host sex; yellow indicates samples from females; blue indicates samples from males. Gray dashed lines indicate a 1-to-1 relationship between agec and agem.
Figure 3—figure supplement 2

Variance in residuals across lifespans in the Gaussian process regression prior to correction.
Plots show chronological age relative to the residuals of the agem produced by a Gaussian process regression with a radial basis function kernel. Females are in yellow, and males are in blue. (A) and (B) show a scatter plot of agec and the residuals of agem. The spread of the residuals is wider for samples collected at older ages. (C) and (D) show the distributions of the residuals for different age subsets. The distribution flattens around 12.5 in females and 10 in males.
Figure 4 with 1 supplement
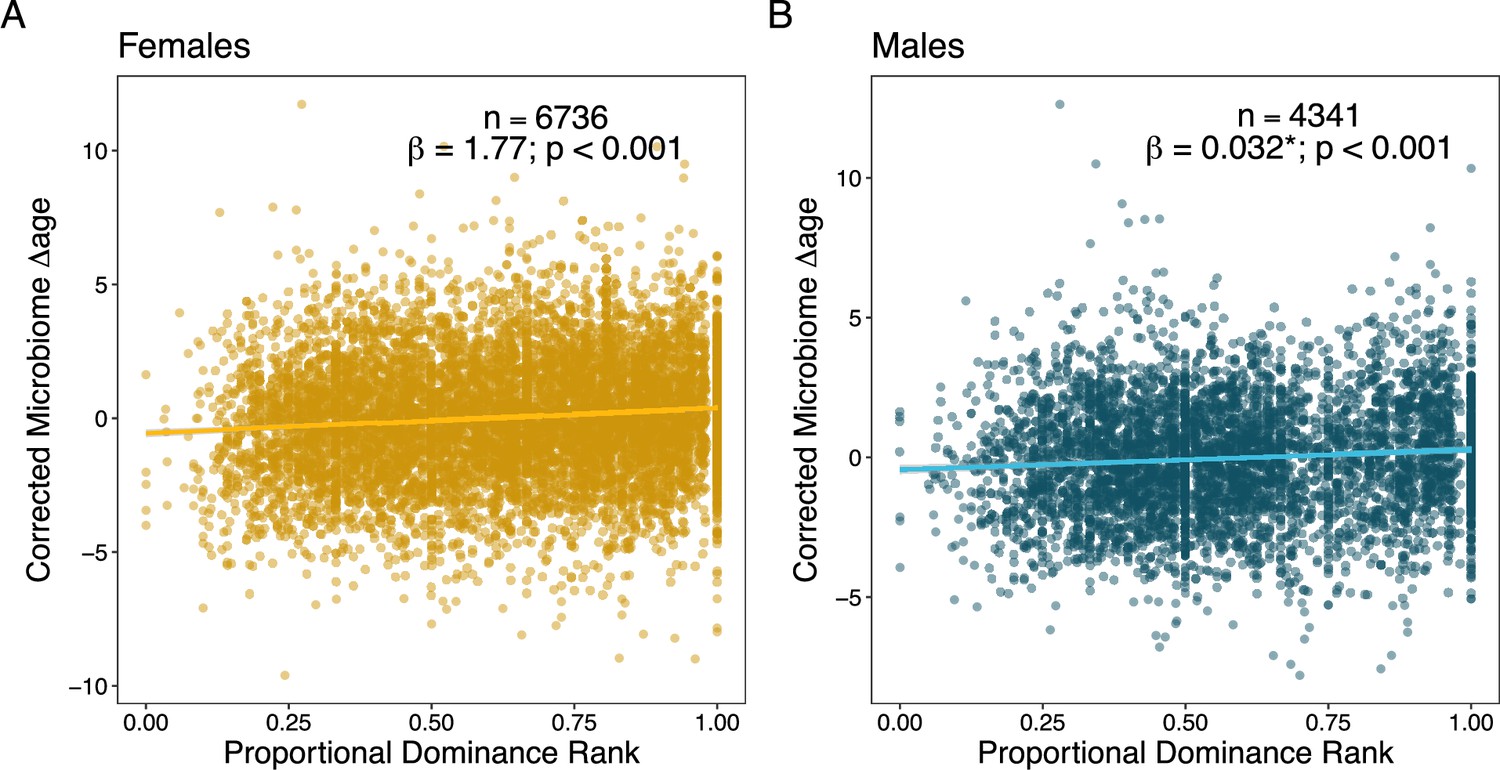
Social dominance rank predicts gut microbiome Δage in male and female baboons (corrected for confounders).
Panels (A) and (B) show the relationship between host proportional dominance rank and corrected gut microbiome Δage in (A) males (blue points) and (B) females (yellow points). Each point represents an individual gut microbiome sample. Corrected microbiome Δage is calculated as the residuals of agem correcting for host chronological age, season, monthly temperature, monthly rainfall, and social group and hydrological year at the time of collection.
Figure 4—figure supplement 1
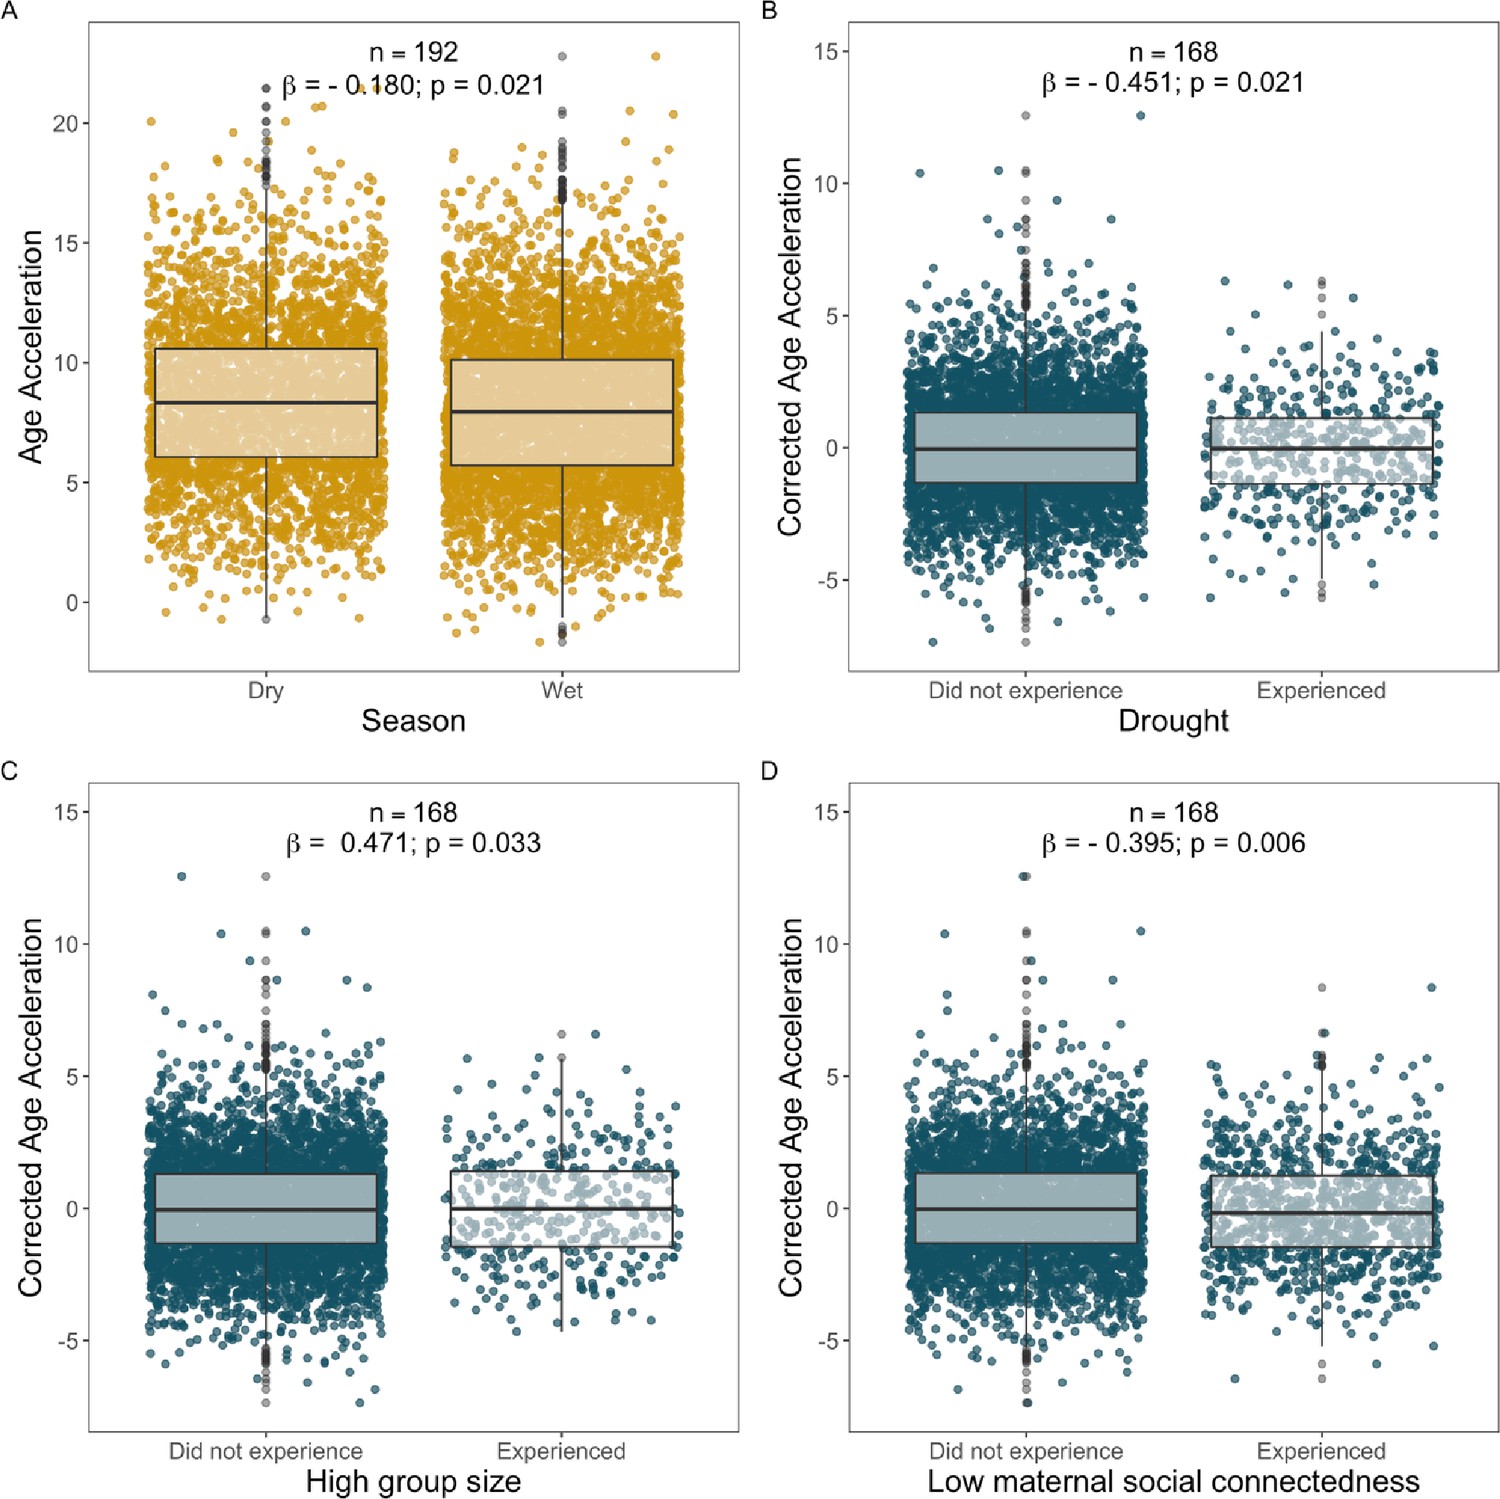
Statistically significant socio-environmental predictors of corrected Δage not shown in Figure 4 in the main text.
Each point represents a sample: yellow points show samples from females, and blue points show samples from males. (A) Season was a weak but significant predictor of lifetime Δage in females (Supplementary file 1A–F). Panels (B–D) show that males who experienced (B) drought, (C) high group size at birth, or (D) low maternal social connectedness at birth exhibited variation in Δage, but in different directions: the experience of early-life drought and maternal social isolation predicted young-for-age gut microbiomes in males, while being born in a large group predicted old-for-age microbiomes (see Results for details). Corrected Δage represents the residuals of the relationship between agem and agec correcting for chronological age, season, monthly temperature, monthly rainfall, social group at the time of collection, and hydrological year (Supplementary file 1B–F).
Tables
Table 1
Comparison of Gaussian process regression model performance between sexes.
Model accuracy was determined based on the correlation between known chronological age (agec) and predicted age (agem), the variance explained in agec by agem (R2), and the median absolute difference between agec and agem (Horvath, 2013).
| Subset | Sample size | R2 | Pearson’s R | Median error (years) |
|---|---|---|---|---|
| All subjects | 13,476 | 48.8% | 0.698 | 1.962 |
| Females only | 8245 | 48.9% | 0.699 | 2.150 |
| Males only | 5231 | 50.0% | 0.707 | 1.706 |
Table 2
Social and environmental factors predicting variation in microbiome Δage in female and male baboons.
Models below only show variables that minimize the Akaike information criterion (AIC) for each model; see Supplementary file 1F for full models. Coefficients for social dominance rank are transformed so higher values reflect higher rank/social status (see footnotes).
| Fixed effect | β | p-value | Interpretation |
|---|---|---|---|
| Predictors of microbiome Δage in females (n = 6743 samples from 192 females) | |||
| Chronological age | –0.551 | <0.001 | Included to control for the correlation between chronological age and microbiome Δage (Figure 3) |
| Season | –0.180 | 0.021 | Dry season samples are microbially old-for-age |
| Proportional rank* | 1.745 | <0.001 | Low-ranking females are microbially young-for-age |
| Predictors of microbiome Δage in males (n = 4355 samples from 168 males) | |||
| Chronological age | –0.404 | <0.001 | Included to control for the correlation between chronological age and microbiome Δage (Figure 3) |
| Ordinal rank† | 0.033 | <0.001 | Low-ranking males are microbially young-for-age |
| Born in a drought | –0.451 | 0.021 | Males born during a drought are microbially young-for-age |
| Born into a large group | 0.471 | 0.033 | Males born into large groups are microbially old-for-age |
| Socially isolated mother | –0.395 | 0.006 | Males with a socially isolated mother are microbially young-for-age |
-
*
Proportional rank ranges from 0 to 1, with higher values reflecting higher social status.
-
†
Ordinal rank is an integer ranking, with lower values reflecting higher social status; we have inverted the sign of the coefficient so higher numbers reflect higher rank to facilitate comparison to females.
Additional files
-
Supplementary file 1
Descriptive tables and tables reporting results from quantitative analyses.
(A) Linear and quadratic relationships with age for alpha diversity, principal components of composition, and CLR transformed taxa present in >25% of samples (FDR threshold=0.05). (B) A total of 9,575 features were used to create the gut microbiome clock of aging. To be included, features must have been present in three or more samples. (C) Linear models of host microbiome age as predicted by host chronological age and host sex and an interaction between host age and sex. (D) Linear models of host microbiome age as predicted by host chronological age for each sex separately. (E) Predictive accuracy of several age-related metrics and traits in the Amboseli baboons. (F) Results of linear mixed effects models predicting microbiome delta age in female and male baboons (each sex is modeled separately). (G) Sources of early life adversity in the Amboseli population. (H) Description of developmental milestones and survival, with definitions of how censored animals were assessed. (I) Results of Cox proportional hazards models testing the effects of microbiome age acceleration on the time to attain three developmental milestones in female baboons (adult rank attainment, menarche, and first live birth), as well as juvenile and adult survival. (J) Results of Cox proportional hazards models testing the effects of microbiome age acceleration on the time to attain three developmental milestones in male baboons (testicular enlargement, natal dispersal, adult rank attainment), as well as male juvenile survival. (K) Comparison of four regression approaches used to construct the microbiome clock of aging. (L) Description of predictors used in the socio-environmental predictor and milestone analyses.
- https://cdn.elifesciences.org/articles/102166/elife-102166-supp1-v1.xlsx
-
MDAR checklist
- https://cdn.elifesciences.org/articles/102166/elife-102166-mdarchecklist1-v1.pdf
Download links
A two-part list of links to download the article, or parts of the article, in various formats.
Downloads (link to download the article as PDF)
Open citations (links to open the citations from this article in various online reference manager services)
Cite this article (links to download the citations from this article in formats compatible with various reference manager tools)
Social and environmental predictors of gut microbiome age in wild baboons
eLife 13:RP102166.
https://doi.org/10.7554/eLife.102166.3


