LC8 enhances 53BP1 foci through heterogeneous bridging of 53BP1 oligomers
- Department of Biochemistry and Biophysics, Oregon State University, United States
- Department of Radiation Oncology, University of Texas Health and Science Center, United States
- Oregon State University NMR Facility, Oregon State University, United States
Figures
Figure 1
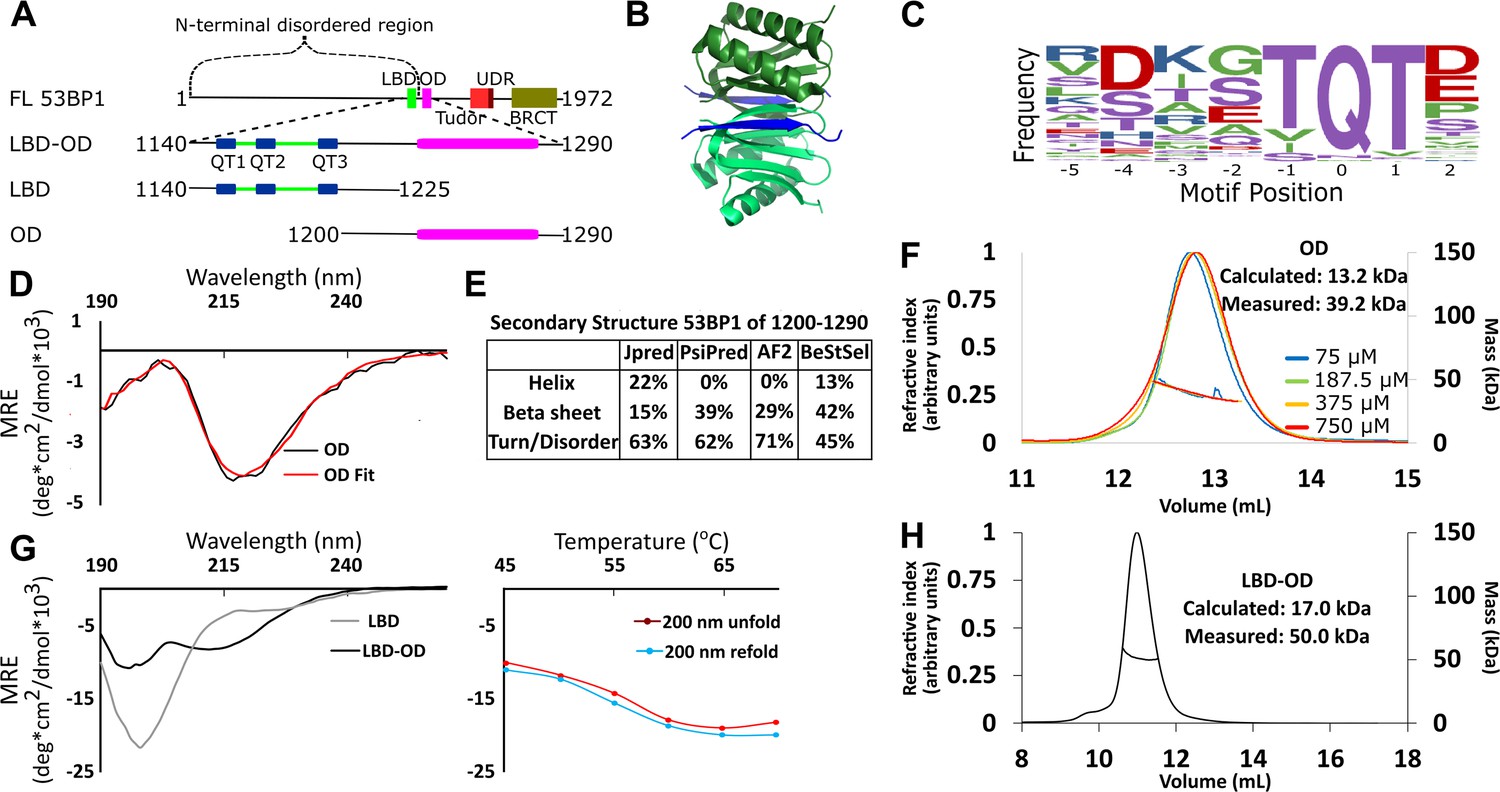
Domain architecture of 53BP1 and preliminary characterization.
(A) Map of 53BP1 domain architecture showing LC8 binding sites (QT1-3) in blue and the oligomerization domain (OD) in magenta. (B) Structure of LC8 dimer (green) bound to two strands of a peptide of partner (blue) (PDB code 5E0L). (C) Variable binding motif recognized by LC8. The x-axis shows the residue position, and the y-axis shows the frequency of residues found in known LC8 binding clients. The anchor is the least variable and is assigned residue numbers of –1, 0, and 1. (D) Circular dichroism (CD) data for 53BP1 OD (aa 1200–1290) overlaid by BeStSel fit. Data are presented in units of mean residue ellipticity (MRE). Percent secondary structure is reported in F. (E) Secondary structure predictions of 53BP1 1200–1290 using JPred, PsiPred, AlphaFold2, and BeStSel fit of CD data. (F) Size-exclusion chromatography coupled to multi-angle light scattering (SEC-MALS) of 53BP1 OD (1200–1290) in the loading concentration range of 75–750 μM (on the column 7.5–75 μM) showing no change in the mass corresponding to a trimer (monomer 13.2, measured 39.2 kDa). (G) (Left) Circular dichroism of 53BP1 LC8 binding domain (LBD)-OD overlaid with LBD (1140–1225) spectra, shown here for comparison. In addition to the minima at 200 nm for LBD-OD (1140–1290), indicative of disorder, the minima near 218 nm shows evidence of an ordered region. (Right) Thermal denaturation (red) and refolding (blue) of LBD-OD showing increase in ellipticity at 200 nm. (H) SEC-MALS of 53BP1 LBD-OD shows mass consistent with a trimer.
-
Figure 1—source data 1
Data for CD and SEC-MALS.
- https://cdn.elifesciences.org/articles/102179/elife-102179-fig1-data1-v2.xlsx
Figure 2
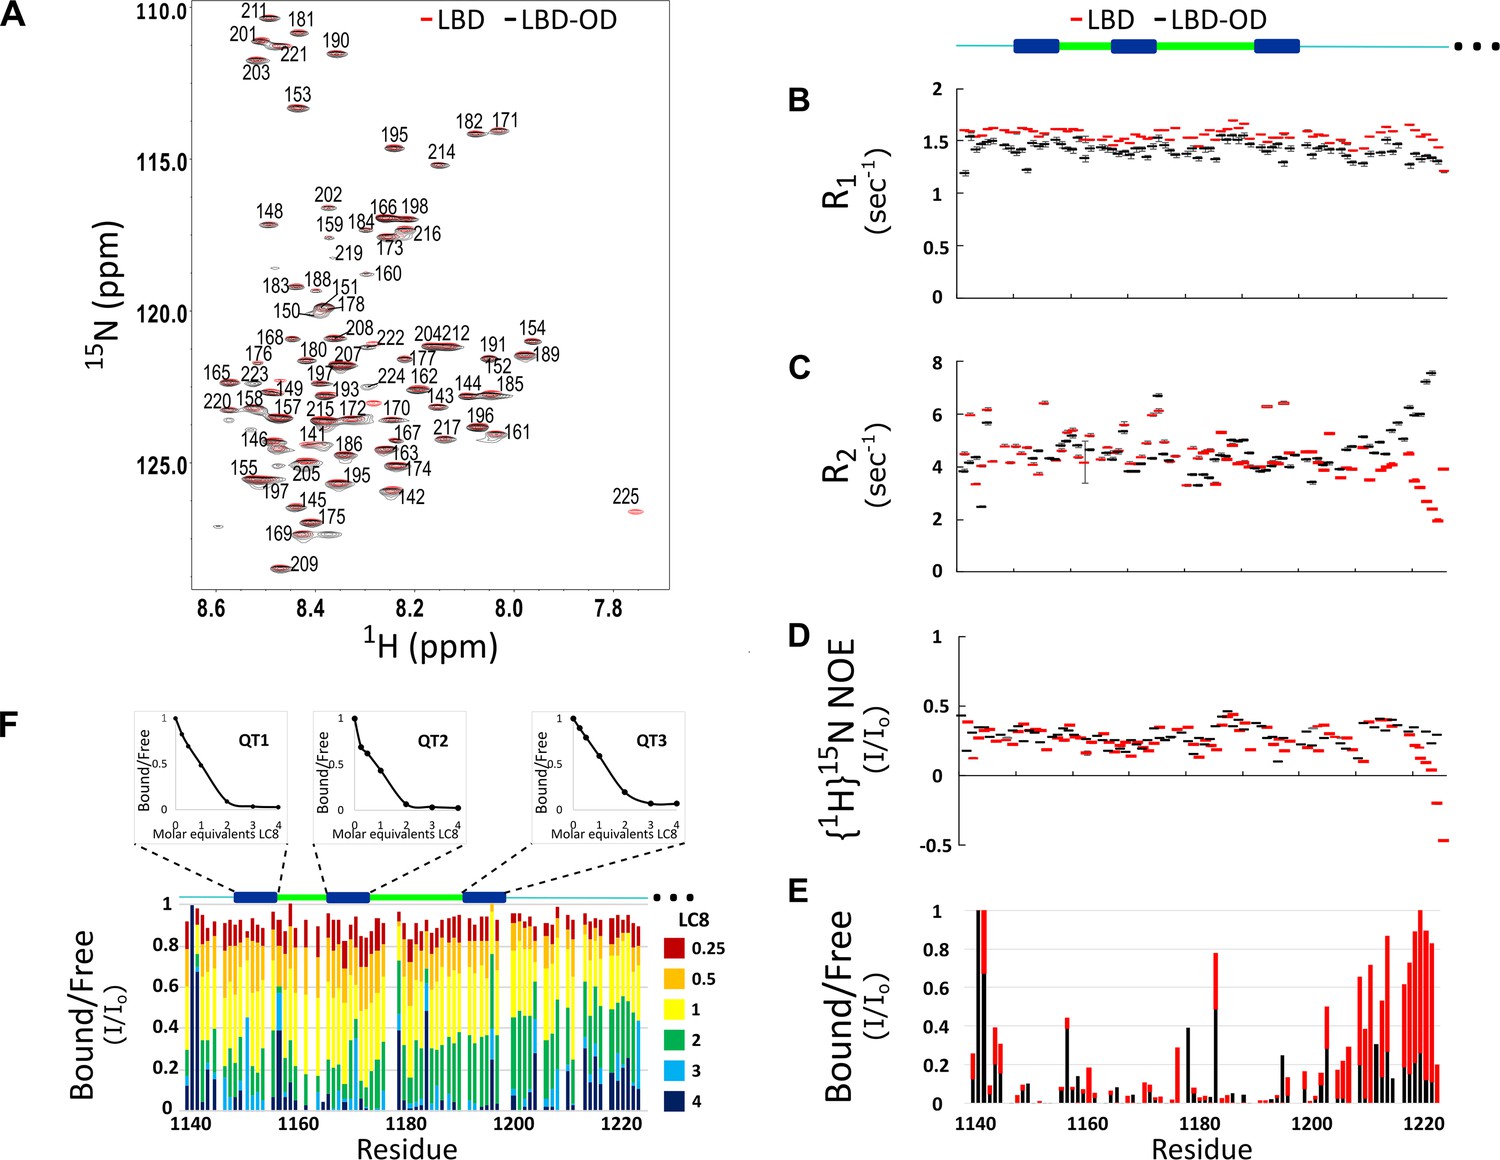
Comparison of structure and interactions of LC8 binding domain (LBD) (1140–1225) and LBD-oligomerization domain (OD) (1140–1290) with LC8 probed by NMR.
(A) Overlay of 1H-15N heteronuclear single quantum coherence (HSQC) spectra of 53BP1 LBD (red) and LBD-OD (black) acquired at 800 MHz at 10°C in 20 μM sodium phosphate (pH 6.5) and 50 μM sodium chloride with 10% D2O. The peaks are labeled for residues within the 1140-1225 segment without including the one thousands place, which is 1--- for every residue to minimize crowding. Resonances overlay well for almost all residues. (B) R1, (C) R2, and (D) {1H}15N NOE overlay of LBD (red) and LBD-OD (black). Diagram of 53BP1 LBD with LC8 QT sites labeled in blue shown at the top. (E) Overlay of 15N LBD and 15N LBD-OD peak height in 1H-15N HSQC in the presence of 4 molar equivalents of LC8. (F) Titration of uniformly labeled 15N LBD-OD (1140–1290) with unlabeled LC8. A diagram of LBD-OD is shown above the plot which highlights the locations of QT sites (blue). The average signal for the 8 residues comprising the QT site is shown in decay curves above each QT site as a function of LC8 concentration. Note that since OD signals are missing from the spectra, there are no measurements reported in B–F in this region.
-
Figure 2—source data 1
NMR relaxation and titration data.
- https://cdn.elifesciences.org/articles/102179/elife-102179-fig2-data1-v2.xlsx
Figure 3
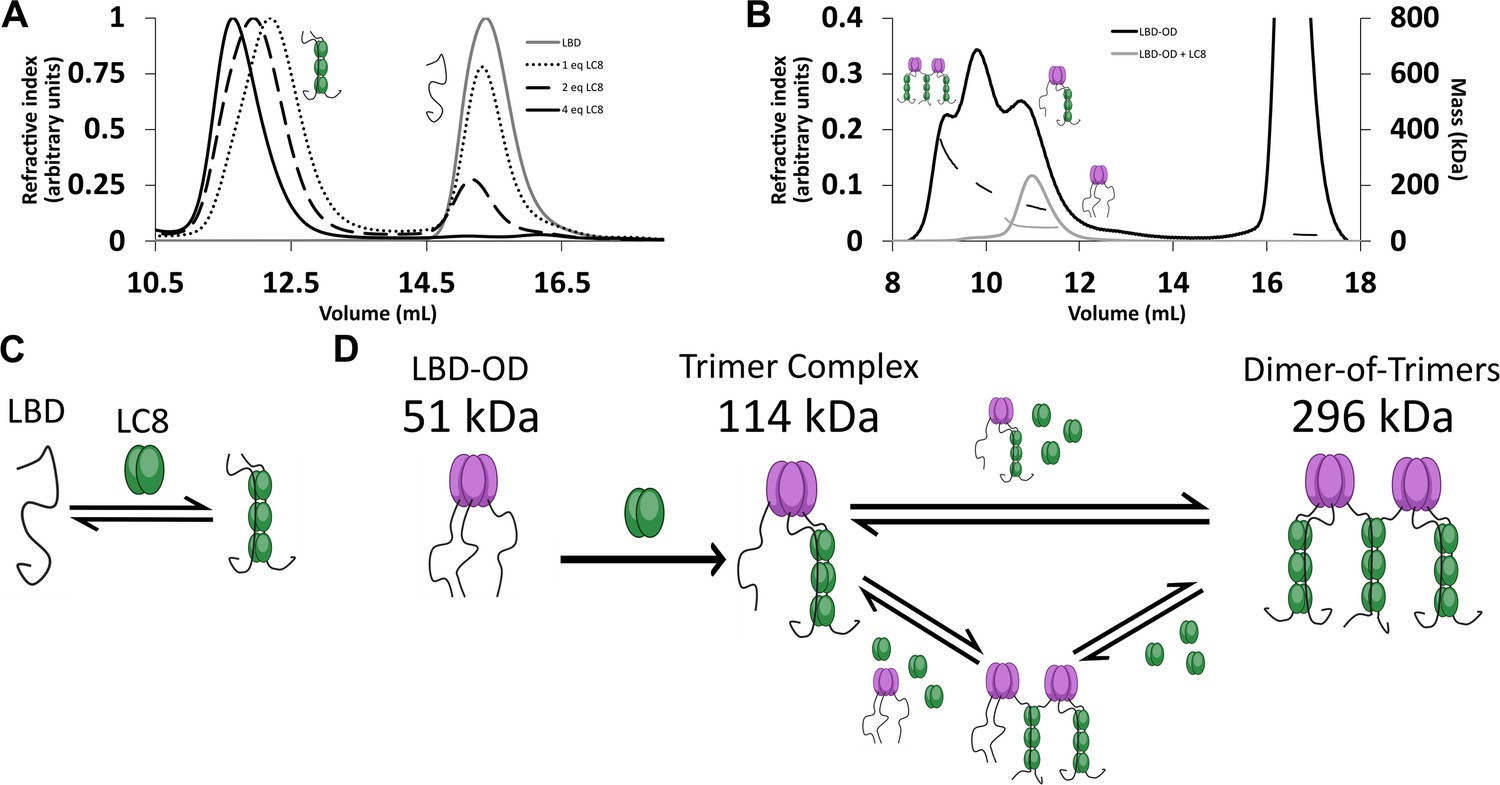
LC8 binding domain (LBD)-oligomerization domain (OD) (1140–1290) forms a heterogeneous complex when bound to LC8.
(A) Titration of 53BP1 LBD (1140–1225) results in a single species with large mass, even at low stoichiometric equivalents. Data is adapted from Howe et al., 2022, and shown here for comparison. (B) Size-exclusion chromatography coupled to multi-angle light scattering (SEC-MALS) of free LBD-OD and LBD-OD with 4 molar equivalents of LC8 shows the formation of a heterogeneous mixture of complexes with masses in the 120–296 kDa range (Table 2). (C) Model of LBD binding LC8. A duplex containing 2 strands of LBD and 3 dimers of LC8 is created in a single step. (D) Model of LBD-OD binding LC8. 53BP1 trimers bind LC8, forming a trimer complex containing 1 53BP1 trimer and 3 LC8 dimers. The trimer complex binds excess LC8-forming bridged complexes. We simplify our model to show trimer and dimer-of-trimers only, as these are the major species based on the 53BP1 showing no concentration-dependent shift from a trimeric mass analyzed by SEC-MALS.
-
Figure 3—source data 1
Titration data from SEC-MALS.
- https://cdn.elifesciences.org/articles/102179/elife-102179-fig3-data1-v2.xlsx
Figure 4
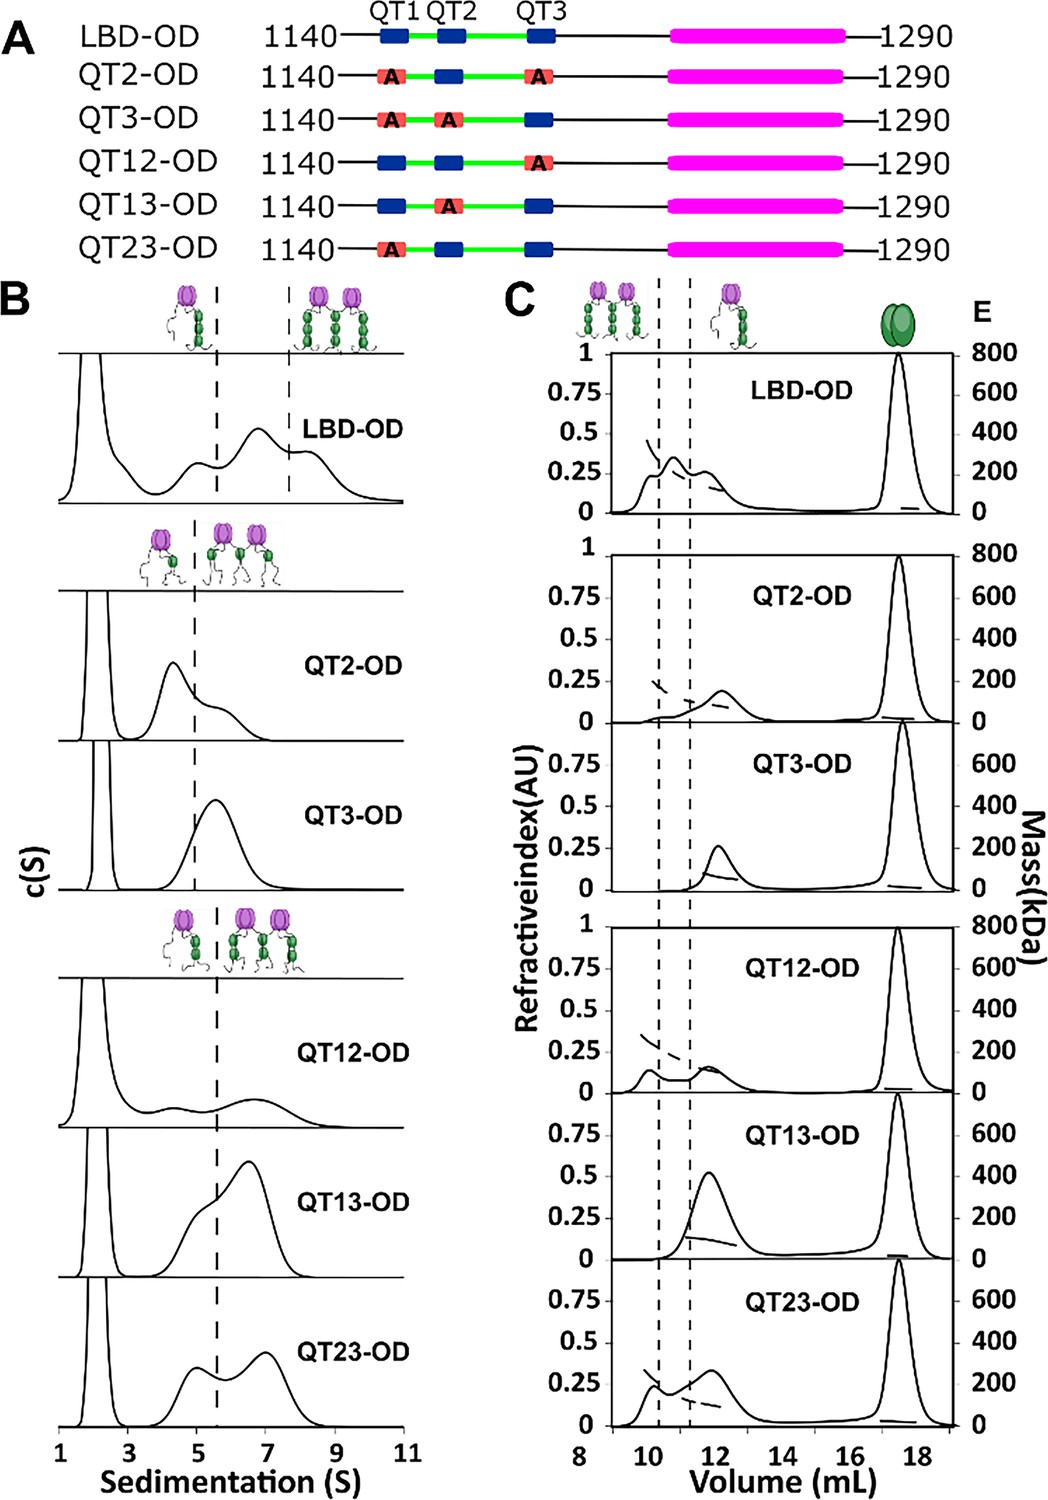
QT2 determines the stability of bridged complex.
(A) Domain maps of LC8 binding domain (LBD)-oligomerization domain (OD) QT mutants. LC8 binding sites (QT) are shown in blue, while those mutated to abolish binding are shown in red. (B) Sedimentation velocity analytical ultracentrifugation (SV-AUC) of wild-type (WT) (top) one-site mutants (center) and two-site mutants (bottom) in 50 mM sodium phosphate and 150 mM sodium chloride at 25°C. Dotted lines separate large mass peaks from small mass peaks. Peaks with high S value are assigned to the dimer-of-trimers complex and low mass peaks to the trimer complex, represented in cartoon. (C) SEC-MALS of complexes formed by LBD-OD and mutants in 50 mM sodium phosphate and 150 mM sodium chloride (pH 7.2). Dotted lines separate large mass peaks from small mass peak. The dimer-of-trimers complexes are only observed for the complexes containing intact QT2.
-
Figure 4—source data 1
Titration data from SEC-MALS and AUC.
- https://cdn.elifesciences.org/articles/102179/elife-102179-fig4-data1-v2.xlsx
Figure 5

Thermodynamics of interactions of LC8 binding domain (LBD)-oligomerization domain (OD) and mutants with LC8.
(A–D, F–H) Representative isotherms for LBD-OD (A), QT1-OD (B), QT2-OD (C), QT3-OD (D), QT12-OD (F), QT13-OD (G), and QT23-OD (H) with LC8 in 50 mM sodium phosphate and 150 mM sodium chloride (pH 7.2) at 25°C. In these experiments, LC8 at 250–400 μM was titrated into LBD-OD or mutant at 10–30 μM. (E, I) Isotherm of QT3-OD (E) and QT13-OD (I) at 200 μM titrated into 20 μM LC8. The downward inflection early in the titration is not present in this isotherm, as it is in the titration of LC8 into mutant in D and H. (J) A cartoon illustrating how a stable intermediate is formed during titration. (Top) When LC8 is titrated into QT3-OD, excess 53BP1 binds LC8, resulting in forming the trimeric intermediate. (Bottom) When QT3-OD is titrated into LC8, excess LC8 allows the bridged complex to form without a stable intermediate. (K) Bar graph of thermodynamic parameters for A-G isotherms fit to one-set-of-sites (OSS) model. Thermodynamic parameters are shown in Table 1. (L) Affinities of one-site binding in 53BP1 determined from fits to the OSS model for LBD and LBD-OD are in gray and orange and using subsequent binding sites (SBS) model in cyan (intratrimer) and magenta (bridging). QT2-OD has the smallest difference in affinity between intratrimer and bridging interactions. For statistical analysis: QT1 n=3, QT2 n=4, QT3 n=5. Error bars are defined as the aggregated errors of each individual Origin fit line. The method for aggregating the different values and their errors is in the Methods section.
Figure 6

Linker length between LC8 binding domain (LBD) and oligomerization domain (OD) determines the stability of bridged complex.
(A) Domain map of 53BP1 linker deletion mutants. (B) Size-exclusion chromatography coupled to multi-angle light scattering (SEC-MALS) of 53BP1 linker deletion mutants shows a high proportion of bridged complexes. (C) Model of the effect of reducing the linker in 53BP1 LBD-OD. Shorter linker results in increased population of bridged complex seen by SEC-MALS. (D) Isothermal titration calorimetry (ITC) shows sigmoidal curves with stoichiometry near 3, consistent with a single binding step. (E) The entropic contribution becomes more favorable as the linker length is decreased, but the overall affinity of the interaction is unchanged.
-
Figure 6—source data 1
SEC-MALS data.
- https://cdn.elifesciences.org/articles/102179/elife-102179-fig6-data1-v2.xlsx
Figure 7

LC8 bridging promotes 53BP1 recruitment to DNA damage sites.
(A) (Top) Domain map of 53BP1 QT2 mutants. (Bottom) Sequence of the three QT sites (QTs) in 53BP1. QT2 is the only site with the canonical TQT anchor. (B) Mutation of the –1 site (T1171) in 53BP1 has drastic effects on the relative population of trimer and bridged complexes. The phosphomimetic (T1771E) elutes completely as a trimer, while both phosphodeficient mutants (T1171I/V) generate a mixture of trimer and bridged complex. (C) Model showing the effect of reducing the linker length in 53BP1 LC8 binding domain (LBD)-oligomerization domain (OD) on the proportion of bridged complex. (D) (Top) Domain map of constructs transfected into U2OS cells. These constructs span residues 1052–1711 and contain the LBD, OD, Tudor, UDR, and nuclear localization sequence (NLS) of 53BP1. (Bottom) Representative immunofluorescence micrographs of GFP-labeled 53BP1 fragment aa1052–1711 wild-type and mutants, at 1 hr after 10 Gy irradiation. Scale bar is 20 µm (E) Quantification of 53BP1 foci as presented in D for the indicated expression vectors. The error bars correspond to mean ± SEM. The total number of cell analyzed is >180. The total number for each group is the following: WT 184, T1171I 200, T1171E 259, QT2 292, QT12 217, QT13 209, LC8 Null 250. One way ANOVA was used for statistical analysis. ns- non significant; **<0.01; ***<0.001.
-
Figure 7—source data 1
SEC-MALS data.
- https://cdn.elifesciences.org/articles/102179/elife-102179-fig7-data1-v2.xlsx
Figure 8
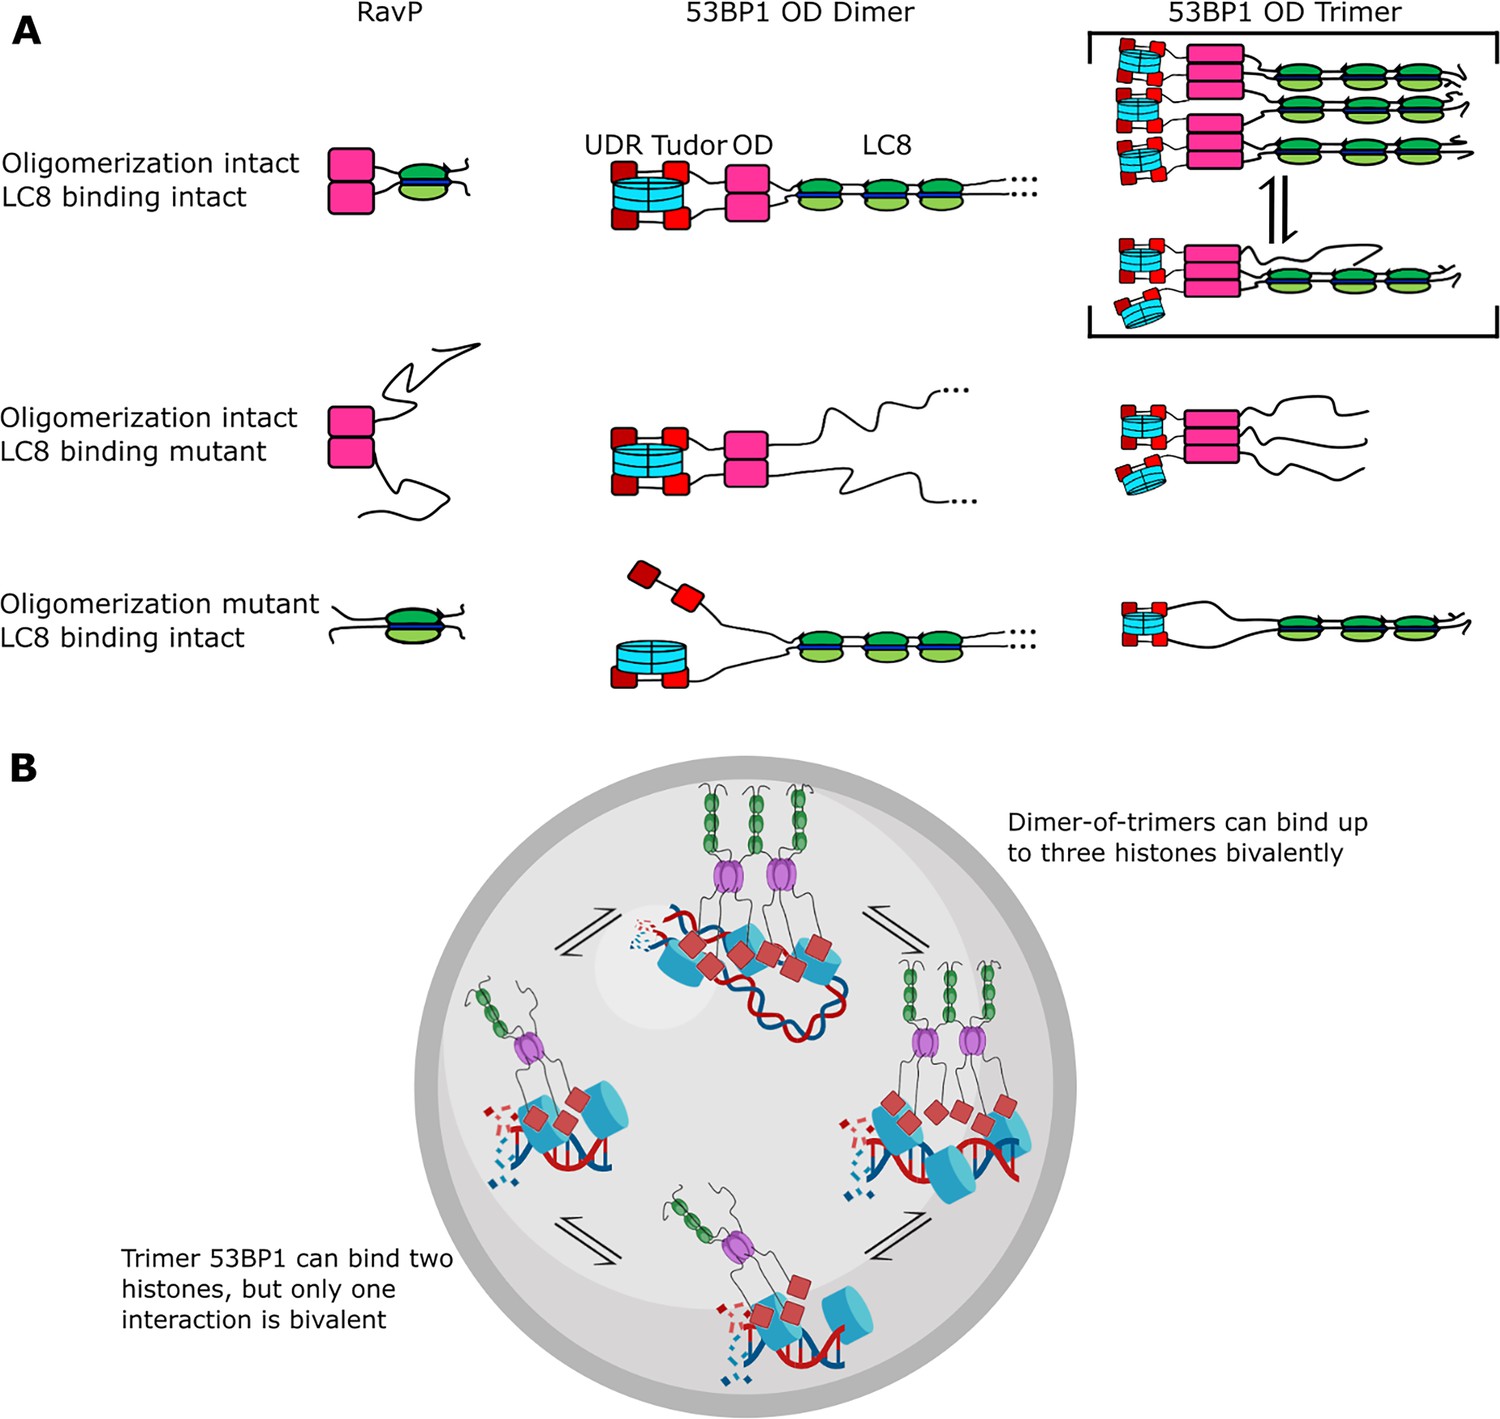
Mechanism of LC8 enhancement of 53BP1 focus formation.
(A) Cartoon showing roles of LC8 in an interaction with RavP (Jespersen et al., 2019b) (left), published mechanisms for LC8 with 53BP1 (Becker et al., 2018) (center), and revised mechanism based on this work (right). In RavP, the N-termini are aligned with LC8, but when LC8 binding is removed, the termini occupy a larger conformational ensemble. In the dimeric 53BP1 oligomerization domain (OD) model, 53BP1 is a dimer as long as either the OD or LC8 binding is intact. This model does not fully capture the effect of OD and LC8 mutation of 53BP1 focus formation and cannot be correct because 53BP1 is a trimer, not a dimer. An alternative model is the trimeric 53BP1 OD, which results in higher-order oligomerization of 53BP1 with LC8. Mutation of the OD or LC8 binding would then be expected to produce the observed differences in reductions in focus formation in the OD mutant (ODm) and LC8 binding mutant (LC8m). (B) LC8-53BP1 binding and accumulation in DNA repair foci. 53BP1/LC8 complex is in exchange between trimeric and bridged species.
Tables
Table 1
Masses measured by size-exclusion chromatography coupled to multi-angle light scattering (SEC-MALS).
| Measured | |||
|---|---|---|---|
| Construct | High mass (kDa) | Intermediate mass (kDa) | Low mass (kDa) |
| LBD-OD | 296±2.5 | 190±1.7 | 120±2.2 |
| QT2-OD | 168±1.2 | 104±0.6 | 80±.5 |
| QT3-OD | – | – | 69±0.4 |
| QT12-OD | 247±1.2 | 178±0.8 | 112±0.5 |
| QT13-OD | – | – | 92±0.5 |
| QT23-OD | 233±1.3 | 123±0.7 | 101±0.6 |
Table 2
Expected masses of LC8 binding domain (LBD)-oligomerization domain (OD) mutants in different LC8 complexes.
| Complex | Bridged complex ratio (53BP1 trimers:LC8 dimers) | Expected mass (kDa) | Trimer complex (53BP1 trimers:LC8 dimers) | Expected mass (kDa) |
|---|---|---|---|---|
| LBD-OD | 2:9 | 292.8 | 1:3 | 114.6 |
| One-site mutants | 2:3 | 165.6 | 1:1 | 72.2 |
| Two-site mutants | 2:6 | 229.2 | 1:2 | 93.4 |
Table 3
Thermodynamics of LBD-OD:LC8 interactions measured by isothermal titration calorimetry (ITC).
| Construct | N | Kd (μM) | ΔH (kcal/mol) | –TΔS (kcal/mol) | ΔG (kcal/mol) |
|---|---|---|---|---|---|
| LBD-OD | 2.8±0.4 | 0.4±0.1 | –9.7±2 | 0.9±2.3 | –8.8±0.2 |
| QT1-OD | 1.1±0.04 | 5.0±1 | –7.1±0.4 | –0.1±0.6 | –7.2±0.2 |
| QT2-OD | 1.2±0.02 | 1.2±0.03 | –10.6±0.3 | 2.5±0.3 | –8.1±0.01 |
| QT3-OD* | 0.87±0.04 | 0.86±0.04 | –6.9±0.1 | –1.4±0.1 | –8.3±0.03 |
| QT12-OD | 2.3±0.1 | 0.5±0.3 | –9.4±0.5 | 0.7±0.9 | –8.7±0.4 |
| QT13-OD* | 2.1±0.1 | 0.7±0.02 | –5.6±0.1 | –2.8±0.1 | –8.4±0.02 |
| QT23-OD | 1.9±0.05 | 0.4±0.1 | –7.0±0.3 | –1.7±0.4 | –8.7±0.2 |
-
*
Values extracted from reverse experiment (LC8 binding domain [LBD]-oligomerization domain [OD] mutant titrated into LC8). Stoichiometries are presented as reciprocal for these experiments for simple comparison to other mutants.
Additional files
Download links
A two-part list of links to download the article, or parts of the article, in various formats.
Downloads (link to download the article as PDF)
Open citations (links to open the citations from this article in various online reference manager services)
Cite this article (links to download the citations from this article in formats compatible with various reference manager tools)
LC8 enhances 53BP1 foci through heterogeneous bridging of 53BP1 oligomers
eLife 14:e102179.
https://doi.org/10.7554/eLife.102179


