A biofilm-tropic Pseudomonas aeruginosa bacteriophage uses the exopolysaccharide Psl as receptor
- Department of Molecular Biology and Microbiology, Case Western Reserve University, United States
- Department of Ophthalmology, University of California, Irvine, United States
- Ophthalmology and Visual Sciences, Institute for Immunology, University of California, Irvine, United States
- Department of Chemical Biology and Drug Discovery, Utrecht Institute for Pharmaceutical Sciences, and Bijvoet Center for Biomolecular Research, Utrecht University, Netherlands
- Department of Microbiology, University of Washington, United States
- Department of Pharmacology, Case Western Reserve University, United States
- Department of Microbial Infection and Immunity, The Ohio State University, United States
- Department of Microbiology, The Ohio State University, United States
- Complex Carbohydrate Center, University of Georgia, United States
- Department of Chemistry, University of Georgia, United States
Figures
Figure 1 with 4 supplements
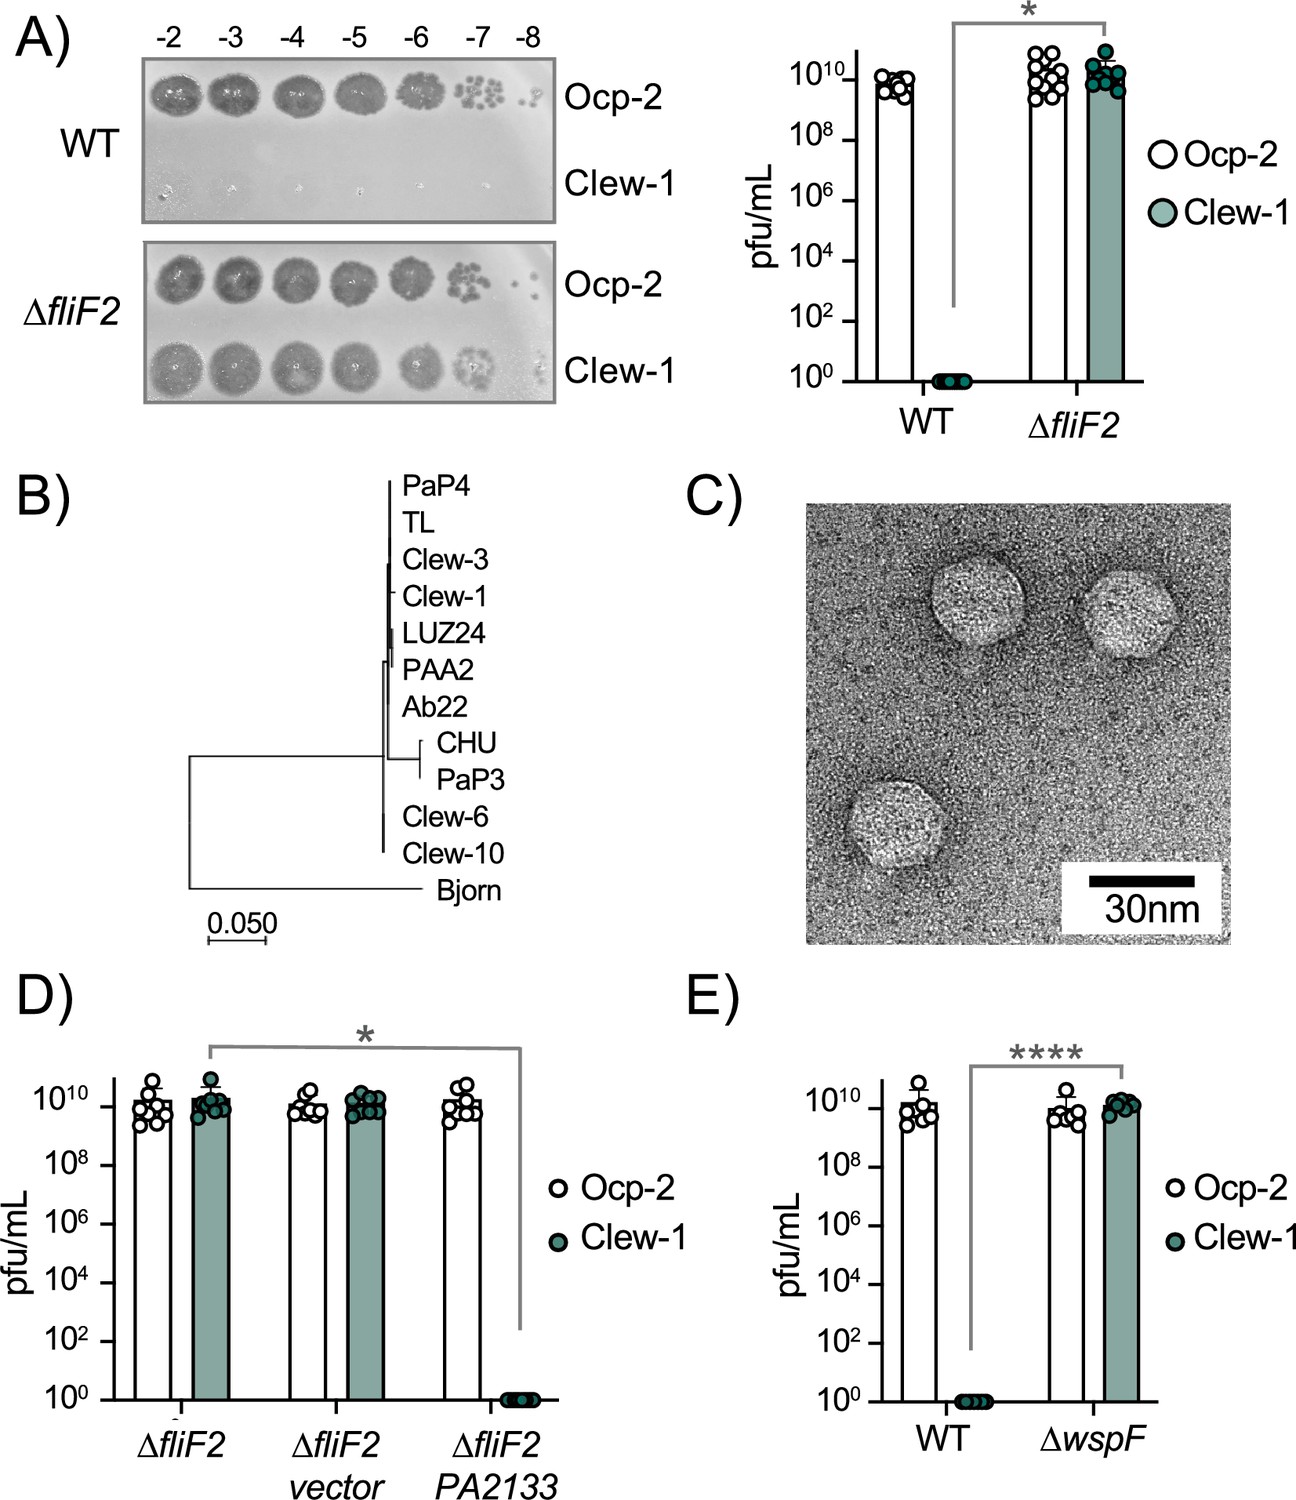
c-di-GMP levels control infection of P. aeruginosa by bacteriophage Clew-1.
(A) Efficiency of plating experiment in which 3 µL of a 10x dilution series of bacteriophage Ocp-2 or Clew-1 were spotted on wild-type PAO1F, or PAO1F ∆fliF2. The adjacent graph shows the compiled results from 11 experiments. (B) Maximum likelihood phylogenetic tree of Clew-1 relative to other Bruynogheviruses (including the type phage, LUZ24) and phage Bjorn as an outgroup. Branch lengths are measured in number of substitutions per site in the terminase large subunit. (C) transmission electron micrograph of the Clew-1 phage. (D) Efficiency of plating experiment as in (A) assaying the effect of expressing the phosphodiesterase PA2133 from a plasmid. (E) Efficiency of plating experiment assaying the effect of deleting wspF on Clew-1 resistance. (*p<0.05, ****p<0.0001 by Student’s t-test (A, E) or one-way ANOVA with Šídák’s multiple comparisons test (D)).
-
Figure 1—source data 1
Plating efficiency data for all replicate experiments in panel A.
- https://cdn.elifesciences.org/articles/102352/elife-102352-fig1-data1-v1.zip
-
Figure 1—source data 2
Plating efficiency data for all replicate experiments in panel D.
- https://cdn.elifesciences.org/articles/102352/elife-102352-fig1-data2-v1.zip
-
Figure 1—source data 3
Plating efficiency data for all replicate experiments in panel E.
- https://cdn.elifesciences.org/articles/102352/elife-102352-fig1-data3-v1.zip
Figure 1—figure supplement 1
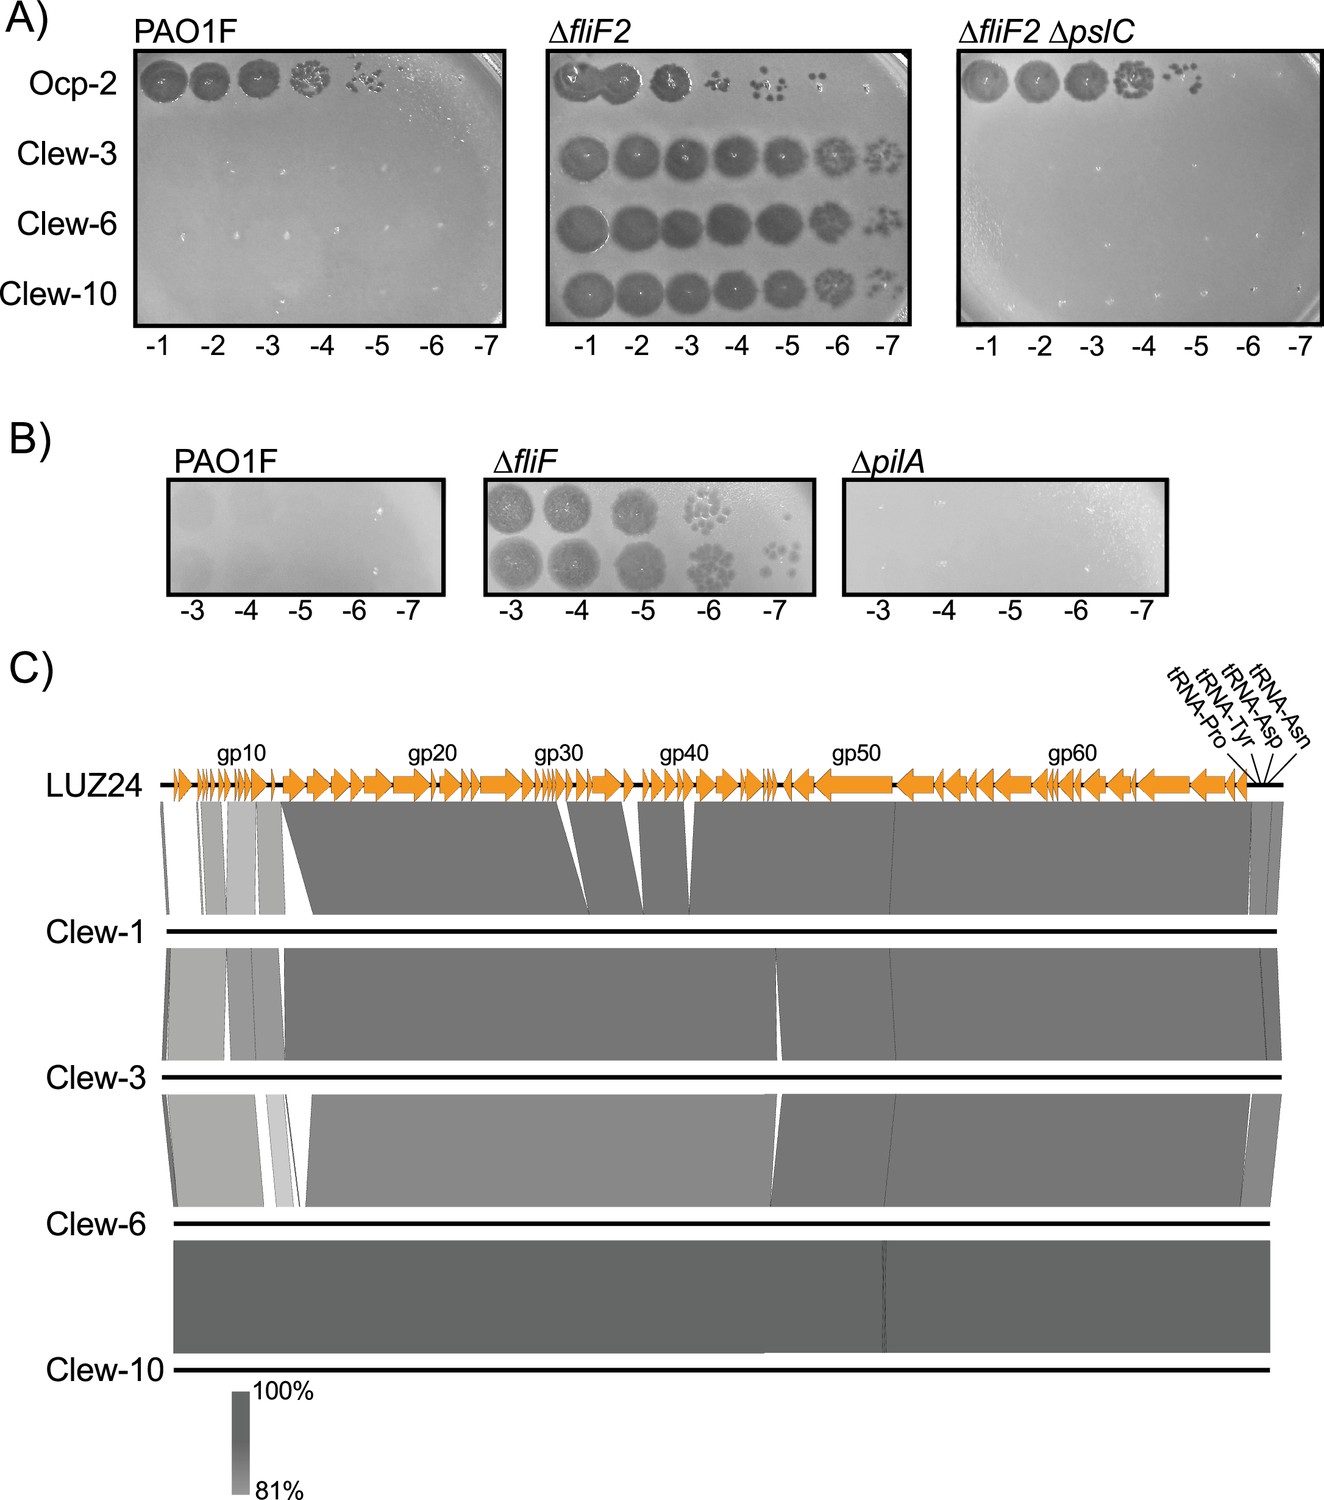
Phage Clew-3, Clew-6, and Clew-10 plaque on a fliF mutant of P. aeruginosa.
(A) A dilution series of the indicated phage lysate was plated on wild-type P. aeruginosa PAO1F, a ∆fliF2 or ∆fliF2 ∆pslC mutant strain. The data are representative of at least two biological replicates. (B) Deletion of fliF, not pilA, permits phage Clew-1 to form plaques. (C) Pairwise comparisons of genomes of Clew-1, Clew-3, Clew-6, and Clew-10 with Luz24, the Bruynoghevirus type strain using EasyFigure Luz24 genes are numbered sequentially and the location of every 10th ORF is indicated (Figure generated with EasyFig).
Figure 1—figure supplement 2
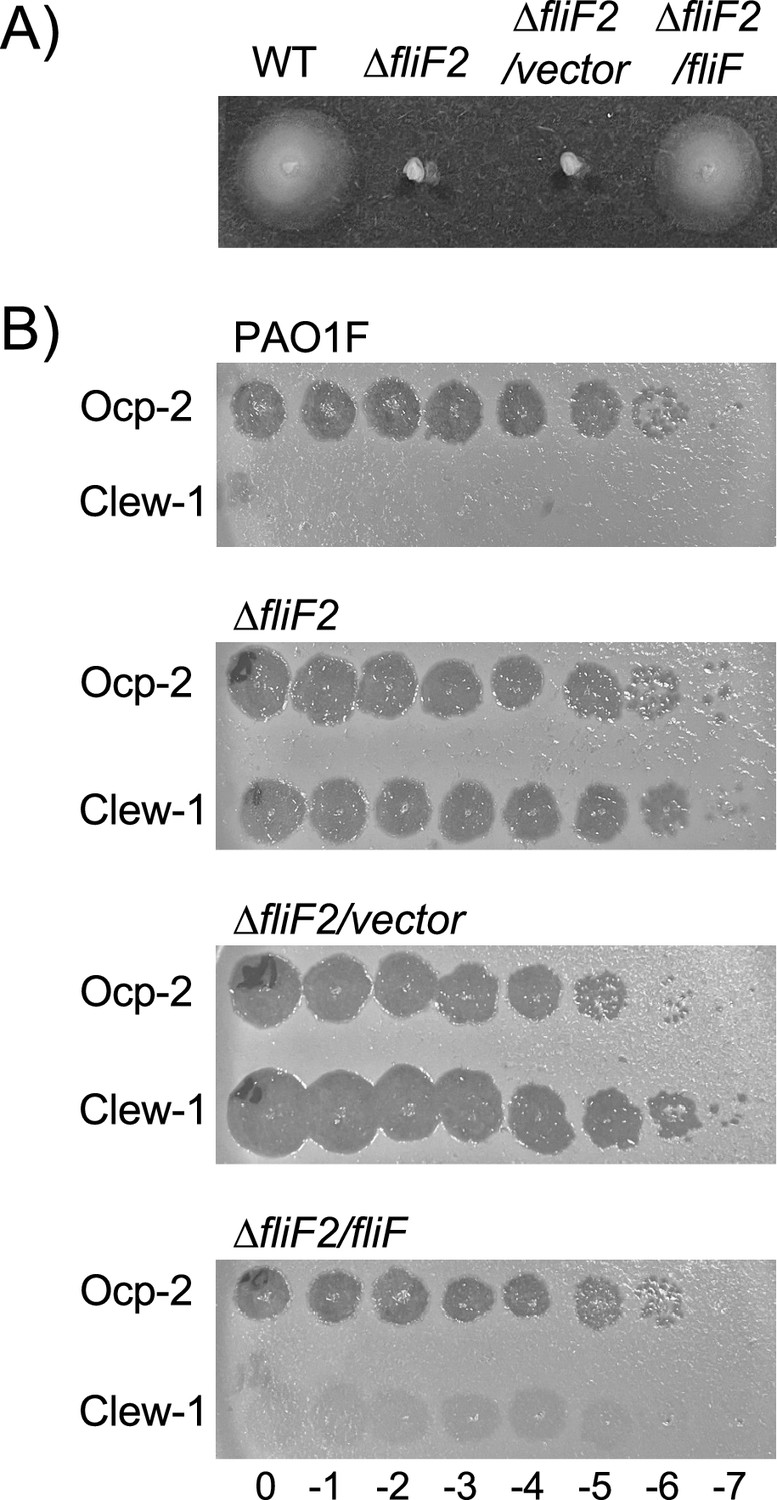
Complementation of the ∆fliF2 mutant.
(A) Swimming motility of wild-type, ∆fliF2, ∆fliF2/pPSV37, or ∆fliF2/pP37-fliF assessed in 0.3% agar plates. (B) Efficiency of plating experiment with the indicated strain, phage, and phage dilution (log10). Data are representative of at least three biological replicates.
Figure 1—figure supplement 3

Efficiency of plating analysis on LPS mutant strains.
Ocp-2 or Clew-1 dilution series was plated on the indicated P. aeruginosa PAO1 mutant strains. ∆gmd prevents formation of A-band LPS (King et al., 2009), ∆wbpM prevents formation of B-band LPS (Creuzenet and Lam, 2001), while ∆ssg results in a defect in the biosynthesis of the outer core (Veeranagouda et al., 2011).
Figure 1—figure supplement 4
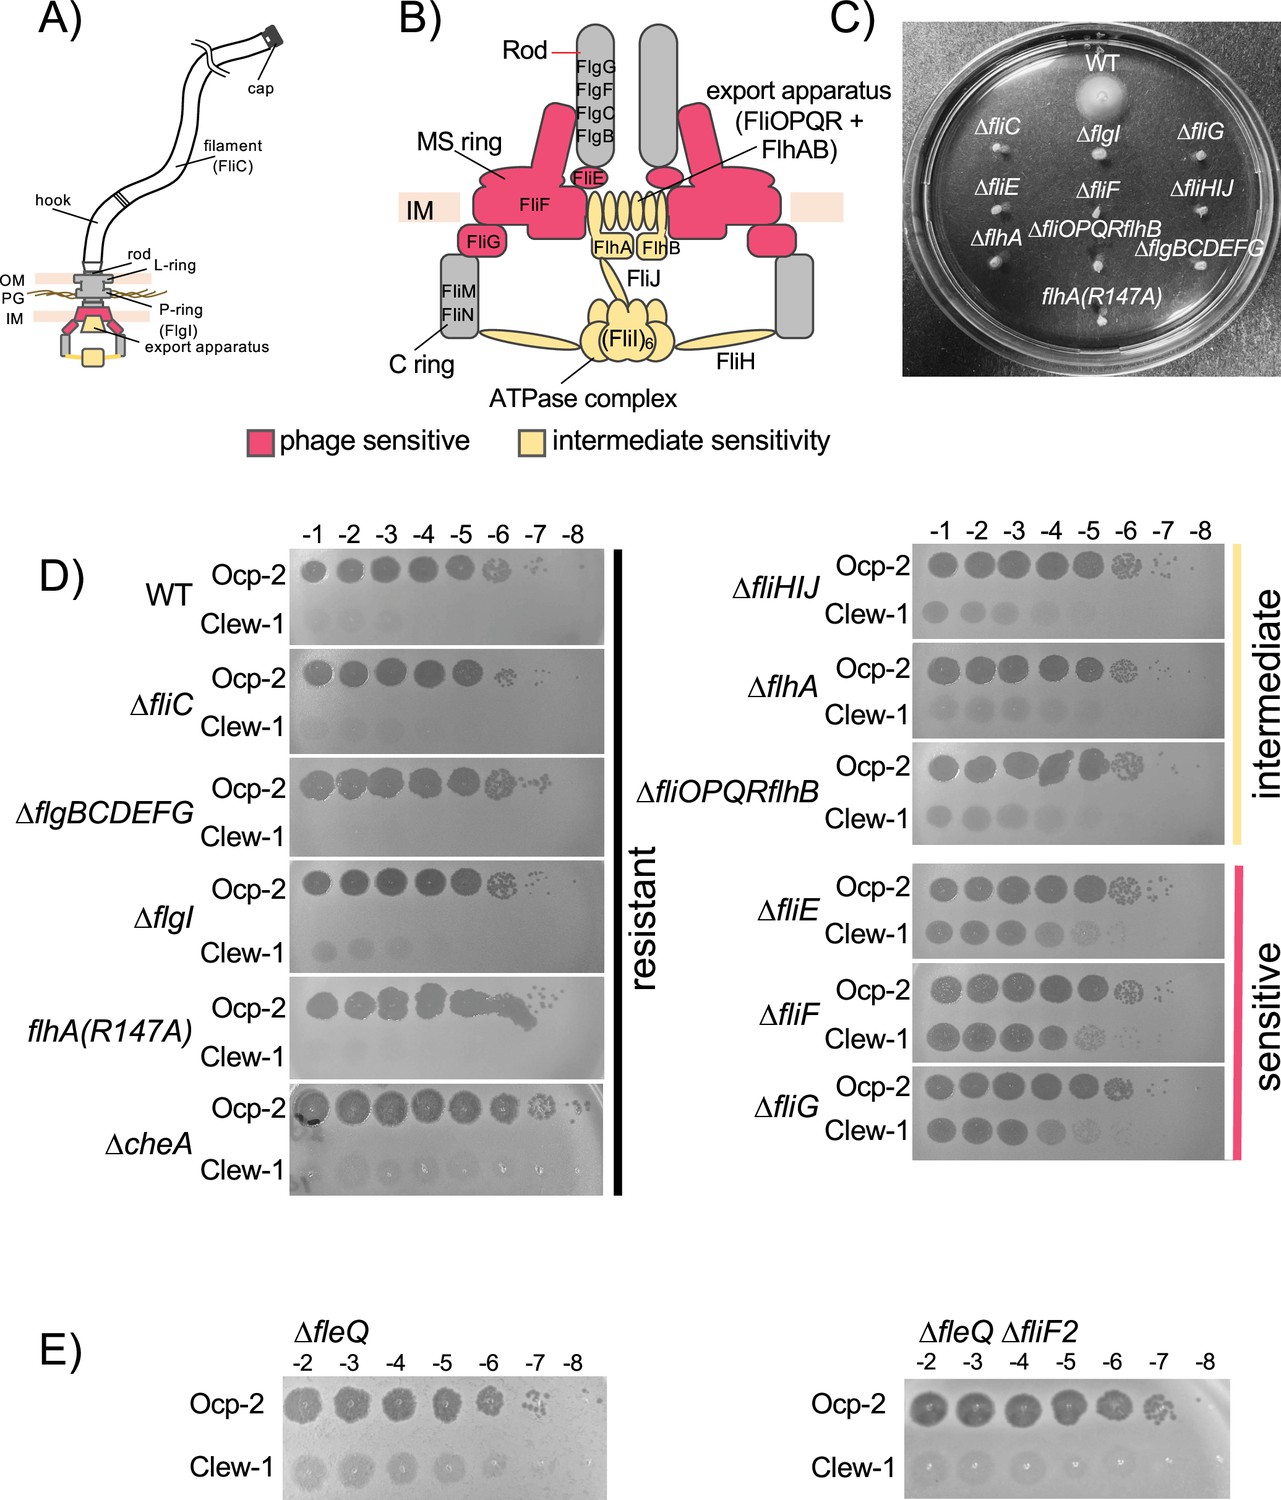
Impact of flagellar mutations on bacteriophage Clew-1 sensitivity.
Schematic of (A) the flagellum and (B) the flagellar basal body. Components whose removal results in complete (red) or partial (yellow) sensitivity are indicated. (C) Swimming motility of wild-type, as well as indicated mutant strains. (D) Efficiency of plating experiment with the indicated strains, phage, and phage dilutions. Data is representative of at least three biological replicates. (E) Efficiency of plating experiment on fleQ mutant strains (representative of at least nine biological replicates).
Figure 2
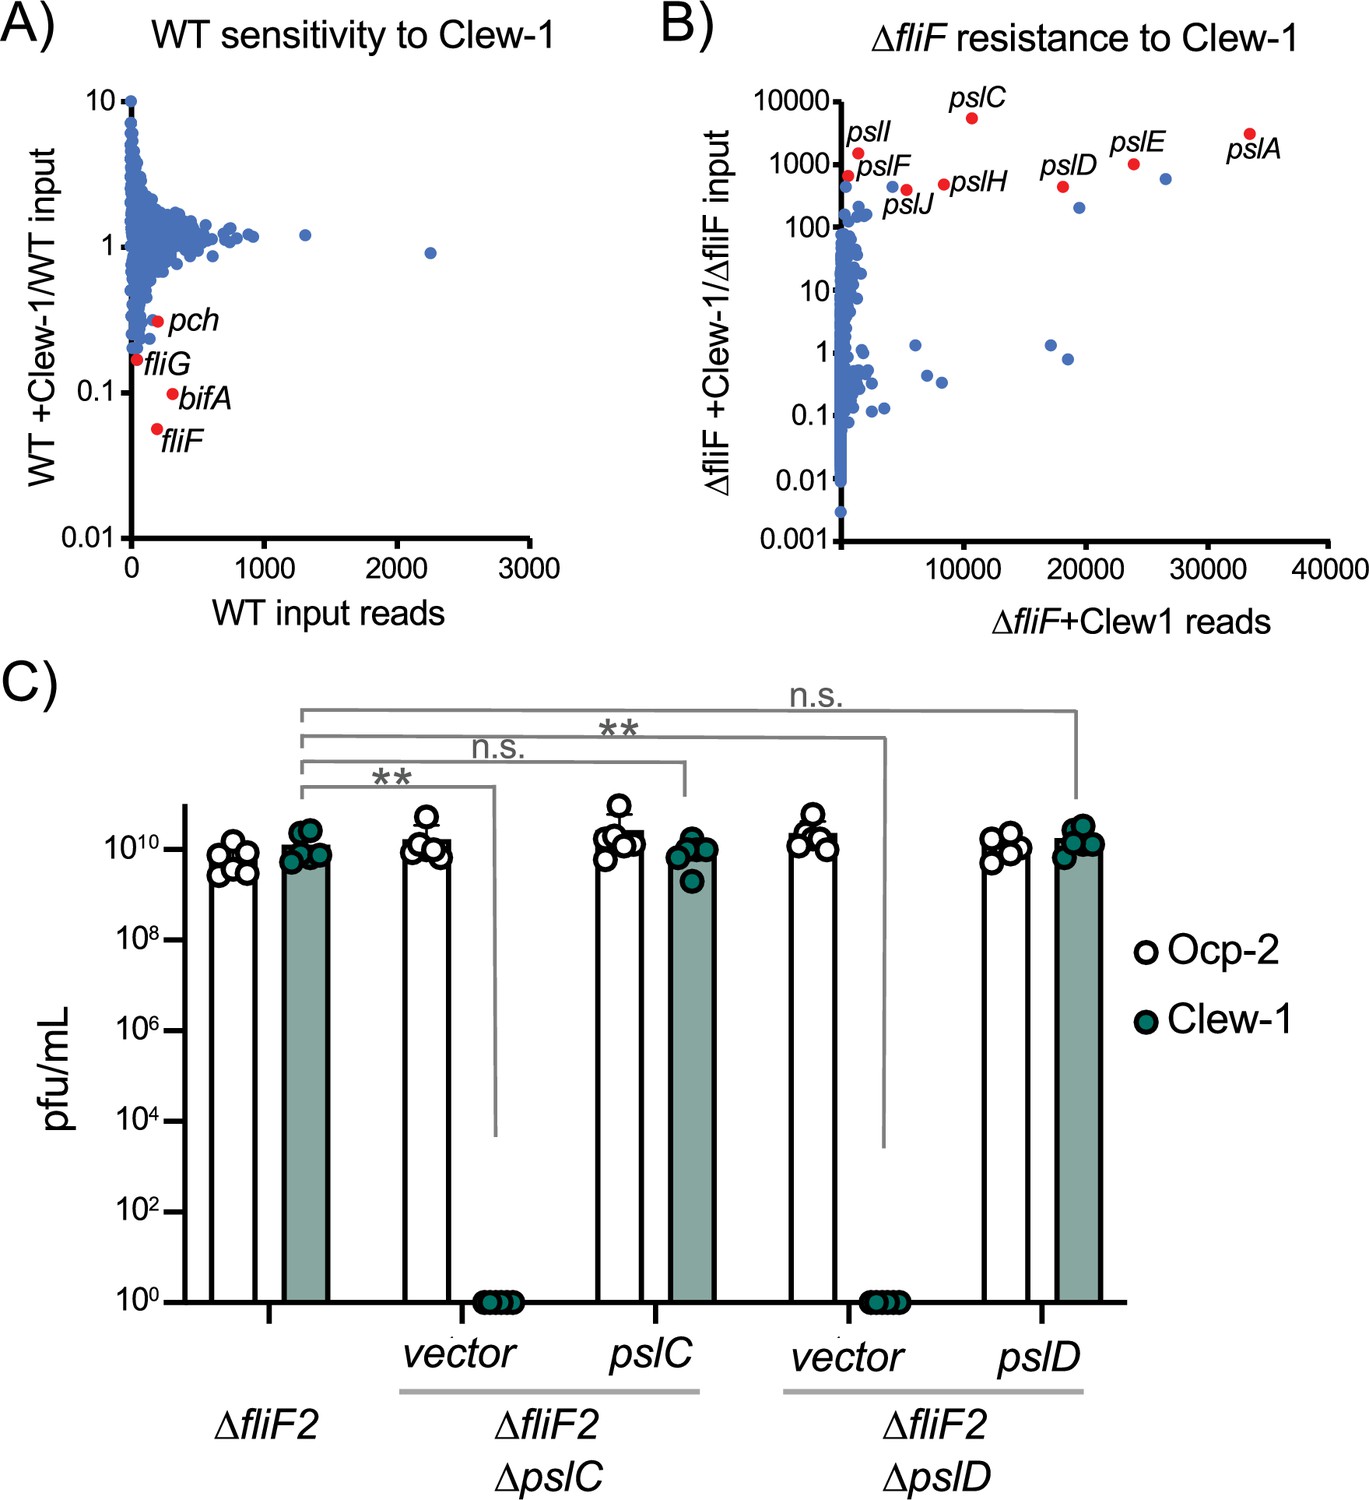
Bacteriophage Clew-1 uses Psl as a receptor to infect P. aeruginosa.
(A) TnSeq experiment in which a pool of mariner transposon mutants of strain PAO1F was infected with phage Clew-1 for 2 hr. The number of insertions in the output pool was plotted against the ratio of the output and input pool. (B) Similar TnSeq analysis as in (A) but using PAO1F ∆fliF2. (C) Efficiency of plating analysis on ∆fliF2 ∆pslC and ∆fliF2 ∆pslD, Psl biosynthesis mutants, either harboring an empty vector or a complementing plasmid (n=6). Clew-1 values were compared by one-way ANOVA with Šídák’s multiple comparisons test (**p<0.01, n.s. not significant).
-
Figure 2—source data 1
Plating efficiency data for all replicate experiments in panel C.
- https://cdn.elifesciences.org/articles/102352/elife-102352-fig2-data1-v1.zip
Figure 3 with 2 supplements
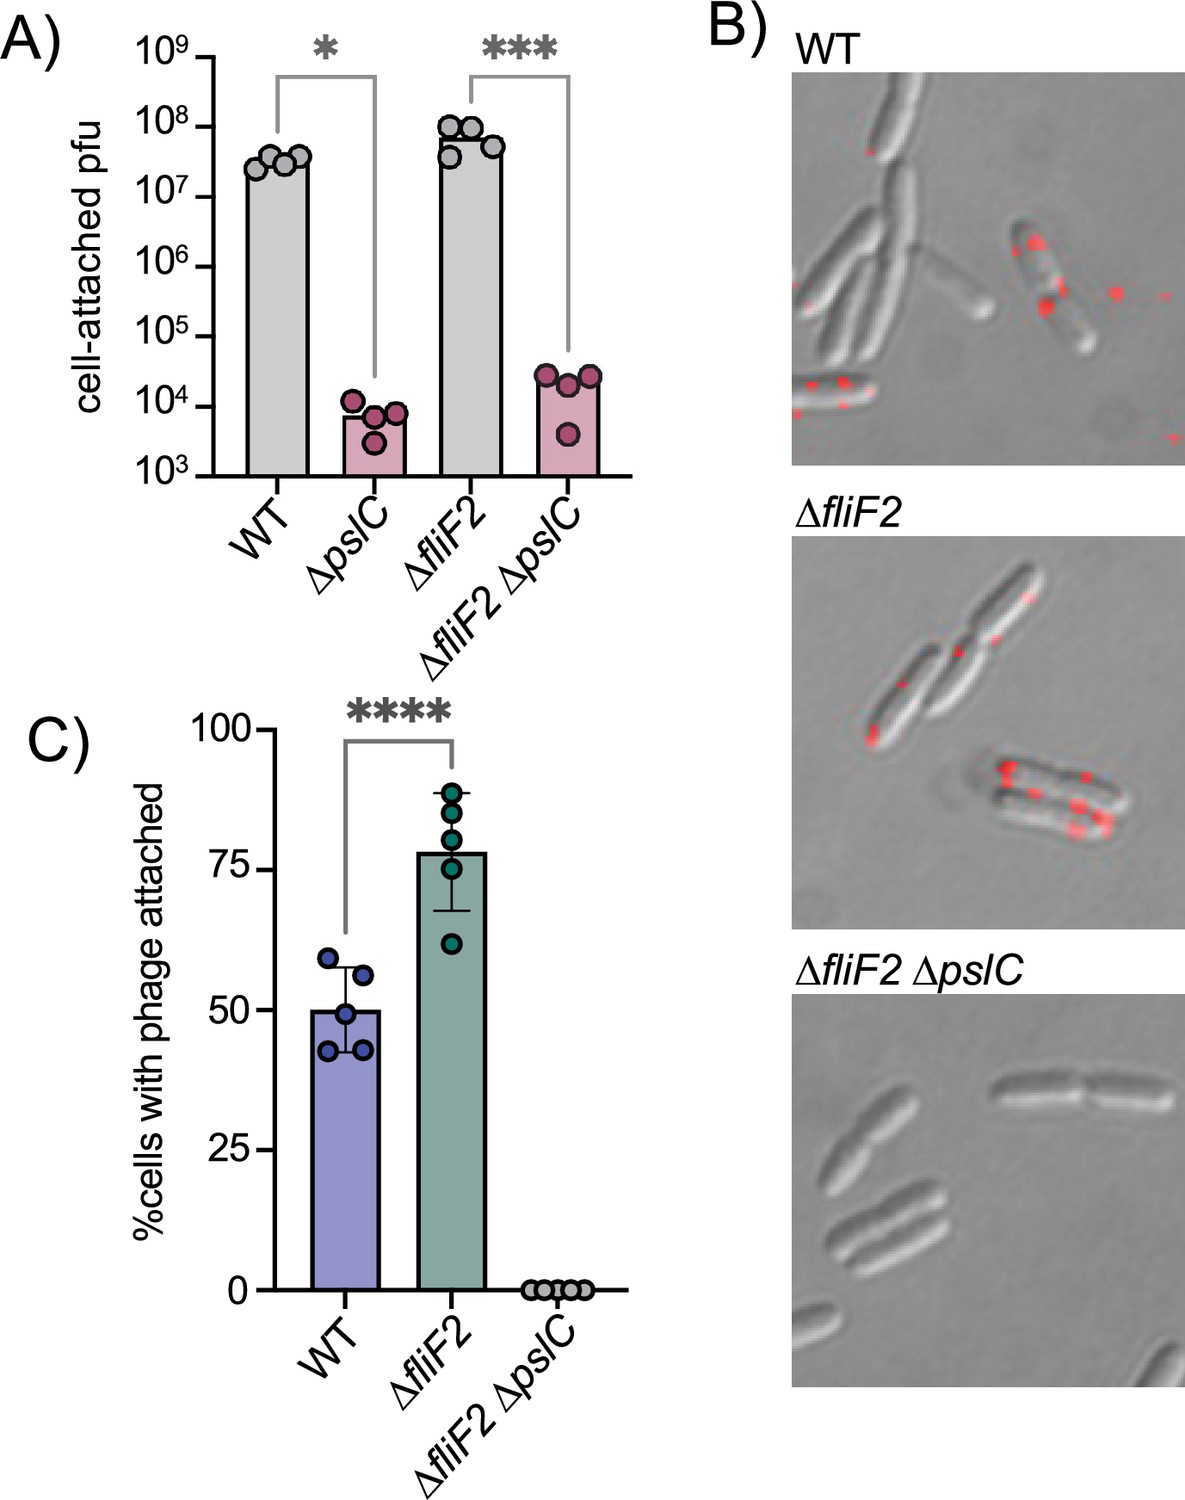
The ∆fliF2 mutation changes the fraction of cells that phage Clew-1 binds to.
(A) Efficiency of center of infection analysis. The indicated strain was infected for 5 min at an MOI of 0.01, the bacteria were pelleted, washed 3x with PBS, then diluted and mixed with an excess of the ∆fliF2 mutant strain, top agar, and plated on an LB agar plate. The number of plaques was used to calculate the number of phages that attached and productively infected the initial strain. (B) Phage Clew-1 was labeled with DyLight594 fluorophores, bound to the indicated wild-type or mutant bacteria (15 min in LB), washed, and fixed with paraformaldehyde. Phages attached to bacteria was imaged by fluorescence microscopy and attachment was quantified over five biological replicates, shown in (C). Attachment was compared by one-way ANOVA with Šídák’s multiple comparisons test. *p<0.05, ***p<0.001,****p<0.0001.
-
Figure 3—source data 1
Efficiency of Center of Infection, viral titer data for all replicate experiments in panel A.
- https://cdn.elifesciences.org/articles/102352/elife-102352-fig3-data1-v1.zip
-
Figure 3—source data 2
Phage attachment data for all replicate experiments shown in panel C.
- https://cdn.elifesciences.org/articles/102352/elife-102352-fig3-data2-v1.zip
Figure 3—figure supplement 1
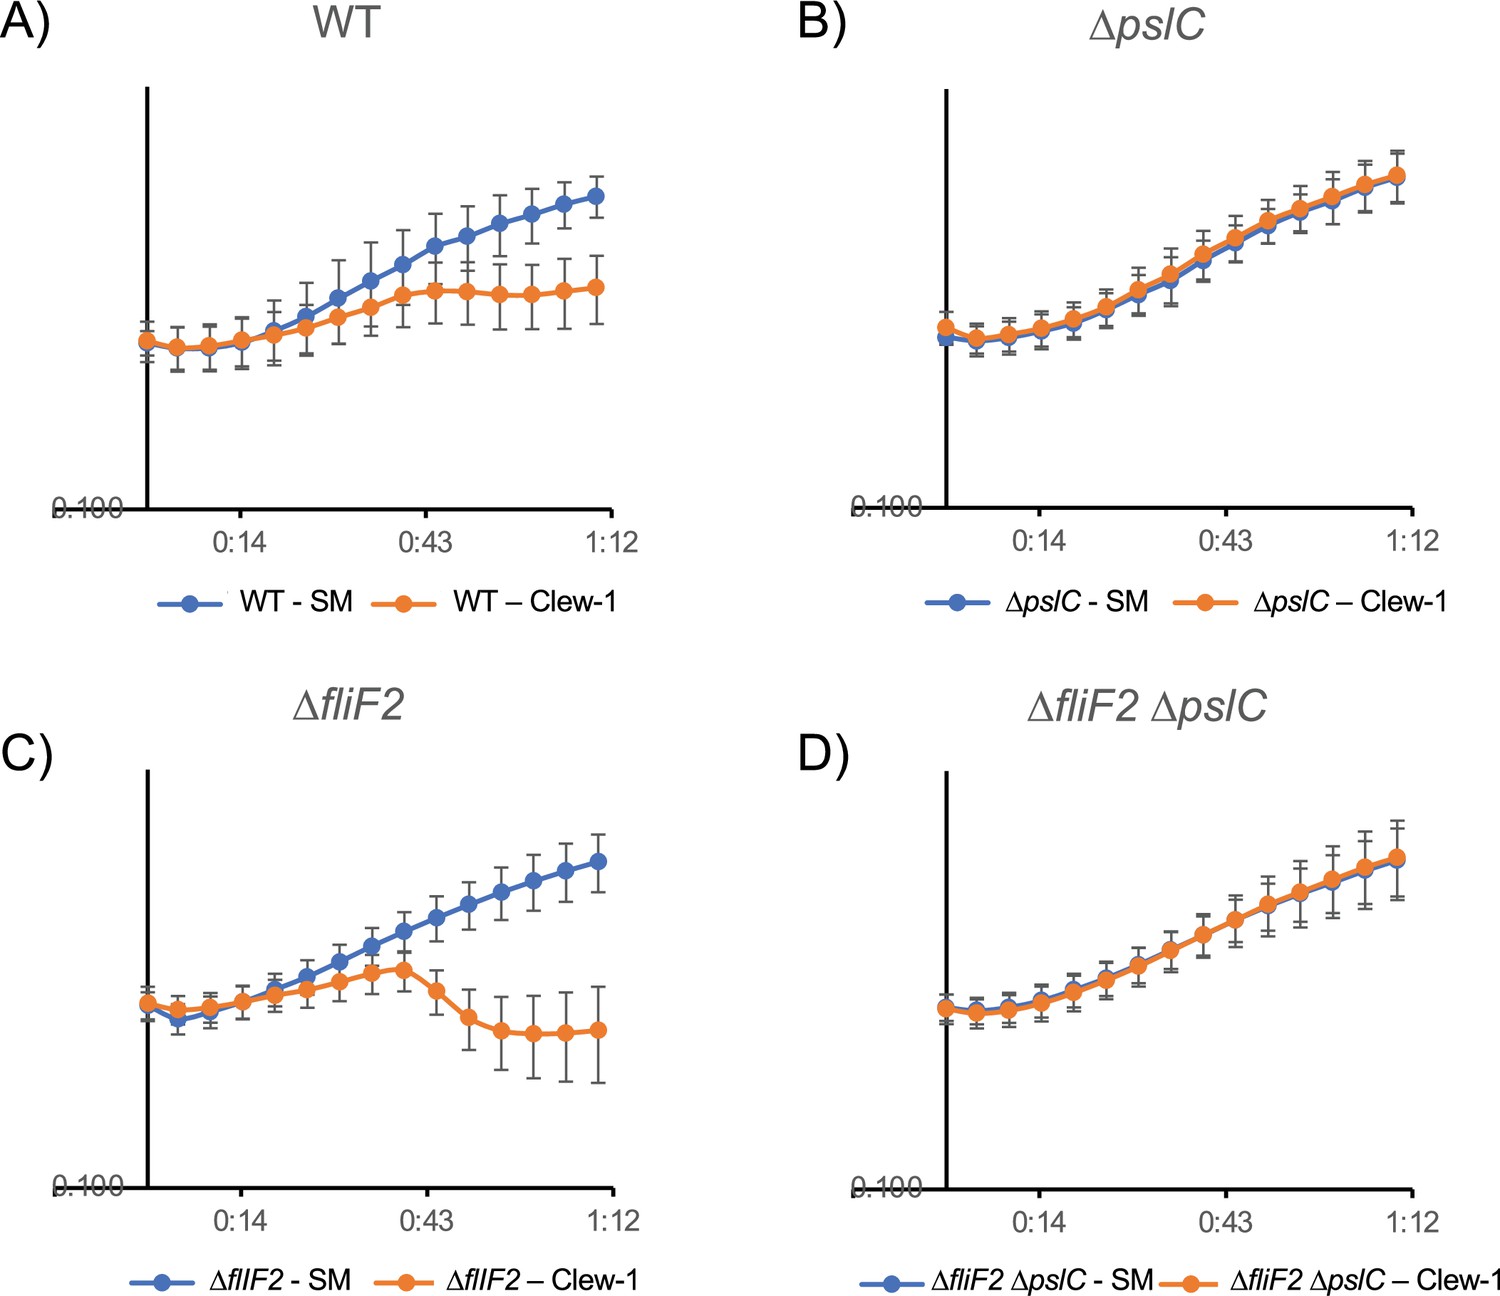
Lysis curves following bacteriophage Clew-1 infection.
Growth of (A) wild-type, (B) ∆pslC mutant, (C) ∆fliF2 mutant, and (D) ∆fliF2 ∆pslC mutant bacteria was followed over time by monitoring the OD600 in a 96-well plate reader. Phage Clew-1 or SM buffer was added at 0 min. Averages of six biological replicates are shown with standard deviations.
Figure 3—figure supplement 2
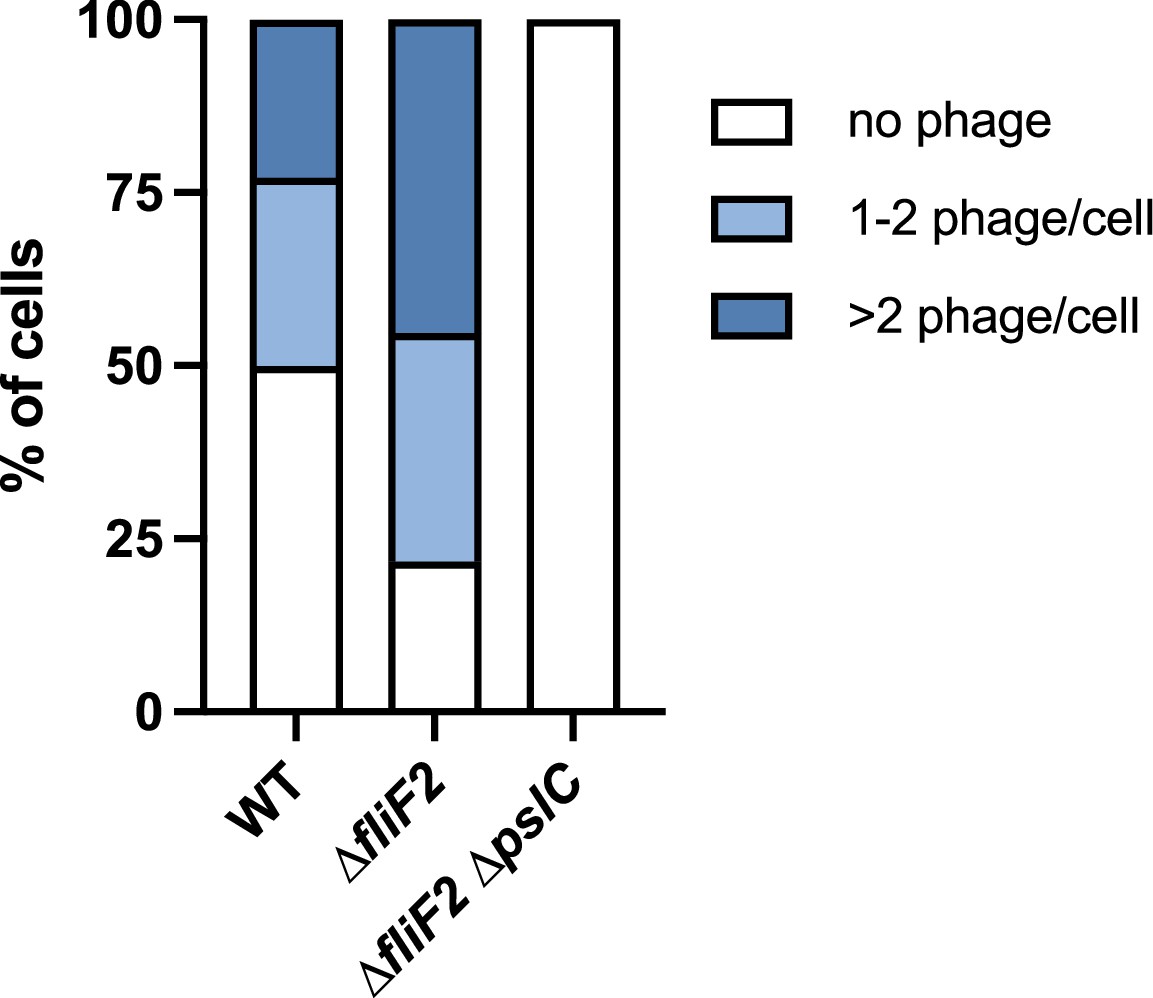
Distribution of phage attached to bacterial cells.
The phage attachment experiments in Figure 3 were further subdivided to distinguish between bacteria harboring no attached Clew-1 phage, 1–2 phages, or more than two phage per cell. The data were analyzed by two-way ANOVA with Šídák’s multiple comparisons test. In comparing wild-type and the ∆fliF2 mutant, both the number of cells without an attached phage and the number of cells with more than two phages attached were significantly different (p<0.001 and p<0.0001, respectively). The difference between the number of cells with 1–2 phages attached did not reach statistical significance.
Figure 4 with 2 supplements
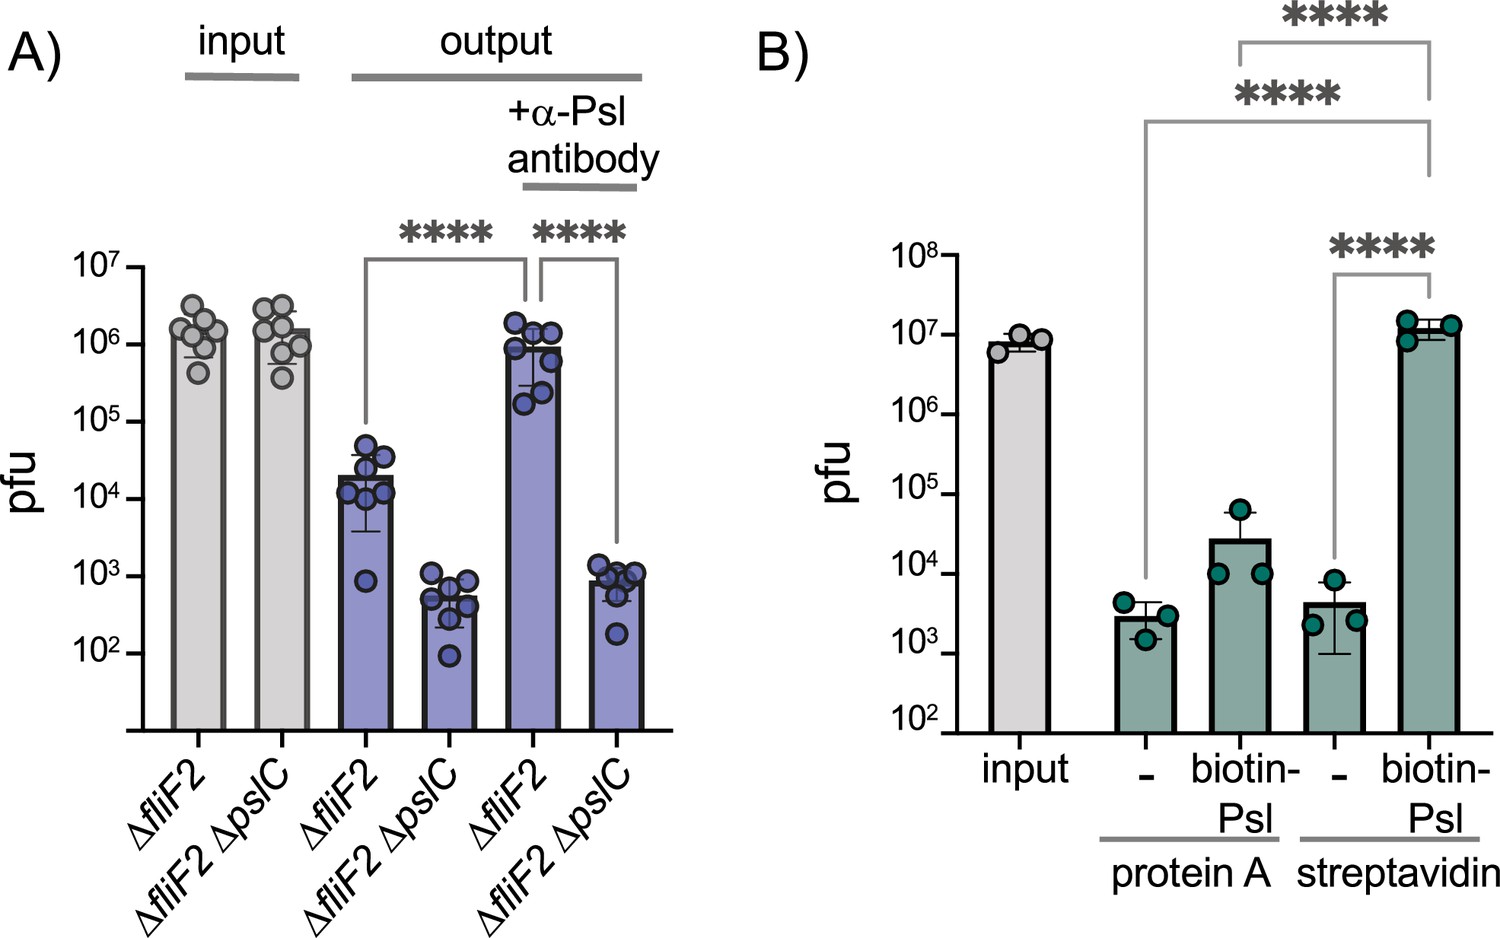
Phage Clew-1 binds to Psl.
(A) Sterile filtered mid-log culture supernatants of PAO1F ∆fliF2 or PAO1F ∆fliF2 ∆pslC were incubated with phage Clew-1, as well as magnetic protein-A beads and, where indicated, a rabbit, anti-Psl antiserum. Beads were collected, washed 3x, and phage in the input and output samples were quantified by qPCR (seven independent replicates). (B) Phage Clew-1 was incubated for 1 hr in SM buffer with affinity-purified, biotinylated Psl (biotin-Psl) and magnetic protein A beads, or magnetic streptavidin beads (SA), where indicated. Beads were collected and washed 3x, and phage in the input and output samples were quantified by qPCR (three independent replicates). Statistical significance was determined by ANOVA with Sidák post-hoc test (****p<0.0001).
-
Figure 4—source data 1
All replicate data of viral titers (measured by qPCR) in the pull-down experiment in panel A.
- https://cdn.elifesciences.org/articles/102352/elife-102352-fig4-data1-v1.zip
-
Figure 4—source data 2
All replicate data of viral titers (measured by qPCR) in the pull-down experiment in panel B.
- https://cdn.elifesciences.org/articles/102352/elife-102352-fig4-data2-v1.zip
Figure 4—figure supplement 1

Phage Clew-1 binds to partially purified, cell-associated Psl.
Where indicated, Phage Clew-1 was incubated for 1 hr in SM buffer with partially purified, cell-associated Psl (cPsl) and/or an anti-Psl antibody (AB). After 1 hr, magnetic protein-A beads were added and incubated for another 30 min on ice with occasional vortexing. Beads were collected and washed 3x, and phage in the input and output samples was quantified by qPCR (three independent replicates). Statistical significance was determined by ANOVA with Sidák post-hoc test (*p<0.05).
Figure 4—figure supplement 2

Phage Clew-1 does not degrade Psl.
Cell-free culture supernatants of PAO1F ∆fliF2 or PAO1F ∆fliF2 ∆pslC were incubated with 10^7 pfu of phage Clew-1 for 1 hr at 37°C (conditions that allow for phage binding and infection of P. aeruginosa). After the incubation, 2 µL spots of the Psl+/∆psl supernatants were spotted onto a nitrocellulose membrane, along with a 1/4 and 1/16 dilution, dried, and Psl was detected using an anti-Psl antiserum. The data are representative of three biological replicates.
Figure 5 with 1 supplement
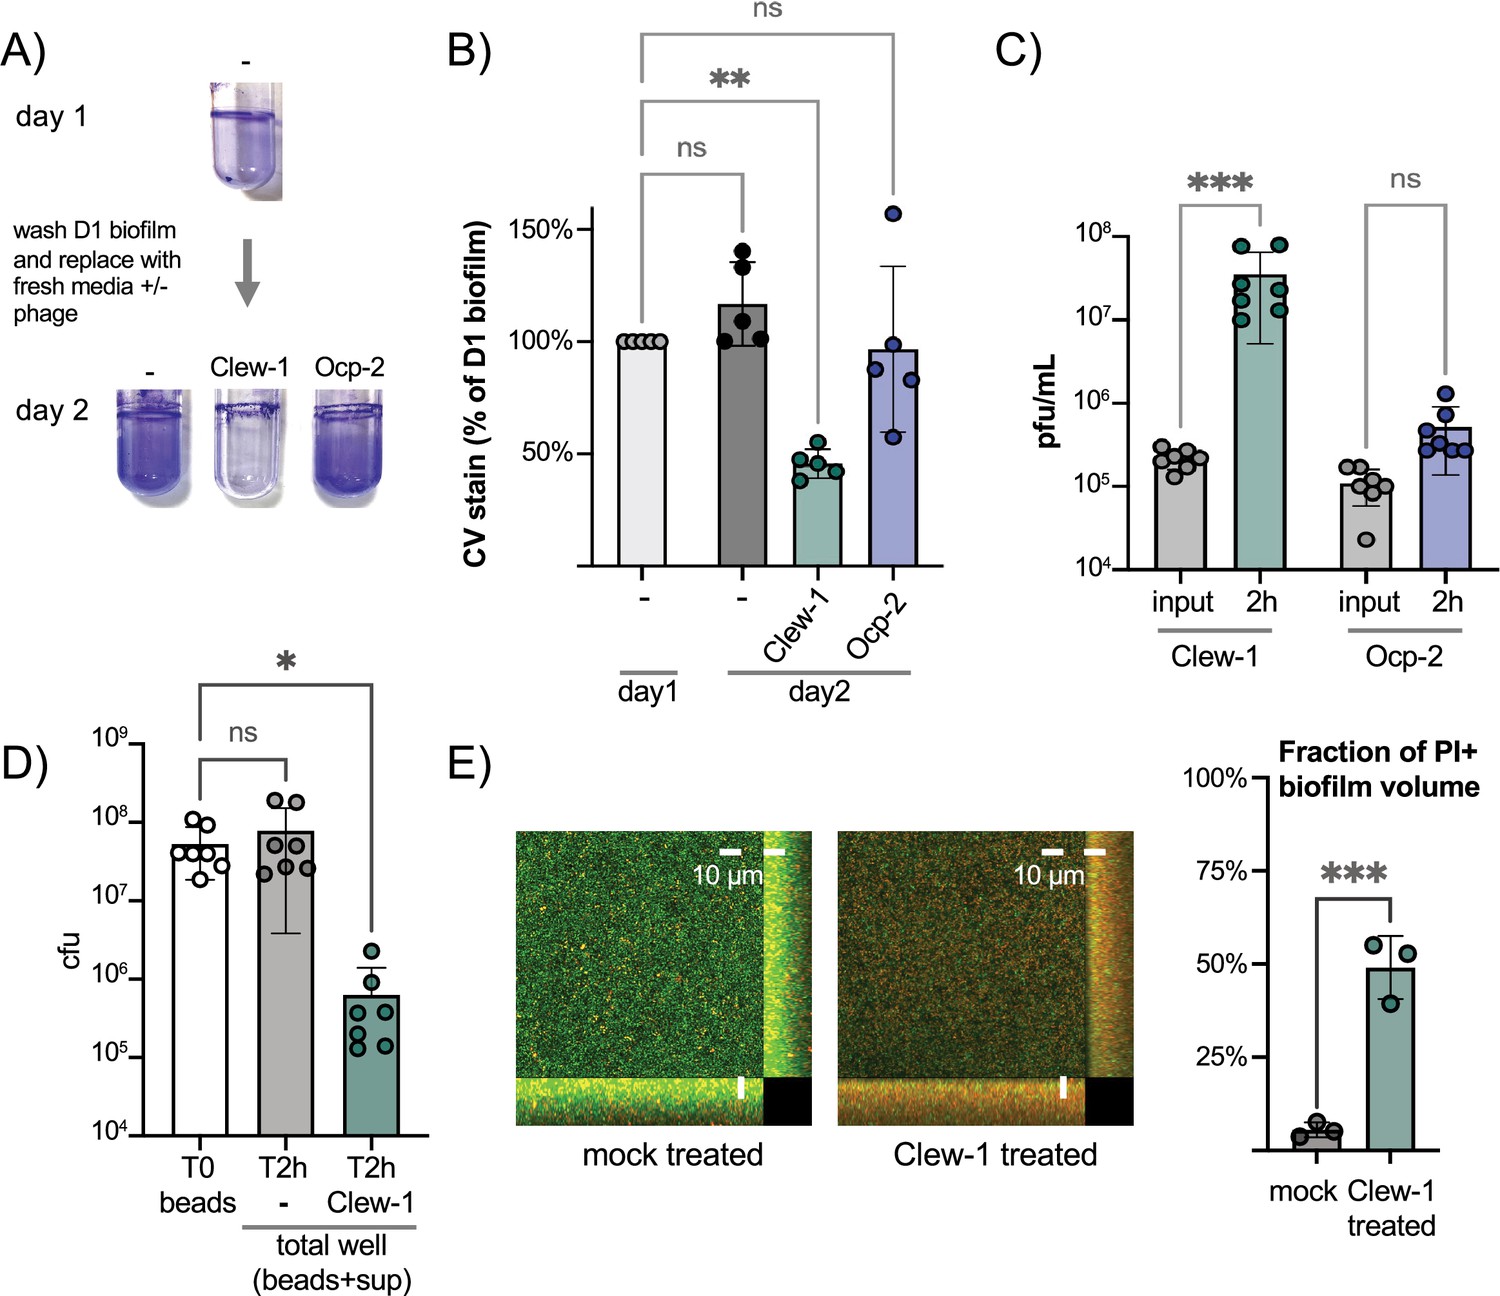
Phage Clew-1 can infect P. aeruginosa in biofilms.
(A) Biofilms of wild-type P. aeruginosa PAO1F were established overnight in 5 mL culture tubes (1 mL culture), the tubes were washed with PBS and 1.2 mL LB, LB with 10^10 pfu phage Clew-1, or LB with 10^10 pfu phage Ocp-2 were added back to each tube (one was fixed with EtOH to represent the 1-day-old biofilm). The following day all biofilms were washed with PBS and stained with crystal violet. (B) PAO1F biofilms were established overnight in a 96-well plate (150 µL of culture, six technical replicates/condition), washed, and incubated overnight with 200 µL of LB or LB with 10^9 pfu bacteriophage Clew-1 or Ocp-2. The biofilms were then washed, fixed, and stained with crystal violet, which was then quantified spectrophotometrically. The day 1 controls were set to 100% (five biological replicates). (C) Growth of phage Clew-1 or Ocp-2 was assayed by establishing a static biofilm in 5 mL culture tubes overnight. The biofilms were washed with PBS, then LB with 10^5 pfu/mL of phage Clew-1 or Ocp-2 was added back. Biofilms were incubated at 37°C for 2 hr 15 min, the culture supernatants were filter sterilized, and input and output phage concentrations were titered (6 biological replicates). (D) Wild-type PAO1 biofilms were grown overnight, with agitation, on 6 mm polystyrene beads. Biofilms were rinsed with PBS and incubated with LB or LB with 10^9 pfu Clew-1 for 2 hr. The sum of bead-associated and supernatant CFU was titered at the 2 hr mark and compared to the bead-associated biofilm input (T0) to assess total viable CFU (seven biological replicates). (E) Biofilms were grown overnight in 8-well slides, at which point the LIVE/DEAD stain dyes, Syto 9 and propidium iodide were added, either on their own (mock) or in the presence of Clew-1. After another 24 hr of incubation, biofilms were imaged by confocal microscopy. Maximum intensity projections of the collected Z-stacks for one replicate are shown, along with YZ and XZ projections to the right and bottom of the image, respectively. The fraction of the total biofilm volume in the image stack that is propidium iodide positive was determined using BiofilmQ (three biological replicates). Statistical significance was determined by ANOVA with Šídák’s multiple comparisons test, except for panel (E), where a two-tailed, unpaired t-test was applied (*p<0.05, **p<0.01, ***p<0.001).
-
Figure 5—source data 1
Replicate data for biofilm biomass as measured by crystal violet retention, shown in panel B.
- https://cdn.elifesciences.org/articles/102352/elife-102352-fig5-data1-v1.zip
-
Figure 5—source data 2
Replicate data for viral titers grown on biofilms, shown in panel C.
- https://cdn.elifesciences.org/articles/102352/elife-102352-fig5-data2-v1.zip
-
Figure 5—source data 3
Replicate data for bacterial titers after phage treatment of biofilms, shown in panel D.
- https://cdn.elifesciences.org/articles/102352/elife-102352-fig5-data3-v1.zip
-
Figure 5—source data 4
Replicate data of the fraction of the biofilm biovolume that stains positive for propidium iodide, shown in panel E.
- https://cdn.elifesciences.org/articles/102352/elife-102352-fig5-data4-v1.zip
Figure 5—figure supplement 1

P. aeruginosa PA14 biofilms are insensitive to phage Clew-1.
P. aeruginosa PA14 biofilms were established overnight in a 96-well plate (150 µL of culture, six technical replicates/condition), washed and incubated overnight with 200 µL of LB or LB with 10^9 pfu bacteriophage Clew-1. The biofilms were then washed 3x with PBS, fixed with EtOH, dried, and stained with a 0.1% crystal violet solution. The stained biofilms were washed 3x with water, and the remaining crystal violet was solubilized with 30% acetic acid. Crystal violet levels were measured spectrophotometrically at 590 nm and the untreated controls were set to 100%. Data from three biological replicates is shown.
Figure 6
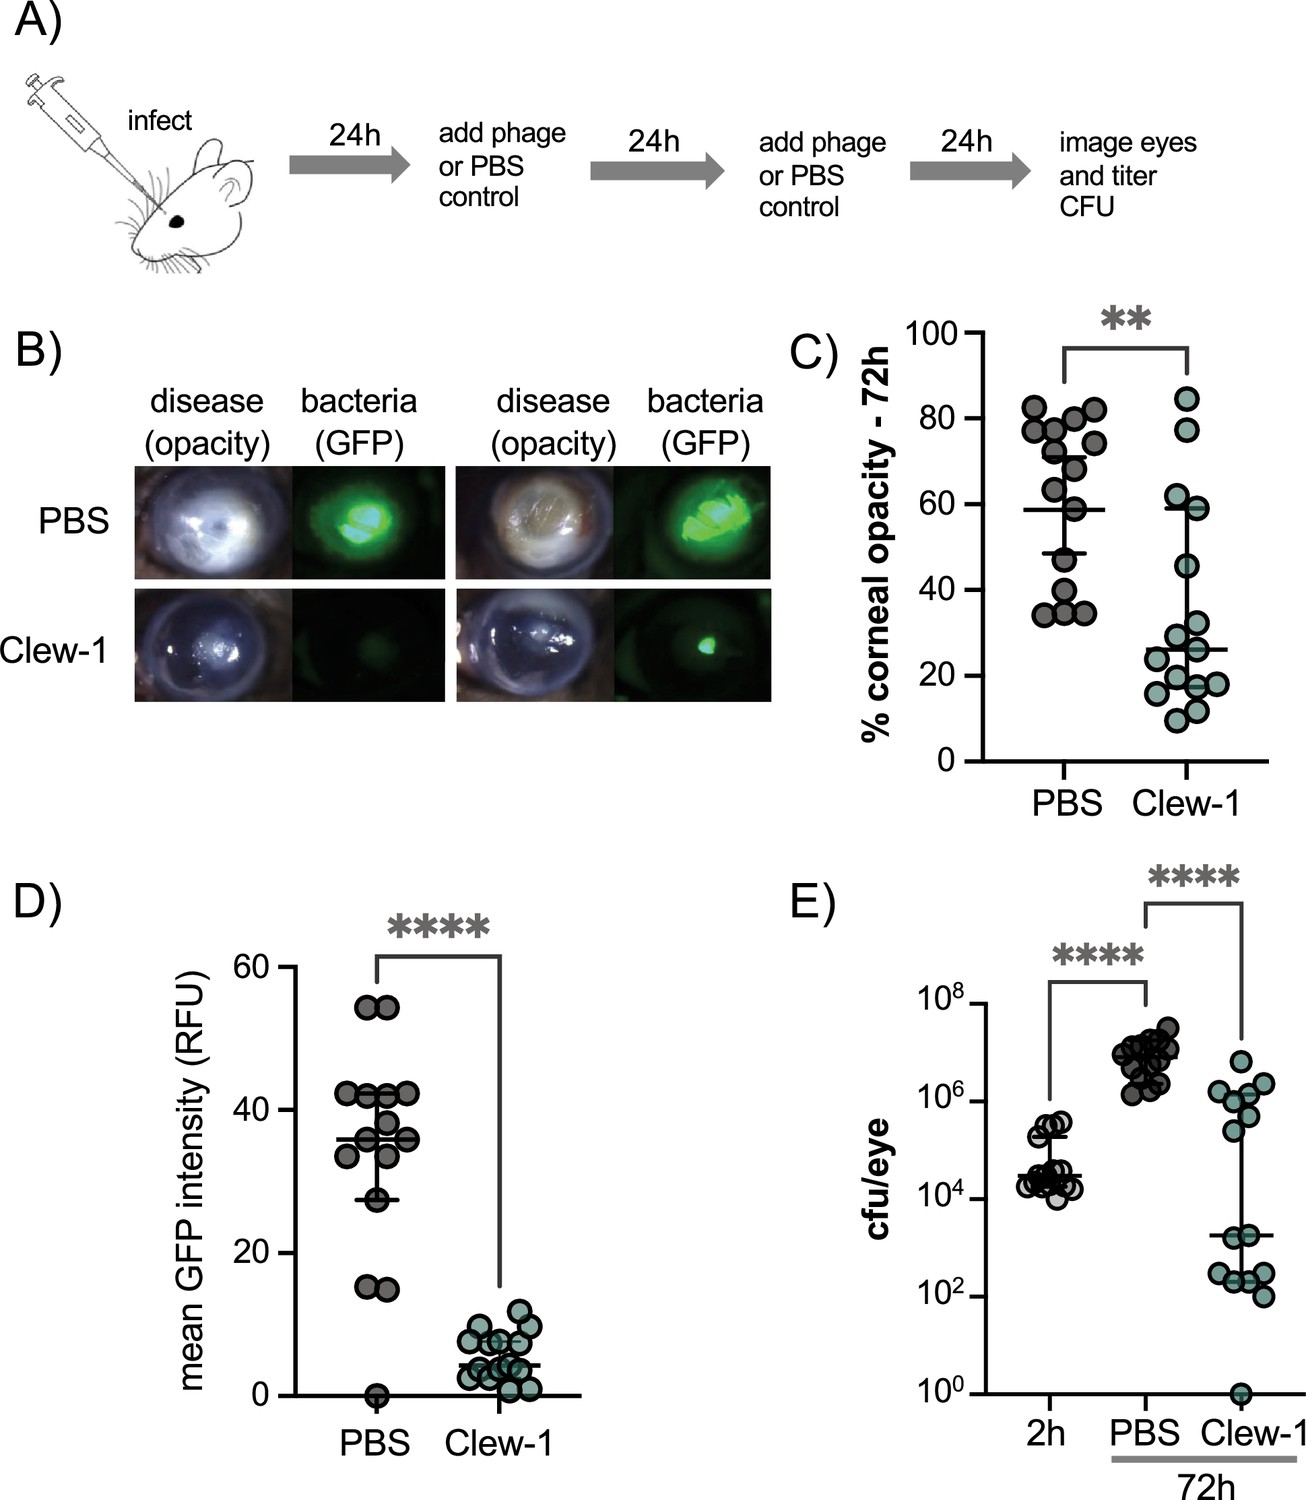
Phage Clew-1 reduces the bacterial burden in a mouse cornea model of infection.
(A) Mouse corneas were abraded and infected with 5*10^4 cfu strain PAO1F/pP25-GFPo, which produces GFP constitutively. Infected corneas were treated with 2*10^9 pfu phage Clew-1 or a PBS control at 24 hr and 48 hr post-infection. (B) At 72 hr post-infection, the corneas were imaged by confocal microscopy to estimate the opacity (driven largely by the infiltration of neutrophils) and GFP fluorescence (produced by infecting P. aeruginosa). Representative images are shown in (B). Opacity and GFP fluorescence were quantified by image analysis and are graphed in (C) and (D), respectively. (E) Eyes were also homogenized and plated for CFU to determine the total bacterial burden at the end of the experiment. Significance was determined by Mann-Whitney test (C, D) or ANOVA with Kruskal-Wallis post-hoc test (E) (**p<0.01, ****p<0.0001).
-
Figure 6—source data 1
Replicate data for corneal opacity, shown in panel C.
- https://cdn.elifesciences.org/articles/102352/elife-102352-fig6-data1-v1.zip
-
Figure 6—source data 2
Replicate data for GFP fluorescence in infected corneas shown in panel D.
- https://cdn.elifesciences.org/articles/102352/elife-102352-fig6-data2-v1.zip
-
Figure 6—source data 3
Replicate data for colony forming units recovered from infected corneas shown in panel E.
- https://cdn.elifesciences.org/articles/102352/elife-102352-fig6-data3-v1.zip
Tables
Appendix 1—key resources table
| Reagent type (species) or resource | Designation | Source or reference | Identifiers | Additional information |
|---|---|---|---|---|
| Strain, strain background (P. aeruginosa) | PAO1F | Bleves et al., 2005 | Wild type parent | |
| Strain, strain background (Bruynoghevirus) | Clew-1 | this publication, Genbank | PQ790658.1 | Bruynoghevirus, Cleveland wastewater treatment plant |
| Strain, strain background (Pbunavirus) | Ocp-2 | this publication, Genbank | PQ790662.1 | Pbunavirus, Cleveland wastewater treatment plant |
| Recombinant DNA reagent | pEXG2 | Rietsch et al., 2005 | allelic exchange vector, colE1 origin, oriT, gentR, sacB | |
| Recombinant DNA reagent | pPSV37 | Lee et al., 2010 | colE1 origin, gentR, PA origin, oriT, placUV5 promoter, lacIq | |
| Chemical compound, drug | Dylight594 NHS-ester | Invitrogen | 46413 | Amine-reactive abelling reagent for phage |
| Chemical compound, drug | Polystyrene beads | Precision Plastic Ball Company | 6 mm diameter, hollow polystyrene | |
| Chemical compound, drug | Filmtracer LIVE/DEAD Biofilm Viability Kit | Invitrogen | L10316 | Biofilm viability stain |
| Strain, strain background (Mus musculus) | C57BL/6 J | Jackson Laboratories | IMSR_JAX:000664 | Host for animal experiments |
| Software | BioflmQ | Hartmann et al., 2021 | MatLab program for biofilm analysis | |
| Software | Prism | Graphpad | RRID:SCR_002798 | Statistical analysis software |
| Antibody | Rabbit anti-Psl antibody | Byrd et al., 2009 | Used for Psl immunoprecipitation | |
| Antibody | Humanized anti-Psl antibody | AstraZeneca | Cam-003 RRID:AB_3111529 | Used for Psl affinity purification |
| Chemical compound, drug | Affinity purified Psl | This study | Purification is described in the methods section |
Additional files
-
Supplementary file 1
Table S1. Strains and Plasmids.
Strains and Plasmids.
- https://cdn.elifesciences.org/articles/102352/elife-102352-supp1-v1.docx
-
Supplementary file 2
Table S2. Primers used in this study.
Primers.
- https://cdn.elifesciences.org/articles/102352/elife-102352-supp2-v1.docx
-
Supplementary file 3
Table S3. TnSeq data.
TnSeq data.
- https://cdn.elifesciences.org/articles/102352/elife-102352-supp3-v1.csv
-
MDAR checklist
- https://cdn.elifesciences.org/articles/102352/elife-102352-mdarchecklist1-v1.pdf
Download links
A two-part list of links to download the article, or parts of the article, in various formats.
Downloads (link to download the article as PDF)
Open citations (links to open the citations from this article in various online reference manager services)
Cite this article (links to download the citations from this article in formats compatible with various reference manager tools)
A biofilm-tropic Pseudomonas aeruginosa bacteriophage uses the exopolysaccharide Psl as receptor
eLife 13:RP102352.
https://doi.org/10.7554/eLife.102352.3


