An increase in reactive oxygen species underlies neonatal cerebellum repair
- Developmental Biology Program, Sloan Kettering Institute, United States
- Gurdon Institute, Cambridge University, United Kingdom
- Department of Physiology, Development and Neuroscience, Cambridge University, United Kingdom
- Center for Epigenetics Research, Memorial Sloan Kettering Cancer Center, United States
- Biochemistry, Cell and Molecular Biology Program and Neuroscience Program, Weill Cornell Graduate School of Medical Sciences, United States
Figures
Figure 1 with 2 supplements
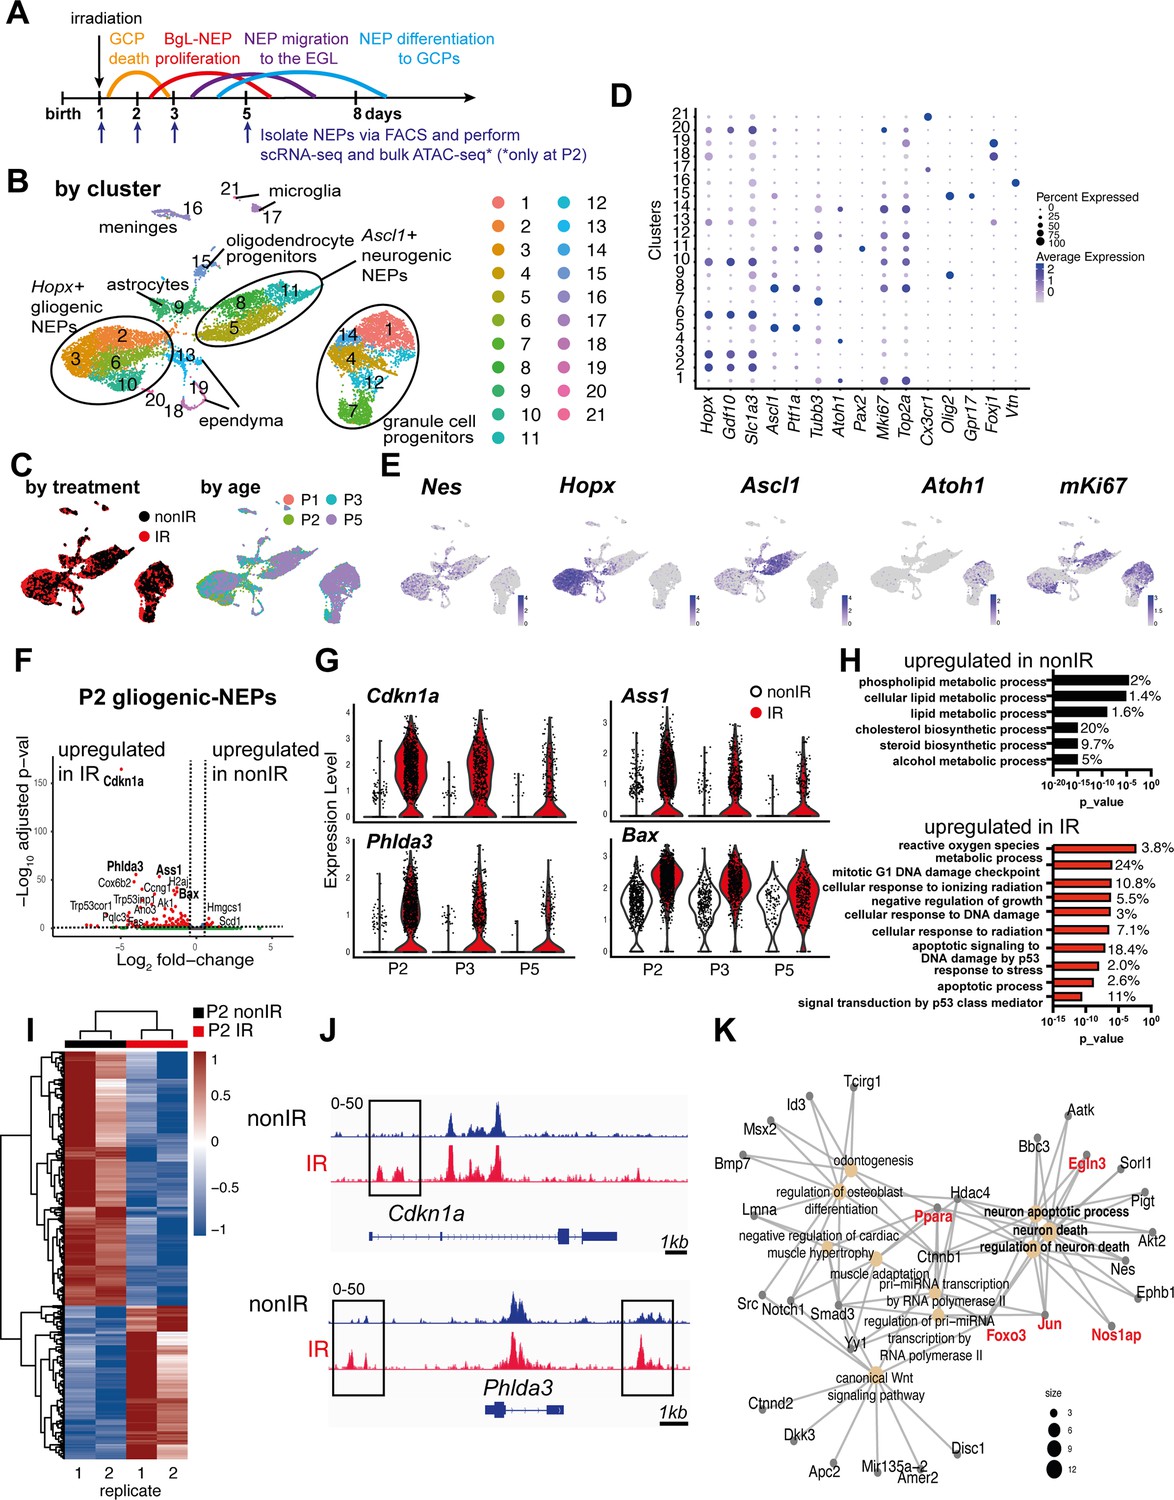
Injury induces reactive oxygen species (ROS) and cell stress signaling reflected by changes in the transcriptome and chromatin landscape of progenitors.
(A) Schematic summarizing the experimental plan. (B–C) UMAPs of 11,878 cells (6978 nonIR and 4900 IR) showing cluster annotations (B), treatment (black: nonIR, red: IR), and the age of the samples (red: P1, green: P2, blue: P3, purple: P5) (C). (D) Dot plot showing the expression levels of key marker genes used for cluster annotation (gliogenic-Nestin-expressing progenitors [NEPs]: Hopx, Gdf10, Slc1a3, neurogenic-NEPs: Ascl1, Ptf1a, immature neurons: Pax2, granule cell precursors [GCPs]: Atoh1, postmitotic neurons: Tubb3, microglia: Cx3cr1, oligodendrocyte progenitors: Olig2, oligodendrocytes: Gpr17, ependymal cells: Foxj1). (E) Feature plots showing Nes, Hopx (gliogenic-NEPs), Ascl1 (neurogenic-NEPs), Atoh1 (GCPs), and mKi67 (proliferation) expression highlighting the three main populations of interest. Clusters containing Hopx-NEPs (clusters 2, 3, 6, 10), Ascl1-NEPs (clusters 5, 8, 11), or GCPs (clusters 1, 4, 7, 12, 14) were subsetted from the original dataset and were divided according to age (P2 or P3+P5) for the downstream differential expression analyses. (F) Volcano plot showing differentially expressed genes in the P2 gliogenic-NEPs (red: adjusted p-value≤0.05, log2fold-change>|1|). (G) Violin plots showing some of the top differentially expressed genes in P2 gliogenic-NEPs and how their expression changes over time with respect to their expression in control cells. (H) Some of the significant gene ontology (GO) terms associated with differentially expressed genes in P2 gliogenic-NEPs that were either upregulated in nonIR (top panel) or IR (bottom panel) cells (adjusted p-value≤0.05, Figure 1—source data 2). (I) Heatmap showing differentially open chromatin regions in P2 nonIR and IR NEPs, identified by bulk assay for transposase-accessible chromatin with sequencing (ATAC-seq) (1168 differentially open regions, adjusted p-value<0.05, Figure 1—source data 3). (J) Tracks highlighting the injury-induced open chromatin regions around Cdkn1a and Phlda3, the top differentially expressed genes identified in (F). (K) Linkages between genes and GO terms identified by the ATAC-seq data revealed an active transcriptional network involved in regulating cell death and apoptosis. Genes colored in red (Ppara, Egln3, Foxo3, Jun, and Nos1ap) have been implicated as upregulated with increased ROS levels or involved in ROS signaling.
-
Figure 1—source data 1
Marker genes and all genes expressed by cluster in single-cell RNA-sequencing (scRNA-seq) dataset for irradiated at P1 (IR; P2, P3, P5) or non-irradiated (nonIR; P1, P2, P3, P5).
pct1: % cells in a cluster that express the gene; pct2: % cells that express the gene outside the given cluster.
- https://cdn.elifesciences.org/articles/102515/elife-102515-fig1-data1-v1.xlsx
-
Figure 1—source data 2
Pseudobulk differential expression analysis between nonIR and IR gliogenic-Nestin-expressing progenitors (NEPs) (Hopx+, clusters 2, 3, 6, 10), neurogenic-NEPs (Ascl1+, clusters 5, 8, 11), and granule cell precursors (GCPs) (Atoh1+, clusters 1, 4, 7, 12, 14) at P2, or at P3 and P5 (P3+5).
- https://cdn.elifesciences.org/articles/102515/elife-102515-fig1-data2-v1.xlsx
-
Figure 1—source data 3
Gene ontology (GO) term analyses of differentially expressed genes (Figure 1—source data 2) of nonIR and IR gliogenic-Nestin-expressing progenitors (NEPs) (Hopx+, clusters 2, 3, 6, 10), neurogenic-NEPs (Ascl1+, clusters 5, 8, 11), and granule cell precursors (GCPs) (Atoh1+, clusters 1, 4, 7, 12, 14) at P2, or at P3 and P5 (P3+5).
- https://cdn.elifesciences.org/articles/102515/elife-102515-fig1-data3-v1.xlsx
-
Figure 1—source data 4
Differentially open peaks at P2 identified by bulk assay for transposase-accessible chromatin with sequencing (ATAC-seq) from nonIR and IR Nestin-expressing progenitors (NEPs).
- https://cdn.elifesciences.org/articles/102515/elife-102515-fig1-data4-v1.xls
-
Figure 1—source data 5
Motif analysis of regions with increased accessibility in IR Nestin-expressing progenitors (NEPs) compared to the nonIR at P2.
- https://cdn.elifesciences.org/articles/102515/elife-102515-fig1-data5-v1.xlsx
Figure 1—figure supplement 1
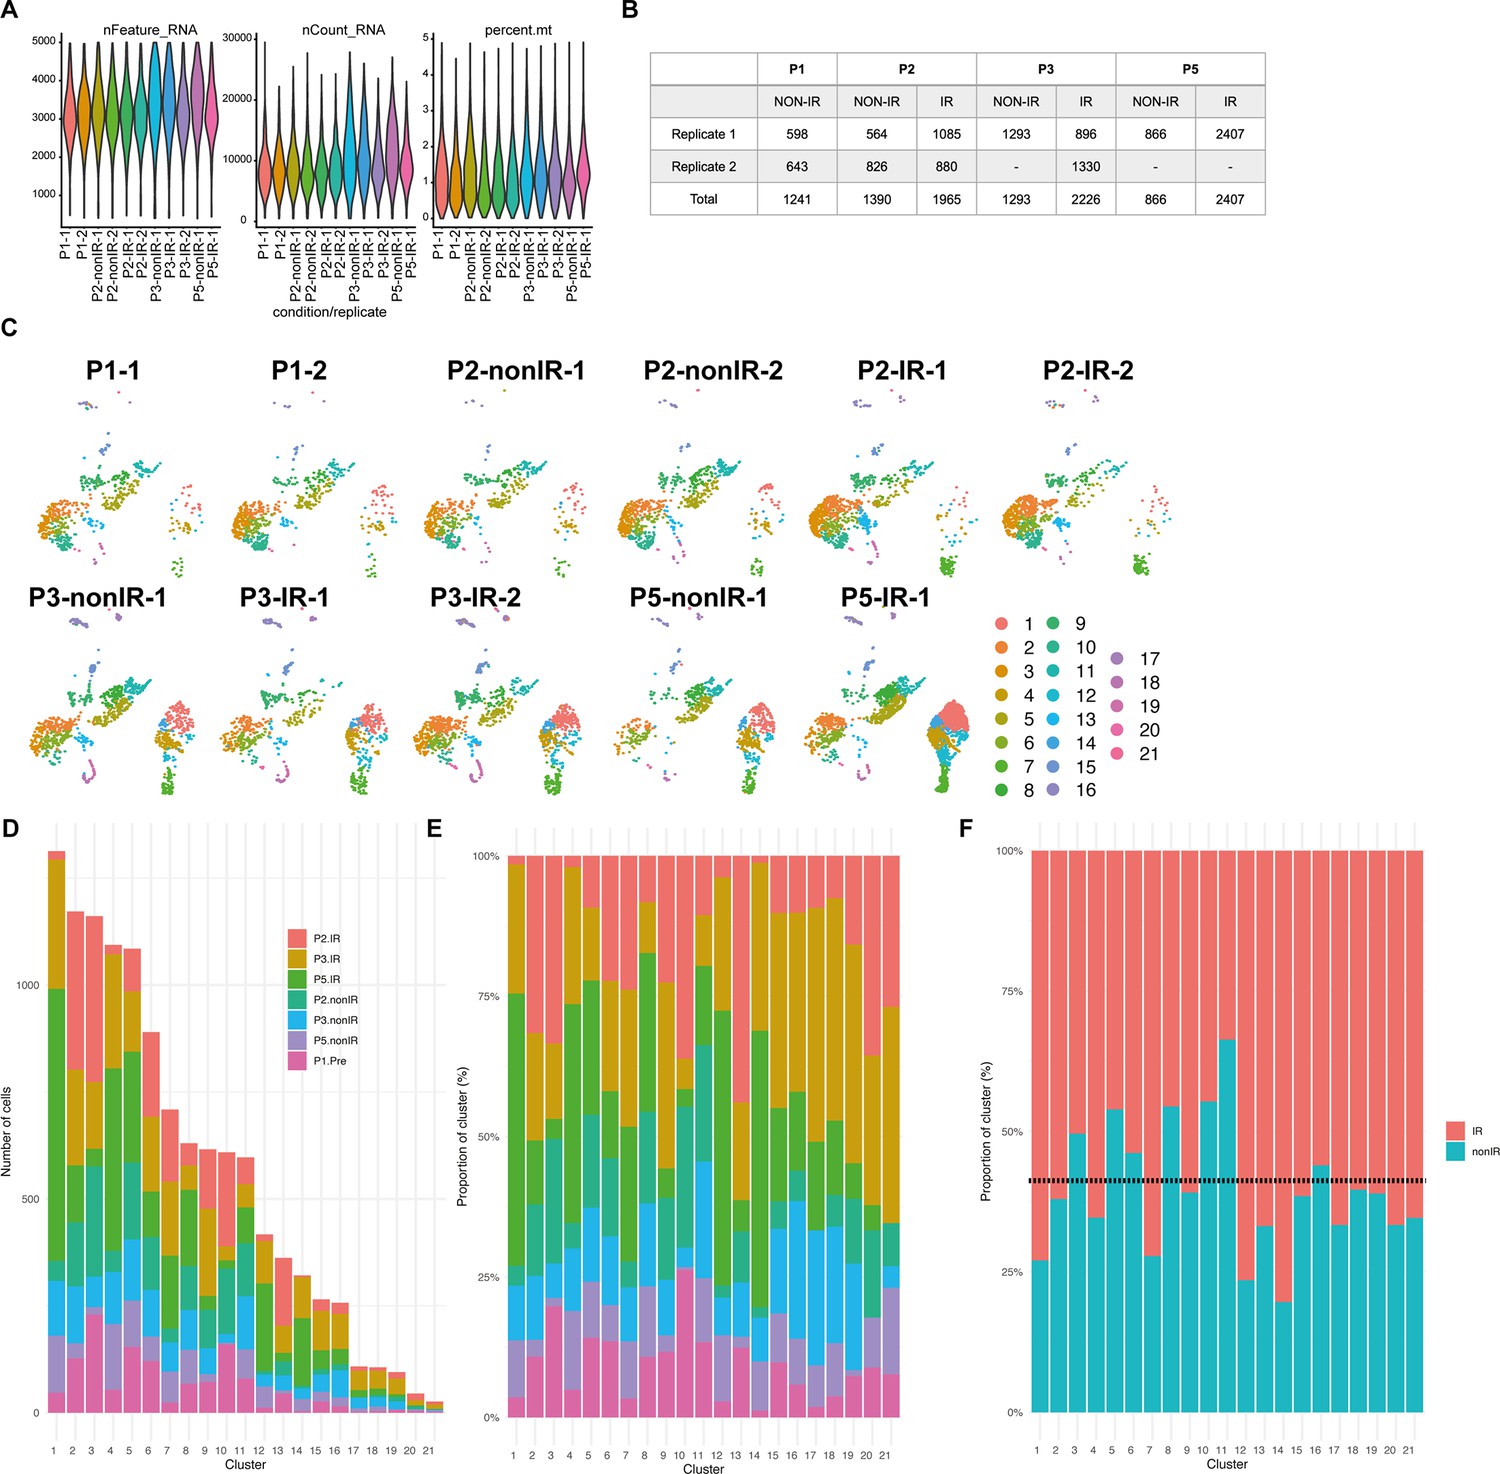
Single-cell RNA-sequencing (scRNA-seq) quality metrics and number of cells sequenced in each condition and biological replicate.
Violin plots showing the number of features, RNA, and percent mitochondrial RNA count across the biological replicates of the scRNA-seq dataset after filtering the bad quality cells (cells were filtered out where number of detected genes was ≤1500, the number of detected transcripts was ≥40,000, and mitochondrial gene percentage ≥5%). Number of cells from each replicate and condition used for downstream analyses after filtering. UMAPs showing the distribution of cells across different clusters based on the samples. (D–E) Number and proportion of cells from different ages and conditions in each cluster. (F) Proportion of total nonIR (including P1) and IR cells in each cluster. Dotted line represents the expected ratio between the nonIR and IR cells.
Figure 1—figure supplement 2
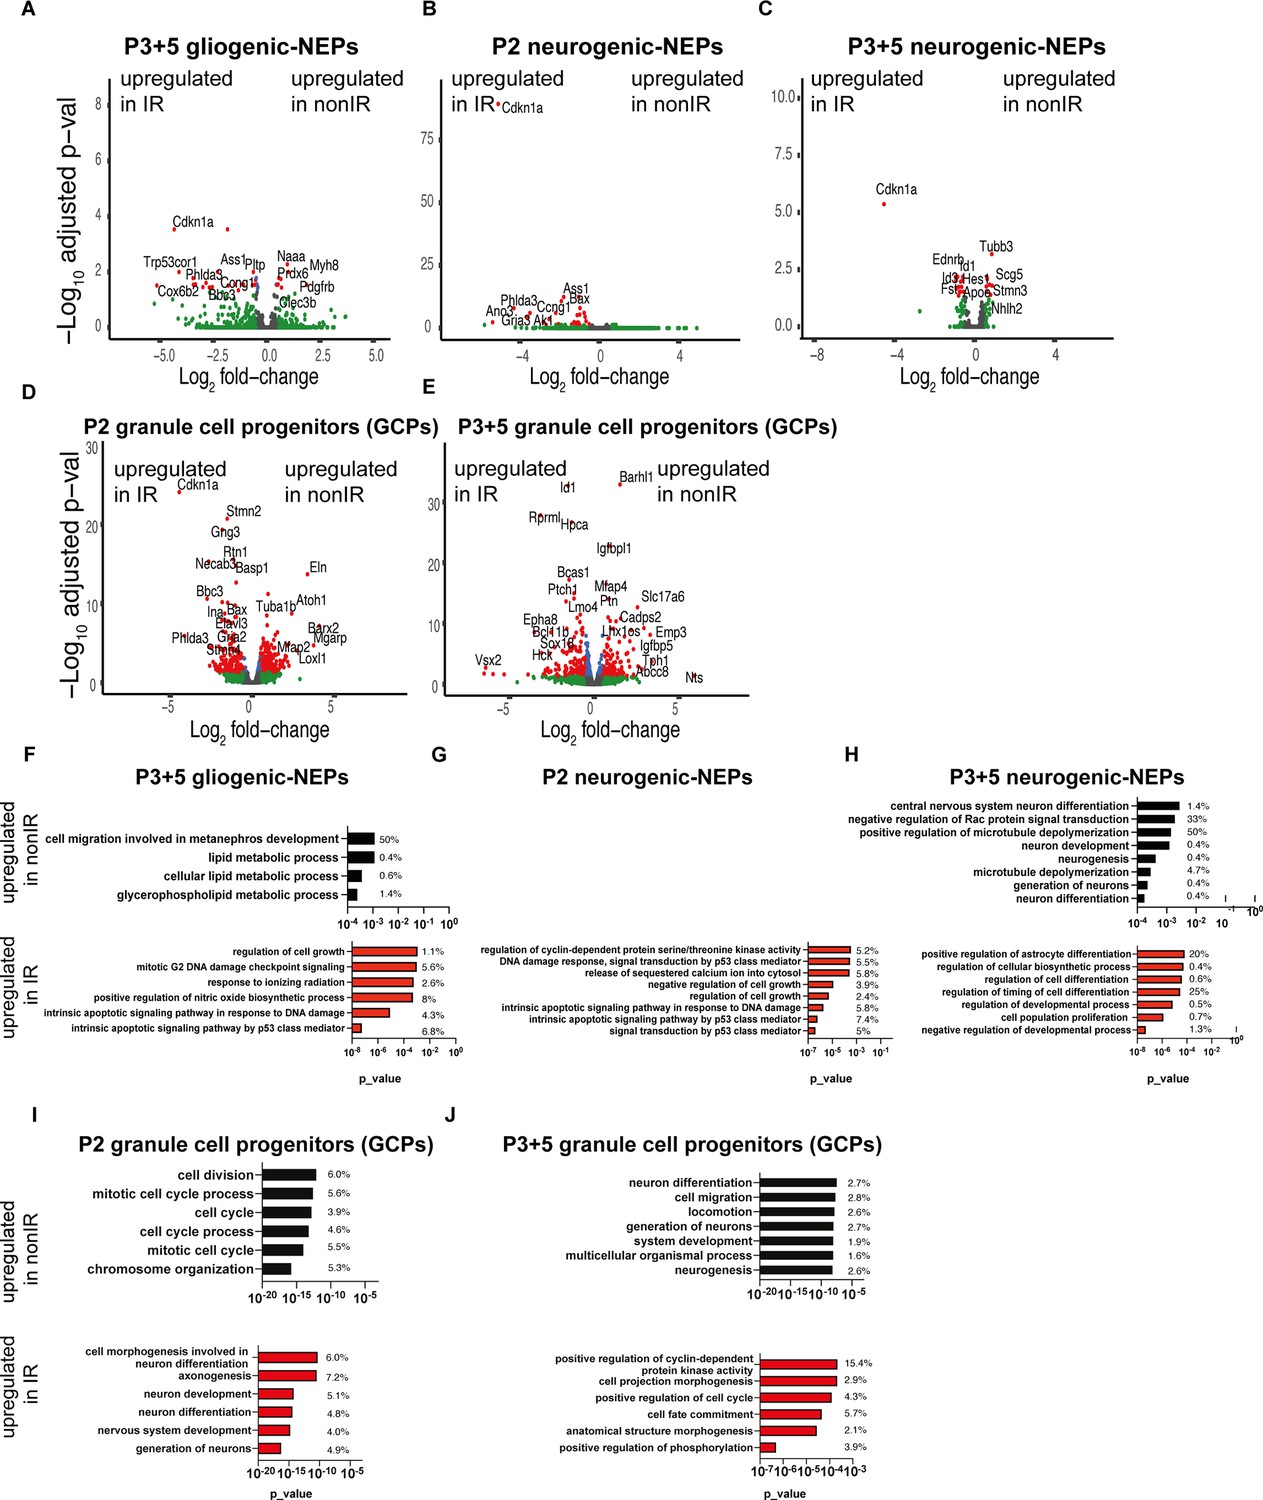
Injury induces distinct transcriptional changes in Nestin-expressing progenitor (NEP) subtypes and granule cell precursors (GCPs) during adaptive reprogramming.
(A–E) Volcano plot showing differentially expressed genes in the P3+5 gliogenic-NEPs (A), P2 and P3+5 neurogenic-NEPs (B, C), and P2 or P3+5 GCPs (D, E) (red: adjusted p-value≤0.05, log2fold-change=1, Figure 1—source data 1). (F–J) Some of the significant gene ontology (GO) terms associated with differentially expressed genes in the P3+5 gliogenic-NEPs (F), P2 or P3 5 neurogenic-NEPs (G, H), and P2 or P3+5 GCPs (I, J) that were either upregulated in nonIR (top panel) or IR (bottom panel) (p-value≤0.05).
Figure 2 with 1 supplement
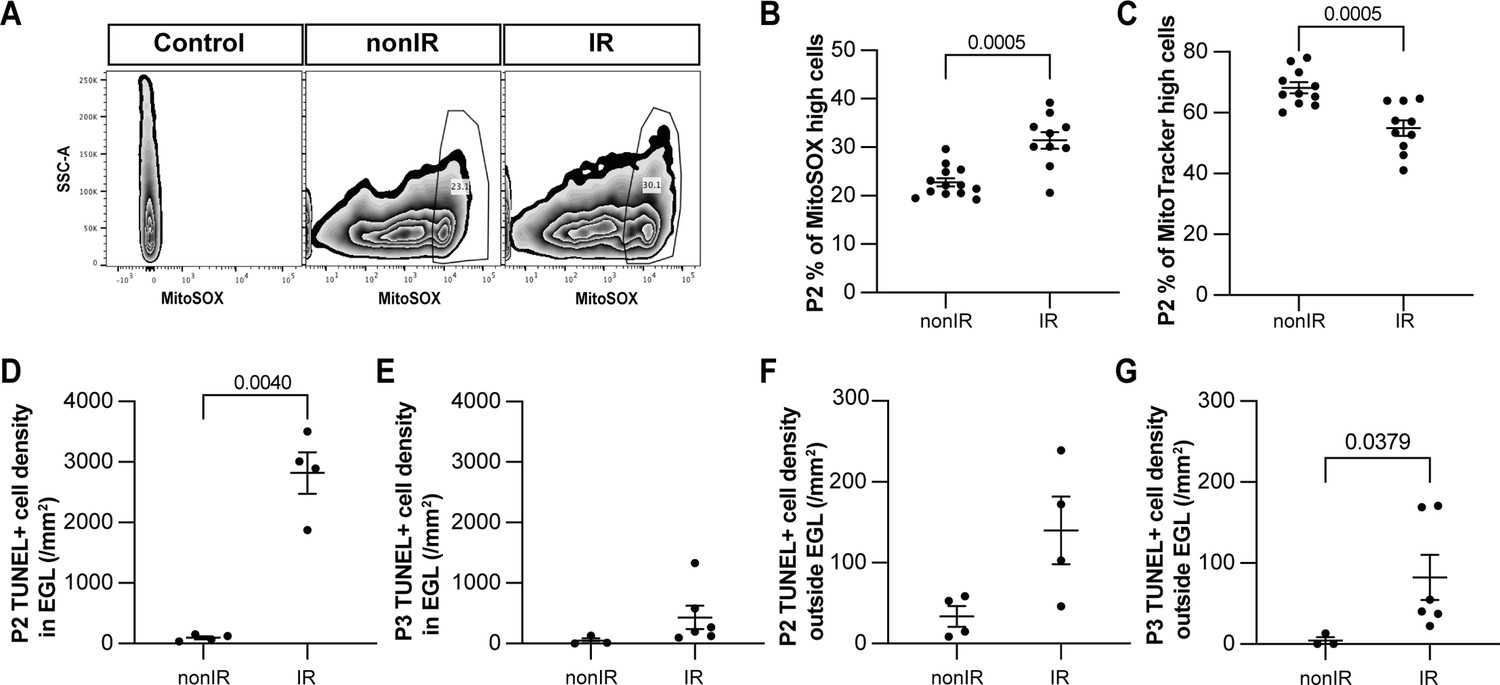
Cerebellar injury at P1 results in increased superoxide production, a reduction in mitochondria, and increased cell death in the external granule layer (EGL) that peaks 24 hr after injury.
(A) Examples of flow cytometry analysis of mitochondrial reactive oxygen species (ROS) at P2 from nonIR and IR cerebella using MitoSOX dye. Gating determined the top 90% MitoSOX signal (MitoSOX high cells). (B, C) Quantification of MitoSOX high (B) and MitoTracker high (C) expression in nonIR and IR cerebella at P2. (D, E) Quantification of TUNEL+ cell density in the EGL at P2 (D) and P3 (E) in lobules 3–5 of nonIR and IR mice. (F, G) Quantification of TUNEL+ cell density outside the EGL at P2 (F) and P3 (G) in lobules 3–5 of nonIR and IR mice. EGL, external granular layer; SSC, side scatter; P, postnatal day; nonIR, non-irradiated; IR, irradiated. All statistical significance was determined using an unpaired t-test, and data are represented as mean ± SEM.
Figure 2—figure supplement 1
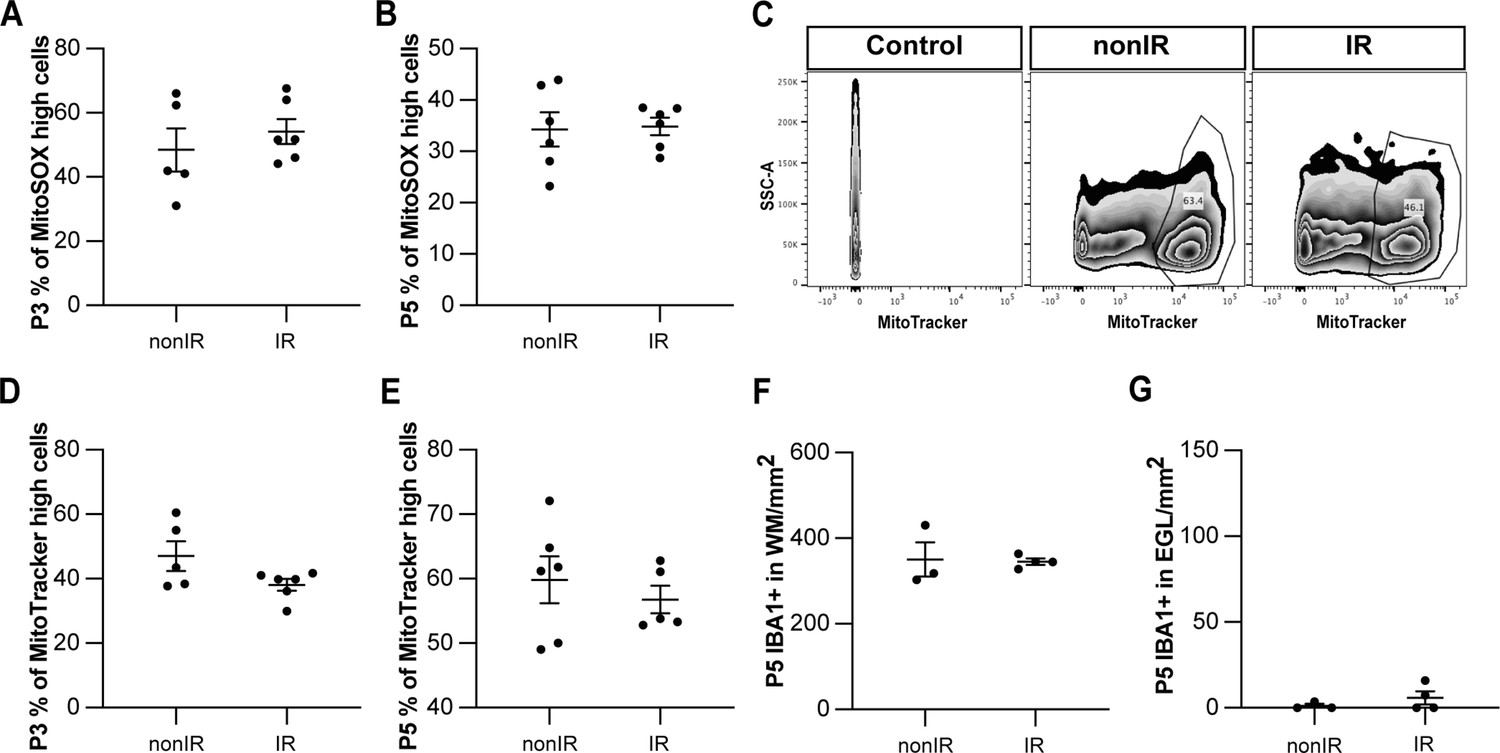
Irradiation of cerebella at P1 results in increased superoxide production and cell death and recruitment of microglia to the EGL that peaks at 24 hr.
(A, B) Quantification of high MitoSOX expression in nonIR and IR cerebella at P3 (A) and P5 (B). (C) Examples of flow cytometry analysis of mitochondria at P2 from nonIR and IR cerebella using MitoTracker dye. Gating determined the top 90% MitoTracker signal (MitoTracker high cells). (D, E) Quantification of MitoTracker high expression in nonIR and IR cerebella at P3 (D) and P5 (E). (F) Quantification of IBA1+ cell density in the WM at P5 in lobules 3–5 of nonIR and IR mice. (G) Quantification of IBA1+ cell density in the EGL at P5 in lobules 3–5 of nonIR and IR mice. EGL, external granular layer; WM, white matter; P, postnatal day; nonIR, non-irradiated; IR, irradiated. All statistical significance was determined using an unpaired t-test, and data are represented as mean ± SEM.
Figure 3
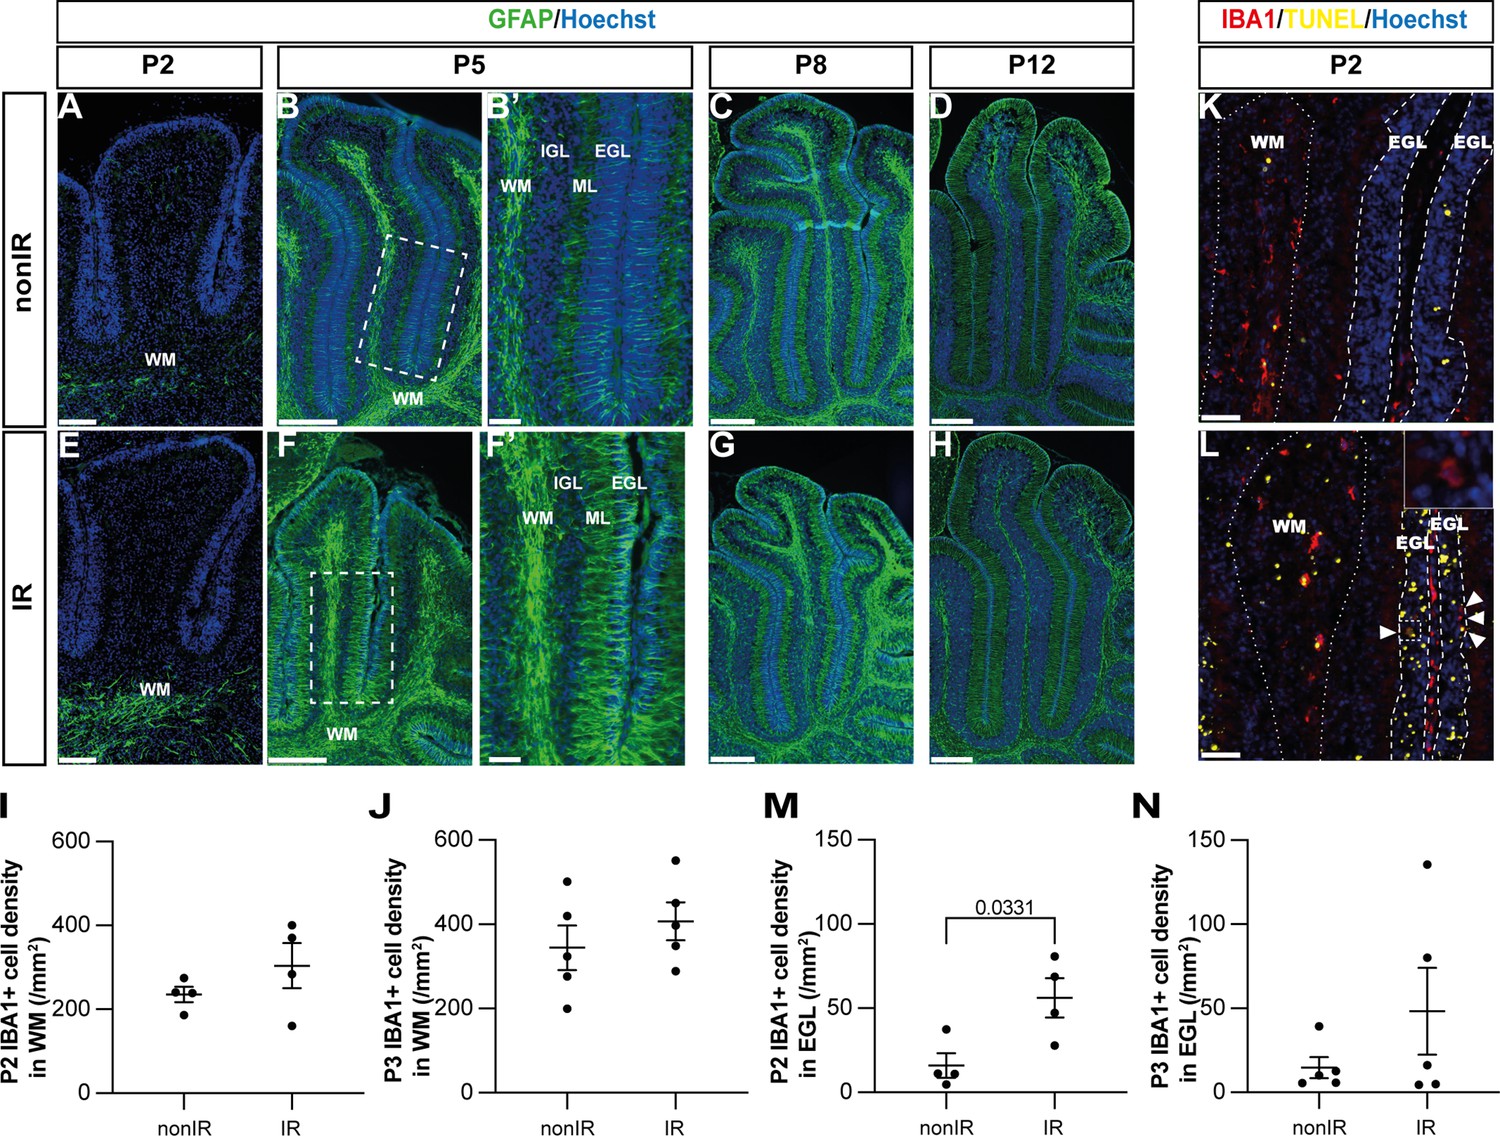
Cerebellar injury at P1 induces transient microglial recruitment to the external granule layer (EGL) and prolonged astroglial microenvironment changes in the cerebellum.
(A–H) Immunohistochemical (IHC) staining of medial sagittal cerebellar sections for GFAP (green) in lobule 4/5 of nonIR and IR cerebellum at the stages indicated. Nuclei were counterstained with Hoechst. (B’) and (F’) show high-power images of white dashed line boxes in (B) and (F), respectively. (I, J) Quantification of IBA1+ cell density in the WM at P2 (I) and P3 (J) in lobules 3–5 of nonIR and IR mice. (K, L) IHC staining of medial sagittal cerebellar sections for IBA1 and TUNEL in lobule 3 of nonIR and IR cerebellum at P2. Nuclei were counterstained with Hoechst. WM and EGL are delineated by white dotted lines and dashed lines, respectively. High-power image in (L) of the area indicated by the white dashed line represents an IBA1+ cell present in the EGL. White arrowheads indicate additional IBA1+ cells in the EGL. (M, N) Quantification of IBA1+ cell density in the EGL at P2 (M) and P3 (N) in lobules 3–5 of nonIR and IR mice. EGL, external granular layer; WM, white matter; P, postnatal day; nonIR, non-irradiated; IR, irradiated. Scale bar: A and E: 100 µm, B, C, D, E, F, G, and H: 250 µm, B’ and F’: 50 µm, I and J: 50 µm. All statistical significance was determined using an unpaired t-test, and data are represented as mean ± SEM.
Figure 4 with 1 supplement
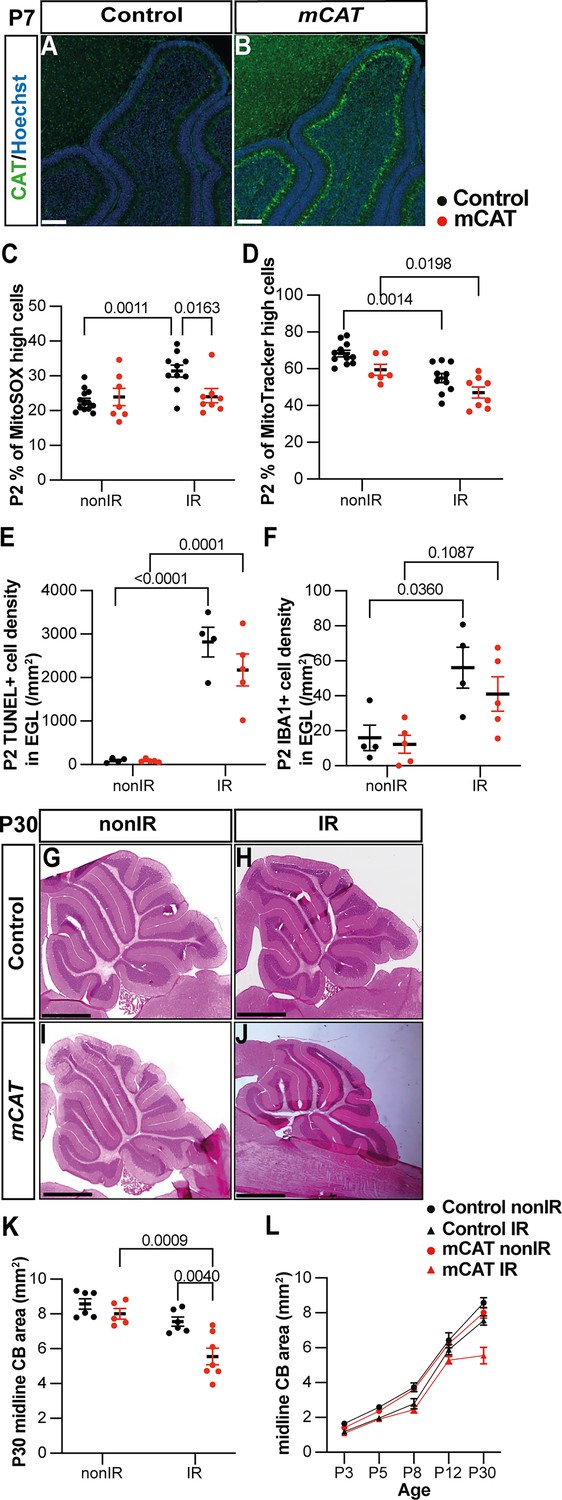
Reduction of reactive oxygen species (ROS) impairs adaptive reprogramming and cerebellar repair.
(A, B) Immunohistochemical (IHC) staining of medial sagittal cerebellar sections for human catalase in control (A) and mitochondrial catalase (mCAT) mice (B) at P7. Nuclei were counterstained with Hoechst (blue). Similar staining was seen in four mCAT mice. (C) Quantification of MitoSOX high expression at P2 in control and mCAT cerebella, with and without irradiation at P1 (two-way ANOVA, F(1,34)=6.768, p=0.0136). (D) Quantification of MitoTracker high expression at P2 in control and mCAT cerebella, with and without irradiation at P1 (two-way ANOVA, F(1,31)=25.06, p<0.0001). (E) Quantification of TUNEL+ cell density in the EGL at P2 in control and mCAT cerebella, with and without irradiation at P1 (two-way ANOVA, F(1,14)=87.56, p<0.0001). (F) Quantification of IBA1+ cell density in the EGL at P2 in control and mCAT cerebella, with and without irradiation at P1 (two-way ANOVA, F(1,14)=15.58, p=0.0015). (G–J) Hematoxylin and eosin staining on midsagittal sections of P30 control and mCAT cerebellum with or without irradiation. (K) Quantification of P30 cerebellar midsagittal section area in controls and mCAT nonIR and IR mice (two-way ANOVA, F(1,20)=11.82, p=0.0026). (L) Graph showing the average area of midsagittal cerebellar sections at P3, P5, P8, P12, and P30 in control and mCAT non-irradiated and irradiated mice. Detailed statistics are shown in Figure 4—figure supplement 1. EGL, external granular layer; P, postnatal day; nonIR, non-irradiated; IR, irradiated. Scale bar: A and B: 100 µm, F–I: 1 mm. Significant Tukey’s post hoc multiple comparison tests are shown in the figures, and data are represented as mean ± SEM.
Figure 4—figure supplement 1
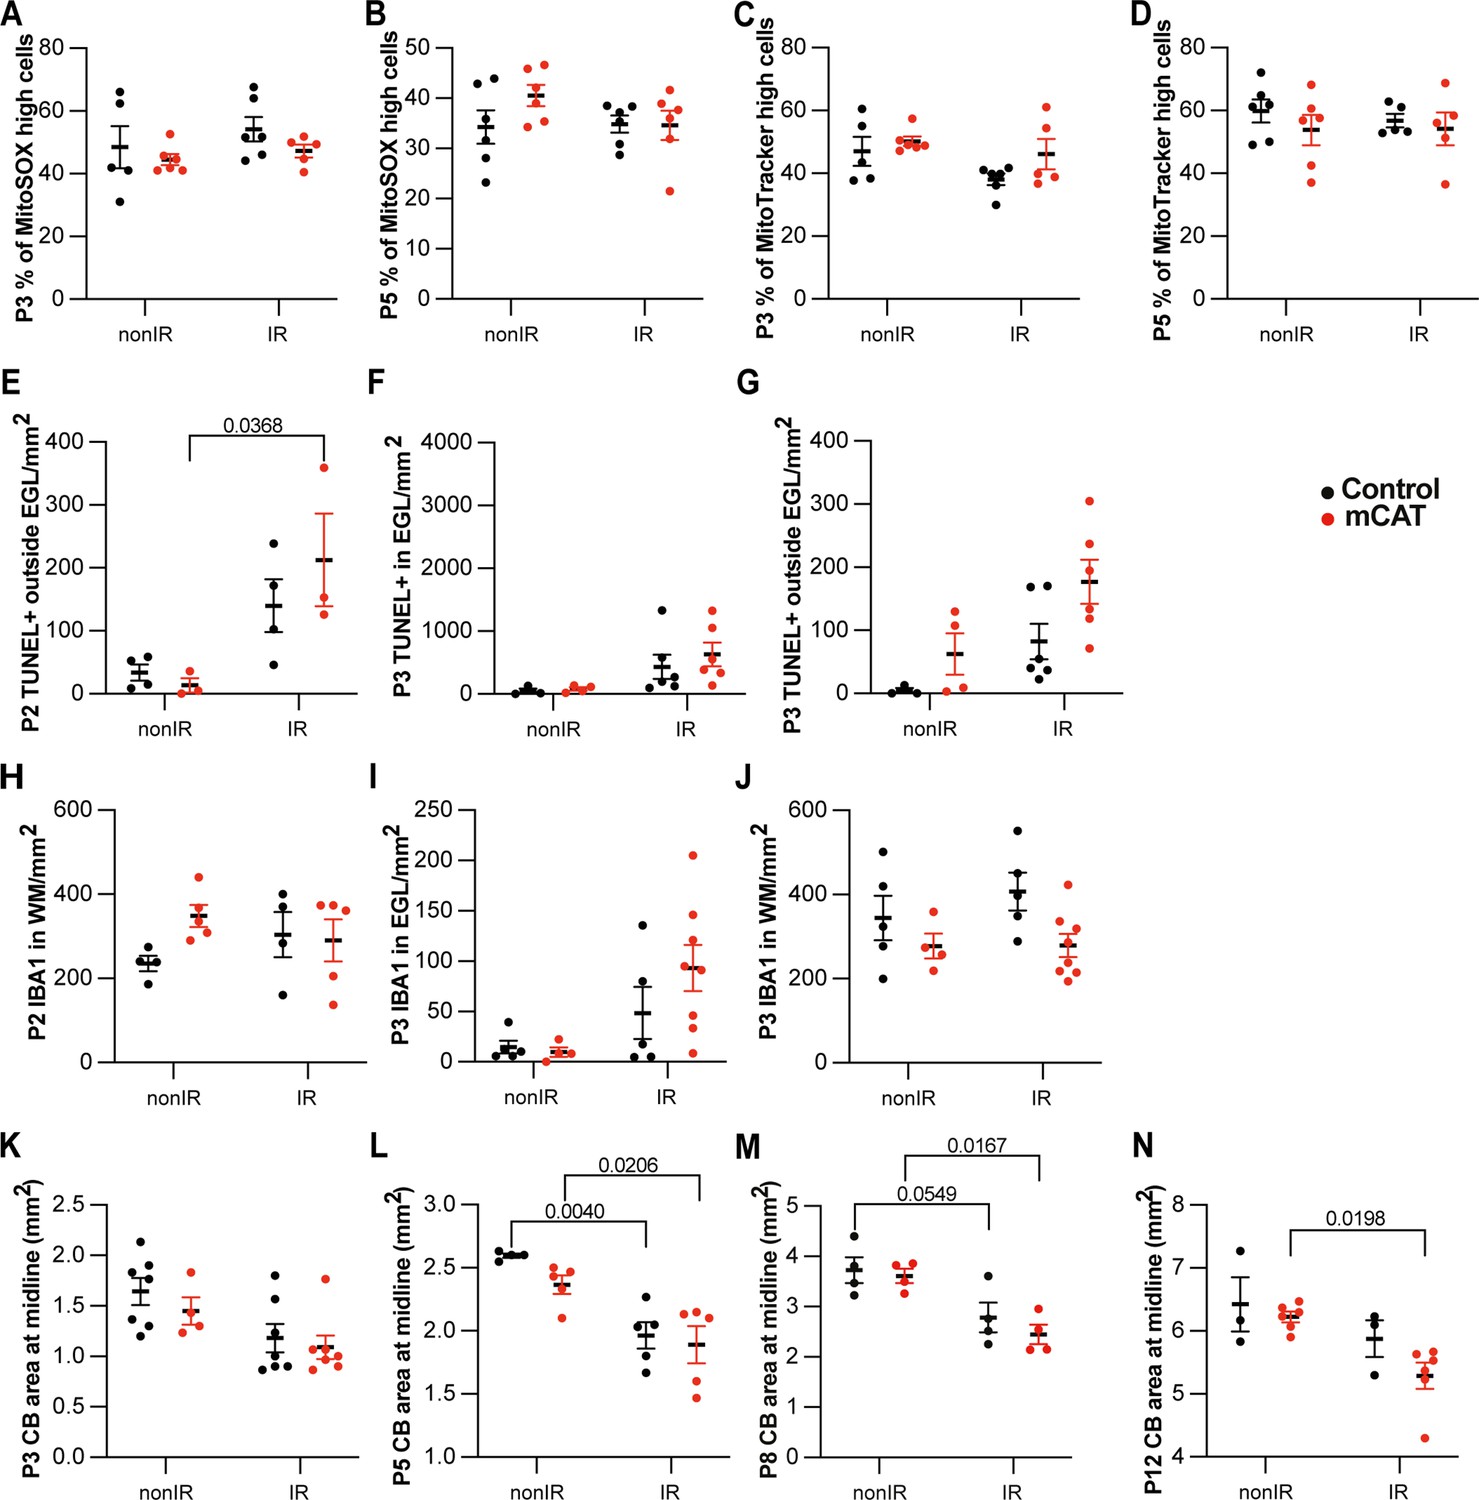
Reduction of reactive oxygen species (ROS) impairs adaptive reprogramming and cerebellar repair.
(A, B) Quantification of high MitoSOX expression at P3 (A) and P5 (B) in control and mitochondrial catalase (mCAT) cerebella, with and without irradiation at P1. (C, D) Quantification of MitoTracker high expression at P3 (C) and P5 (D) in control and mCAT cerebella, with and without irradiation at P1. (E–G) Quantification of TUNEL+ cell density outside EGL at P2 (two-way ANOVA, F(1,10)=14.20, p=0.0037) (E), at P3 (G), and in the EGL at P3 (F) in lobules 3–5 of nonIR and IR mice. (H–J) Quantification of IBA1+ cell density in WM at P2 (H), at P3 (J), and in the EGL at P3 (I) in lobules 3–5 of nonIR and IR mice. (K–N) Quantification of cerebellar midsagittal section area in controls and mCAT nonIR and IR mice at P3 (K), P5 (two-way ANOVA, F(1,15)=28.52, p<0.001) (L), P8 (two-way ANOVA, F(1,12)=21.21, p=0.0006) (M), and P12 (two-way ANOVA, F(1,14)=9.682, p=0.0077) (N). EGL, external granular layer; WM, white matter; P, postnatal day; nonIR, non-irradiated; IR, irradiated. Significant Tukey’s post hoc multiple comparison tests are shown in the figures, and data are represented as mean ± SEM.
Figure 5 with 1 supplement
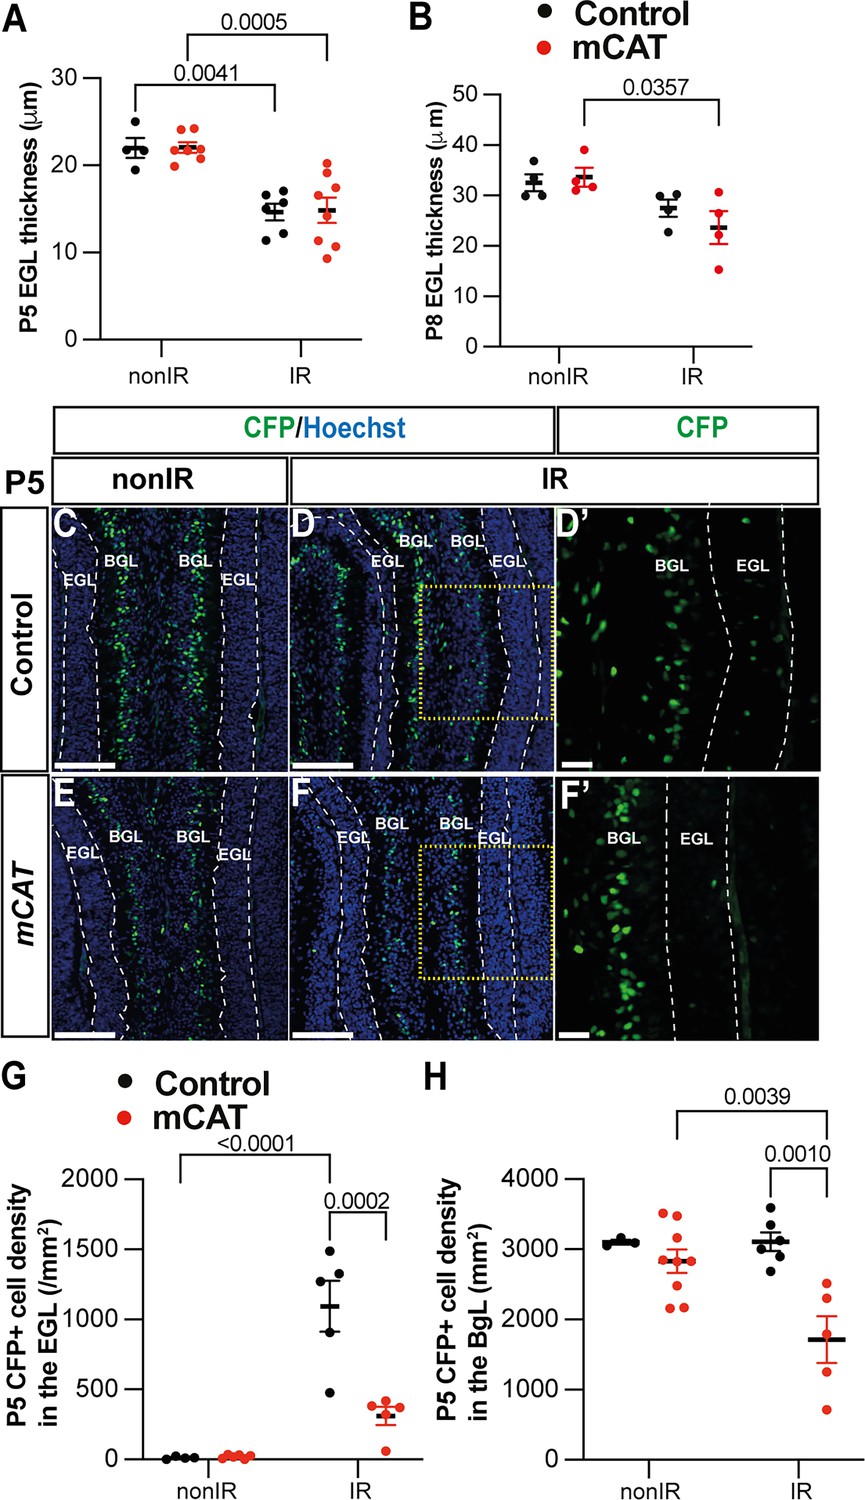
Reduced reactive oxygen species (ROS) impairs expansion of BgL-Nestin-expressing progenitors (NEPs) and their recruitment to the external granule layer (EGL) after injury.
(A, B) Quantification of EGL thickness at P5 (two-way ANOVA, F(1,21)=36.64, p<0.0001) (A) and P8 (two-way ANOVA, F(1,12)=11.34, p=0.0056) (B) in lobules 3–5 of Nes-Cfp control and Nes-Cfp; mitochondrial catalase (mCAT) mutant mice with and without irradiation at P1. (C–F) Immunohistochemical (IHC) staining of medial sagittal cerebellar sections showing expression of CFP (green) in lobule 4/5 of Nes-Cfp control and Nes-Cfp; mCAT mutant mice at P5. Nuclei were counterstained with Hoechst (blue). (D’) and (F’) show high-power images of the yellow boxed area in the single channel CFP. EGL is delineated by the dashed white lines. (G, H) Quantification of CFP+ cell density in the EGL (two-way ANOVA, F(1,19)=5.192, p=0.0359) (G) and BgL (two-way ANOVA, F(1,17)=6.191, p=0.0223) (H) at P5 in Nes-Cfp control or Nes-Cfp; mCAT mutant non-irradiated and irradiated mice. EGL, external granular layer; BgL, Bergmann glia layer; P, postnatal day; nonIR, non-irradiated; IR, irradiated. Scale bar: D–F: 100 µm. Significant Tukey’s post hoc multiple comparison tests are shown in the figures, and data are represented as mean ± SEM.
Figure 5—figure supplement 1
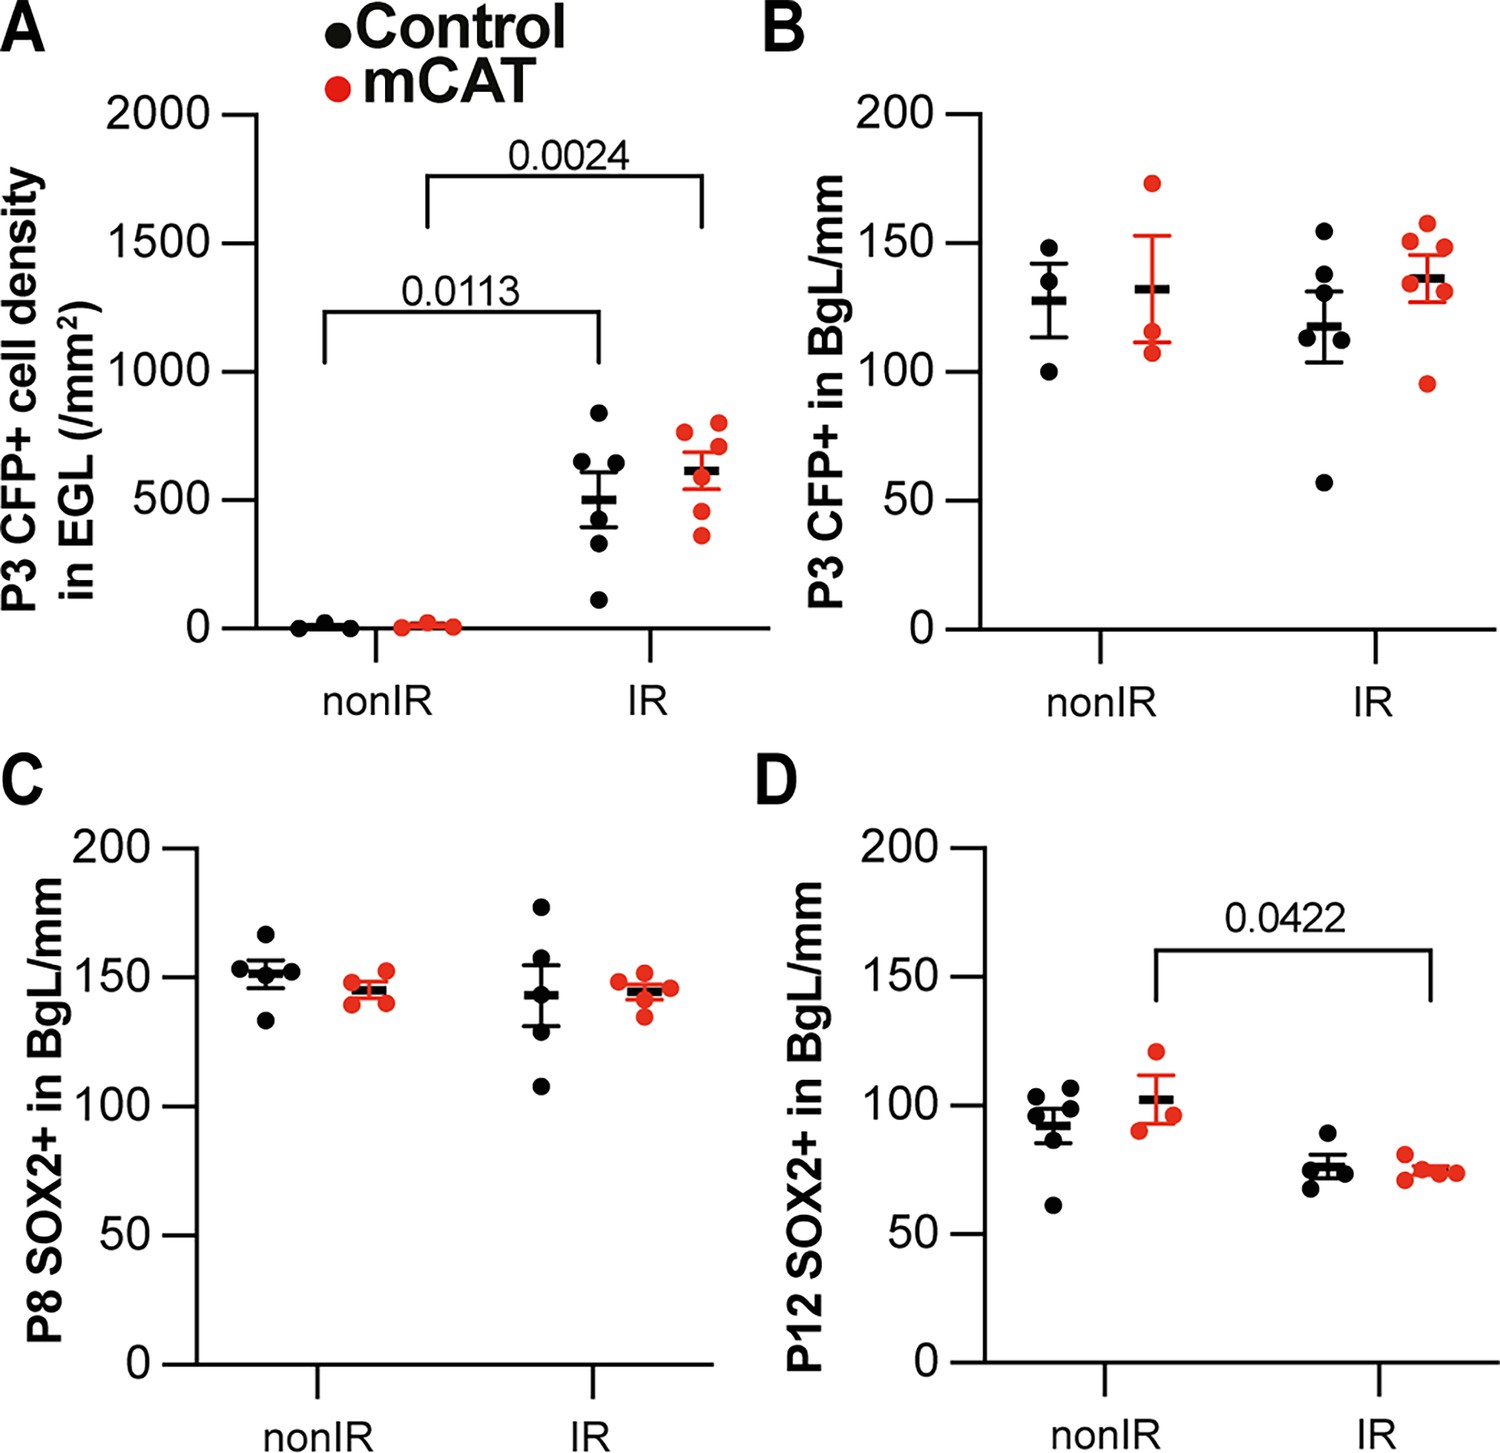
Reduced reactive oxygen species (ROS) impairs expansion of BgL-Nestin-expressing progenitors (NEPs) and their migration to the external granule layer (EGL) after injury.
(A) Quantification of CFP+ cell density in the EGL at P3 in Nes-Cfp control or Nes-Cfp; mitochondrial catalase (mCAT) mutant nonIR and IR mice (two-way ANOVA, F(1,14)=33.77, p<0.0001). (B) Quantification of CFP+ cell normalized on BgL length at P5 in Nes-Cfp control or Nes-Cfp; mCAT mutant nonIR and IR mice. (C, D) Quantification of SOX2+ NEP cell density on BgL length at P8 (C) and P12 (two-way ANOVA, F(1,12)=12.50, p=0.0033) (D) in control or mCAT mutant nonIR and IR mice. EGL, external granular layer; BgL, Bergmann glia layer; P, postnatal day; nonIR, non-irradiated; IR, irradiated. Significant Tukey’s post hoc multiple comparison tests are shown in the figures, and data are represented as mean ± SEM.
Figure 6 with 1 supplement
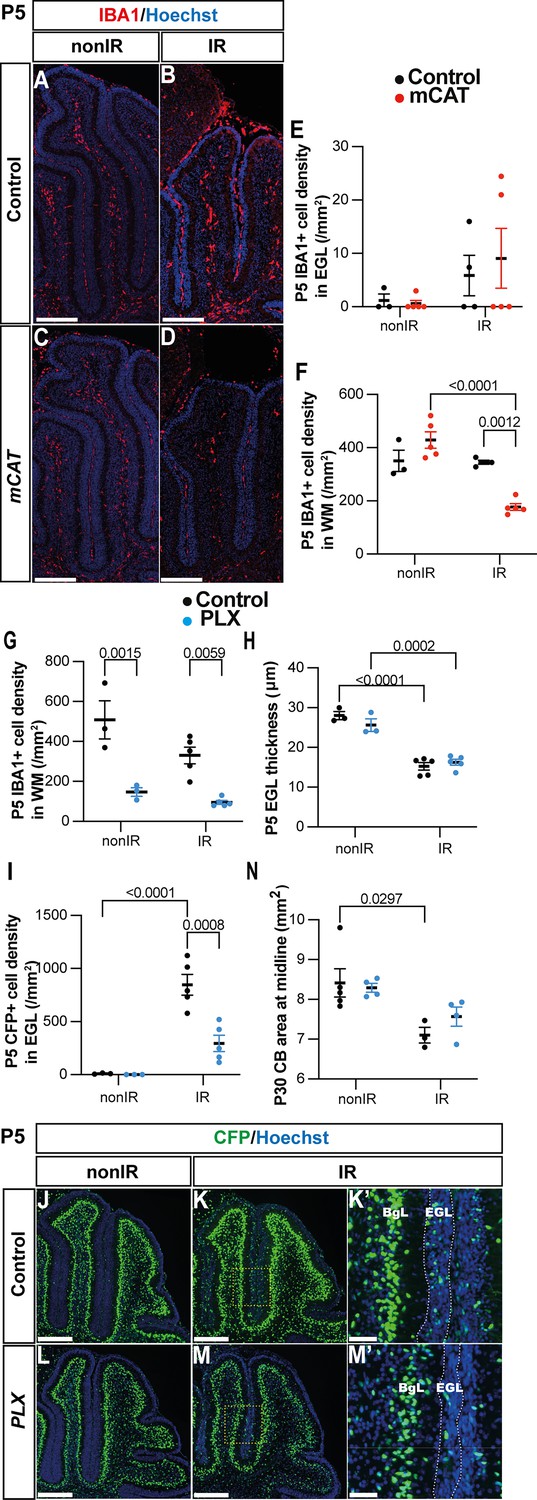
Microglia might promote recruitment of Nestin-expressing progenitors (NEPs) to the external granule layer (EGL) during cerebellar adaptive reprogramming after injury.
(A–D) Immunohistochemical (IHC) staining of medial sagittal cerebellar sections for IBA1 (red) in control and mitochondrial catalase (mCAT) mice at P5. Nuclei were counterstained with Hoechst (blue). (E, F) Quantification of IBA1+ cell density in the external granular layer (E) and white matter (two-way ANOVA, F(1,13)=24.74, p=0.0003) (F) at P5 on midsagittal sections of lobules 3–5 in the cerebellum of control and mCAT animals, with or without irradiation. (G–J) IHC staining of medial sagittal cerebellar sections at P5 for CFP (green) in lobule 4/5 of Nes-Cfp mice treated with PLX5622 or control DMSO with or without irradiation. Nuclei were counterstained with Hoechst (blue). (H’) and (J’) show a high-power image of the area indicated by yellow boxes. EGL is delineated by the white dashed lines. (K) Quantification of IBA1+ cell density in the white matter at P5 on midsagittal sections in lobules 3–5 of Nes-Cfp mice treated with PLX5622 or control DMSO, with or without irradiation (two-way ANOVA, F(1,12)=42.40, p<0.001). (L) Quantification of EGL thickness at P5 in lobules 3–5 of Nes-Cfp mice treated with PLX5622 or control DMSO with or without irradiation (two-way ANOVA, F(1,12)=109.5, p<0.001). (M) Quantification of CFP+ cells density in the EGL at P5 on midsagittal sections in lobules 3–5 of Nes-Cfp mice treated with PLX5622 or control DMSO with or without irradiation (two-way ANOVA, F(1,12)=10.62, p=0.0068). (N) Measurement of cerebellar midsagittal section area at P30 in controls or mice treated with PLX, with or without irradiation at P1 (two-way ANOVA, F(1,12)=13.29, p=0.0034). EGL, external granular layer; WM, white matter; P, postnatal day; nonIR, non-irradiated; IR, irradiated. Scale bar: A–D and G–J: 250 µm. Significant Tukey’s post hoc multiple comparison tests are shown in the figures, and data are represented as mean ± SEM.
Figure 6—figure supplement 1

Microglia might promote recruitment of Nestin-expressing progenitors (NEPs) to the external granule layer (EGL) during cerebellar adaptive reprogramming after injury.
(A) Quantification of IBA1+ cell density in the WM at P8 in control or mitochondrial catalase (mCAT) mutant nonIR and IR mice. (B–E) Immunostaining of medial sagittal cerebellar sections at P5 showing expression of IBA1 (red) in mice treated with PLX5622 or control DMSO, with or without irradiation. (F) Quantification of SOX2+ NEP cell density in the BgL at P5 in control or PLX-treated nonIR and IR mice. BgL, Bergmann glia layer; WM, white matter; P, postnatal day; nonIR, non-irradiated; IR, irradiated. Scale bar: 500 µm. Data are represented as mean ± SEM.
Tables
Table 1
List of antibodies and related information.
| Antigen | Species | Concentration | References | Source |
|---|---|---|---|---|
| Catalase | Rabbit | 1–100 | 01-05-030000 | Athens Research and Technology |
| GFAP | Chicken | 1–500 | ab4674 | Abcam |
| GFP | Rat | 1–1000 | 440484 | Nacalai Tesque |
| IBA1 | Rabbit | 1–500 | 019-19741 | Wako Chemicals |
| SOX2 | Goat | 1–500 | AF2018 | R&D Systems |
Appendix 1—key resources table
| Reagent type (species) or resource | Designation | Source or reference | Identifiers | Additional information |
|---|---|---|---|---|
| Strain (Mus musculus) | Nes-cfp | Jackson Laboratories | Jax #034387 | |
| Strain (Mus musculus) | Mcat | Jackson Laboratories | Jax #016197 | |
| Chemical compound | 5-Ethynyl-2’-deoxyuridine (Edu) | Life Technologies | E10187 | |
| Chemical compound | Plx5622 | Plexxikon | Plexxikon via MTA | Currently commercially available |
| Antibody | Rabbit anti-Catalase | Athens Research and Technology | 01-05-030000 | 1/100 |
| Antibody | Chicken anti-GFAP | Abcam | ab4674 | 1/500 |
| Antibody | Rat anti-GFP | Nacalai Tesque | 440484 | 1/1000 |
| Antibody | Rabbit anti-IBA1 | Wako Chemicals | 019-19741 | 1/500 |
| Antibody | Goat anti-SOX2 | R&D Systems | Af2018 | 1/500 |
| Commercial assay kit | MitoSOX | Thermo Fisher Scientific | M36008 | |
| Commercial assay kit | MitoTracker | Thermo Fisher Scientific | M22426 | |
| Software, algorithm | Fiji (ImageJ) | NIH | ||
| Software, algorithm | FlowJo | BD Biosciences | ||
| Software, algorithm | Prism | GraphPad |
Additional files
Download links
A two-part list of links to download the article, or parts of the article, in various formats.
Downloads (link to download the article as PDF)
Open citations (links to open the citations from this article in various online reference manager services)
Cite this article (links to download the citations from this article in formats compatible with various reference manager tools)
An increase in reactive oxygen species underlies neonatal cerebellum repair
eLife 14:RP102515.
https://doi.org/10.7554/eLife.102515.3


