Flexibility in PAM recognition expands DNA targeting in xCas9
- Department of Bioengineering , University of California Riverside, United States
- Department of Physical Chemistry, Gdańsk University of Technology, Poland
- Institute for Research in Biomedicine (IRB Barcelona), The Barcelona Institute of Science and Technology, Spain
- Departament de Bioquímica i Biomedicina, Facultat de Biologia, Universitat de Barcelona, Spain
- BioTechMed Center, Gdańsk University of Technology, Poland
- Department of Chemistry, University of California Riverside, United States
Figures
Figure 1
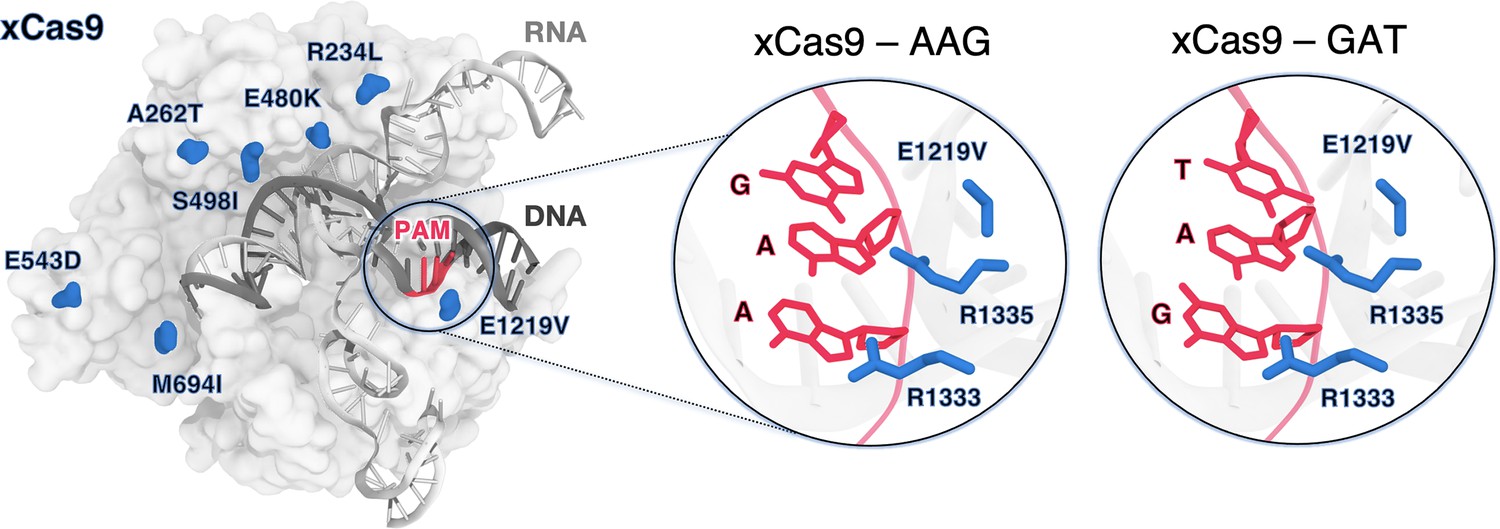
xCas9 variant of the S. pyogenes Cas9 (SpCas9) protein bound to a guide RNA (grey) and a target DNA (charcoal) including the 5’-AGG-3’ protospacer adjacent motif (PAM) recognition sequence (red) (PDB 6AEB) (Guo et al., 2019).
xCas9 includes seven amino acid substitutions (blue) with respect to SpCas9. Close-up views of the PAM recognition region for xCas9 bound to AGG (PDB 6AEB, left) (Guo et al., 2019) and GAT (PDB 6AEG, right) (Guo et al., 2019). The PAM nucleobases (red) and the PAM interacting residues (R1333 and R1335, blue) are shown as sticks. The E1219V mutation is also shown.
Figure 2 with 1 supplement
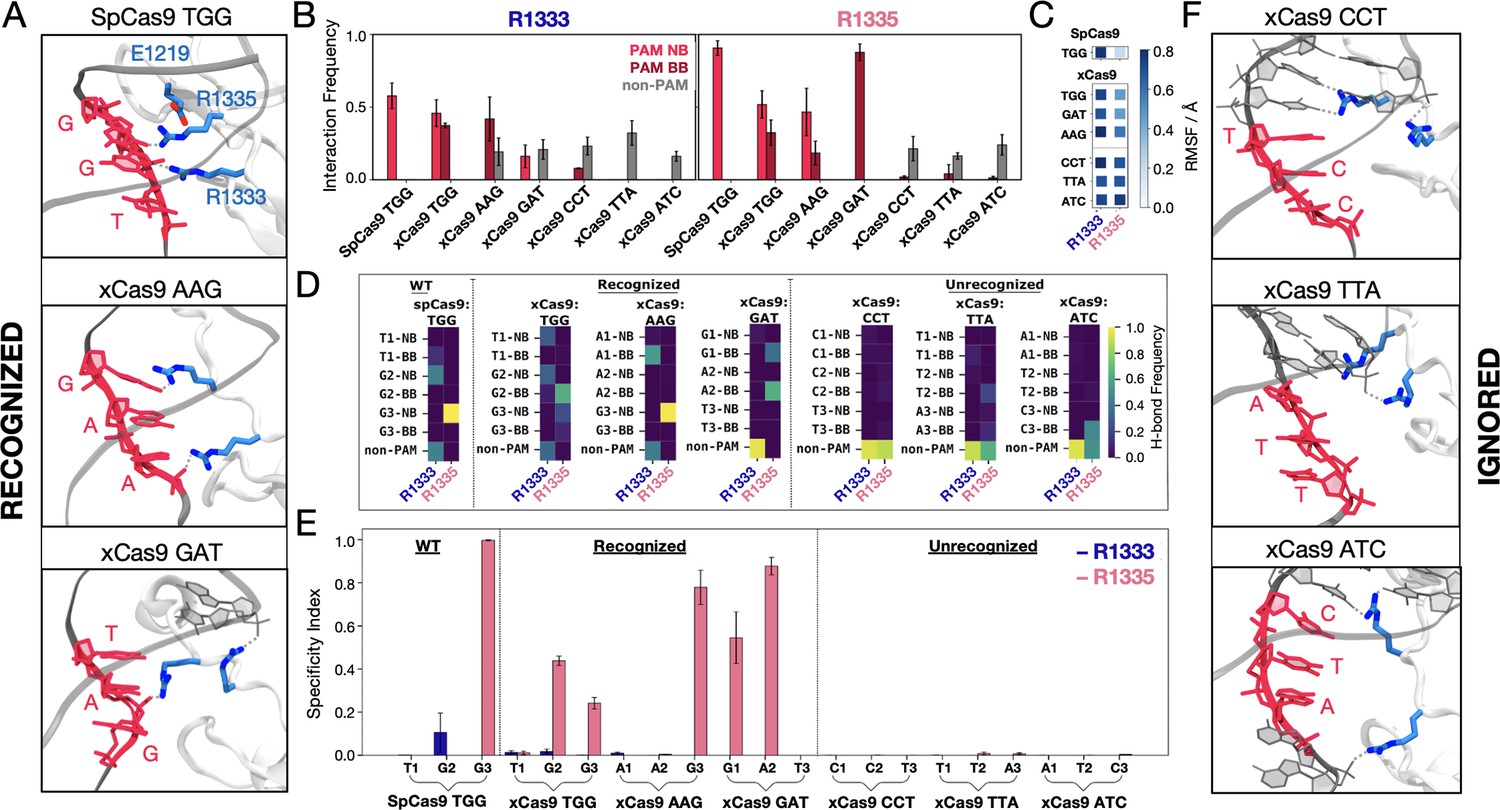
Binding of SpCas9 and xCas9 to protospacer adjacent motif (PAM) sequences that are recognised and ignored.
(A) Binding of SpCas9 and xCas9 to PAM sequences that are recognised (TGG, top; AAG, centre; GAT, bottom). (B) Interaction pattern established by R1333 (left) and R1335 (right) with PAM nucleobases (NB), PAM backbone (BB), and non-PAM nucleotides in SpCas9 bound to TGG (i.e. the wilt-type system) and xCas9 bound to PAM sequences that are recognised (TGG, AAG, GAT) and ignored (CCT, TTA, ATC). Interaction frequencies are averaged over ~6 μs of collective ensemble for each system. Errors are computed as standard deviation of the mean over four simulations replicates. (C) Root mean square fluctuations (RMSF) of the R1333 and R1335 side chains in SpCas9 bound to its TGG PAM, compared to xCas9 bound to recognised and ignored PAMs. (D) Frequencies of hydrogen bond formation between the arginine side chains and the PAM NB, BB, and non-PAM nucleotides (details in the SI). (E) Specificity index, representing the frequency of hydrogen bond formation between a given arginine and the PAM nucleotides relative to the frequency of forming hydrogen bonds with non-PAM residues. Data are reported with the standard deviation of the mean over four simulations replicates. (F) PAM recognition region in xCas9 bound to PAM sequences that are ignored (CCT, top; TTA, centre; ATC, bottom). Figure 2—figure supplement 1.
Figure 2—figure supplement 1
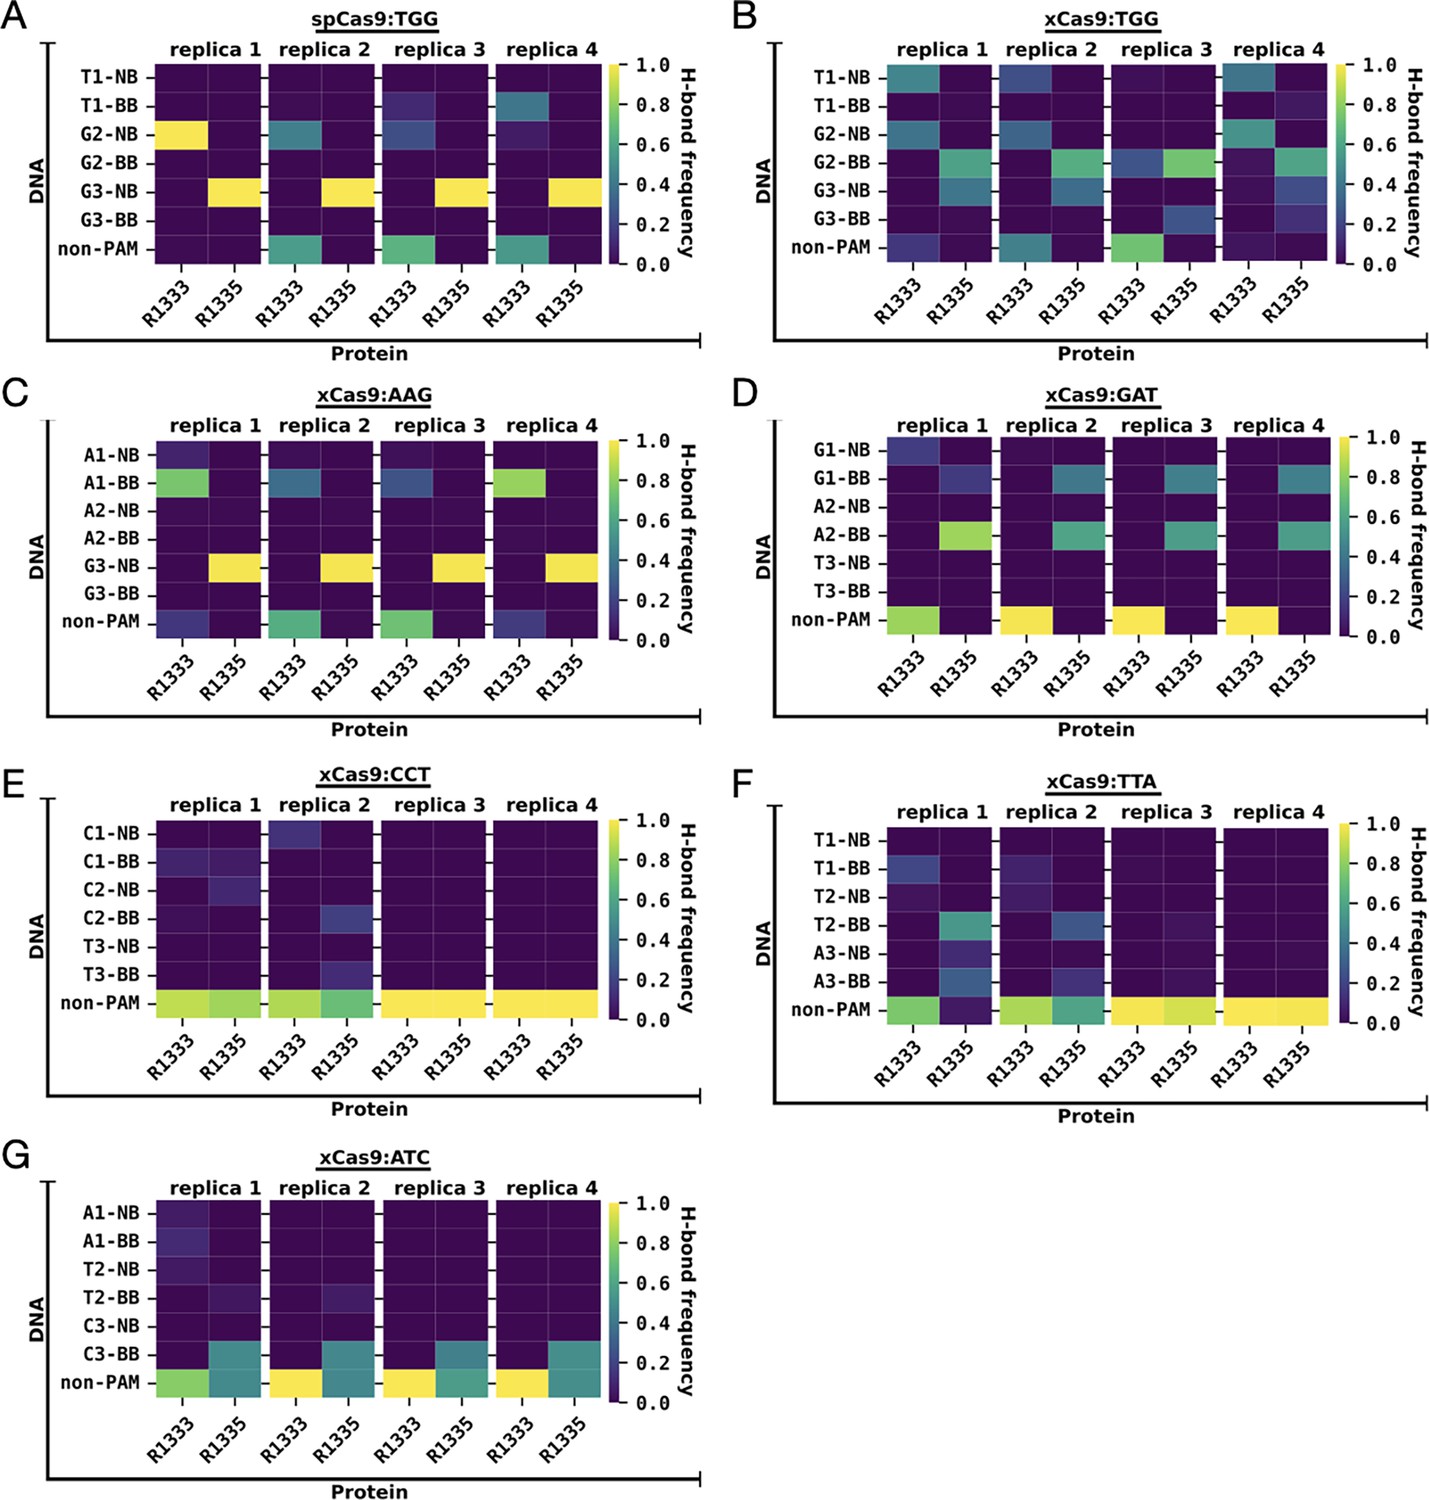
Frequencies of hydrogen bond formation across four simulation replicates.
(A) Frequencies of hydrogen bond formation between the R1333 and R1335 arginine side chains and the protospacer adjacent motif (PAM) nucleobases (NB), PAM backbone (BB), and non-PAM nucleotides, computed for SpCas9 bound to TGG (A), and xCas9 bound to PAM sequences that are recognised (TTG (B), AAG (C), GAT (D)) and that are ignored (CCT (E), TTA (F), ATC (G)). Hydrogen bonds are computed using an acceptor-donor distance and angles of 3.5 Å and 30°, respectively (details in Materials and methods). For each simulated system, data are reported for each simulation replicate of ~1.5 μs each. The analysis on the overall ensemble of ~6 μs for each system is reported in Figure 2D.
Figure 3 with 3 supplements
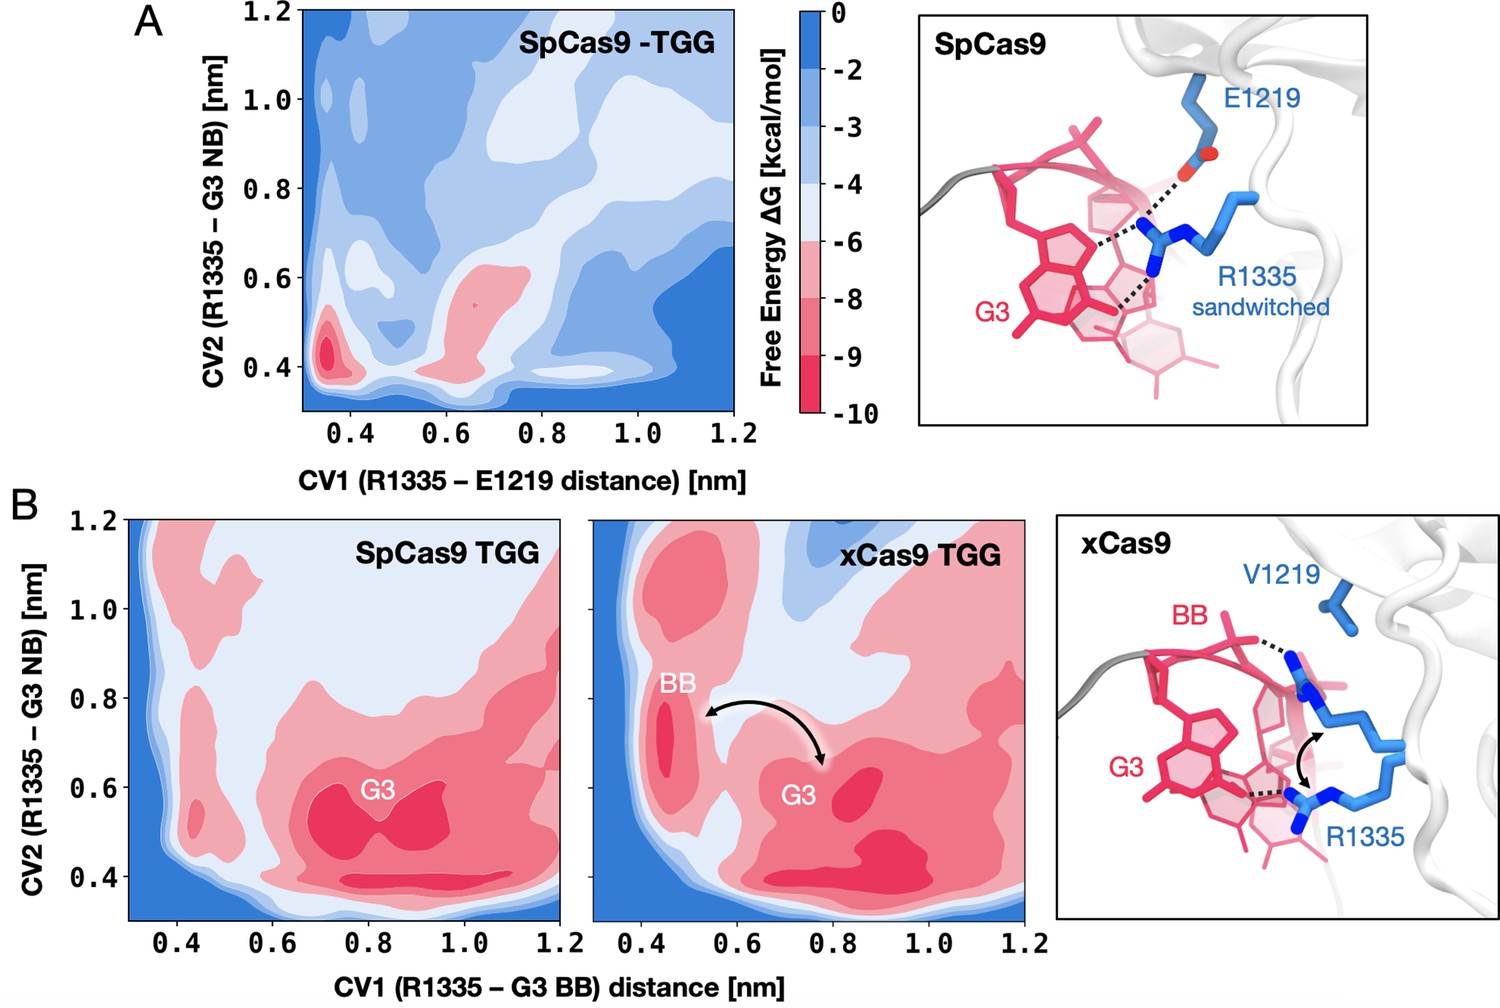
DNA-binding preference of R1335 in SpCas9 vs. xCas9.
(A) Free energy surface (FES) describing the preference of R1335 for binding either the G3 nucleobase or E1219 in SpCas9. The FES is plotted along the distances between the R1335 guanidine and either the E1219 carboxylic group (CV1) or the G3 nucleobase (CV2, details in Materials and methods). A well-defined minimum indicates that R1335 is ‘sandwiched’ between G3 and E1219 (right). (B) FES describing the binding of R1335 to G3 and the DNA backbone in SpCas9 (left) and xCas9 (centre). The FES is plotted along the distances between the R1335 guanidine and either the backbone phosphate (CV1) or G3 nucleobase (CV2). In SpCas9, R1335 mainly binds the G3 nucleobase, while in xCas9, it alternates interactions between the nucleobase and backbone (right). The free energy, ΔG, is expressed in kcal/mol (Figure 3—figure supplements 1–3).
Figure 3—figure supplement 1
Convergence of well-tempered metadynamics simulations characterising the preference of R1335 for binding either the G3 nucleobase or E1219 in SpCas9.
The two-dimensional free energy surfaces (FES) were computed along two collective variables (CVs): the distances between the centres of mass (COMs) of the R1335 guanidine and the E1219 carboxylic group (CV1) or the G3 functional group atoms exposed in the major groove (O6 and N7, CV2). The FES were computed over non-overlapping windows of the trajectory, specifically covering the intervals 0–100 ns, 100–300 ns, 300–400 ns, 400–500 ns, 500–600 ns, 600–700 ns, 700–800 ns, 800–900 ns, and 900–1000 ns of well-tempered metadynamics.
Figure 3—figure supplement 2
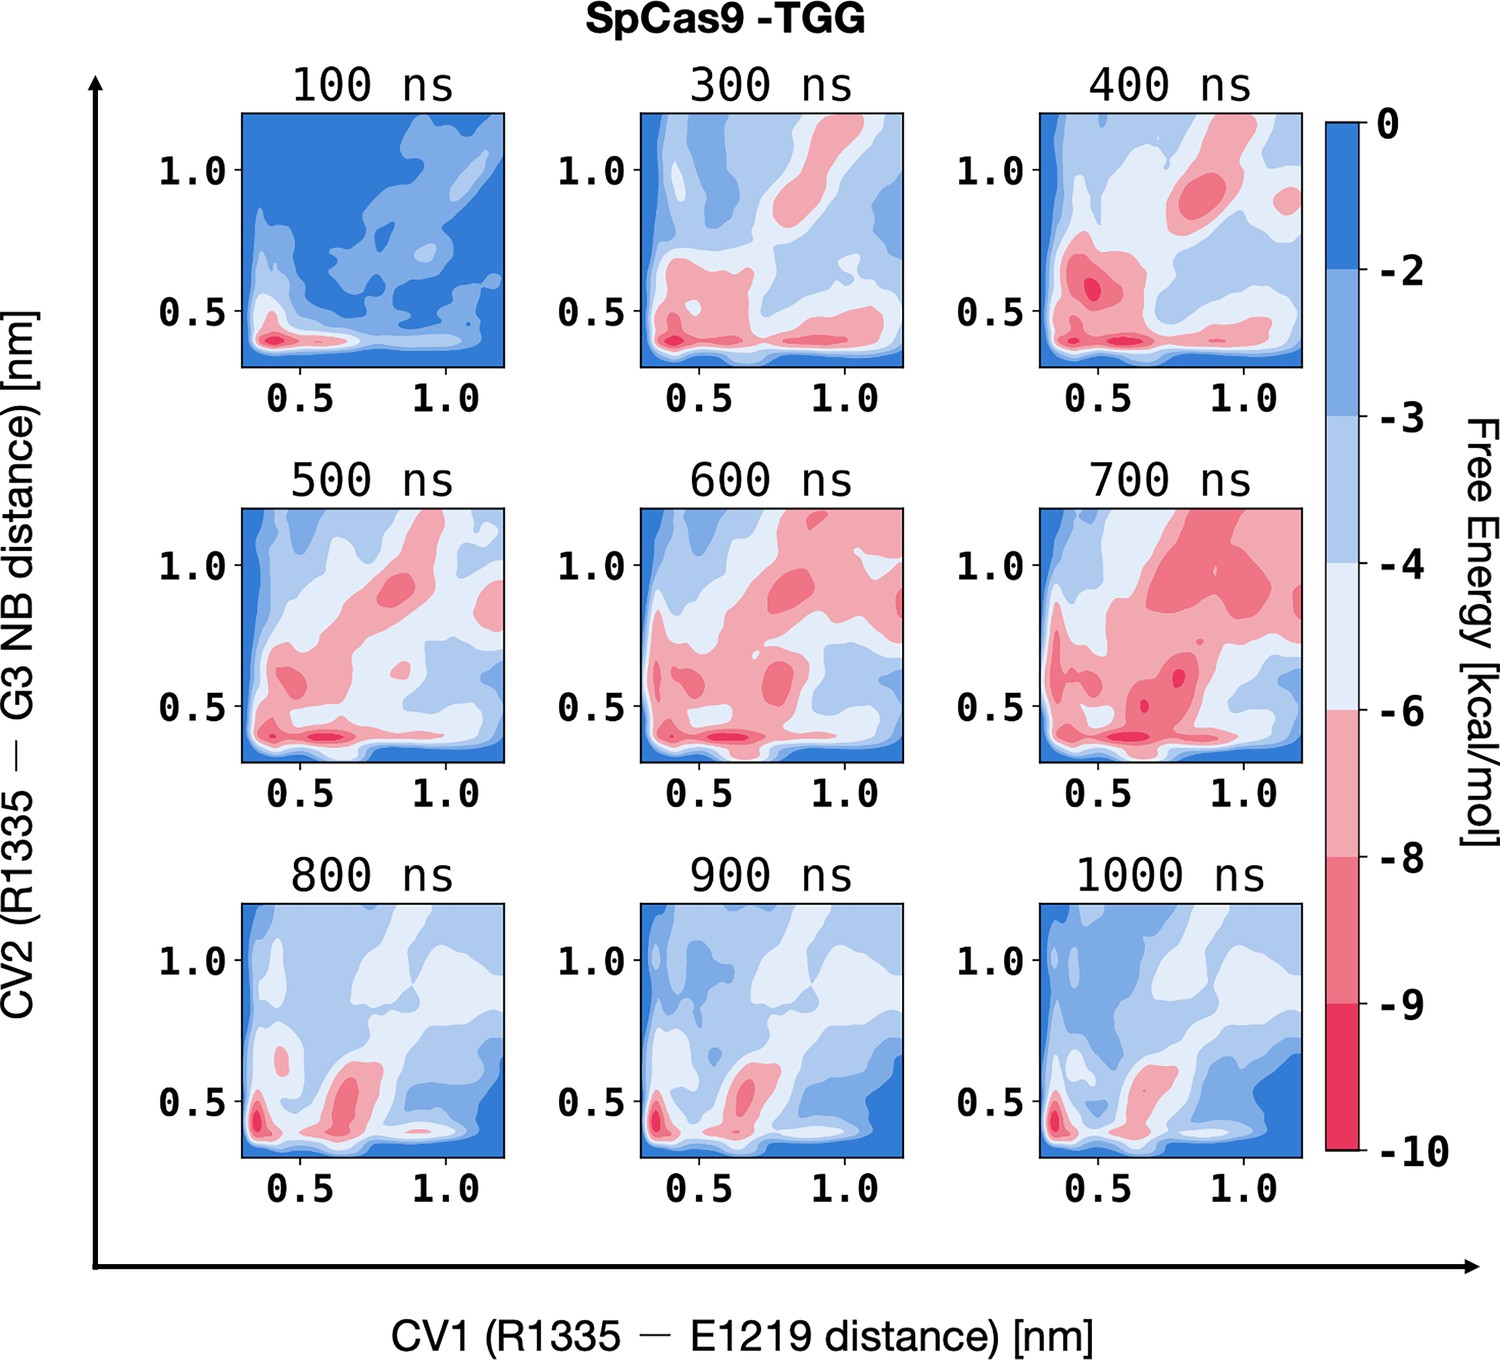
Convergence of well-tempered metadynamics simulations characterising the binding of R1335 to G3 and the DNA backbone in SpCas9.
The two-dimensional free energy surfaces (FES) were computed along two collective variables (CVs): the distances between the R1335 guanidine and either the backbone phosphate group atoms (CV1) or the COM of the G3 functional group atoms exposed in the major groove (O6 and N7, CV2). The FES were computed over non-overlapping windows of the trajectory, specifically covering the intervals 0–100 ns, 100–300 ns, 300–400 ns, 400–500 ns, 500–600 ns, 600–700 ns, 700–800 ns, 800–900 ns, and 900–1000 ns of well-tempered metadynamics.
Figure 3—figure supplement 3

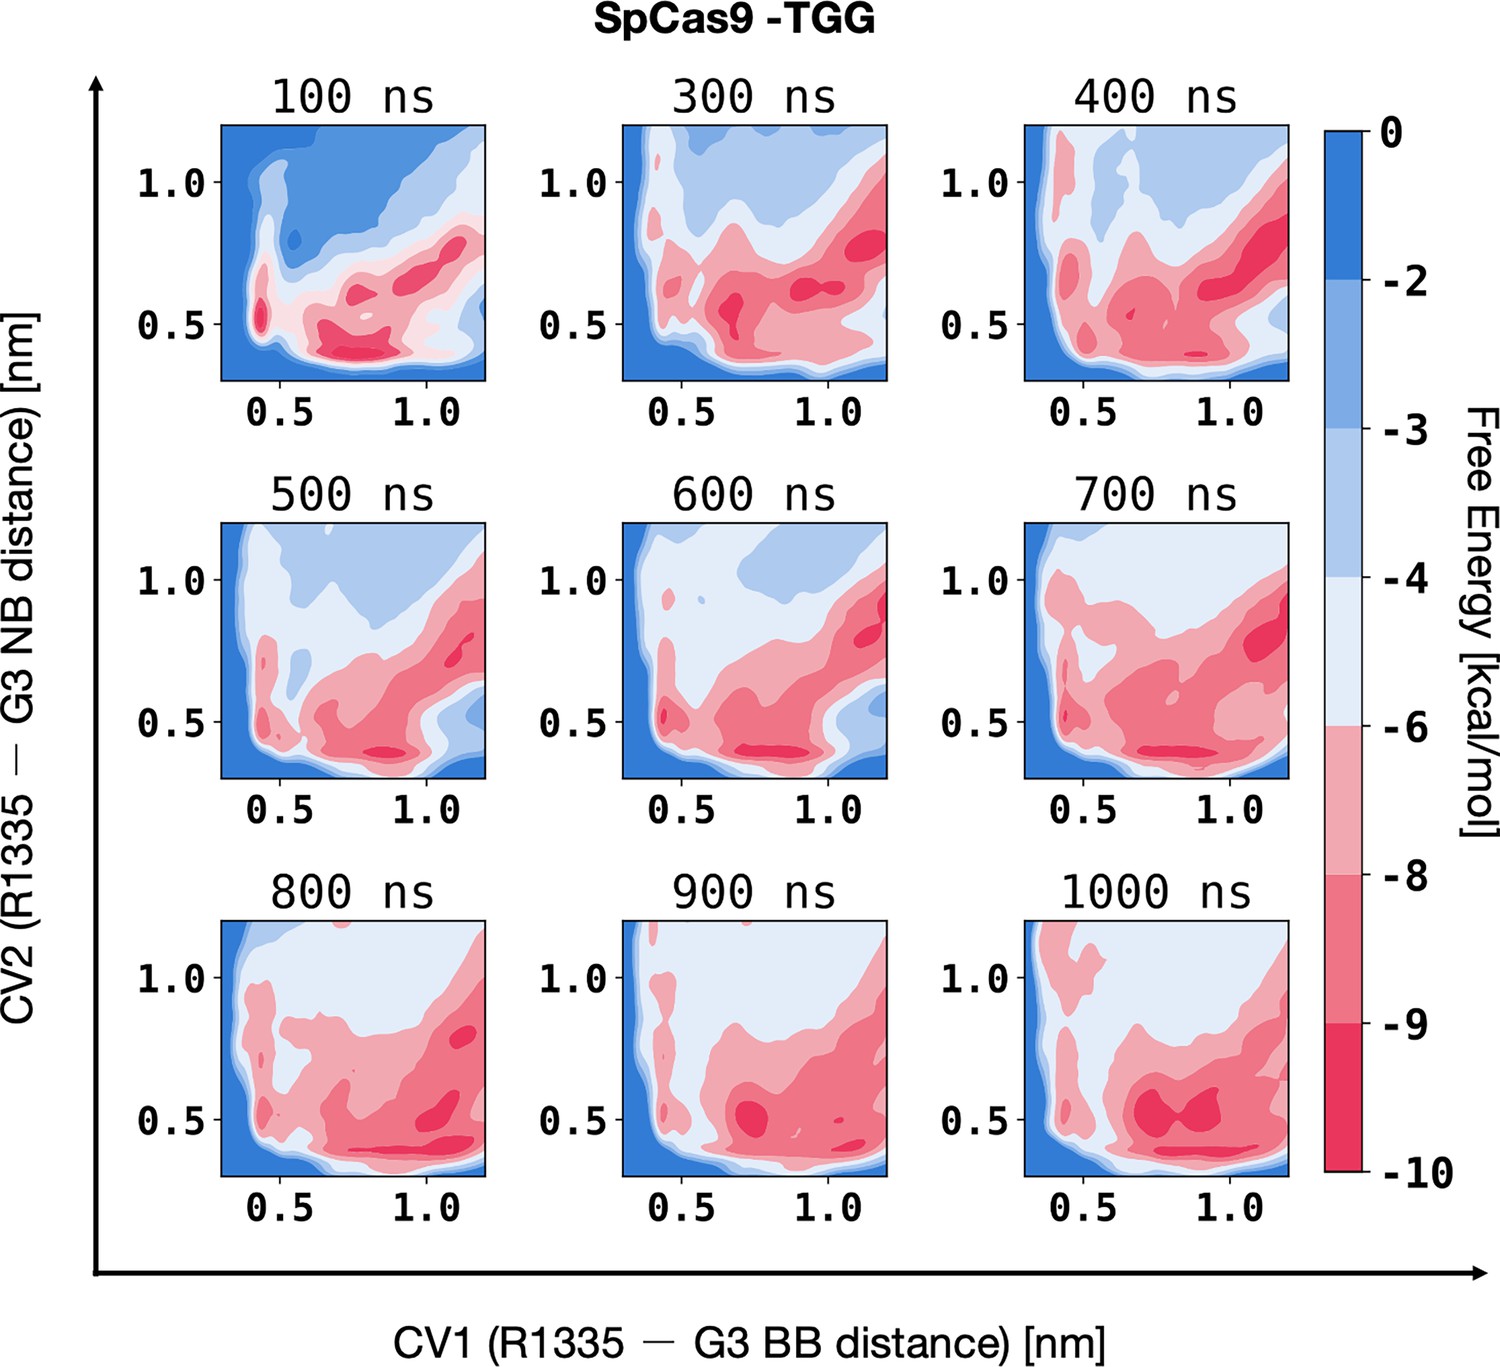
Convergence of well-tempered metadynamics simulations characterising the binding of R1335 to G3 and the DNA backbone in xCas9.
The two-dimensional free energy surfaces (FES) were computed along two collective variables (CVs): the distances between the R1335 guanidine and either the backbone phosphate group atoms (CV1) or the COM of the G3 functional group atoms exposed in the major groove (O6 and N7, CV2). The FES were computed over non-overlapping windows of the trajectory, specifically covering the intervals 0–100 ns, 100–300 ns, 300–400 ns, 400–500 ns, 500–600 ns, 600–700 ns, 700–800 ns, 800–900 ns, and 900–1000 ns of well-tempered metadynamics.
Figure 4 with 2 supplements
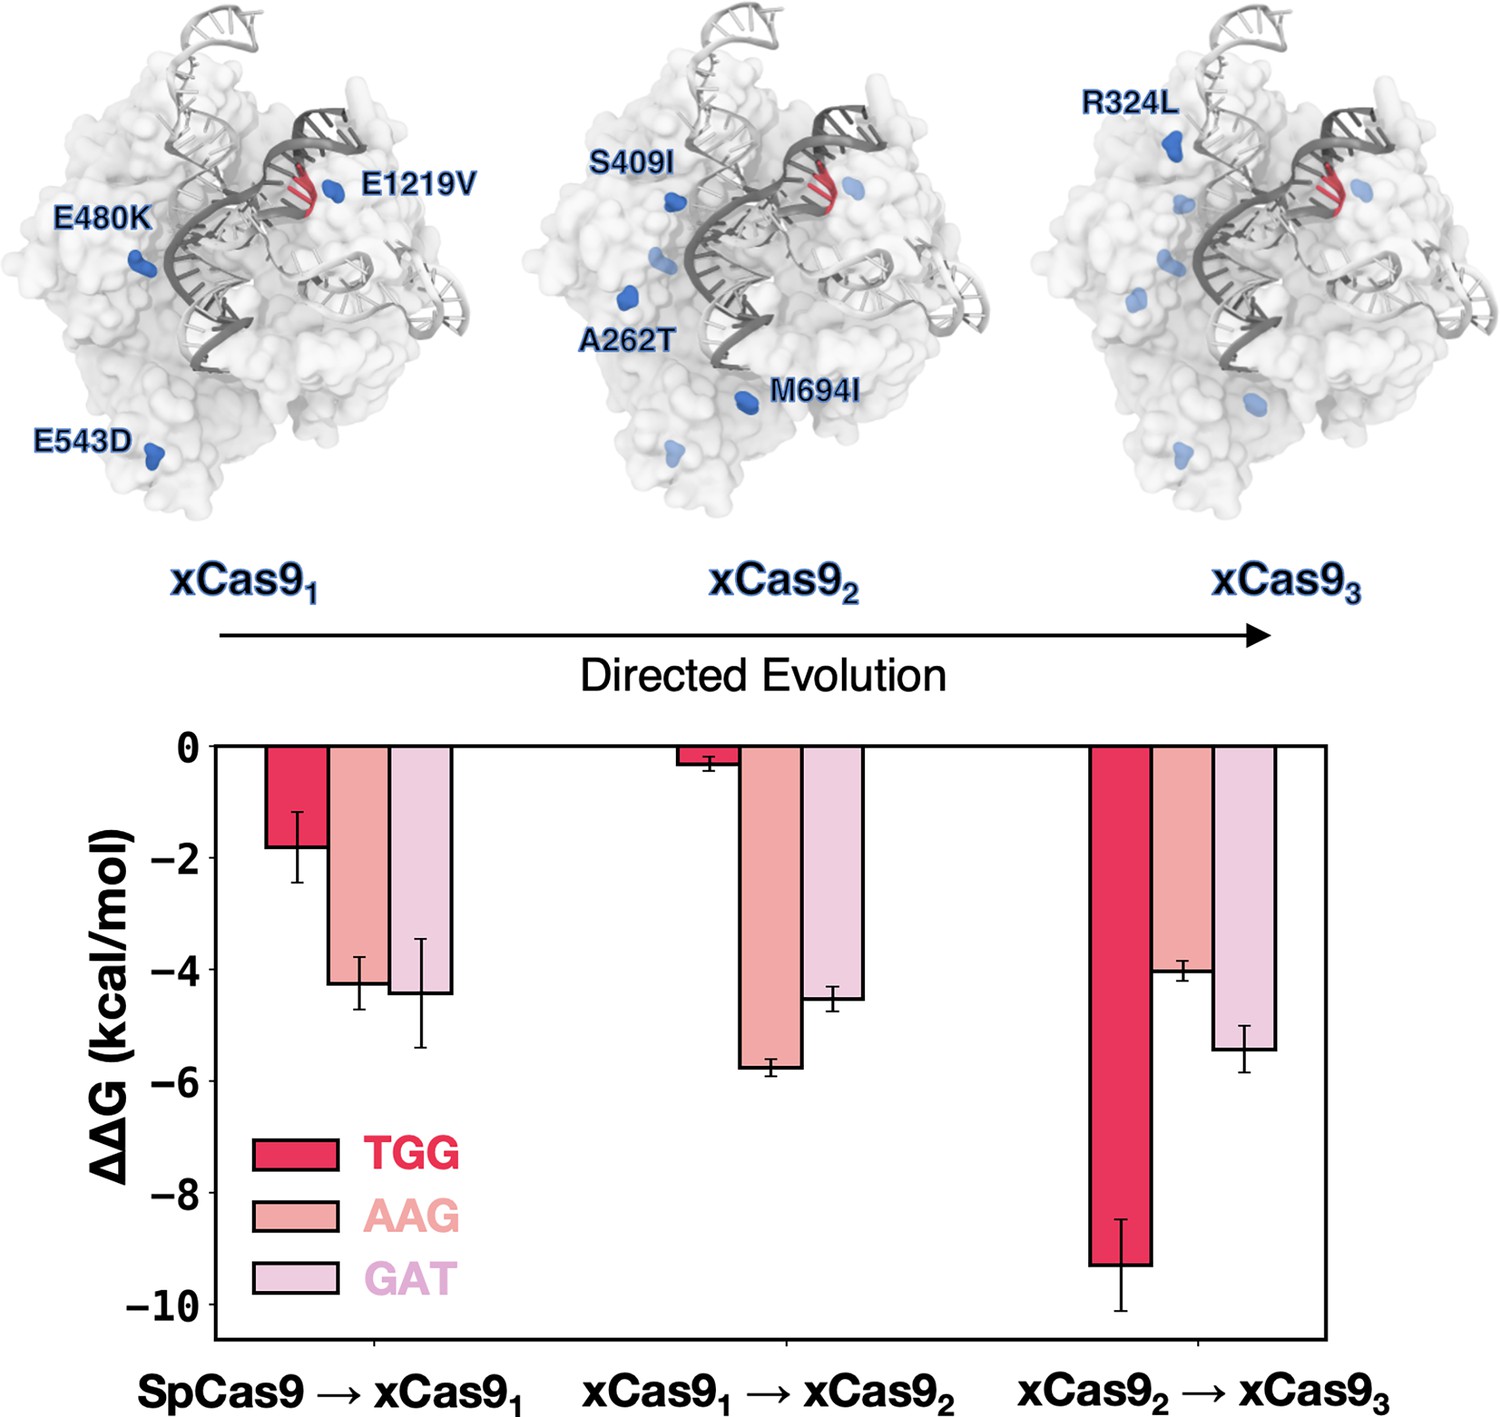
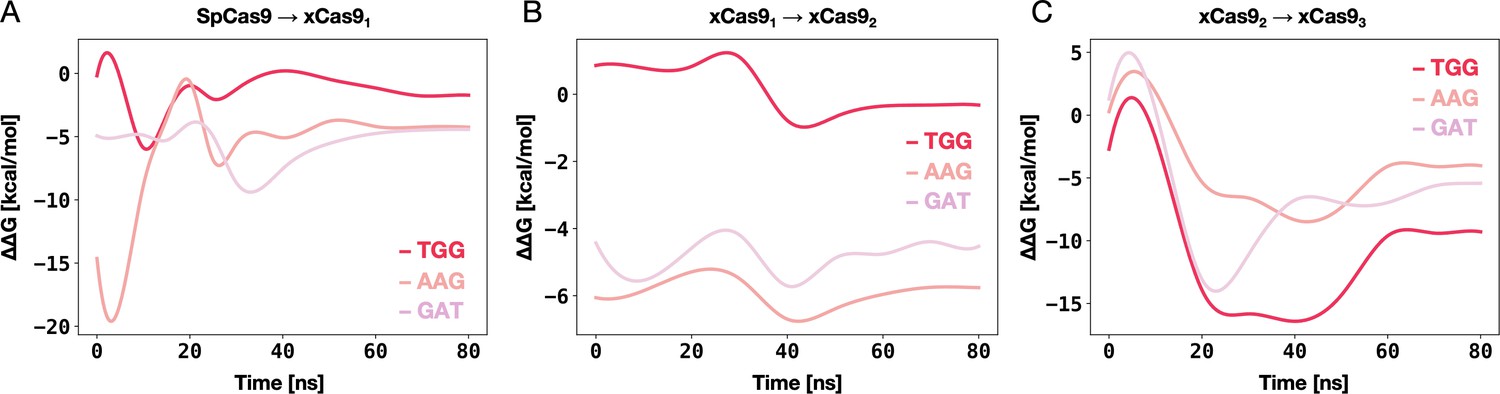
DNA-binding free energy difference (ΔΔG) between SpCas9 and its xCas91-3 mutants.
Relative changes in the DNA-binding free energy (ΔΔG) upon transitioning from SpCas9 to xCas91, from xCas91 to xCas92, and from xCas92 to xCas93 in the presence of TGG (red), AAG (salmon), and GAT (pink) protospacer adjacent motif (PAM) sequences. Binding free energies from alchemical free energy calculations denoted with the associated error computed through the multistate Bennett acceptance ratio (MBAR) method (Shirts and Chodera, 2008) (details in Materials and methods) (Figure 4—figure supplements 1 and 2).
Figure 4—figure supplement 1
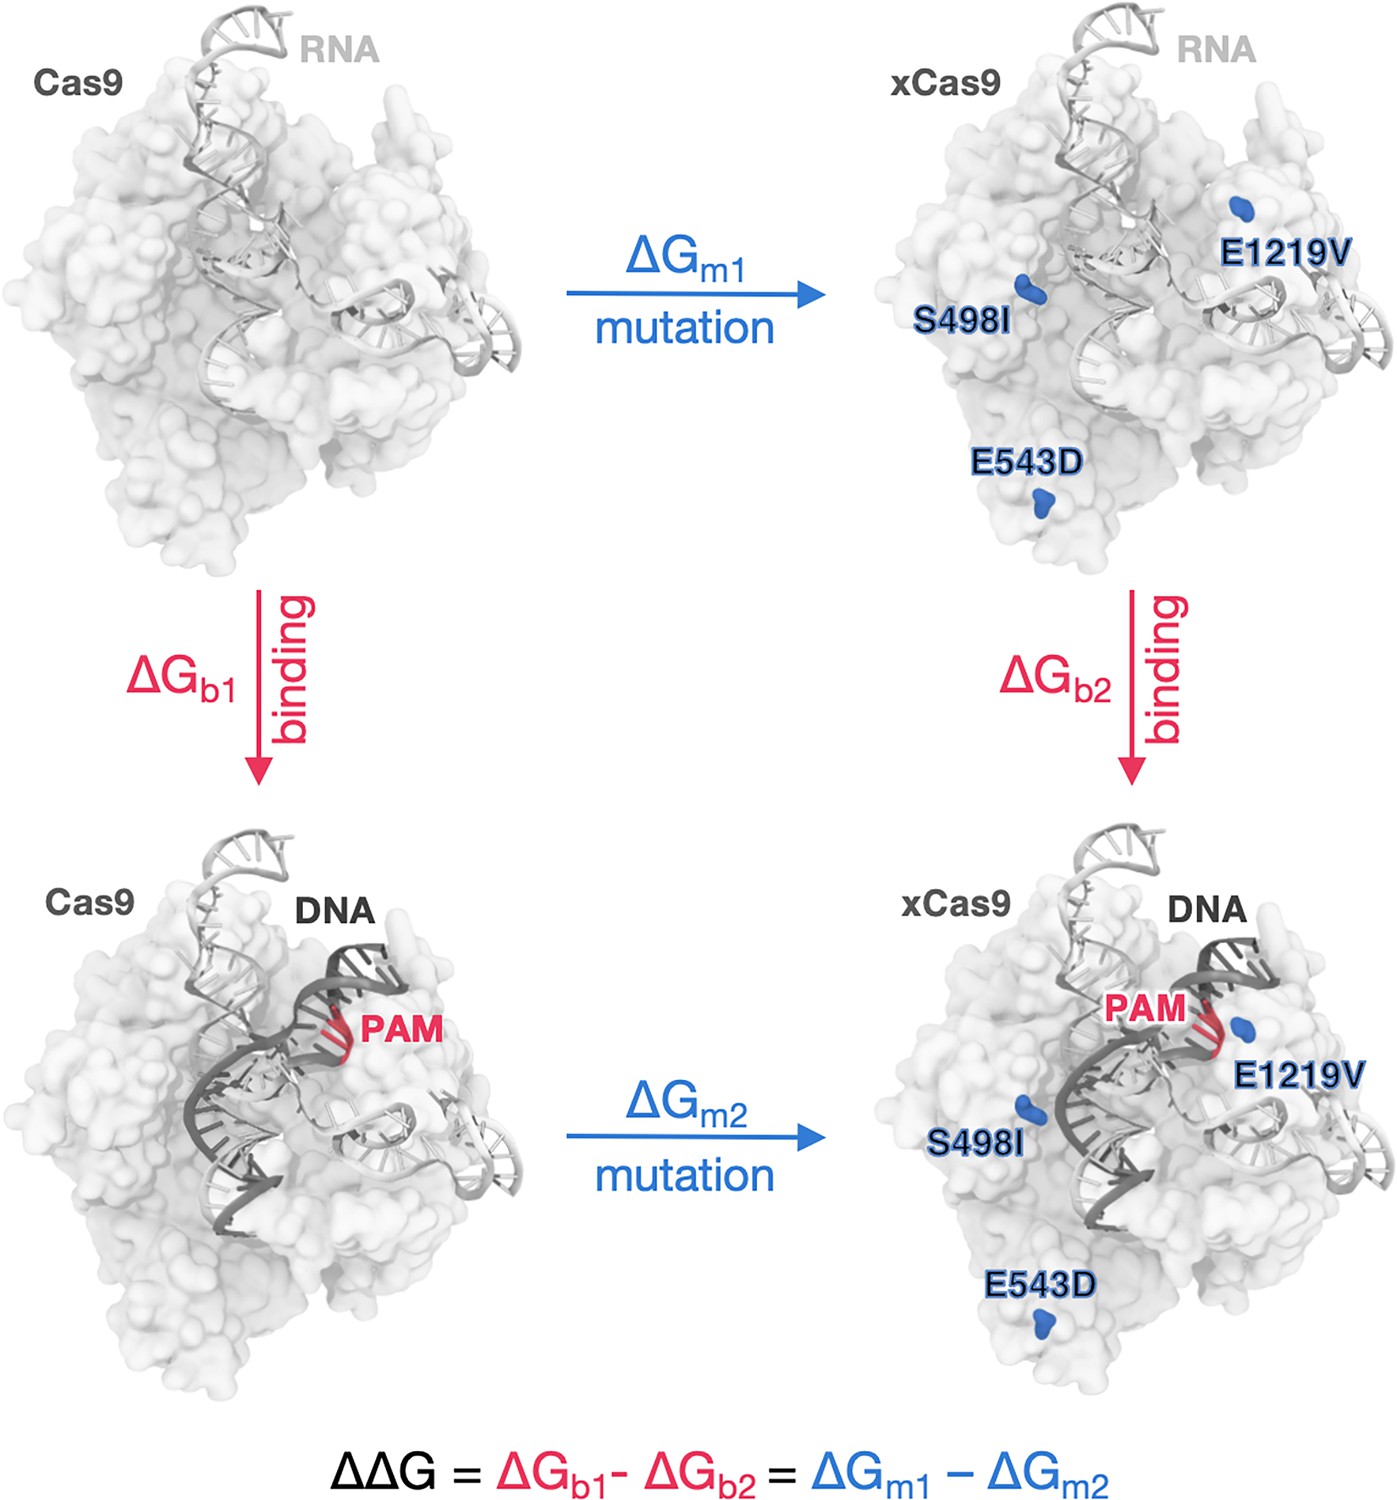
Thermodynamic cycle.
Thermodynamic cycle used to calculate the difference in the DNA-binding free energy (ΔΔG) between Cas9 and its mutants, representing the contribution of each group of mutations (e.g. E480K, E543D, and E1219V in first cycle, moving from SpCas9 to xCas91) to the DNA-binding affinity (Cas9-RNA complex in light grey, DNA in charcoal, protospacer adjacent motif [PAM] highlighted in red). ΔΔG is obtained by subtracting the free energies of ‘alchemically’ transforming amino acid residues in the absence and the presence of DNA (ΔGm1 and ΔGm2, respectively).
Figure 4—figure supplement 2
Convergence of alchemical free energy calculations.
Convergence of the difference in the DNA-binding free energy (ΔΔG) between SpCas9 and its xCas9 mutants (i.e. for the transformations of SpCas9 → xCas91 (A), xCas91 → xCas92 (B), xCas92 → xCas93 (C)) with the length of the alchemical simulations, in the presence of a TGG (red), AAG (salmon), or GAT (pink) protospacer adjacent motif (PAM) sequence.
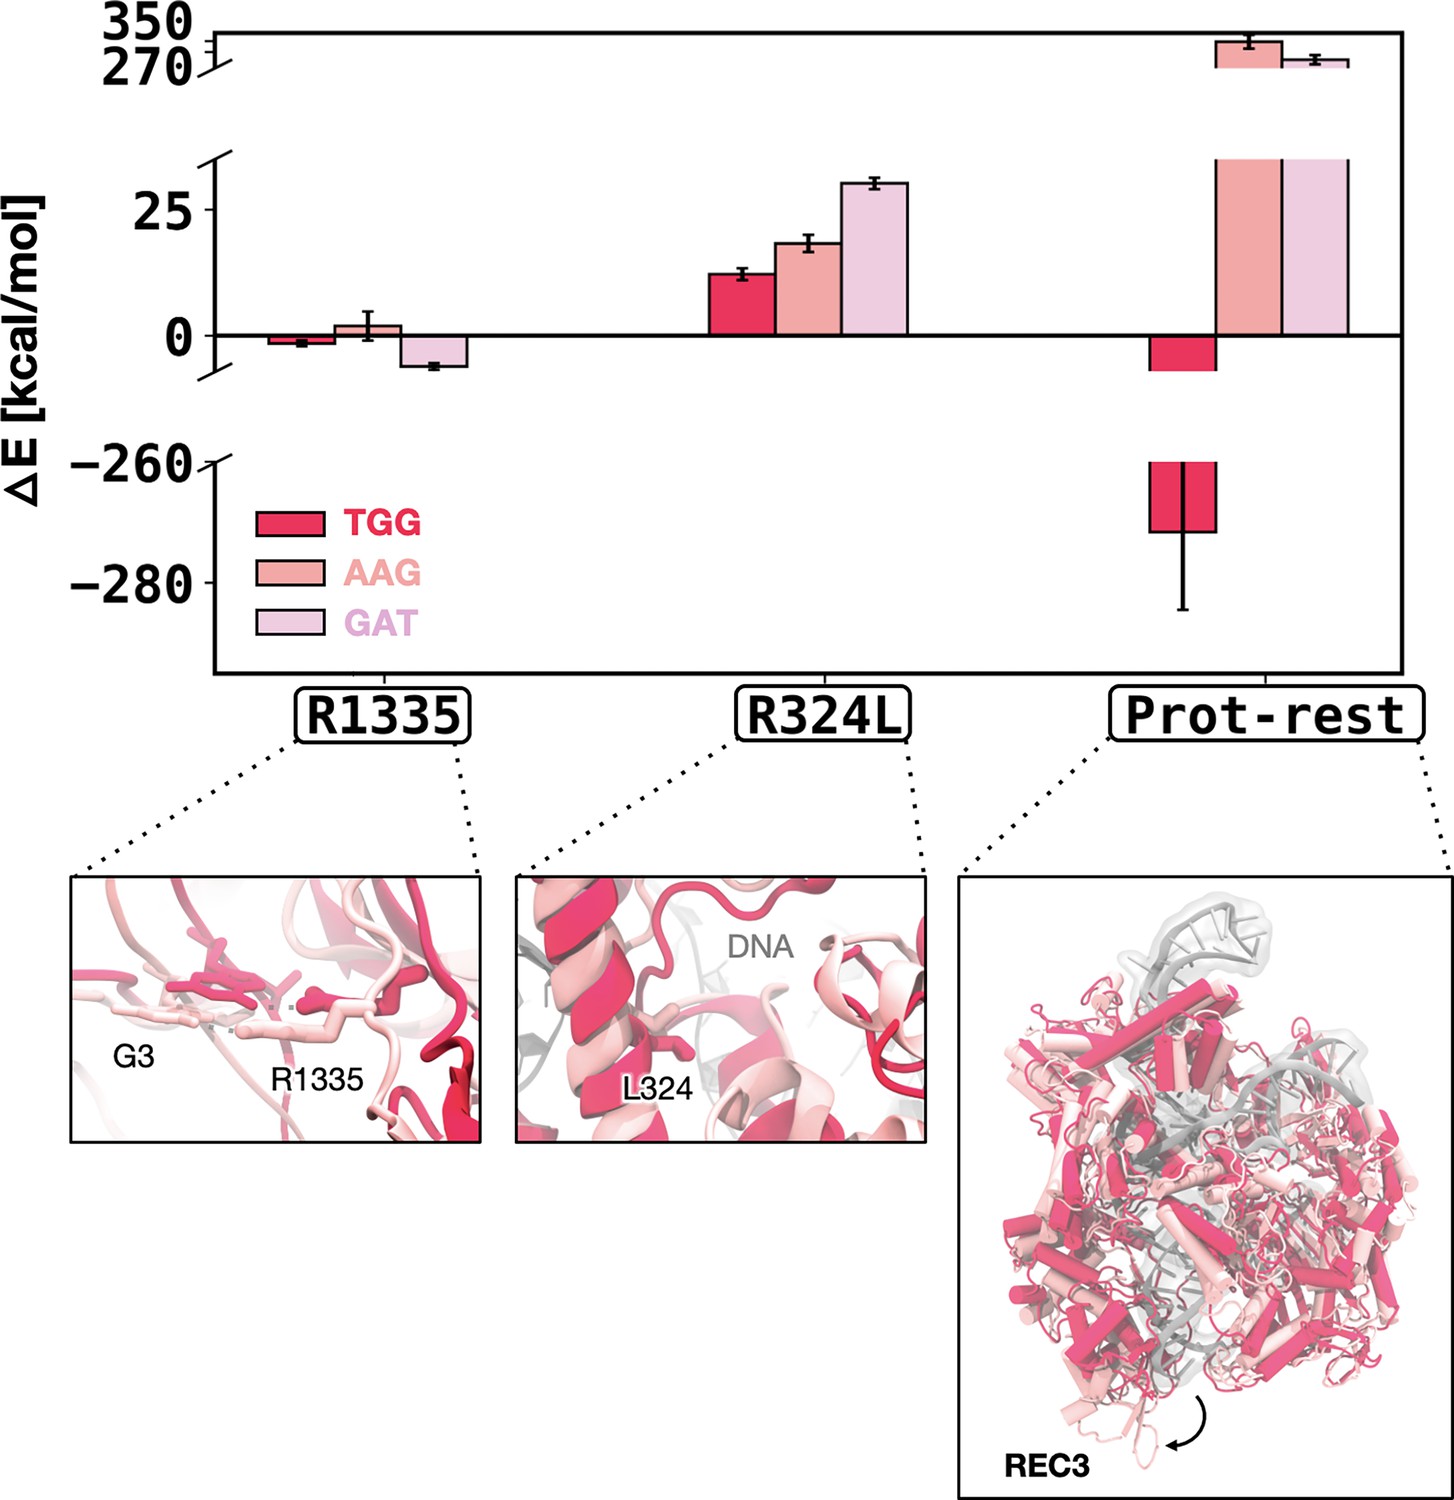
Figure 5 with 3 supplements
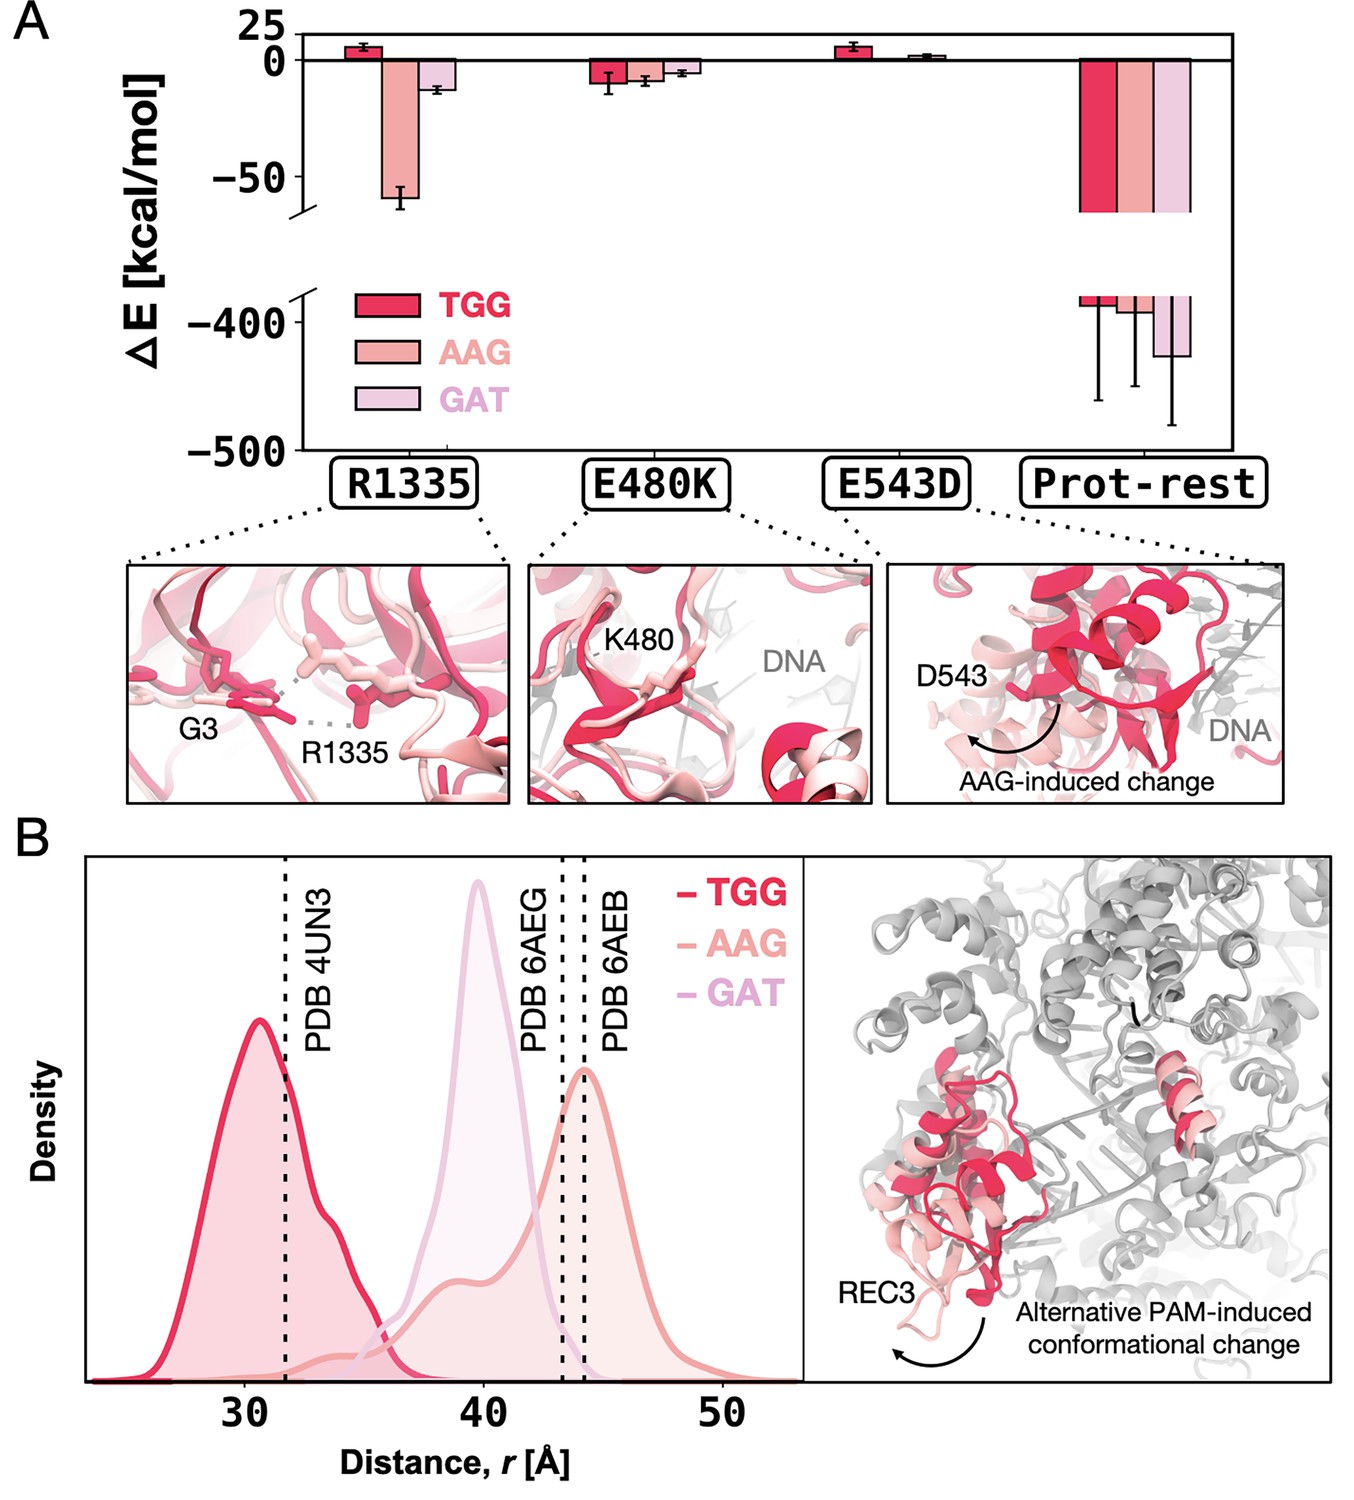
Enthalpic contribution to the DNA-binding free energy (ΔΔG).
(A) Enthalpic contribution to the ΔΔG of DNA binding while transitioning from SpCas9 to xCas91 in the presence of the TGG (red) and AAG (salmon), and GAT (pink) protospacer adjacent motif (PAM) sequences, computed as the average changes in the interaction energy (ΔE) between selected amino acid residues and the DNA. The ΔE is also computed as the overall interaction energy between the rest of the protein (prot-rest, without the selected residues) and the DNA. Error bars were computed by averaging the results from different segments of the given trajectory (details in Materials and methods). (B) Probability density of the distance () between the centres of mass (COMs) of the REC3 and HNH domains from molecular dynamics simulations of SpCas9 (PDB 4UN31) incorporating the xCas9 mutations in the presence of TGG (red) and AAG (pink) PAM sequences. Data from ~6 μs of aggregate sampling for each system. The values of the distance in the X-ray structures of SpCas9 (PDB 4UN3, 31.6 Å) and xCas9 bound to AAG (PDB 6AEB, 43.8 Å) and GAT (PDB 6AEG, 43.4 Å) are indicated using a vertical dashed bar. The statistical significance between the two distributions was evaluated using Z-score statistics with a two-tailed hypothesis (p-value was less than 0.0001). The distance () between the REC3 and HNH COMs is indicated on the three-dimensional structure of Cas9 (right), highlighting the AAG-induced conformational change using an arrow (Figure 5—figure supplement 1, Figure 5—figure supplement 2, and Figure 5—figure supplement 3).
Figure 5—figure supplement 1
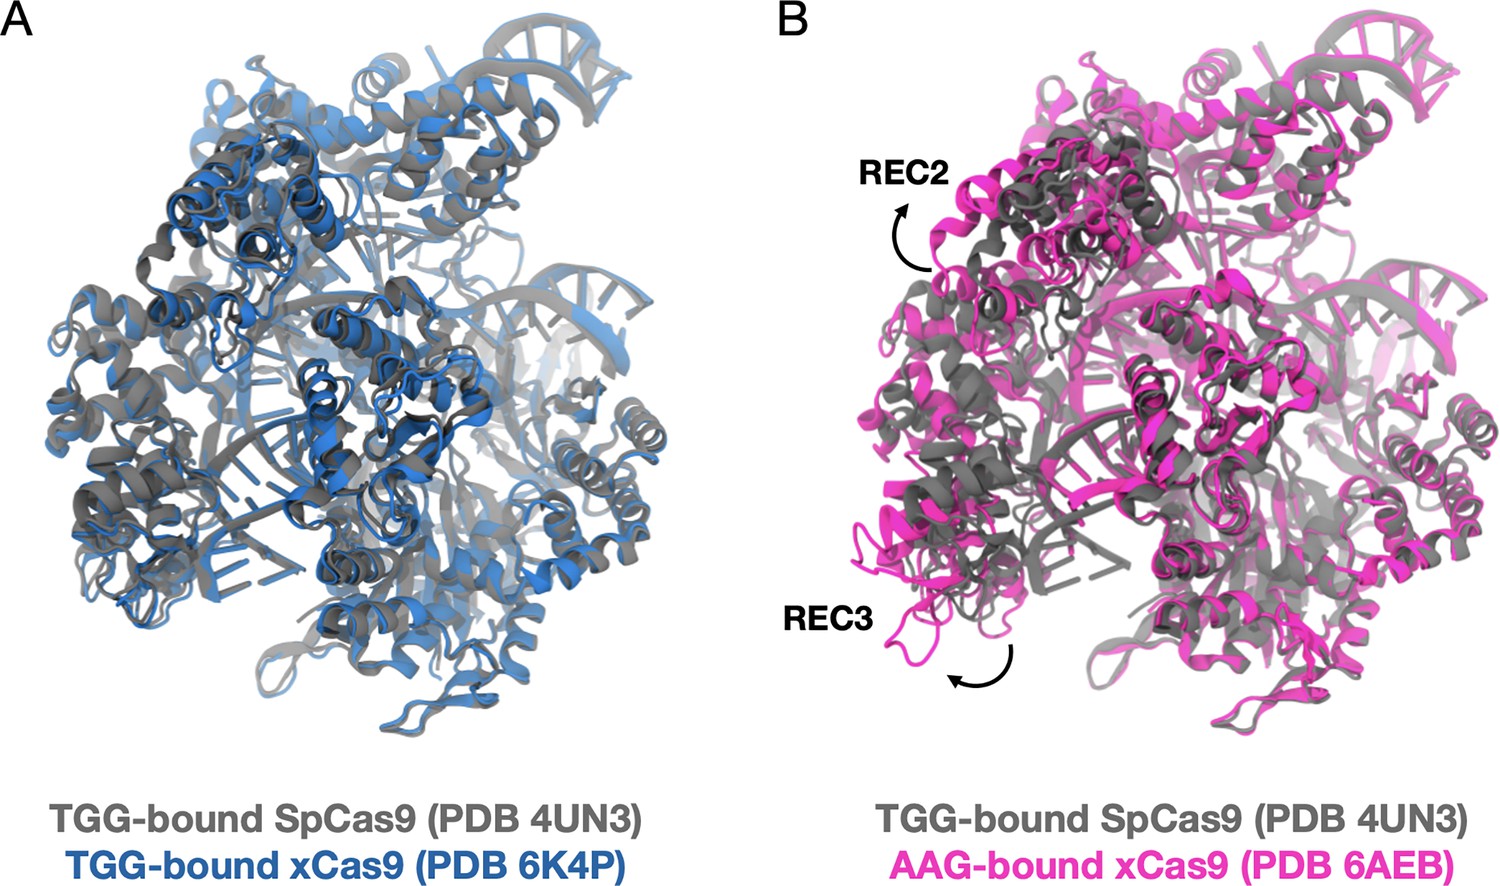
Comparison of existing structural data.
Superimposition of the X-ray crystal structure of the TGG-bound SpCas9 (PDB 4UN3) with the TGG-bound xCas9 (PDB 6K4P2) (A), and with the AAG-bound xCas9 (PDB 6AEB) (B). There is no substantial conformational difference between SpCas9 and xCas9 bound to a TGG protospacer adjacent motif (PAM) (backbone RMSD = 0.80 Å). When xCas9 binds AAG, the REC3 domain displays an opening (outbound movement) with respect to SpCas9 (resulting in a protein backbone RMSD = 3.31 Å). This suggests that the binding of PAM induces a positive allosteric effect, in line with the notion that PAM acts as an allosteric effector of Cas9 dynamics.
Figure 5—figure supplement 2
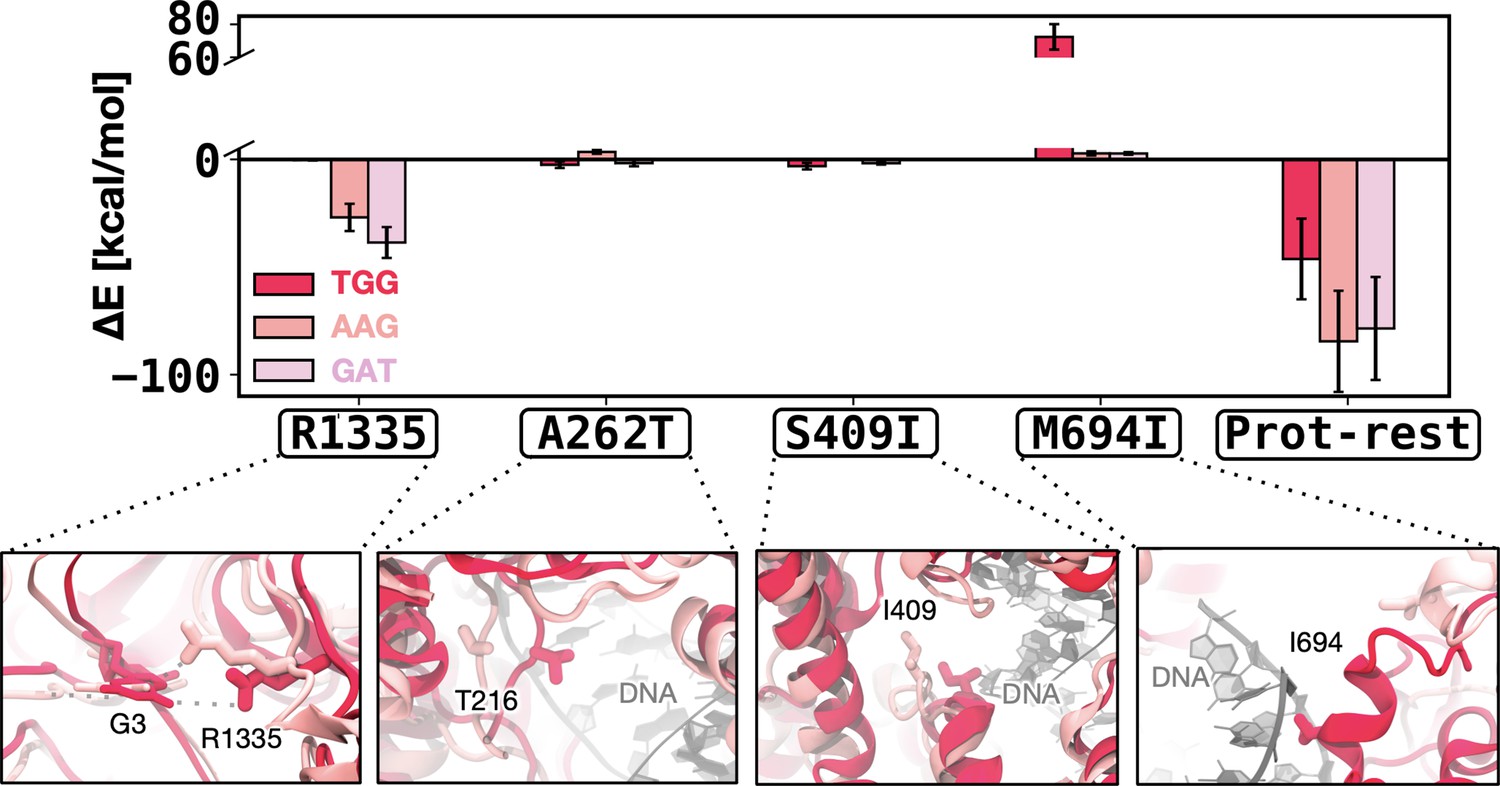
Enthalpic contribution to the DNA-binding free energy for the xCas91 → xCas92 transformation.
Enthalpic contribution to the DNA-binding free energy (ΔΔG) while transitioning from xCas91 to xCas92 in the presence of the TGG (red), AAG (salmon), and GAT (pink) protospacer adjacent motif (PAM) sequences, computed as the average changes in the interaction energy (ΔE) between selected amino acid residues and the DNA. The ΔE is also computed as the overall interaction energy between the rest of the protein (prot-rest, without the selected residues) and the DNA. Error bars were computed by averaging the results from different segments of the given trajectory (details in Materials and methods). When transitioning from xCas91 to xCas92, R1335 provides an increased enthalpic contribution in the presence of the AAG PAM sequence, which facilitates its recognition. The M694I mutation reduces the unfavourable contribution in the presence of the AAG. The overall interaction energy for the rest of the protein (prot-rest) is more favourable for the AAG-bound system.
Figure 5—figure supplement 3
Enthalpic contribution to the DNA-binding free energy for the xCas92 → xCas93 transformation.
Enthalpic contribution to the DNA-binding free energy (ΔΔG) while transitioning from xCas92 to xCas93 in the presence of the TGG (red), AAG (salmon), and GAT (pink) protospacer adjacent motif (PAM) sequences, computed as the average changes in the interaction energy (ΔE) between selected amino acid residues and the DNA. The ΔE is also computed as the overall interaction energy between the rest of the protein (prot-rest, without the selected residues) and the DNA. Error bars were computed by averaging the results from different segments of the given trajectory (details in Materials and methods). In this transition, no significant difference is observed in the ΔE for R1335 and R324L in the presence of AAG or TGG PAM sequence. The overall interaction energy between the rest of the protein and DNA (prot-rest) is highly favourable in the presence of the TGG PAM sequence. This is notable considering that the overall ΔE between the TGG- and AAG-bound systems was negligible in the first cycle (Figure 5A), while more favourable for AAG in the second cycle (Figure 5—figure supplement 2). This indicates that the third evolution cycle highly adapts to binding TGG (further discussion in the main text).
Additional files
Download links
A two-part list of links to download the article, or parts of the article, in various formats.
Downloads (link to download the article as PDF)
Open citations (links to open the citations from this article in various online reference manager services)
Cite this article (links to download the citations from this article in formats compatible with various reference manager tools)
Flexibility in PAM recognition expands DNA targeting in xCas9
eLife 13:RP102538.
https://doi.org/10.7554/eLife.102538.3


