Diversity and functional specialization of oyster immune cells uncovered by integrative single-cell level investigations
- IHPE, Univ Montpellier, CNRS, Ifremer, Univ Perpignan Via Domitia, France
- Ifremer, IRD, Institut Louis-Malardé, Univ Polynésie française, UMR 241 SECOPOL, French Polynesia
Figures
Figure 1 with 1 supplement
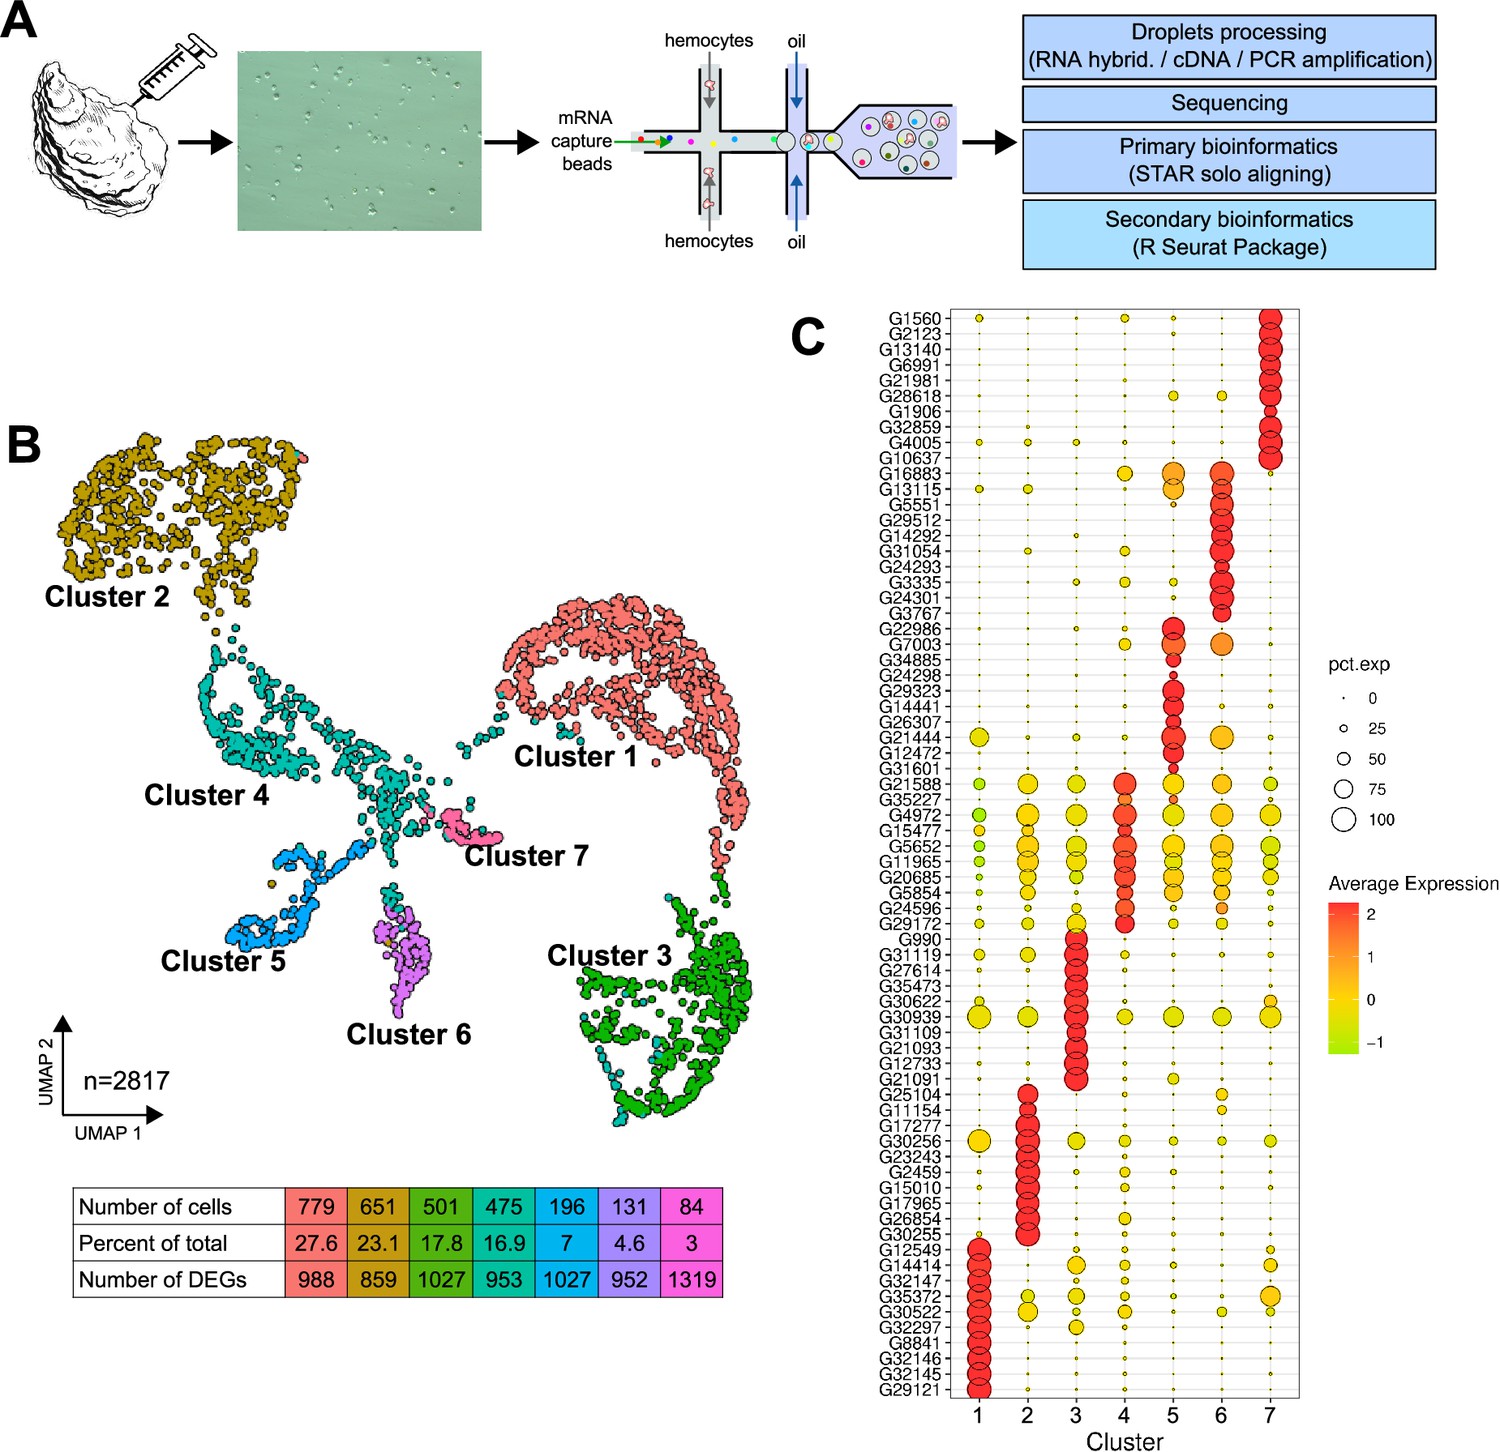
Single-cell RNA sequencing (scRNA-seq) analysis of C.gigas circulating hemocytes reveals seven transcriptomic cell clusters.
(A) Schematic of the scRNA-seq 10 X Genomics Chromium microfluidic technology and bioinformatics processing workflow used. Dissociated hemocytes were collected from a pathogen-free oyster and encapsulated in droplets for processing. After sequencing, the data were processed bioinformatically. (B) Uniform Manifold Approximation and Projection (UMAP) plot for dimensional reduction of the dataset and summary of cells and the number of Differentially Expressed Genes (DEGs) in each cluster. The table shows the characteristics (number of cells, percentage of total cells and number of Differentially Expressed Genes in each cluster) of the seven clusters identified. (C) Dot plot representing the ten most enriched DEGs per cluster based on average expression (avg_log2FC). The color gradient of the dot represents the expression level, while the size represents the percentage of cells expressing each gene per cluster.
Figure 1—figure supplement 1
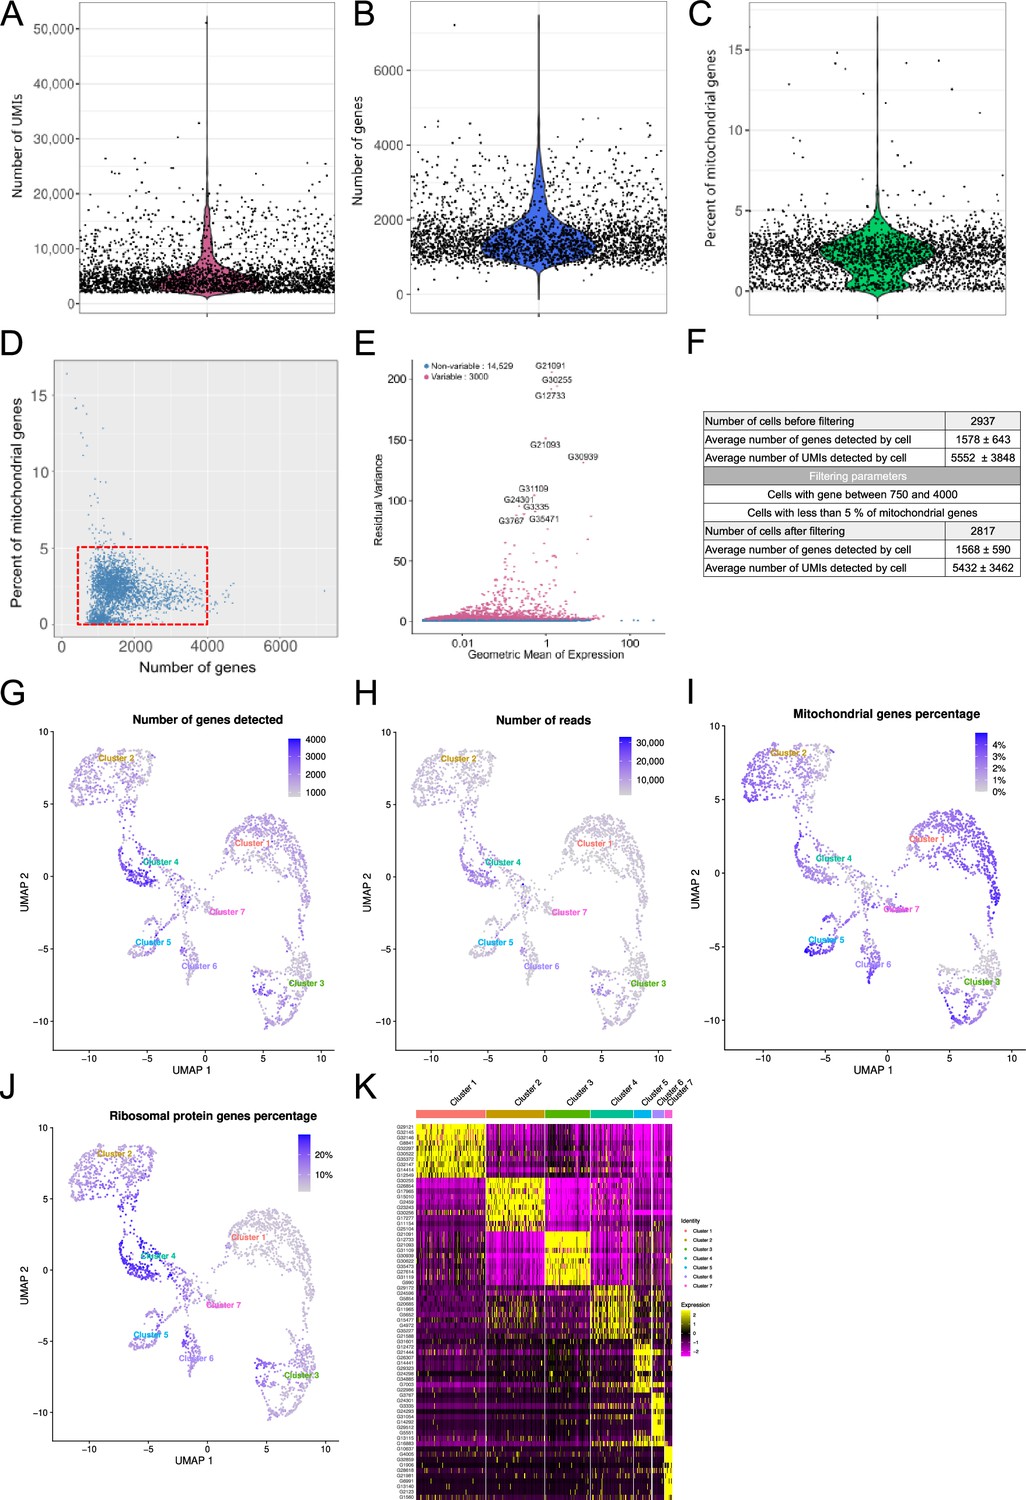
Single-cell RNA sequencing (ScRNA-seq) quality control metrics.
Distribution of (A) unique molecular identifiers (UMIs), (B) genes and (C) percentage of mitochondrial genes detected per cell. Each dot represents one cell. (D) Plot of the percentage of mitochondrial genes versus the number of genes detected in each cell. The red box represents the cells selected for further analysis (number of genes detected between 750 and 4000 and with a percentage of mitochondrial genes less than 5%) (E) The FindVariableFeatures() function was used to identify features with high cell-to-cell variation in the dataset to highlight the biological signal in the single-cell dataset. (F) Table summarizing some quality control metrics. The table shows the thresholds to remove poor quality cells (doublets or empty droplets). The number of cells, UMIs, and genes before and after filtering are shown. (G) Uniform Manifold Approximation and Projection (UMAP) plot of the cells with the number of expressed genes. (H) UMAP plot of the number of reads per cell. (I) UMAP plot of the percentage of mitochondrial genes in each cell. (J) UMAP graph of the percentage of ribosomal protein transcripts in each cell. (K) Heatmap showing the top 10 enriched marker genes in each cell per cluster as determined by FindAllMarkers() function in Seurat after secondary bioinformatic processing, corresponding to clusters in UMAP plots from Figure 1B, ranked by log2FC.
Figure 2 with 1 supplement
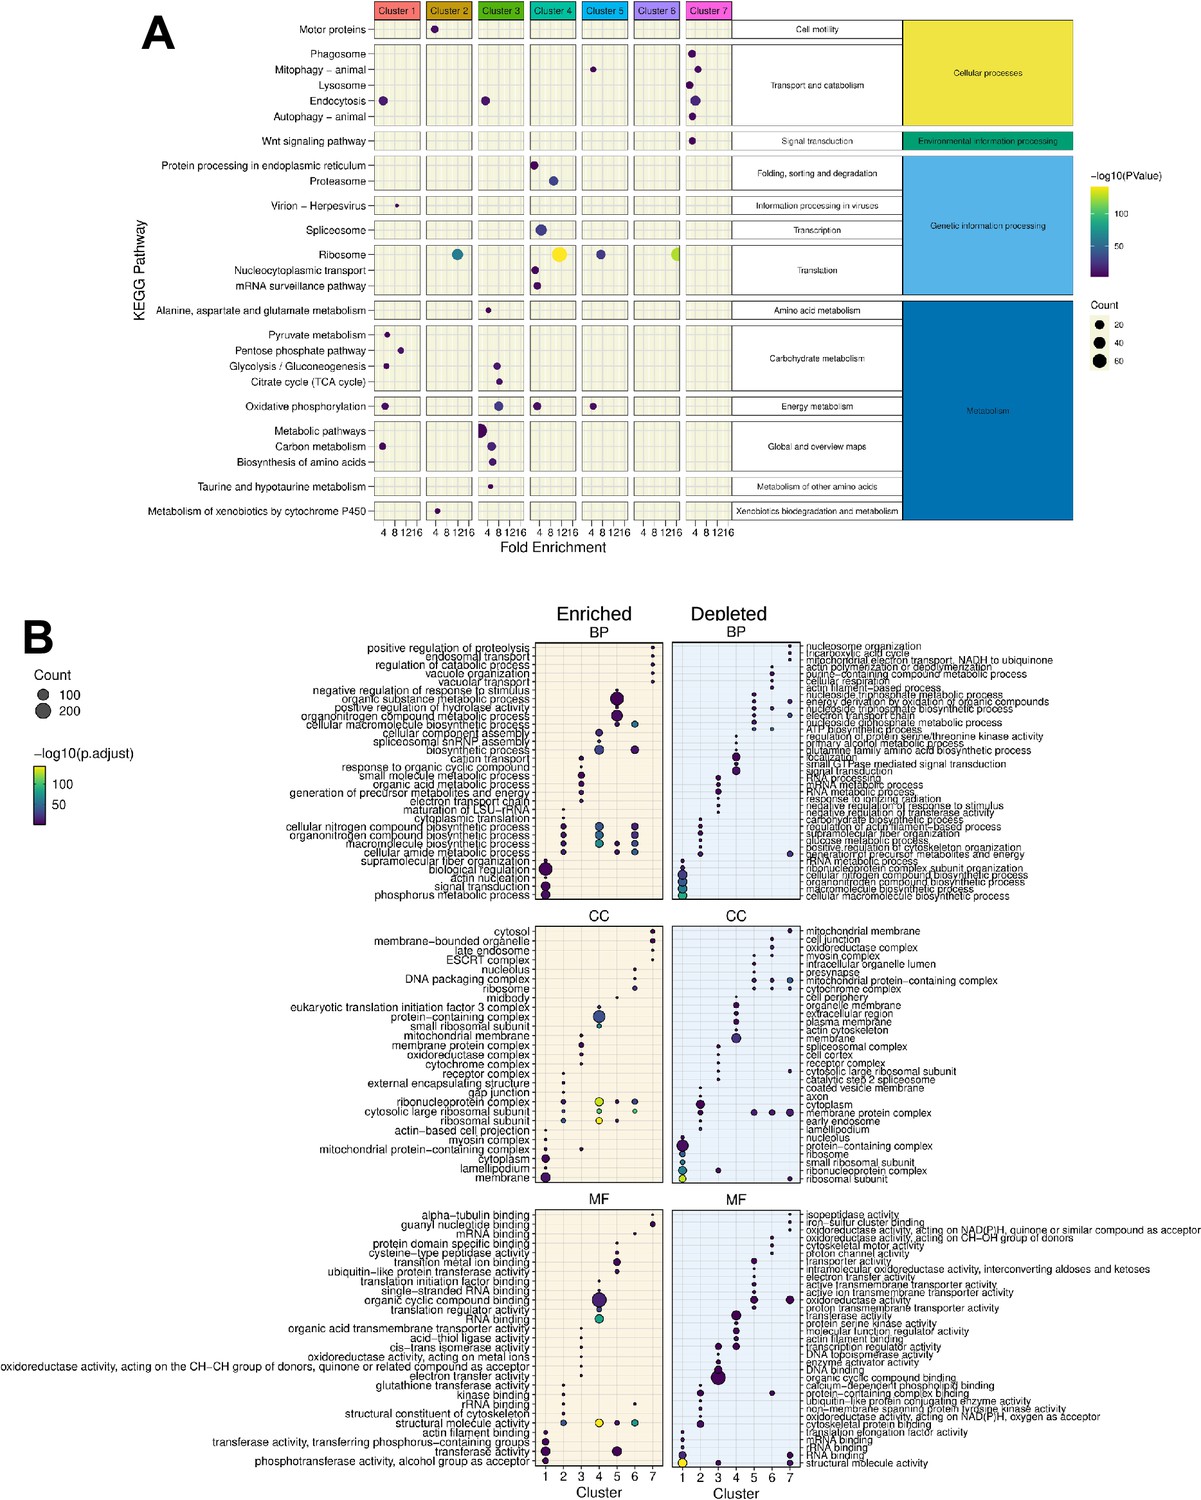
KEGG and Gene Ontology analysis of the gene signature in each cluster.
(A) A synthetic representation of the KEGG pathway analysis is shown. Colored columns represent the seven transcriptomic clusters. Each row is a KEGG pathway, the colored dot represents the -log(p-value) and the dot size represents the number (count) of enriched genes in each pathway category. The fold enrichment is shown on the x-axis. Panels (B) show the results of Gene Ontology terms (GO-terms) for Biological Processes (BP), Cellular Components (CC), and Molecular Functions (MF), respectively, obtained with the genes of each cluster (Absolute value Log2FC >0.25 and significant p-value <0.001) using rank-based gene ontology analysis (RBGOA) (p-value ≤ 0.001) for three different ontology universes. Each panel corresponds to one ontology universe, and the analysis highlights enriched and depleted terms. The dot size indicates the proportion of significant GO-terms and the gradient scale the p-adjusted value.
Figure 2—figure supplement 1
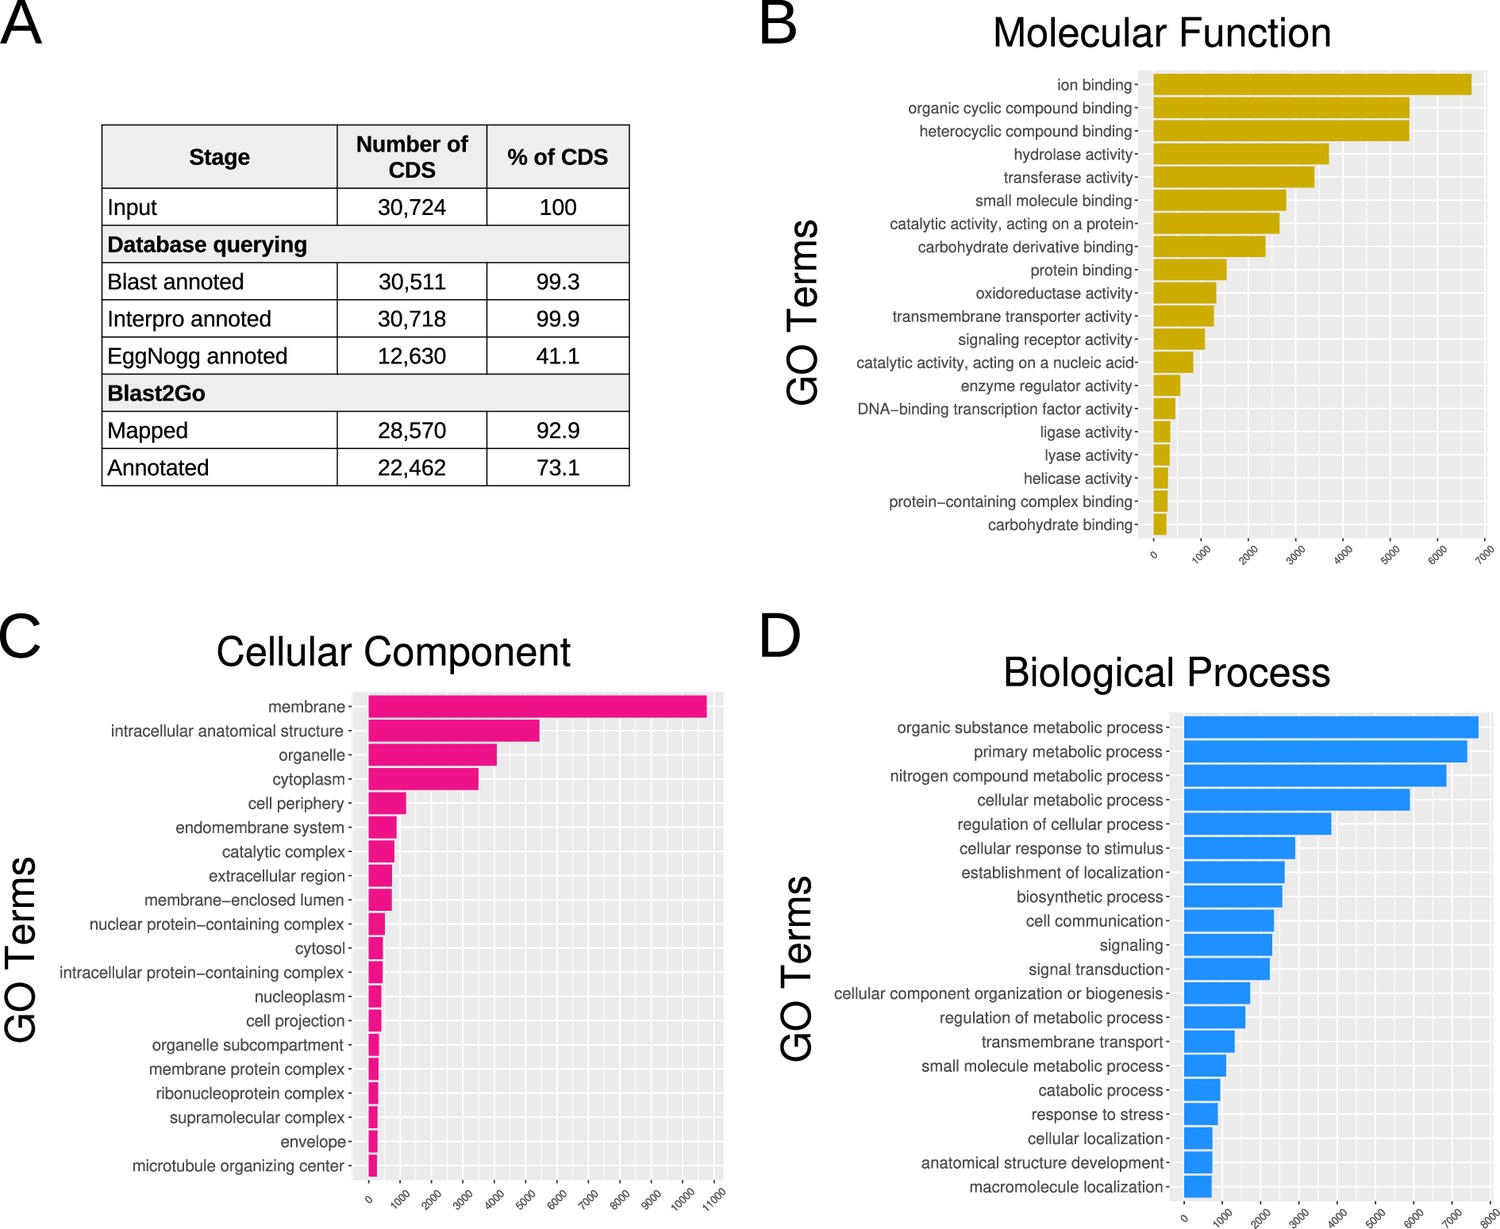
Results of the C. gigas genome re-annotation.
(A) The number and percentage of Coding DNA Sequences (CDS) with valid annotation after each annotation step are shown. A BLAST query was performed against the TrEMBL/Uniprot database and InterproScan annotation against Pfam, PrositeSiteProfiles, CDD, TIGRFAM, PRINTS, SMART, SUPERFAMILY, and Hamap databases. Blast and InterProScan results were compiled and processed using Blast2Go. A first mapping step was used to enrich the Blast result with Gene Ontology (GO)-terms, and the annotation step was used to optimize and validate the GO-terms annotations. (B), (C), and (D) show the distribution of the various categories of GO-terms across the three primary domains of Gene Ontology: Molecular Function, Cellular Component, and Biological Process, respectively.
Figure 3 with 2 supplements
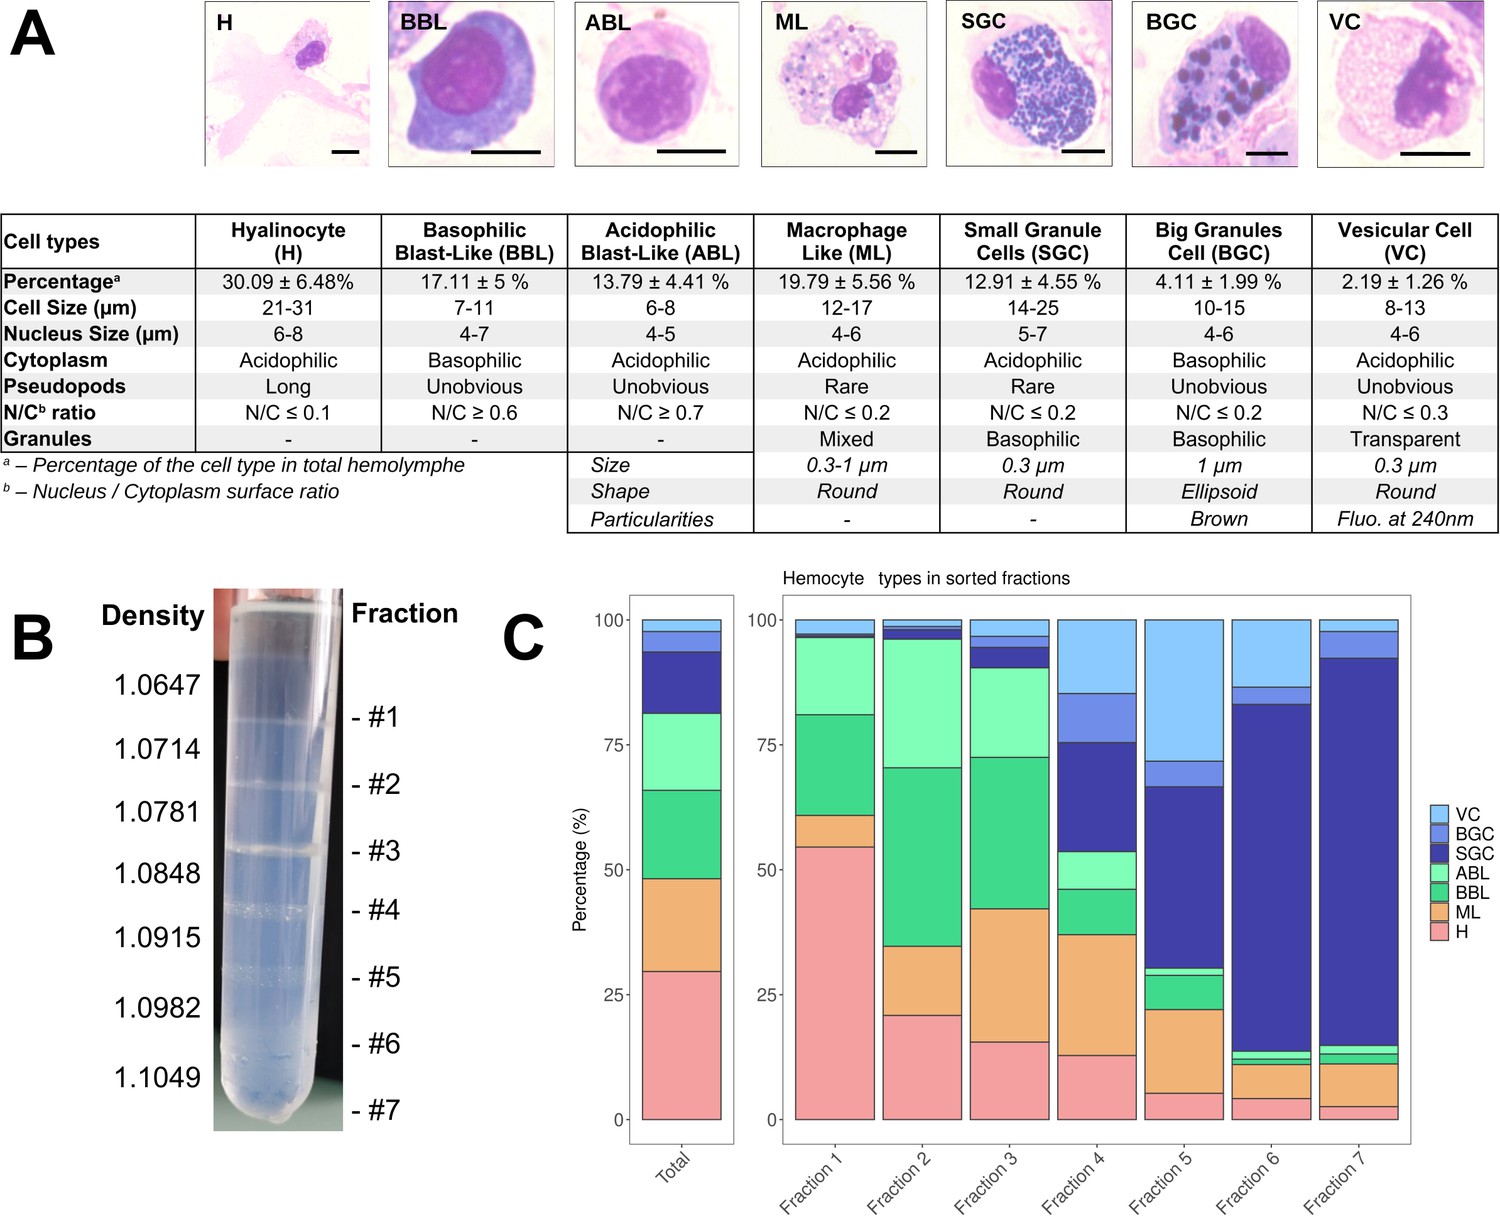
C. gigas naive hemocyte formula and Percoll gradient hemolymph fractionation.
(A) Morphology, percentages, and characteristics of the seven cell types identified by MCDH staining. (H): Hyalinocyte, (ML): Macrophage Like, (BBL): Basophilic Blast Like cell, (ABL): Acidophilic Blast Like cell, (SGC): Small Granule Cell, (BGC): Big Granule Cell, (VC): Vesicular Cell. Scale bar: 5 µm. For the ML, SGC, BGC, and VC hemocyte types, size refers to the average granule diameter, shape describes the morphology of the granules (e.g. round, ellipsoid), and particularities highlight distinguishing features such as granule color or fluorescence properties observed under specific staining or imaging conditions. (B) Sorting of hemocytes on a discontinuous Percoll gradient. Seven fractions were identified along the gradient at the top of each density cushion (from d=1.0647 at #1 to d=1.1049 at #7). (C) Representation of the average values (from 5 different fractionation experiments) of the different hemocyte types in the seven percoll gradient fractions compared to the average hemolymph composition of a naive oyster (Total). (VC): Vesicular Cells, (BGC): Big Granule Cells, (SGC): Small Granule Cells, (ABL): Acidophilic Blast Like cells, (BBL): Basophilic Blast Like cells, (ML): Macrophage Like cells and (H): Hyalinocytes, respectively. (Figure 3—figure supplement 2 for statistics).
Figure 3—figure supplement 1
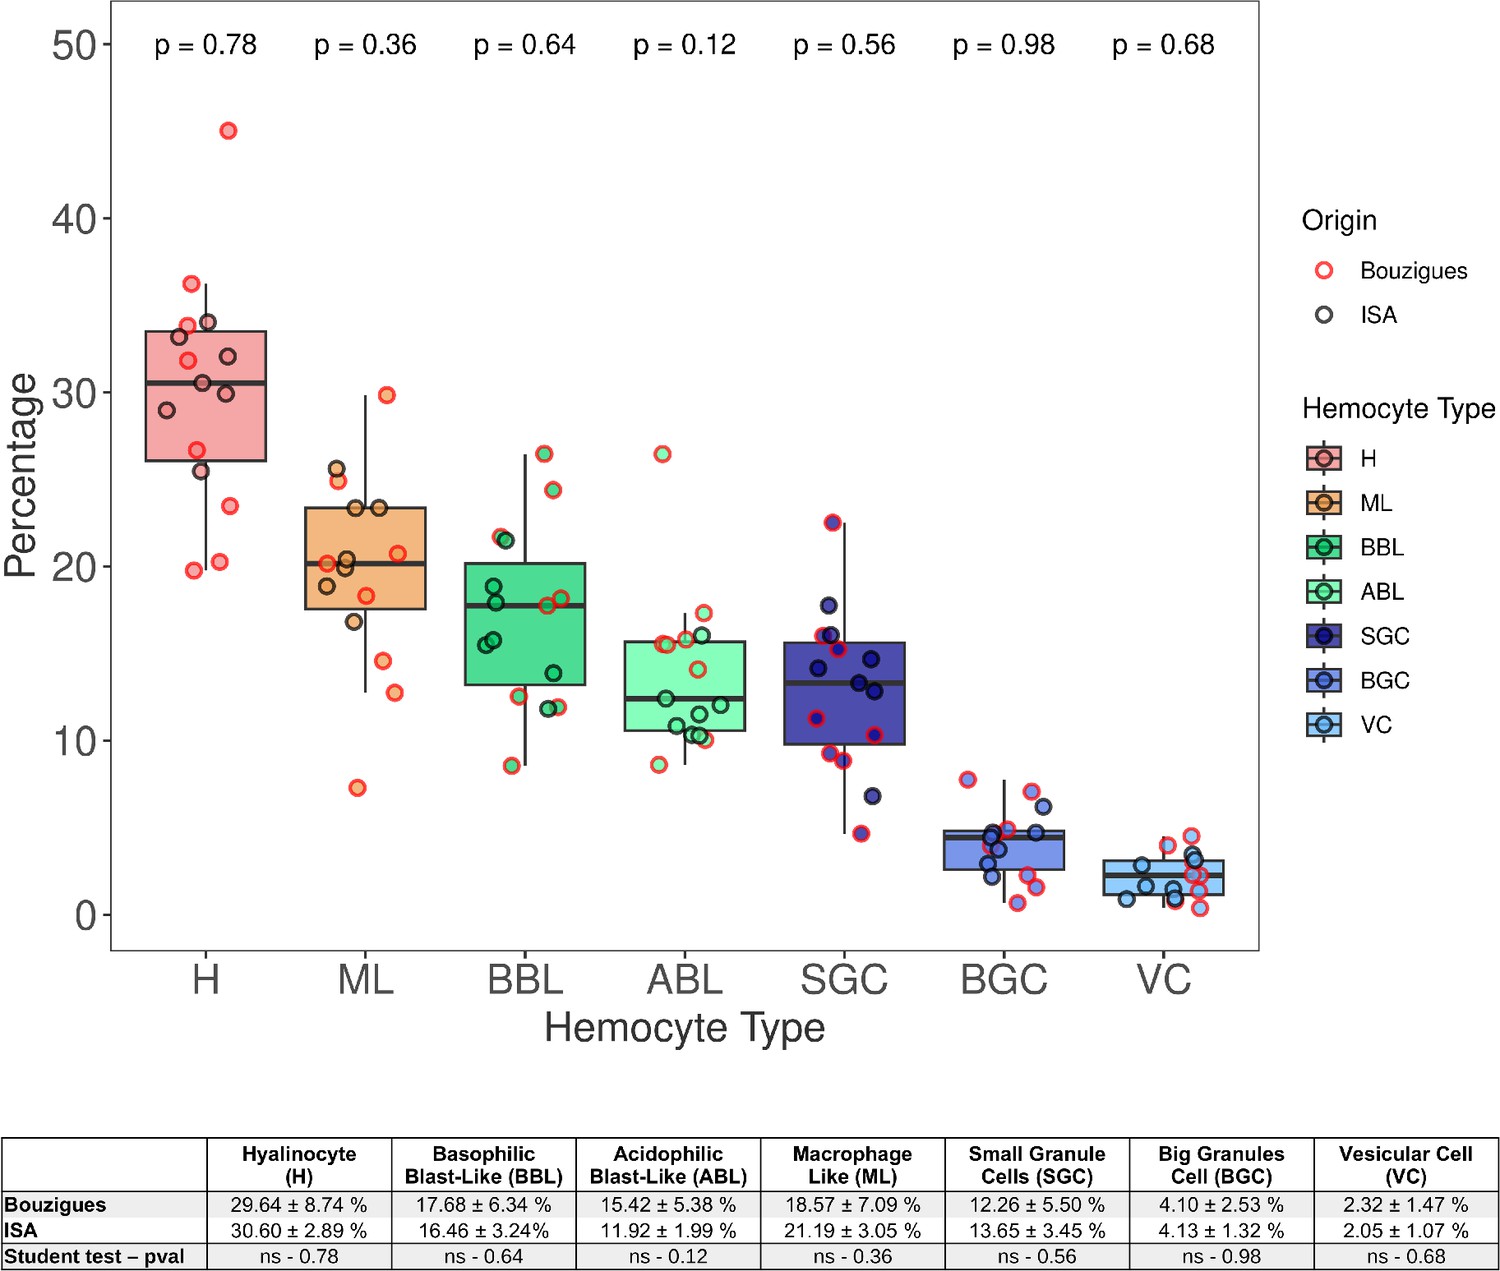
Distribution of hemocyte populations in the hemolymph of oysters from ISA and Thau lagoon origins.
Hemolymph was collected from oysters raised in ISA (Ifremer Standardized Animals, La Tremblade, GPS: 45.7981624714465,–1.150171788447683) and Thau lagoon (Bouzigues, GPS: 43.44265228308842, 3.6359883059292057) (n=16). Hemocytes were plated on slides via cytospin centrifugation and stained using MCDH. The proportions of seven hemocyte types were analyzed: H (Hyalinocytes), ML (Macrophage-Like cells), BBL (Basophilic Blast-Like cells), ABL (Acidophilic Blast-Like cells), SGC (Small Granule Cells), BGC (Big Granule Cells), and VC (Vesicular Cells). The data show heterogeneity in the hemocyte composition across individual oysters and cell types. No significant differences were observed between oysters from the two origins (p-value >0.05). The table below the graph provides a detailed breakdown of the mean percentages and standard deviations of each hemocyte type across the two oyster groups, highlighting the variability observed within and between these populations.
Figure 3—figure supplement 2
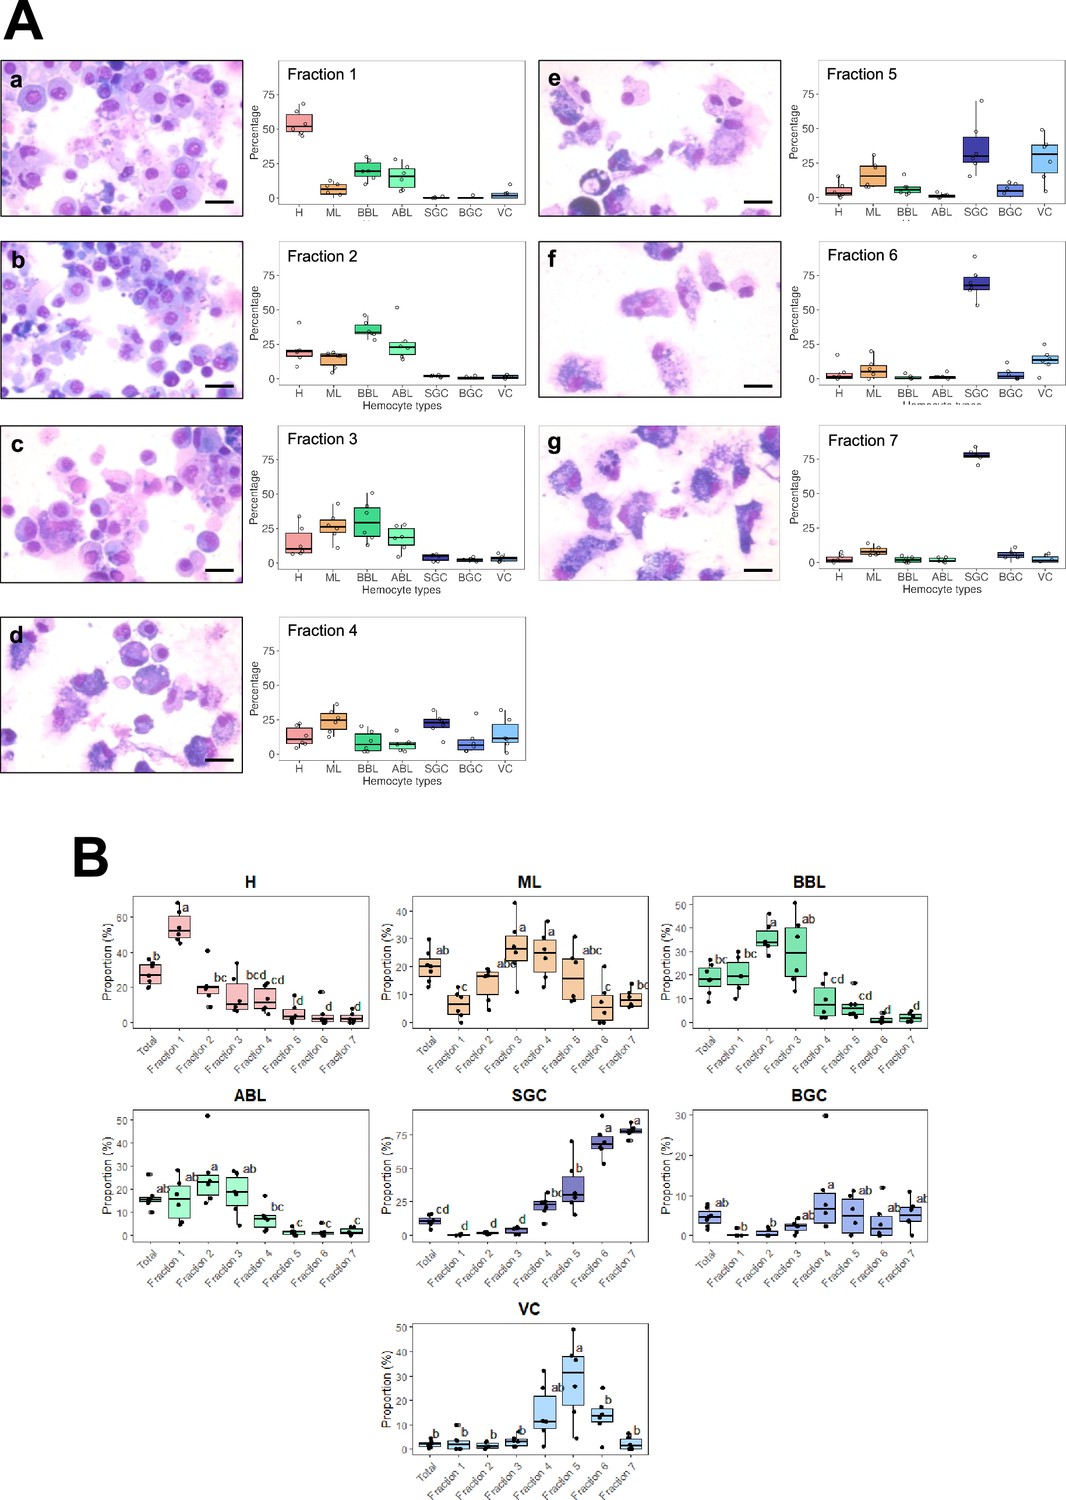
Statistical significance of enrichment in different hemocyte types in Percoll gradient fractions.
(A) (a,b,c, d, e,f), and (g): MCDH staining of cells from the 7 fractions isolated from the percoll gradient in (B). Scale bar: 10 µm. Fraction 1–7: Quantification of the different types of hemocytes found in each of the seven fractions from five independent fractionation experiments. (B) Statistical significance of enrichment of different hemocyte types in Percoll gradient fractions. Results are from six independent experiments. Statistical significance is indicated by letters, as different letters indicate a significant difference between enrichments of cell types within the Percoll density gradient fractions (ANOVA, Tukey’s test, p-value <0.05). Hyalinocytes (H) were significantly enriched in the first fraction compared to the other fractions and compared to unsorted hemocytes. However, they were significantly depleted in fractions 4, 5, 6, and 7 compared to unsorted hemocytes. Macrophage-like cells (ML) were significantly enriched in fractions 3 and 4 compared to fractions 1, 6, and 7. They were depleted in fraction 1 compared to unsorted hemocytes. Acidophilic blasts (ABL) were significantly depleted in fractions 4, 5, 6, and 7 compared to unsorted hemocytes. Basophilic blasts (BBL) were significantly enriched in fractions 2 and 3 compared to fractions 4, 5, 6, and 7 and in fraction 1 compared to fractions 6 and 7. Compared to unsorted hemocytes, basophilic blasts (BBL) were significantly enriched in fraction 2 and depleted in fractions 6–7. Small granule cells (SGC) were significantly depleted in fractions 1, 2, and 3 compared to fractions 4, 5, 6, and 7, and also significantly depleted in fractions 4 and 5 compared to fractions 6 and 7. In addition, small granule cells (SGC) were significantly enriched in fractions 5, 6, and 7 compared to unsorted hemocytes. The distribution of the big granule cells (BGC) showed a significant enrichment in fraction 4, compared to fractions 1 and 2, but no significant changes were observed with unsorted hemocytes. Vesicular cells (VC) were enriched in fraction 5 compared to fractions 1, 2, 3, 6, 7, and unsorted hemocytes in fractions 1, 2, and 3 compared to fraction 5 and enriched in fraction 5 compared to fraction 7 and unsorted hemocytes.
Figure 4 with 1 supplement
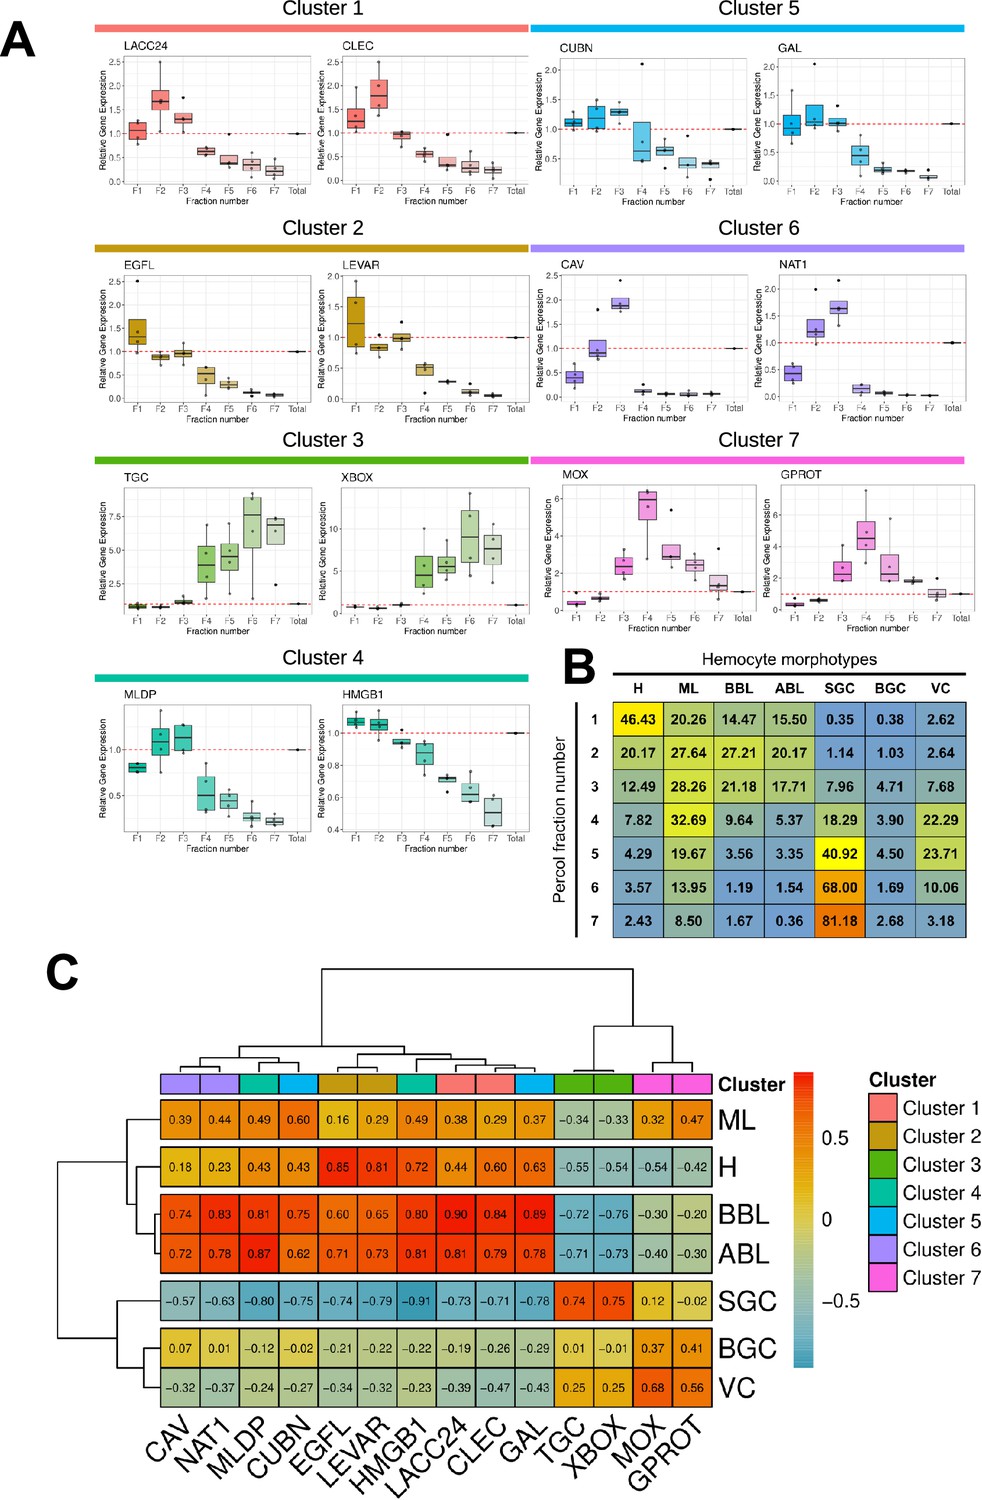
Characterization of molecular markers specific to the different hemocyte morphotypes.
(A) Relative gene expression level of the 14 markers in the various fractions after gradient density sorting. The graphs show the relative expression of genes compared to their expression in total hemocytes in the various fractions (red dotted line). Relative gene expression levels were normalized to the reference gene Cg-rps6 and the 2-ΔCt method was used to calculate relative expression levels, where ΔCt represents the difference between the target gene’s Ct value and the reference gene’s Ct value. Standard deviations were calculated based on four independent experiments. (B) Average percentage of each hemocyte type in the seven Percoll gradient fractions used to quantify marker gene expression by qPCR. (C) Correlation matrix between the relative gene expression of each marker gene in each fraction and the percentage of each hemocyte type in the same fractions. Values and color scale represent the Pearson correlation coefficient (r) ranging from –1 (inverse correlation) to +1 (full correlation). (H): Hyalinocyte, (ML): Macrophage Like, (BBL): Basophilic Blast Like cell, (ABL): Acidophilic Blast Like cell, (SGC): Small Granule Cell, (BGC): Big Granule Cell, (VC): Vesicular Cell. LACC24: Laccase 24, CLEC: C-type lectin domain-containing protein, EGFL: EGF-like domain-containing protein 8, LEVAR: Putative regulator of levamisole receptor-1, (TGC): TGc domain-containing protein, XBOX: X-box binding protein-like protein, MLDP: ML domain-containing protein, HMGB1: High mobility group protein B1, CUBN: Cubilin, (GAL): Galectin, (CAV): Caveolin, (NAT1): Natterin-1, (MOX): DBH-like monooxygenase protein 1, GPROT: G protein receptor F1-2 domain-containing protein.
Figure 4—figure supplement 1
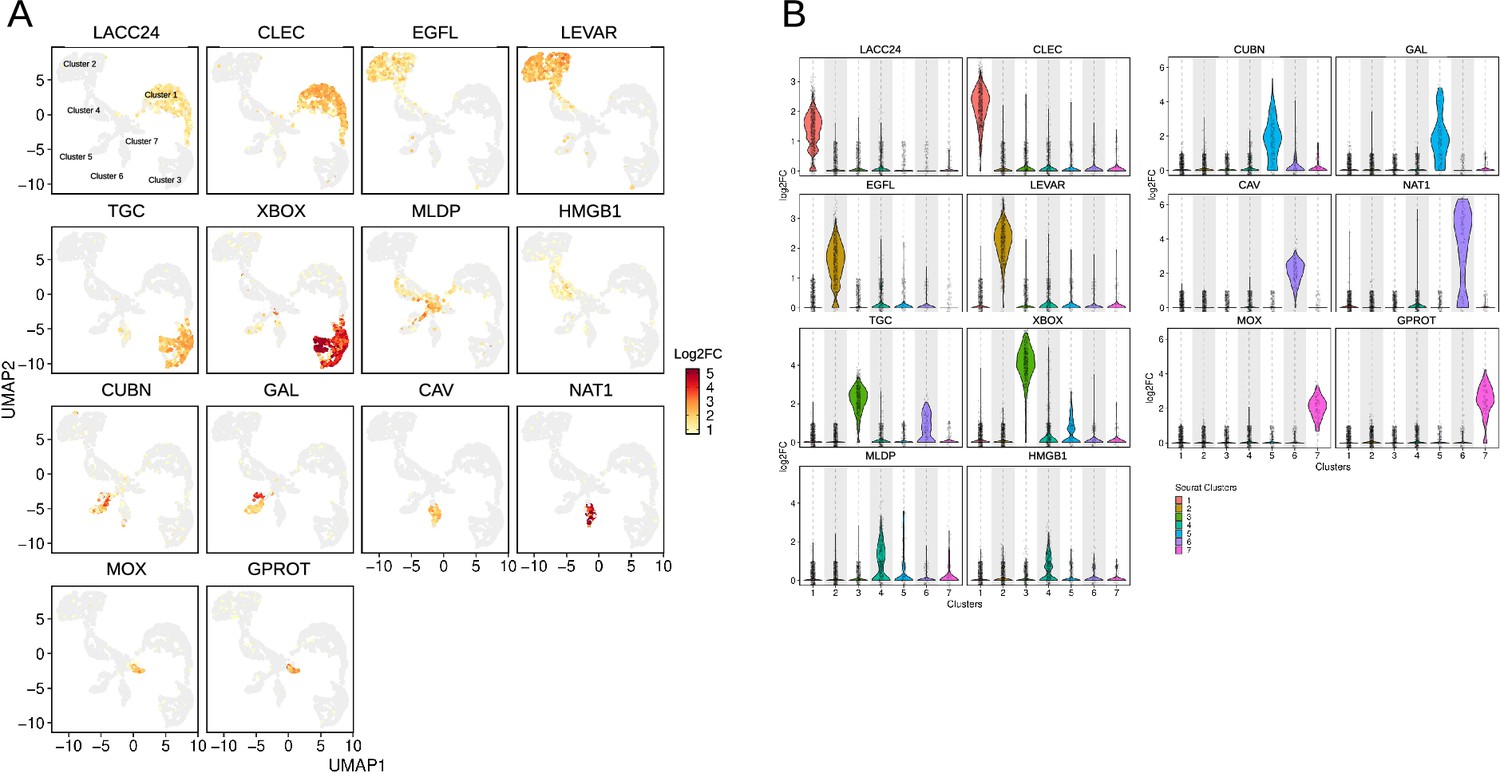
Cluster specificity and expression level of the 14 selected cluster markers.
(A) Identification of cells expressing the selected markers on the Uniform Manifold Approximation and Projection (UMAP) plot. Positive cells are colored according to the Log2FC value. LACC24 and CLEC are specific of cluster 1, EGFL and LEVAR of cluster 2, TGC and XBOX of cluster 3, MLDP and HMGB1 of cluster 4, CUBN and GAL of cluster 5, CAV and NAT1 of cluster 6 and MOX and GPROT of cluster 7. LACC24: Laccase 24, CLEC: C-type lectin domain-containing protein, EGFL: EGF-like domain-containing protein 8, LEVAR: Putative regulator of levamisole receptor-1, (TGC): TGc domain-containing protein, XBOX: X-box binding protein-like protein, MLDP: ML domain-containing protein, HMGB1: High mobility group protein B1, CUBN: Cubilin, (GAL): Galectin, (CAV): Caveolin, (NAT1): Natterin-1, (MOX): DBH-like monooxygenase protein 1, GPROT: G protein receptor F1-2 domain-containing protein. (B) Violin graph showing the average expression level (Log2FC) of the 14 selected marker transcripts specific to the different single-cell RNA sequencing (scRNA-seq) clusters.
Figure 5 with 5 supplements
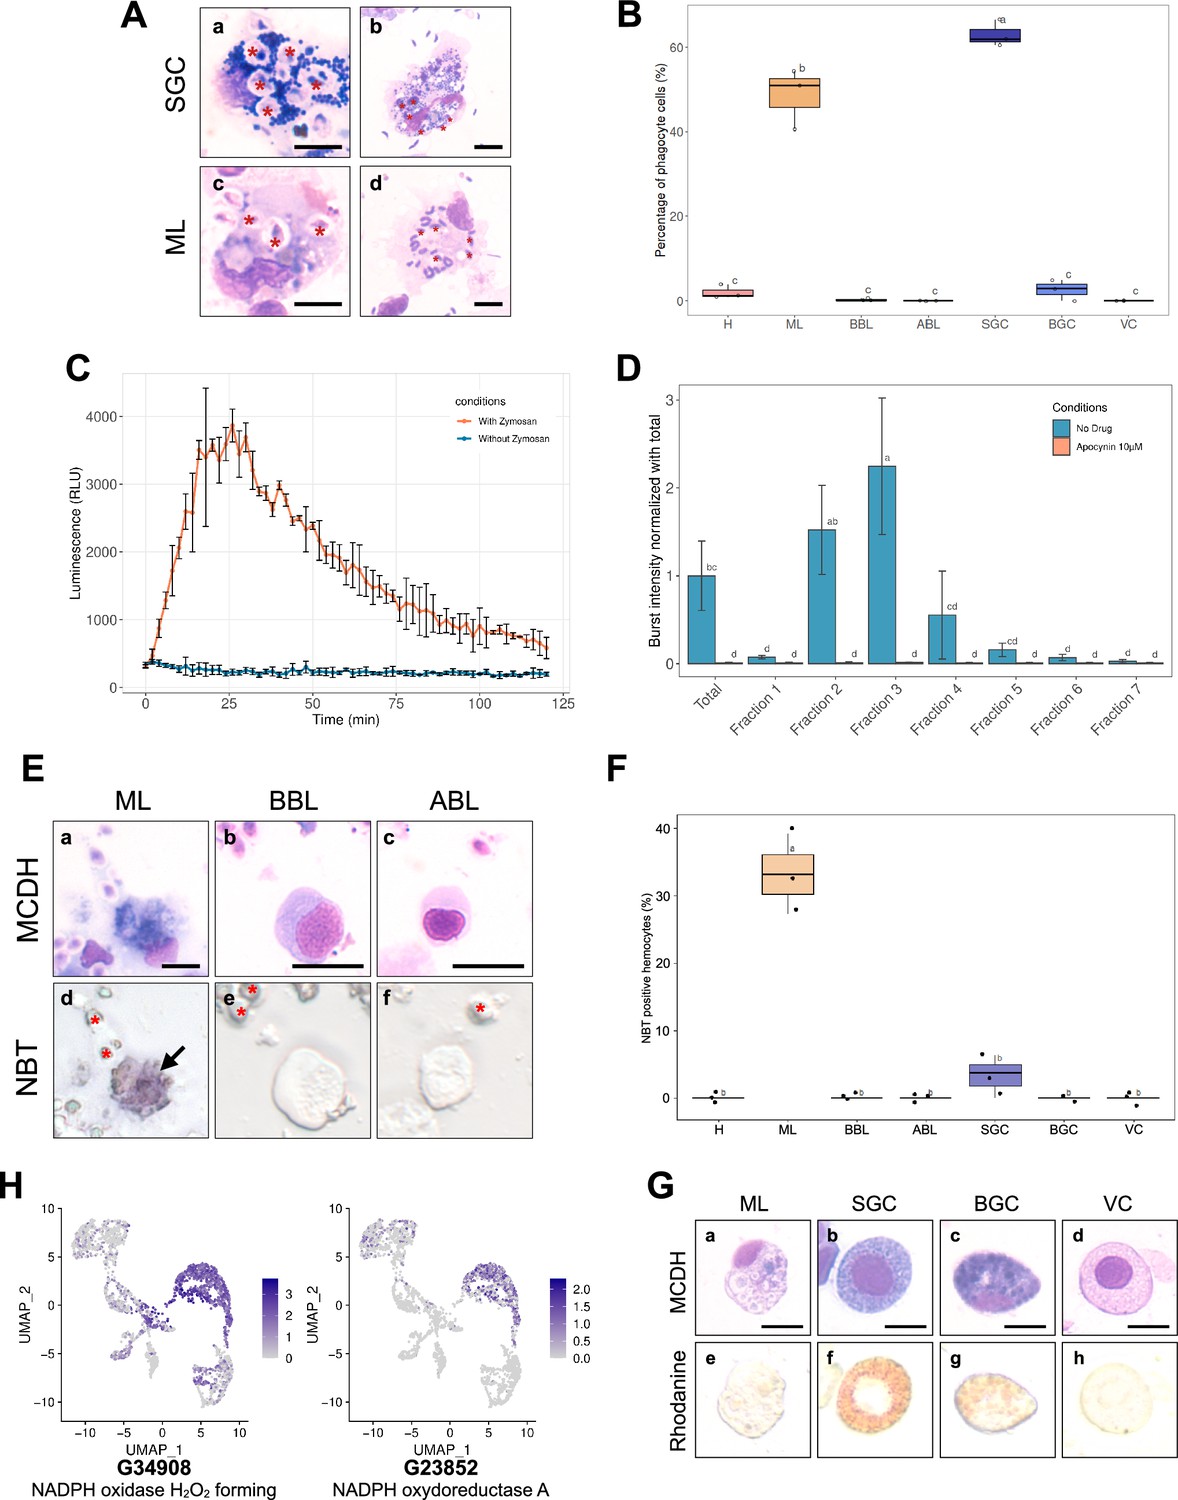
Phagocytosis, Reactive Oxygen Species production capacity, and copper storage of hemocytes.
(A) Images of small granule cells (SGC) and macrophage-like (ML) cells with phagocytosed zymosan particles (panels a & c - red stars) and Vibrio tasmaniensis LMG20012T bacteria (panels b & d - red stars) from whole hemolymph sample. Scale bar: 5 µm. (B) Quantification of the phagocytic activity of zymosan particles by each cell type. The graph shows the result of 3 independent experiments. (C) Luminescence recording to detect the production of Reactive Oxygen Species (ROS). In orange, a biphasic curve was obtained on naive oyster hemolymph after zymosan addition at t=0 min. In blue, the control condition corresponds to hemocytes without zymosan addition. (D) Graph showing the intensity of ROS production in each Percoll fraction. Normalized burst intensity was calculated from the luminescence peak obtained from each fraction. In blue, no drug was added to the experiment, in orange, ROS production was impaired by the addition of apocynin. (E) NBT (NitroBlueTetrazolium) staining of hemocytes exposed to zymosan particles. Hemocytes morphology after MCDH staining: Macrophage Like (a), Basophilic (b), and Acidophilic (c) Blast cells. NBT staining of the different types of hemocytes (d-f). Red stars show zymosan and bacteria particles. Black arrows indicate Macrophage-Like cells. Scale bar: 10 µm (F) Quantification of NBT-positive cells present in the total hemolymph of oysters exposed to zymosan. (H) UMAP plots showing cells expressing NADPH oxidase found in the single-cell RNA sequencing (scRNA-seq) dataset and their expression level. (G) Labeling of intracellular copper stores in C.gigas hemocytes. MCDH (upper panels) and rhodanine (lower panels) staining of oyster hemocytes to reveal copper accumulation. Scale bar: 10 µm. For panels (B), (D), and (F) the alphabetic characters displayed above the data points in each plot represent statistically significant differences among the groups, as determined by Tukey’s test following ANOVA. Groups denoted by different letters differ significantly at the p<0.05 level of statistical significance. (H): Hyalinocytes, (ABL): Acidophilic Blast-Like cells, (BBL): Basophilic Blast-Like cells, (ML): Macrophage-Like cells, (SGC): Small Granule Cells, (VC): Vesicular Cells, and (BGC): Big Granule Cells.
Figure 5—figure supplement 1
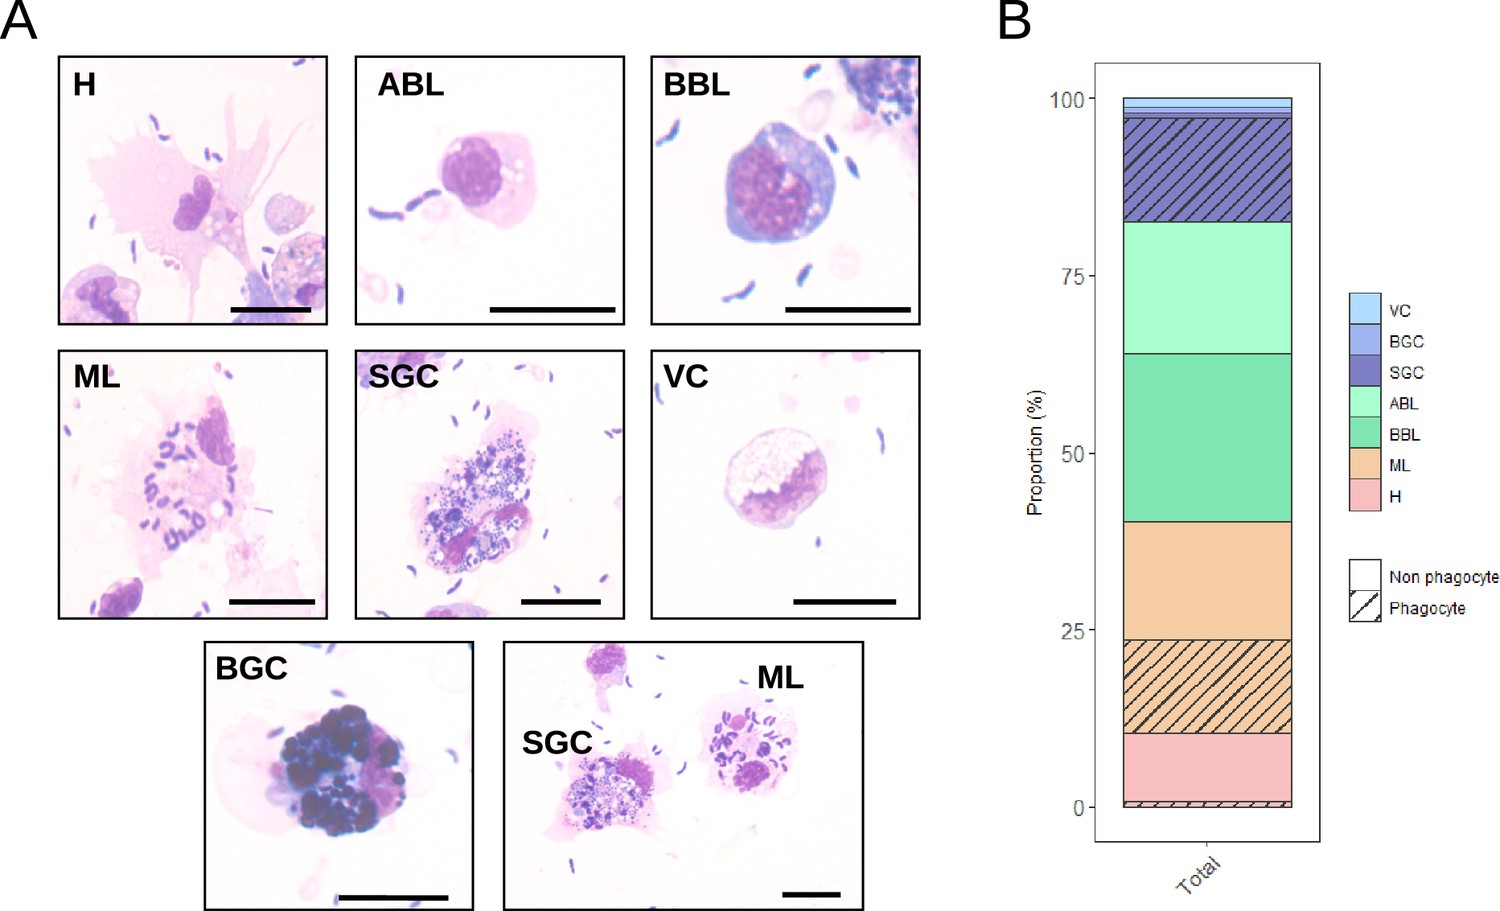
Measurement of the ability of C.gigas hemocytes to phagocytose Vibrio tasmaniensis LMG20012T.
Oyster hemocytes were challenged with non-pathogenic Vibrio tasmaniensis LMG20012T and phagocytosis was measured by observing intracellular bacteria after MCDH staining. (A) MCDH staining of hemocytes after phagocytosis assay. Scale bar: 10 µm. (B) Bar plot showing the proportion of each cell type and the proportion of phagocytic cells. (H): Hyalinocytes, (ABL): Acidophilic Blast-Like cells, (BBL): Basophilic Blast-Like cells, (ML): Macrophage-Like cells, (SGC): Small Granule Cells, (VC): Vesicular Cells, and (BGC): Big Granule Cells.
Figure 5—figure supplement 2
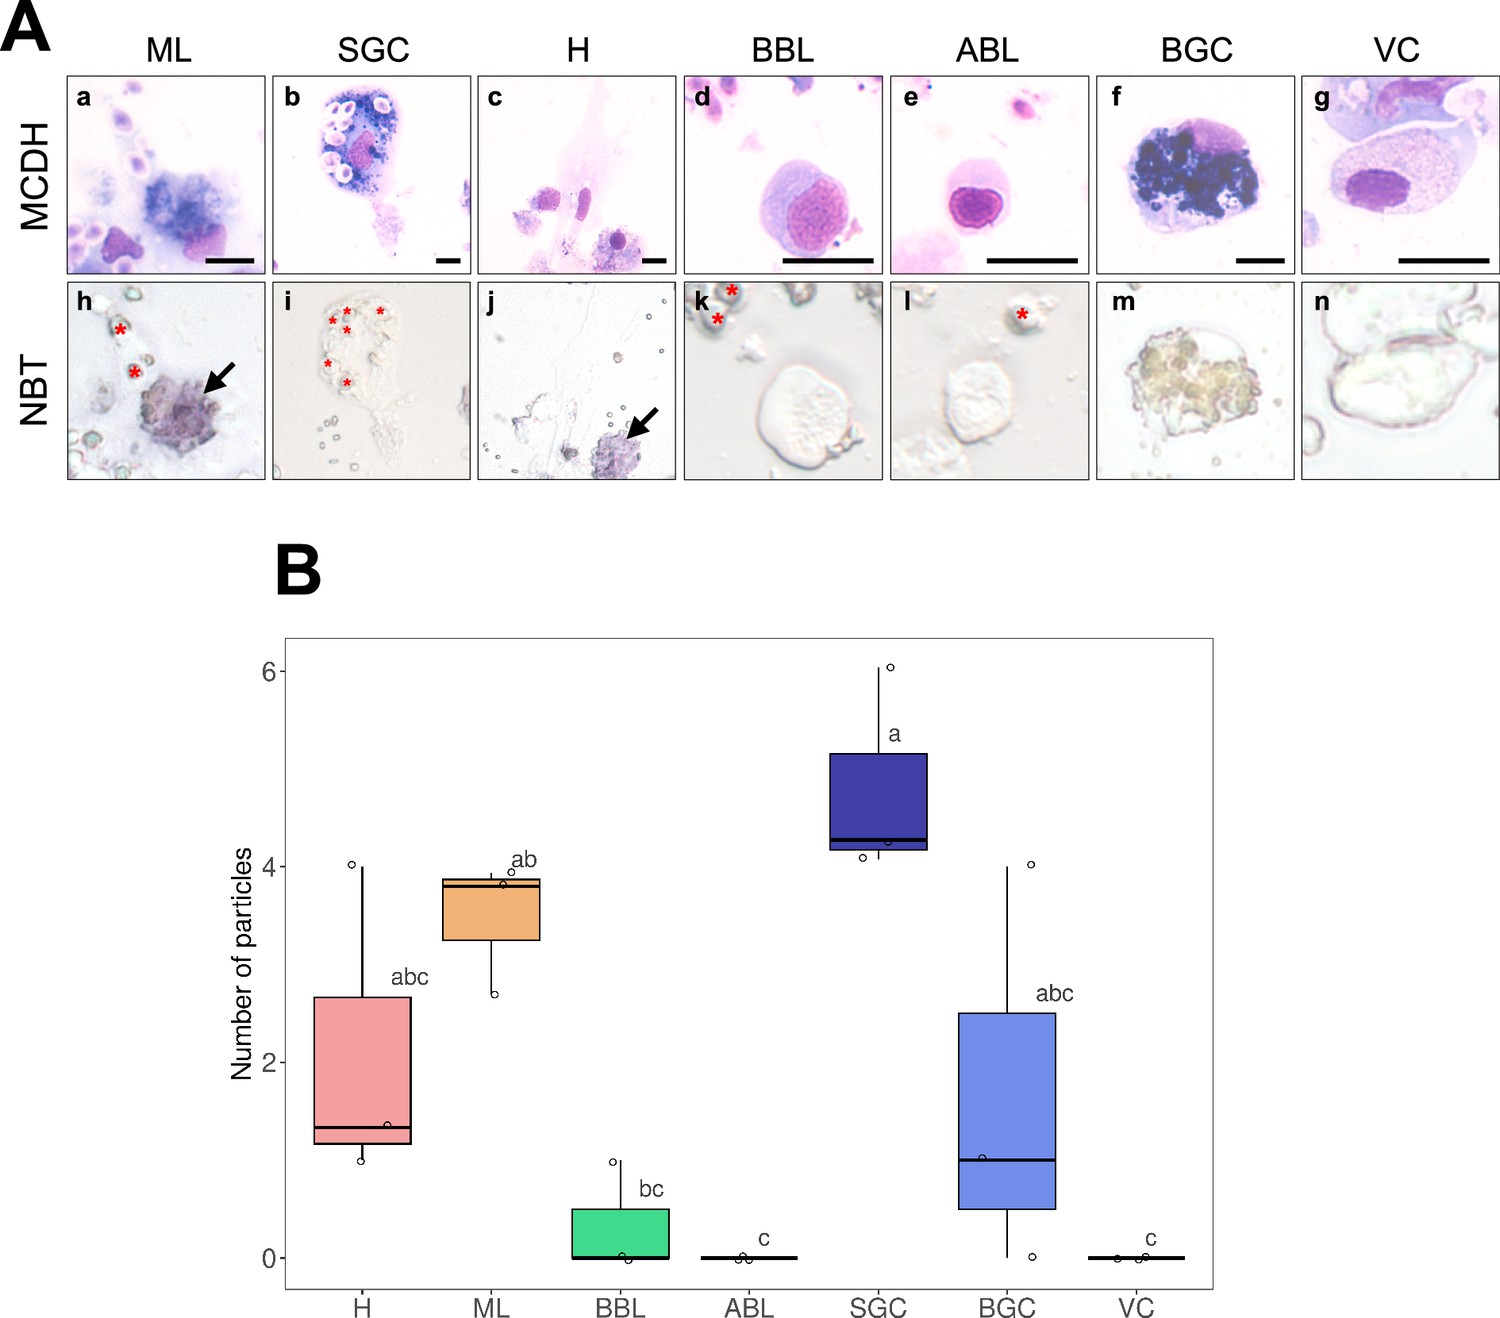
NBT (NitroBlueTetrazolium) staining of oyster hemolymph exposed to zymosan particles.
(A) Hemocyte morphology after MCDH staining: Macrophage Like (a), Small Granule Cells (b), Hyalinocyte (c), Basophilic (d) and Acidophilic (e) Blast cells, Big Granule Cells (f) and Vesicular Cells (g). NBT staining of the different hemocyte types (h–n). Red stars show zymosan and bacteria particles. Black arrows identify Macrophage-Like cells. Scale bar: 10 µm. (B) Results of quantification of the phagocytic activity of each cell type and number of zymosan particles per cell type. The graph shows the result of three independent experiments.
Figure 5—figure supplement 3
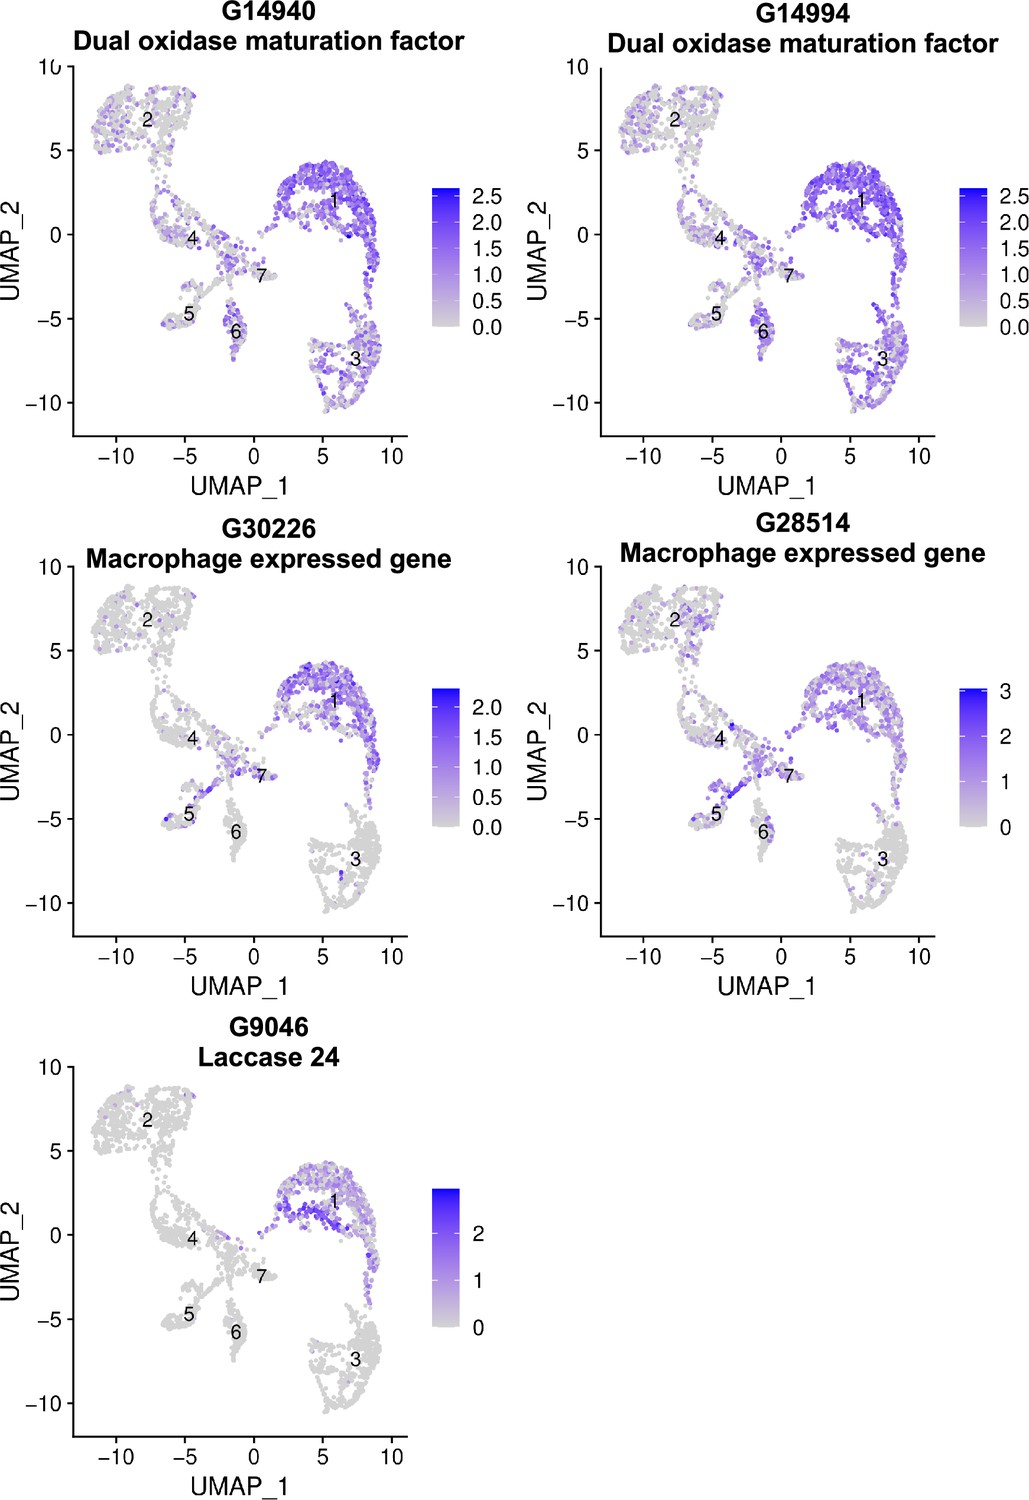
Uniform Manifold Approximation and Projection (UMAP) plots of cells expressing Macrophage-Like markers.
Cluster numbers are indicated on each cluster. Each point in the UMAP plot represents a single hemocyte, and the clustering of these points reveals the distinct transcriptional profiles of macrophage-like specific markers within the hemocyte population.
Figure 5—figure supplement 4
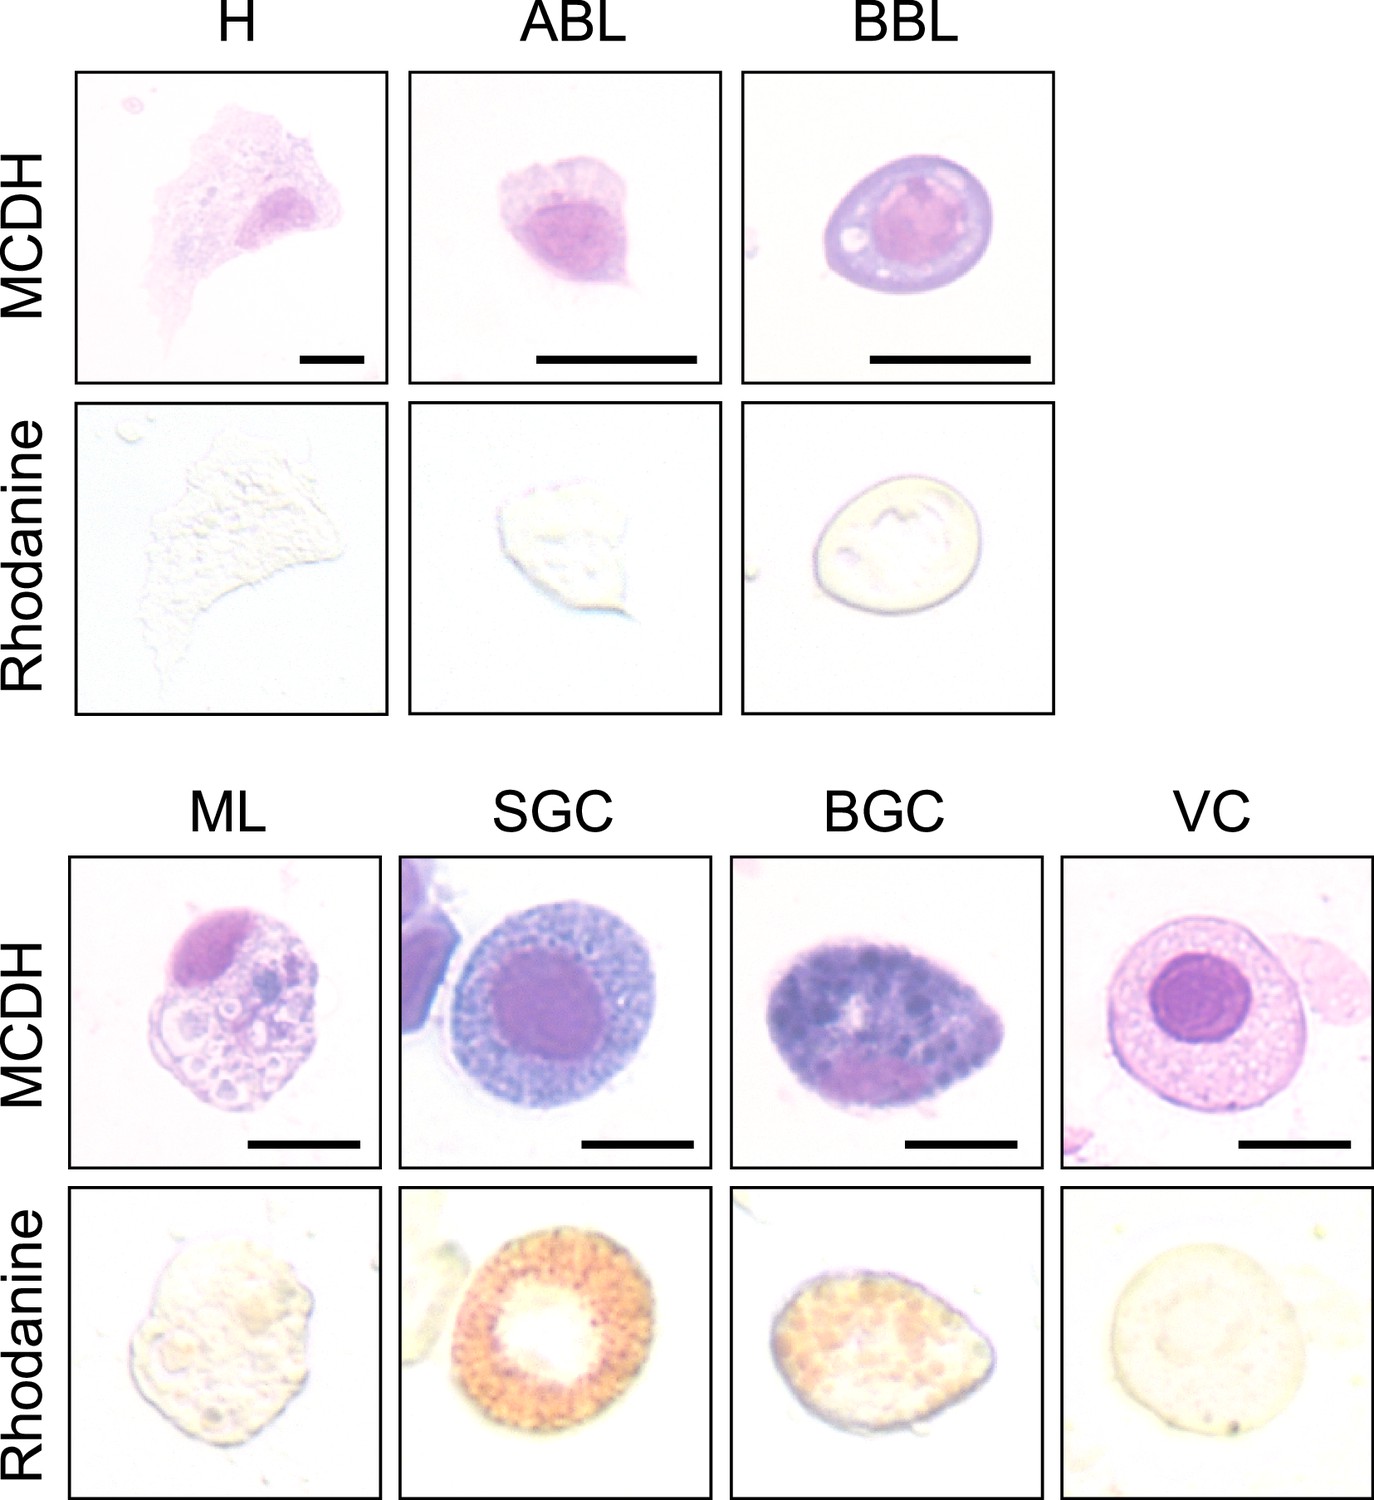
Labeling of intracellular copper stores in C.gigas hemocytes.
MCDH (upper panels) and rhodanine (lower panels) staining of oyster hemocytes to reveal copper accumulation. Cells were first processed for copper staining and then stained according to MCDH protocol. (H): Hyalinocytes, (ABL): Acidophilic Blast-Like cells, (BBL): Basophilic Blast-Like cells, (ML): Macrophage-Like cells, (SGC): Small Granule Cells, (VC): Vesicular Cells, and (BGC): Big Granule Cells. Scale bar: 10 µm.
Figure 5—figure supplement 5
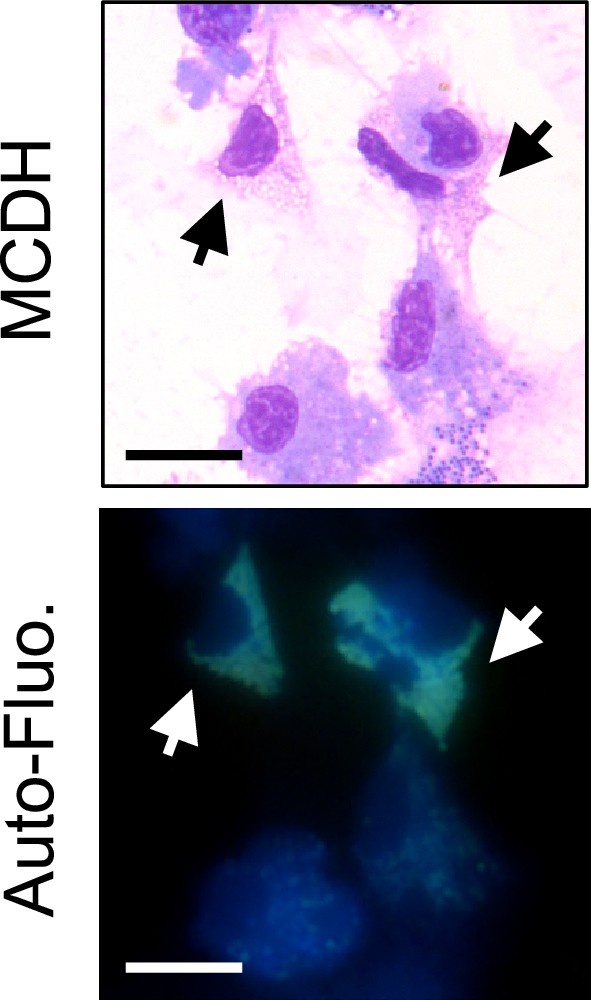
Observation of autofluorescence of vesicular cells in hemolymph.
Freshly punctured total hemolymph was cytospun, directly observed under a microscope using a DAPI filter set (DAPI Blue ex: 350/50 nm, DC: 400 nm and em: 460/50 nm) and then processed for MCDH staining. Arrows indicate autofluorescent cells. Scale bar: 10 µm.
Figure 6

Hemocyte expression profiles of some antimicrobial peptides.
(A) (B) and (C) Relative gene expression in theseven Percoll hemocyte fractions of Big-Defensin1 & 2 (Cg-BigDefs), BPI (Cg-BPI), and hemocyte defensin (Cg-Defh), respectively, in comparison to the gene expression level in unfractionated hemolymph on four independent experiments. Relative gene expression levels were normalized to the reference gene Cg-rps6. The 2-ΔCt method was used to calculate relative expression levels, where ΔCt represents the difference between the target gene’s Ct value and the reference gene’s Ct value. (D) Correlation matrix between the relative gene expression of BigDefensin1 & 2, BPI, and hemocyte defensin gene in each fraction and the percentage of each hemocyte type in each fraction (H): Hyalinocytes, (ABL): Acidophilic Blast Like, (BBL): Basophilic Blast Like, (SGC): Small Granule Cell, (ML): Macrophage Like, (BGC): Big Granule Cell, (VC): Vesicular Cell. Values and color scale represent the Pearson correlation coefficient (r) ranging from –1 (inverse correlation) to +1 (full correlation).
Figure 7 with 2 supplements
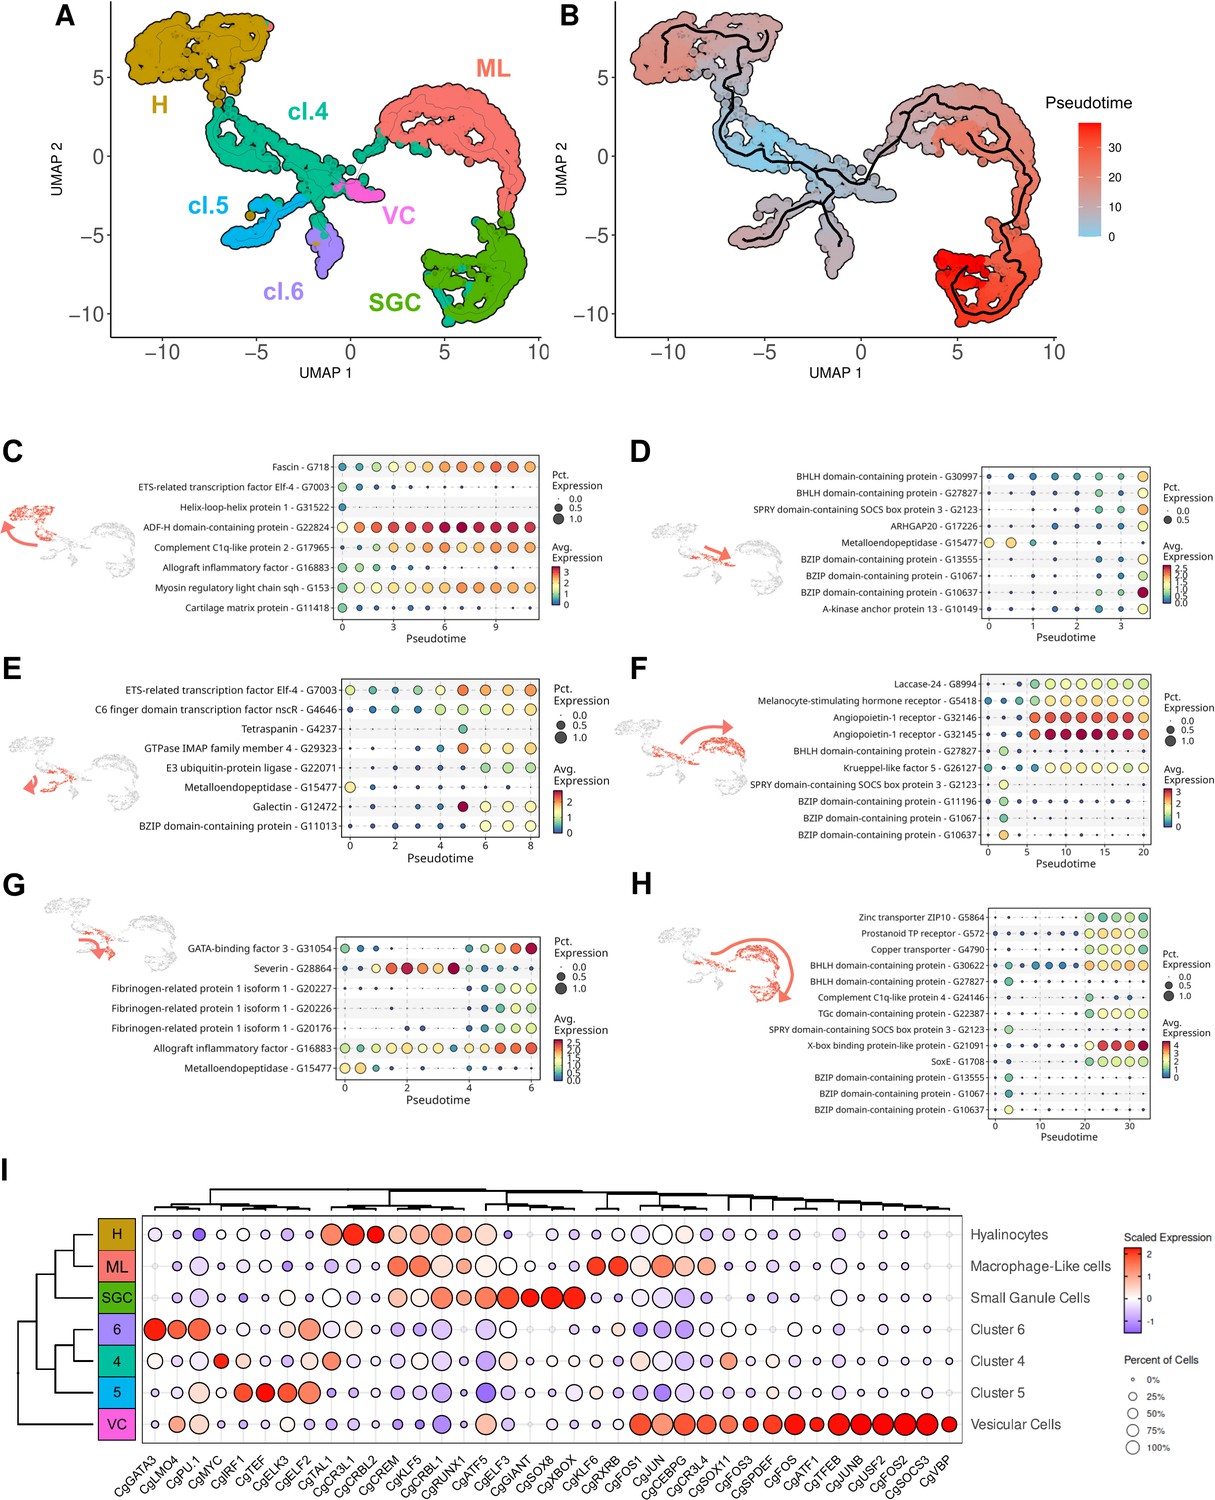
Pseudotime ordering of cells revealed six potential differentiation pathways of hemocytes.
(A) Uniform Manifold Approximation and Projection (UMAP) plot of single-cell RNA sequencing (scRNA-seq) analysis showing the seven transcriptomic clusters used for pseudotime analysis. Four clusters were identified cytologically (SGC for small granule cells - cluster 3, H for hyalinocytes - cluster 2, ML for Macrophage Like - cluster 1, and VC for vesicular cells - cluster 7), cl.4, cl.5, and cl.6 represent clusters 4, 5, and 6, respectively. (B) Graphical representation (UMAP projection) of the Monocle 3 pseudo-time order of the clustered cells. Cluster 4 (cl.4) was used as the origin for the pseudotime analysis. (C) (D) (E) (F) (G) and (H) show the gene expression level of selected marker genes obtained from the monocle3 trajectory analysis at the beginning and end of the modelized differentiation pathways (in red on the UMAP plot) from cluster 4 to hyalinocytes, to Vesicular Cells (VC), to cluster 5 cells, to Macrophage-Like cells (ML), to cluster 6 cells, and to Small Granule Cells (SGC), respectively. The color scale represents the normalized expression level of each gene. (I) Dot plot showing the average expression and the percentage of cells expressing identified transcripts encoding for transcription factors in the scRNA-seq dataset. The scale represents the normalized expression level, while the dot diameter indicates the percentage of cells expressing the gene.
Figure 7—figure supplement 1
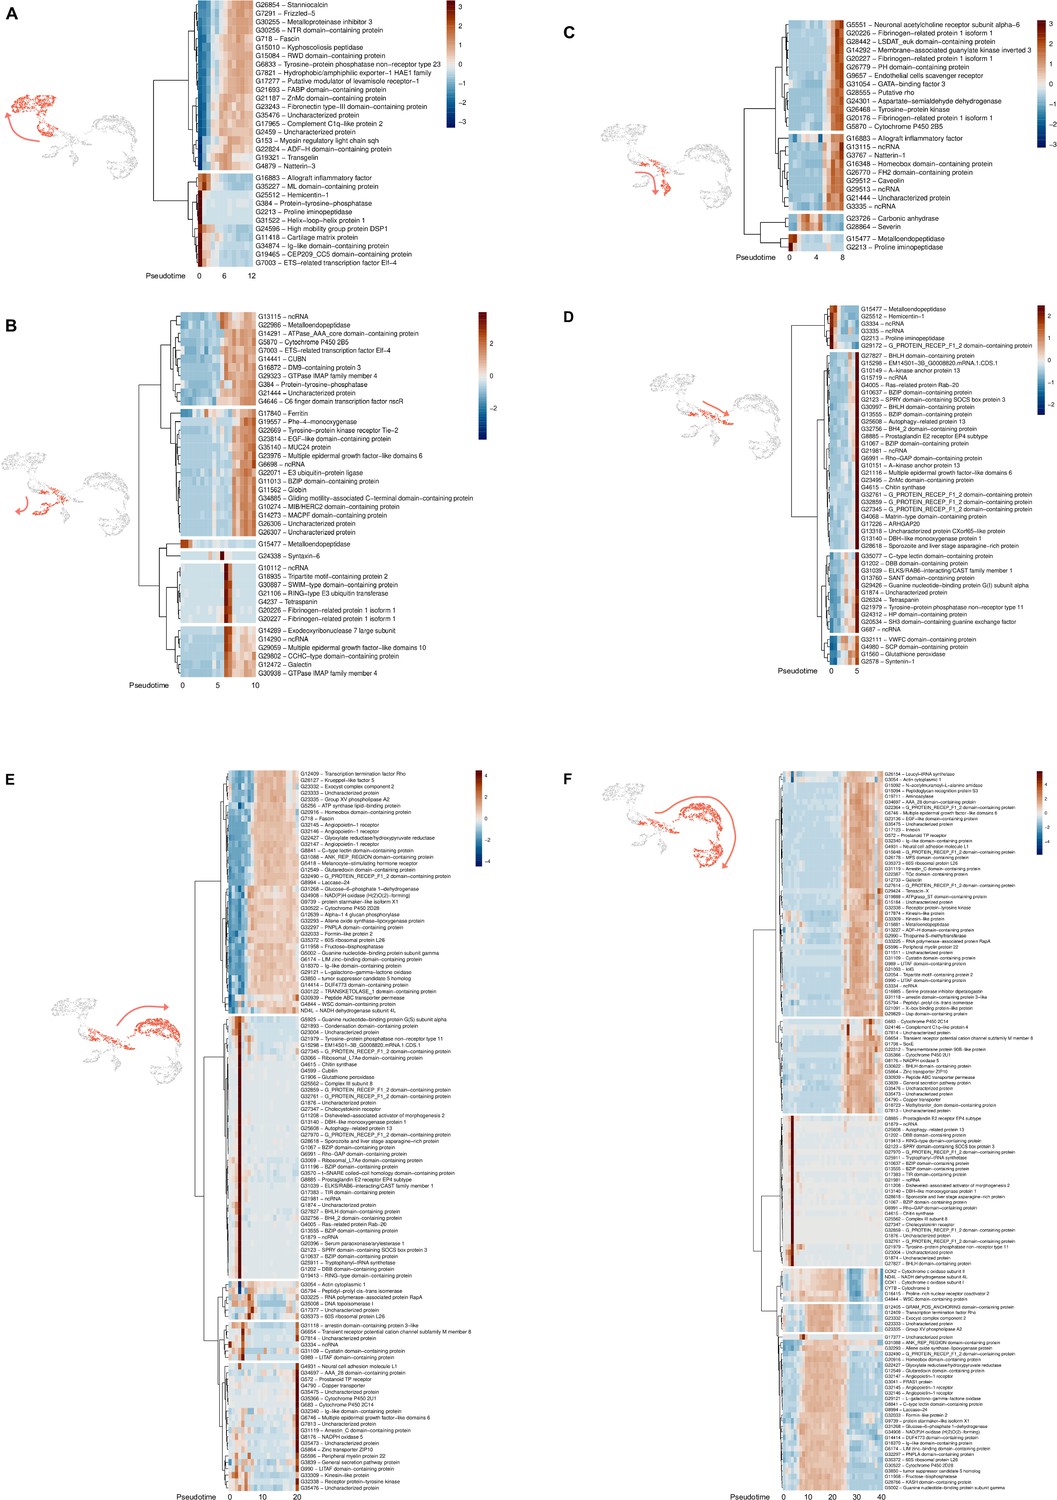
Results of single-cell RNA sequencing (scRNA)-seq trajectory analysis using Monocle3.
Analysis was performed using cluster 4 as the zero pseudotime. (A) to (F) Heatmaps representing the level of normalized expression of genes along the trajectory. (A) Lineage from cluster 4 cells to hyalinocytes, (B) to cluster 5 cells, (C) to cluster 6 cells, (D) to vesicular cells, (E) to macrophage-like cells, and (F) to small granule cells. For each lineage, cell trajectories are shown in red and heat maps of pseudo time-dependent genes are shown. Blue indicates low expression, and red indicates high expression. Pseudotime flows from left to right.
Figure 7—figure supplement 2
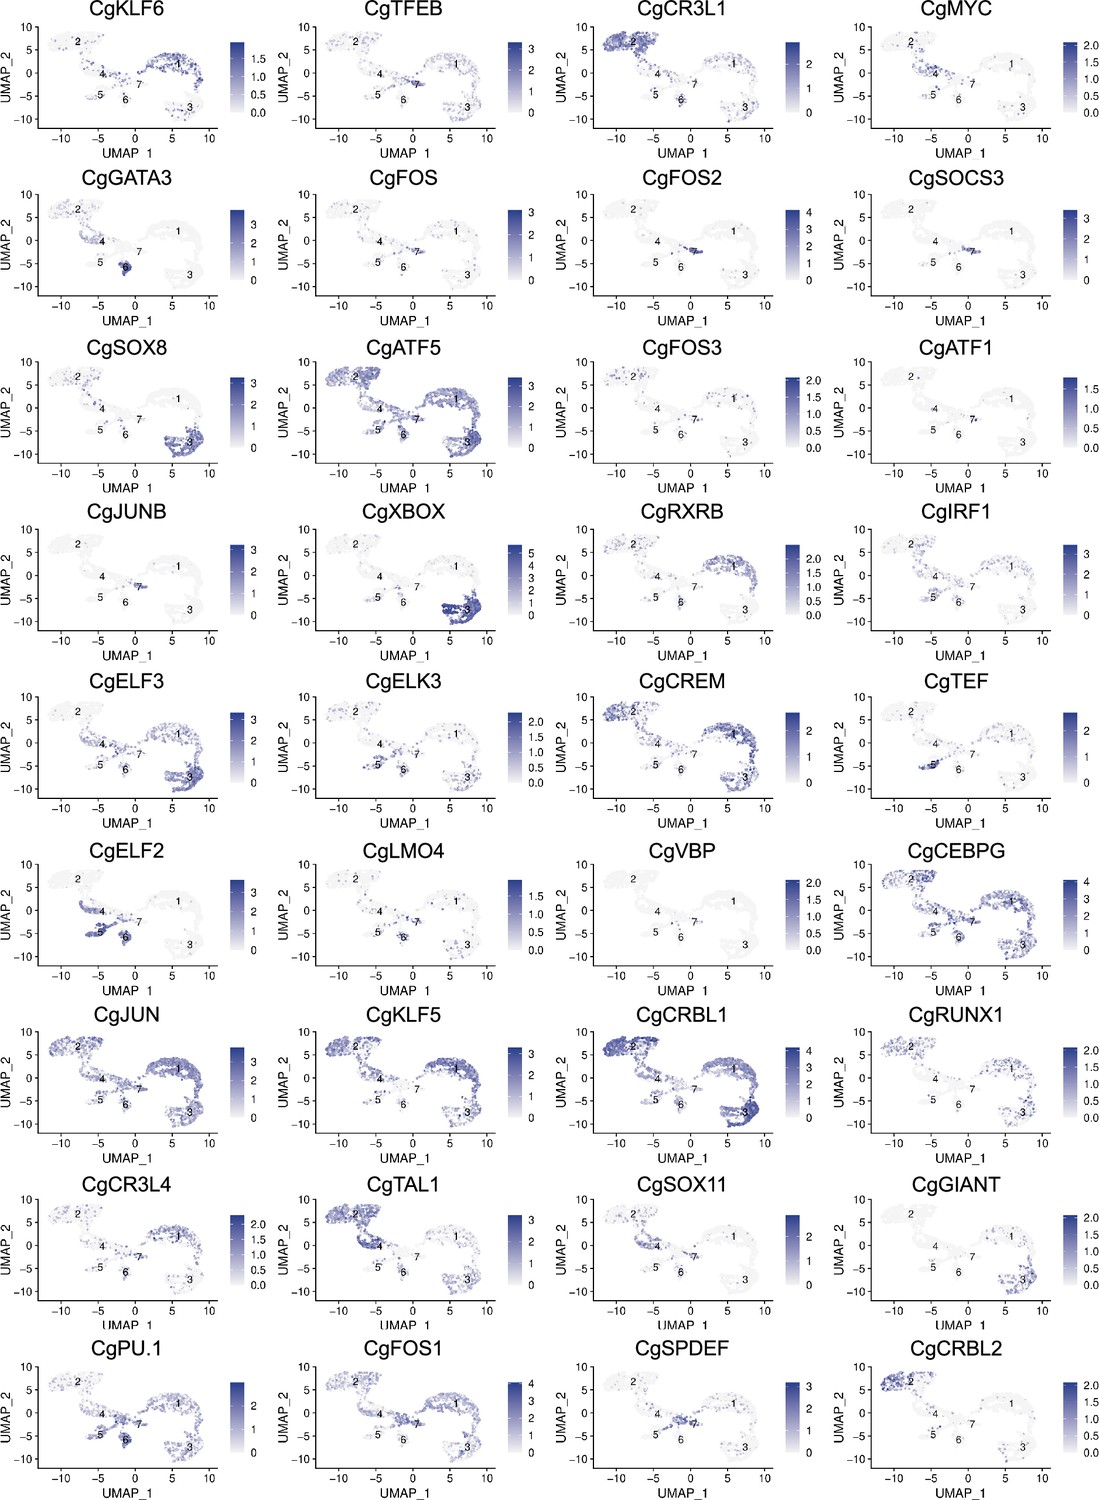
Uniform Manifold Approximation and Projection (UMAP) plots of cells expressing transcription factors.
28 UMAP representation for the transcription factors identified in the single-cell RNA sequencing (scRNA-seq) dataset. Each UMAP plot shows cells expressing the transcription factor in purple. Log2FC expression level is also reported.
Figure 8
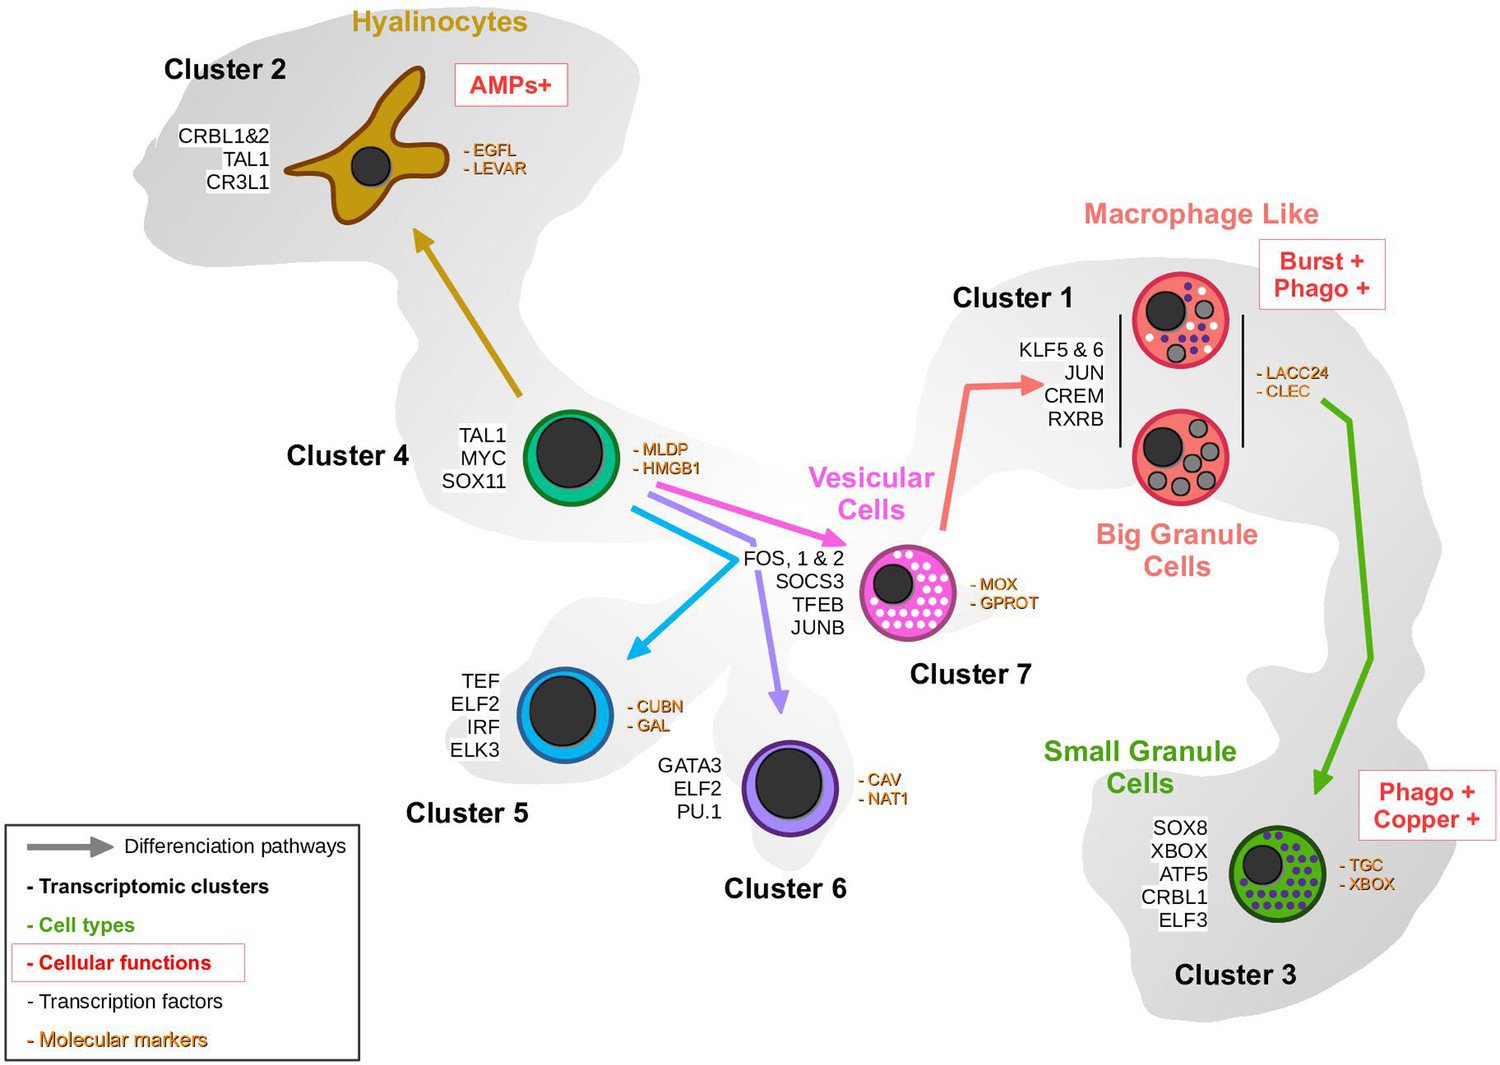
Proposed hemocyte ontology in Crassostrea gigas based on the transcriptomic, cytological, and functional results obtained.
Cells are colored according to the same color code as the transcriptomic clusters. Cluster numbers and cell types are indicated. To the left of the cells are the overexpressed transcription factors and to the right are the identified marker genes in each cluster. Functional characteristics of hyalinocytes, macrophage-like cells, and small granule cells are marked in red. (AMP): AntiMicrobial Peptide, Burst: ROS production, Phago: phagocytosis.
Author response image 1
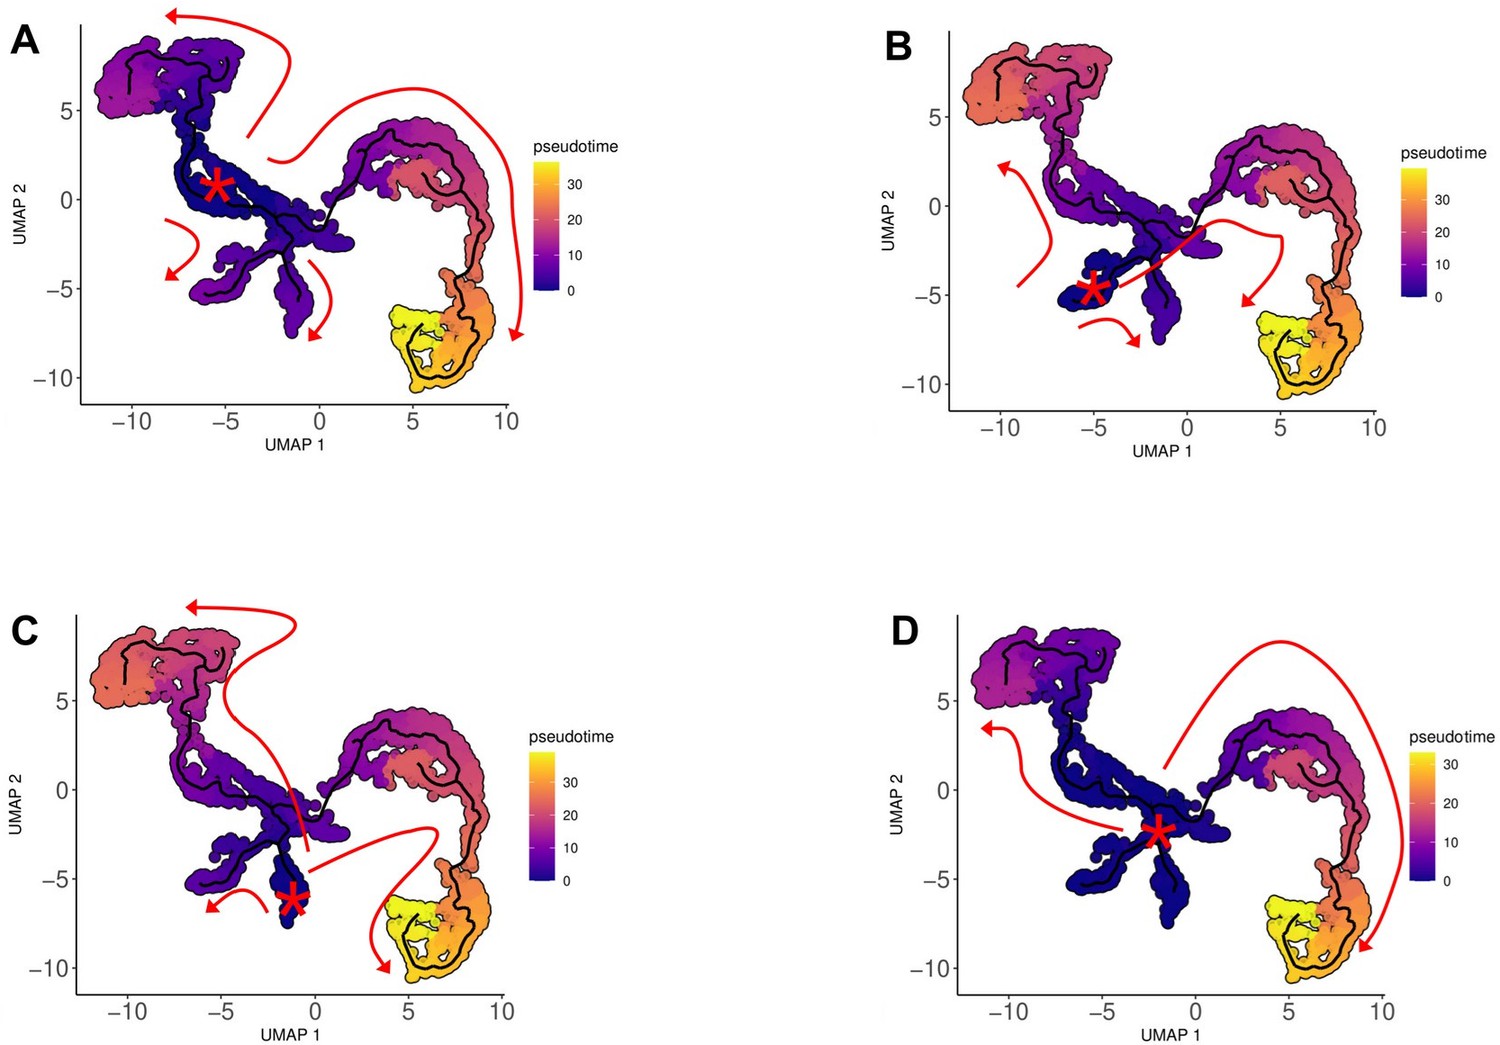
Representation of the trajectories obtained from Monocle3 analysis using different pseudotime origins, showing that changing the rooting did not alter the overall differentiation topology.
(A) Pathways identified with cluster 4, (B) cluster 5, (C) cluster 6, and (D) cluster 4/5/6 origins.
Tables
Table 1
Top 10 overexpressed genes identified in each transcriptomic cluster.
The first column indicates the gene number according to the annotation. ‘log2FC’ represents the log2 fold change of the gene in the cluster compared to all other cells. ‘Pct1’ is the percentage of cells expressing the gene in the cluster and ‘Pct2’ is the fraction of cells expressing the gene in all other clusters. The description is the annotation of the expressed gene. (adjusted p-value <0.05).
| Gene | log2FC | Pct 1 | Pct 2 | Description | Gene | log2FC | Pct 1 | Pct 2 | Description | |||
|---|---|---|---|---|---|---|---|---|---|---|---|---|
| Cluster 1 | Cluster 5 | |||||||||||
| G29121 | 4.31 | 1 | 0.099 | L-galactono-gamma-lactone oxidase | G31601 | 5.24 | 0.38 | 0.06 | Polyribonucleotide nucleotidyltransferase | |||
| G32145 | 4.18 | 0.992 | 0.079 | Angiopoietin-1 receptor | G12472 | 3.99 | 0.85 | 0.03 | Galectin | |||
| G32146 | 3.90 | 0.985 | 0.063 | Angiopoietin-1 receptor | G21444 | 3.58 | 1 | 0.41 | Uncharacterized protein | |||
| G8841 | 3.13 | 0.988 | 0.049 | C-type lectin domain-containing protein | G26307 | 3.42 | 0.6 | 0.02 | Uncharacterized protein | |||
| G32297 | 2.88 | 0.99 | 0.232 | PNPLA domain-containing protein | G14441 | 3.35 | 0.84 | 0.08 | CUBN | |||
| G30522 | 2.76 | 1 | 0.515 | Cytochrome P450 2D28 | G29323 | 3.21 | 0.9 | 0.01 | GTPase IMAP family member 4 | |||
| G35372 | 2.69 | 1 | 0.483 | 60 S ribosomal protein L26 | G24298 | 3.18 | 0.29 | 0.05 | Putative Transmembrane protease serine 9 | |||
| G32147 | 2.45 | 0.969 | 0.131 | Angiopoietin-1 receptor | G34885 | 3.13 | 0.59 | 0.01 | Gliding motility-associated C-terminal domain-containing protein | |||
| G14414 | 2.45 | 1 | 0.343 | DUF4773 domain-containing protein | G7003 | 2.55 | 0.99 | 0.16 | ETS-related transcription factor Elf-4 | |||
| G12549 | 2.38 | 0.974 | 0.132 | Glutaredoxin domain-containing protein | G22986 | 2.37 | 0.94 | 0.1 | Metalloendopeptidase | |||
| Cluster 2 | Cluster 6 | |||||||||||
| G30255 | 5.31 | 1 | 0.15 | Metalloproteinase inhibitor 3 | G3767 | 6.45 | 0.74 | 0.02 | Natterin-1 | |||
| G26854 | 4.24 | 1 | 0.16 | Stanniocalcin | G24301 | 6.16 | 0.99 | 0.02 | Aspartate-semialdehyde dehydrogenase | |||
| G17965 | 4.21 | 0.94 | 0.04 | Complement C1q-like protein 2 | G3335 | 5.19 | 1 | 0.16 | ncRNA | |||
| G15010 | 3.99 | 0.99 | 0.17 | Kyphoscoliosis peptidase | G24293 | 4.57 | 0.59 | 0.01 | Uncharacterized protein | |||
| G2459 | 3.82 | 1 | 0.21 | Uncharacterized protein | G31054 | 3.56 | 1 | 0.13 | GATA-binding factor 3 | |||
| G23243 | 3.51 | 0.98 | 0.07 | Fibronectin type-III domain-containing protein | G14292 | 3.29 | 0.87 | 0.03 | Membrane-associated guanylate kinase inverted 3 | |||
| G30256 | 3.23 | 1 | 0.69 | NTR domain-containing protein | G29512 | 3.2 | 0.99 | 0 | Caveolin | |||
| G17277 | 3.21 | 0.99 | 0.04 | Putative modulator of levamisole receptor-1 | G5551 | 2.93 | 0.97 | 0.02 | Neuronal acetylcholine receptor subunit alpha-6 | |||
| G11154 | 3.16 | 0.68 | 0.05 | Collagen alpha-1(XII) chain | G13115 | 2.73 | 0.83 | 0.26 | ncRNA | |||
| G25104 | 3.1 | 0.84 | 0.08 | C1q domain-containing protein | G16883 | 2.62 | 1 | 0.2 | Allograft inflammatory factor | |||
| Cluster 3 | Cluster 7 | |||||||||||
| G21091 | 5.51 | 0.99 | 0.13 | X-box binding protein-like protein | G10637 | 4.21 | 0.99 | 0.03 | BZIP domain-containing protein | |||
| G12733 | 5.42 | 1 | 0.12 | Galectin | G4005 | 4.07 | 0.99 | 0.21 | Ras-related protein Rab-20 | |||
| G21093 | 5.17 | 0.94 | 0.05 | IolG | G32859 | 3.9 | 0.93 | 0.04 | G Protein Receptor F1-2 domain-containing protein | |||
| G31109 | 4.36 | 0.77 | 0.03 | Cystatin domain-containing protein | G1906 | 3.82 | 0.5 | 0.02 | Glutathione peroxidase | |||
| G30939 | 4.25 | 1 | 0.86 | Peptide ABC transporter permease | G28618 | 3.53 | 0.91 | 0.09 | Sporozoite and liver stage asparagine-rich protein | |||
| G30622 | 3.95 | 1 | 0.21 | BHLH domain-containing protein | G21981 | 3.5 | 0.94 | 0.05 | ncRNA | |||
| G35473 | 3.86 | 0.96 | 0.04 | Uncharacterized protein | G6991 | 3.4 | 0.85 | 0.01 | Rho-GAP domain-containing protein | |||
| G27614 | 3.78 | 0.96 | 0.13 | G Protein Receptor F1-2 domain-containing protein | G13140 | 3.12 | 1 | 0.03 | DBH-like monooxygenase protein 1 | |||
| G31119 | 3.77 | 0.99 | 0.42 | Arrestin C domain-containing protein | G2123 | 3.05 | 0.94 | 0.02 | SPRY domain-containing SOCS box protein 3 | |||
| G990 | 3.6 | 0.93 | 0.03 | LITAF domain-containing protein | G1560 | 3.02 | 0.95 | 0.17 | Glutathione peroxidase | |||
| Cluster 4 | ||||||||||||
| G29172 | 3.09 | 0.78 | 0.49 | G Protein Receptor F1-2 domain-containing protein | ||||||||
| G24596 | 2.37 | 0.78 | 0.25 | High mobility group protein DSP1 | ||||||||
| G5854 | 1.8 | 0.64 | 0.38 | N-acetyltransferase domain-containing protein | ||||||||
| G20685 | 1.59 | 0.88 | 0.53 | Ribosomal protein L22 | ||||||||
| G11965 | 1.57 | 0.92 | 0.7 | Ribosome L4 associated C domain-containing protein | ||||||||
| G5652 | 1.54 | 0.97 | 0.75 | 60 S ribosomal protein L30 | ||||||||
| G15477 | 1.52 | 0.55 | 0.3 | Metalloendopeptidase | ||||||||
| G4972 | 1.49 | 0.96 | 0.8 | 60 S ribosomal protein L12 | ||||||||
| G35227 | 1.46 | 0.55 | 0.06 | ML domain-containing protein | ||||||||
| G21588 | 1.42 | 0.94 | 0.69 | 60 S ribosomal protein L13 |
Table 2
Table of the 14 marker genes specific to the different transcriptomic clusters.
Gene number, average Log2FC, pct1/pct2 ratio (percentage of cells expressing this transcript in the cluster divided by the percentage of all other cells expressing this transcript), and cluster number are reported. The description is taken from our annotation and the marker name is derived from the description.
| Gene number | Avg. Log2FC | Pct.1 | Pct.2 | Pct.1/Pct.2 Ratio | Cluster | Description | Marker name |
|---|---|---|---|---|---|---|---|
| G8994 | 2.05 | 0.917 | 0.024 | 38.20 | 1 | Laccase-24 | LACC24 |
| G8841 | 3.13 | 0.988 | 0.049 | 20.16 | C-type lectin domain-containing protein | CLEC | |
| G24846 | 2.31 | 0.914 | 0.029 | 31.52 | 2 | EGF-like domain-containing protein 8 | EGFL |
| G17277 | 3.21 | 0.989 | 0.043 | 23.00 | Putative modulator of levamisole receptor-1 | LEVAR | |
| G22387 | 3.16 | 0.972 | 0.029 | 16.76 | 3 | TGc domain-containing protein | TGC |
| G21091 | 5.51 | 0.992 | 0.129 | 7.69 | X-box binding protein-like protein | XBOX | |
| G35227 | 1.46 | 0.549 | 0.055 | 9.98 | 4 | ML domain-containing protein | MLDP |
| G31074 | 0.94 | 0.501 | 0.077 | 6.51 | High mobility group protein B1 | HMGB1 | |
| G14441 | 3.35 | 0.837 | 0.076 | 11.01 | 5 | Cubilin | CUBN |
| G12472 | 3.99 | 0.847 | 0.034 | 24.91 | Galectin | GAL | |
| G29512 | 3.20 | 0.985 | 0.004 | 246.25 | 6 | Caveolin | CAV |
| G3767 | 6.45 | 0.740 | 0.018 | 41.11 | Natterin-1 | NAT1 | |
| G13140 | 3.12 | 1.000 | 0.025 | 40.00 | 7 | DBH-like monooxygenase protein 1 | MOX |
| G32859 | 3.90 | 0.929 | 0.039 | 23.82 | G protein receptor F1-2 domain-containing protein | GPROT |
Key resources table
| Reagent type (species) or resource | Designation | Source or reference | Identifiers | Additional information |
|---|---|---|---|---|
| Biological sample (Magallana gigas) | ISA oysters | Ifremer Standardized Oysters - La tremblade - France | GPS coordinates: 45.7981624714465,–1.150171788447683 | |
| Biological sample (Magallana gigas) | Wild Type oysters | Local producer located in the Thau Lagoon | GPS coordinates: 43.44265228308842, 3.6359883059292057 | |
| Strain (Vibrio Tasmaniensis) | Bacteria LMG20012 | From the laboratory | LMG20012 | |
| Commercial kit | 10 X Genomics Single Cell 3' Reagent Kits v2 | 10 X genomics | #CG00052 | |
| Commercial kit | Copper Stain Kit | SkyTek, USA | #CSK2 | |
| Commercial kit | RNeasy kit | Qiagen, the Netherlands | #74104 | |
| Commercial kit | Superscript IV kit | Thermo Fisher Scientific, USA | #18090050 | |
| Chemical compound | Percoll | Cytiva, Sweden | #17089101 | |
| Chemical compound | Luminol | Merck, USA | #123072–5 G | |
| Chemical compound | Zymosan | Merck, USA | #Z4250 | |
| Chemical compound | NitroBlueTetrazolium | Merck, USA | #N5514 | |
| Other | MCDH (Micro Chromatic Detection for Hematology) | Cellavision, Sweden | #313590, #313570, #313560 and #313600 | |
| Software | Automatic functional annotation | https://gitlab.ifremer.fr/bioinfo/workflows/orson | Orson Nextflow script | |
| Software | STAR v2.7.10 ScRNA-seq aligner | https://github.com/alexdobin/STAR; Dobin et al., 2013 | STAR (RRID:SCR_004463) | |
| Software | R Seurat package version 4.3.0 | https://satijalab.org/seurat/ | Seurat (RRID:SCR_016341) | |
| Software | R Seurat package Monocle3 | https://github.com/cole-trapnell-lab/monocle3; Cao et al., 2017 | Monocle3 (RRID:SCR_018685) | |
| Software | Blast2Go | https://www.blast2go.com/ | Blast2GO (RRID:SCR_005828) | |
| Algorithm | GO-MWU scripts | https://github.com/z0on/GO_MWU; Wright et al., 2015 |
Additional files
-
Supplementary file 1
STARsolo summary metrics report.
Metrics dashboard obtained after the STARsolo step, describing the quality of the sequencing and the various characteristics of the cells detected after aligning the reads to the C. gigas genome from the Roslin Institute.
- https://cdn.elifesciences.org/articles/102622/elife-102622-supp1-v2.xlsx
-
Supplementary file 2
Single-cell RNA-seq analysis result file.
CSV file containing the scRNA-seq analysis results with cluster number (<cluster>), gene number (<gene>), chromosome reference where the gene is located (<chromosome>), average expression level (<avg_log2FC>), percentage in the cluster (<pct1>) and in other clusters (<pct2>), pct1 /pct2 ratio (<pct. ratio>), adjusted p-val and p-val values (<p-val>and< p_val_adj>), and gene description (<description>).
- https://cdn.elifesciences.org/articles/102622/elife-102622-supp2-v2.csv
-
Supplementary file 3
Table presenting the result of KEGG analysis performed using DAVID Bioinformatics Resources.
Gene Ontology (GO)-term enrichment analysis was conducted on specifically overexpressed genes in each cluster obtained after scRNA-seq processing (genes with Log2FC >0.25 and significant p-value <0.001) to highlight the most relevant GO-terms associated with a given gene list. The visualization of the different pathways can be obtained from the KEGG website using the KEGG prefix and KEGG number (https://www.genome.jp/kegg/pathway.html)
- https://cdn.elifesciences.org/articles/102622/elife-102622-supp3-v2.xlsx
-
Supplementary file 4
Annotation file of CDS extracted from the Crassostrea gigas genome file.
CSV file containing the annotation results collected and processed using Blast2GO for annotation mapping and validation.
- https://cdn.elifesciences.org/articles/102622/elife-102622-supp4-v2.zip
-
Supplementary file 5
Compilation file for RBGOA results.
CSV file containing concatenated results of all RBGOA tests used to draw gene ontology analysis heatmaps with cluster number (<cluster_number>), GO-term universe (<goterm_universe>), number of good gene candidates (<number_of_good_candidates>), total number of genes in this Gene Ontology (GO)-term category (<total_number_of_genes_of_this_category>), GO-term name (<goterm_name>), adjusted p-value (<pval-adj>), and GO-term name variation (<variation>).
- https://cdn.elifesciences.org/articles/102622/elife-102622-supp5-v2.csv
-
Supplementary file 6
Hemocyte composition of the seven Percoll fractions used for qPCR analysis.
For each cell type in each fraction, the table presents the average percentage, standard deviation, standard error, minimum, maximum, and median count values.
- https://cdn.elifesciences.org/articles/102622/elife-102622-supp6-v2.xlsx
-
Supplementary file 7
Transcription factors identified in the single-cell RNA sequencing (scRNA-seq) dataset of Crassostrea gigas hemocytes.
Transcription factors identified in the scRNA-seq dataset and their homology with human proteins, as indicated by the blast alignment results. Each entry includes the gene identifier, the protein it represents in C.gigas, and its human counterpart. The bit score and coverage indicate the strength and extent of the alignment, respectively.
- https://cdn.elifesciences.org/articles/102622/elife-102622-supp7-v2.xlsx
-
Supplementary file 8
Sequences of primers used in this study.
Name of the transcript targeted by the primer pair, name of the primer used in this study, and nucleotide sequence of each primer.
- https://cdn.elifesciences.org/articles/102622/elife-102622-supp8-v2.xlsx
-
MDAR checklist
- https://cdn.elifesciences.org/articles/102622/elife-102622-mdarchecklist1-v2.pdf
Download links
A two-part list of links to download the article, or parts of the article, in various formats.
Downloads (link to download the article as PDF)
Open citations (links to open the citations from this article in various online reference manager services)
Cite this article (links to download the citations from this article in formats compatible with various reference manager tools)
Diversity and functional specialization of oyster immune cells uncovered by integrative single-cell level investigations
eLife 13:RP102622.
https://doi.org/10.7554/eLife.102622.4


