Reprogramming of GM-CSF-dependent alveolar macrophages through GSK3 activity modulation
- Myeloid Cell Laboratory, Centro de Investigaciones Biológicas, CSIC, Spain
- Laboratorio de Inmuno-Metabolismo e Inflamación, Instituto de Investigación Sanitaria Gregorio Marañón (IiSGM), Hospital General Universitario Gregorio Marañón, Spain
- Servicio de Anatomía Patológica, Hospital General Universitario Gregorio Marañón, Spain
- Unidad de Microscopía Confocal, Instituto de Investigación Sanitaria Gregorio Marañón (IiSGM), Hospital General Universitario Gregorio Marañón, Spain
- Experimental Pharmacology and New Tragets in Cardiopulmonary Disorders, Centro de Investigaciones Biológicas, CSIC, Spain
- Servicio de Neumología. Hospital Universitario de Octubre, Spain
- Department of Immunology, Ophthalmology and ENT, Universidad Complutense School of Medicine, Spain
- Instituto de Investigación Hospital Universitario de Octubre (imas12), Spain
- Universidad Complutense School of Medicine, Spain
Figures
Figure 1 with 2 supplements
Transcriptional effect of GSK3 inhibition on monocyte-derived GM-MØ.
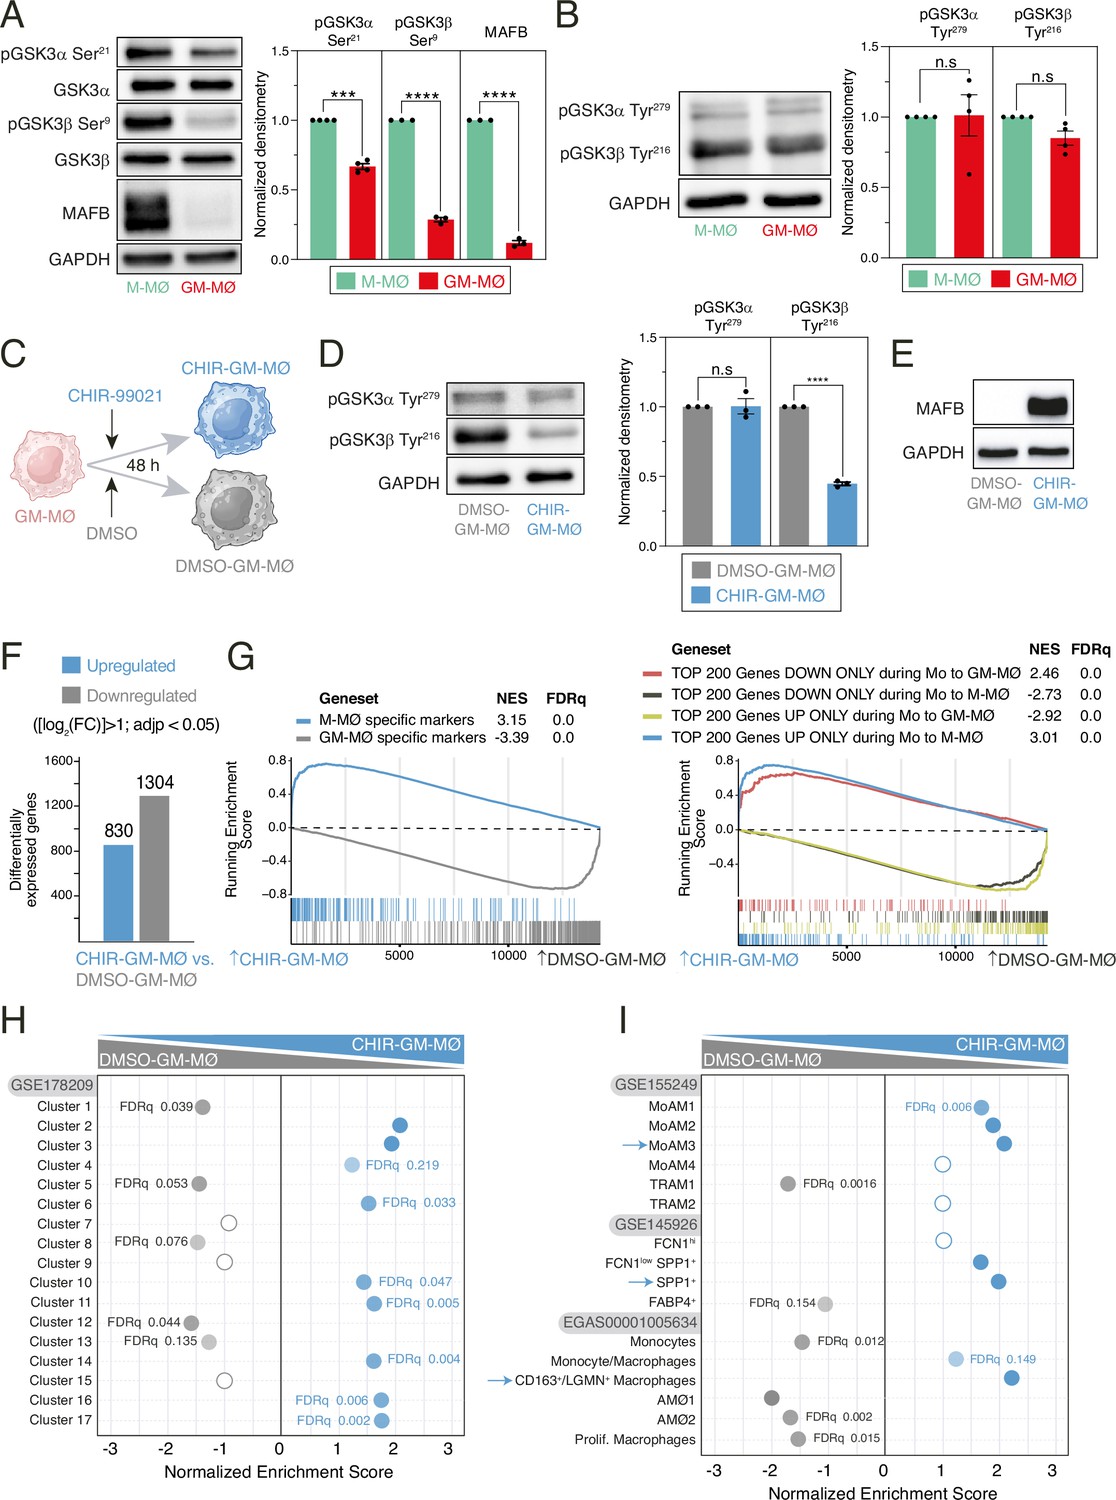
(A) MAFB, total GSK3α, total GSK3β, Ser9-phosphorylated GSK3β, and Ser21-phosphorylated GSK3α levels in M-MØ and GM-MØ, as determined by western blot (left panel). GAPDH protein levels were determined as protein loading control. Mean ± SEM of the MAFB/GAPDH, Ser21-phosphorylated GSK3α/total GSK3α, and Ser9-phosphorylated GSK3β/total GSK3β protein ratios from three independent experiments are shown (right panel) (paired Student’s t-test: ***, p<0.005; ****, p<0.001). A representative western blot experiment is shown in each case in the upper panel. (B) p-Tyr279-GSK3α and p-Tyr216-GSK3β levels in four independent samples of M-MØ and GM-MØ, as determined by western blot (left panel). GAPDH protein levels were determined as protein loading control. Mean ± SEM of the p-Tyr279-GSK3α/GAPDH and p-Tyr216-GSK3β/GAPDH protein ratios from four independent experiments are shown (right panel) (paired Student’s t-test: n.s., not significant). (C) Schematic representation of the exposure of GM-MØ to CHIR-99021 for 48 hr. Figure 1C was created with BioRender.com. (D) Tyr279-phosphorylated GSK3α and Tyr216-phosphorylated GSK3β levels in three independent preparations of DMSO- or CHIR-99021-treated GM-MØ, as determined by western blot (left panel). GAPDH protein levels were determined as protein loading control. Mean ± SEM of the p-Tyr216-GSK3β/GAPDH and p-Tyr279-GSK3α/GAPDH protein ratios from the three independent experiments are shown (right panel) (paired Student’s t-test: ****, p<0.001). (E) MAFB protein levels in DMSO-GM-MØ and CHIR-GM-MØ, as determined by western blot. A representative experiment is shown. (F) Number of differentially expressed genes ([log2FC]>1; adjp<0.05) between DMSO-GM-MØ and CHIR-GM-MØ. Differential gene expression was assessed using DESeq2. (G) Gene set enrichment analysis (GSEA) of the indicated gene sets (from GSE68061, left panel; from GSE188278, right panel) on the ranked comparison of the CHIR-GM-MØ vs. DMSO-GM-MØ transcriptomes. Normalized enrichment score (NES) and FDRq values are indicated in each case. (H) Summary of GSEA of the gene sets that define the tissue-resident monocyte and macrophage states (MoMac-VERSE) Mulder et al., 2021 on the ranked comparison of the CHIR-GM-MØ vs. DMSO-GM-MØ transcriptomes. FDRq values are indicated only if FDRq>0.0; empty dots, not significant. (I) Summary of GSEA of the gene sets that characterize the macrophage subsets identified in severe COVID-19 (Wendisch et al., 2021; Liao et al., 2020; Grant et al., 2021) on the ranked comparison of the CHIR-GM-MØ vs. DMSO-GM-MØ transcriptomes. FDRq values are indicated only if FDRq>0.0; empty dots, not significant.
-
Figure 1—source data 1
PDF file containing original western blots for Figure 1A, indicating the relevant bands.
- https://cdn.elifesciences.org/articles/102659/elife-102659-fig1-data1-v1.pdf
-
Figure 1—source data 2
Original files for western blot analysis displayed in Figure 1A.
- https://cdn.elifesciences.org/articles/102659/elife-102659-fig1-data2-v1.zip
-
Figure 1—source data 3
Protein ratios of MAFB/GAPDH, p-Ser21-GSK3α/total GSK3α, and p-Ser9-GSK3β/total GSK3β in M-MØ and GM-MØ from three to five independent experiments and statistical analysis.
- https://cdn.elifesciences.org/articles/102659/elife-102659-fig1-data3-v1.xlsx
-
Figure 1—source data 4
PDF file containing original western blots for Figure 1B, indicating the relevant bands.
- https://cdn.elifesciences.org/articles/102659/elife-102659-fig1-data4-v1.pdf
-
Figure 1—source data 5
Original files for western blot analysis displayed in Figure 1B.
- https://cdn.elifesciences.org/articles/102659/elife-102659-fig1-data5-v1.zip
-
Figure 1—source data 6
Protein ratios of p-Tyr279-GSK3α/GAPDH and p-Tyr216-GSK3β/GAPDH in M-MØ and GM-MØ from four independent experiments and statistical analysis.
- https://cdn.elifesciences.org/articles/102659/elife-102659-fig1-data6-v1.xlsx
-
Figure 1—source data 7
PDF file containing original western blots for Figure 1D, indicating the relevant bands.
- https://cdn.elifesciences.org/articles/102659/elife-102659-fig1-data7-v1.pdf
-
Figure 1—source data 8
Original files for western blot analysis displayed in Figure 1D.
- https://cdn.elifesciences.org/articles/102659/elife-102659-fig1-data8-v1.zip
-
Figure 1—source data 9
Protein ratios of p-Tyr216-GSK3β/GAPDH and p-Tyr279-GSK3α/GAPDH in DMSO-GM-MØ and CHIR-GM-MØ from three independent experiments and statistical analysis.
- https://cdn.elifesciences.org/articles/102659/elife-102659-fig1-data9-v1.xlsx
-
Figure 1—source data 10
PDF file containing original western blots for Figure 1E, indicating the relevant bands.
- https://cdn.elifesciences.org/articles/102659/elife-102659-fig1-data10-v1.pdf
-
Figure 1—source data 11
Original files for western blot analysis displayed in Figure 1E.
- https://cdn.elifesciences.org/articles/102659/elife-102659-fig1-data11-v1.zip
Figure 1—figure supplement 1
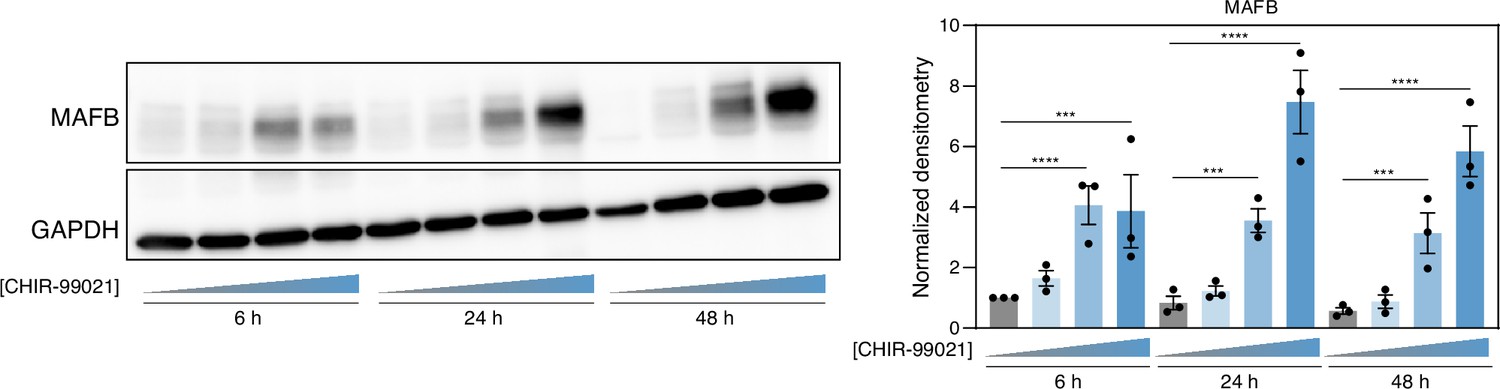
MAFB protein levels in GM-MØ exposed to DMSO or distinct CHIR-99021 concentrations (0.1 μM, 1 μM, 10 μM) for 6–48 hr, as determined by western blot (left panel).
GAPDH protein levels were determined as protein loading control. Mean ± SEM of the MAFB/GAPDH protein ratio from three independent experiments is shown (right panel) (one-way ANOVA with Fisher’s LSD test: ***, p<0.005; ****, p<0.001).
Figure 1—figure supplement 2
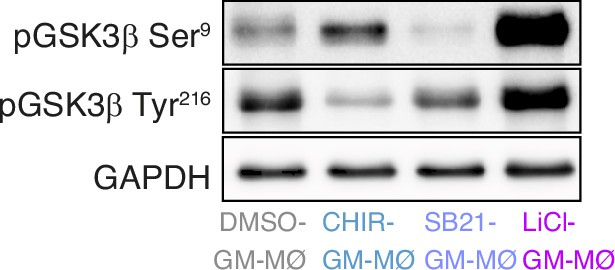
p-Ser9-GSK3β and p-Tyr216-GSK3β levels in GM-MØ treated with DMSO, CHIR-99021 (10 μM), SB-216763 (10 μM) or LiCl (10 mM) for 48 hr, as determined by western blot.
A representative experiment of three independent experiments is shown in the left panel. GAPDH protein levels were determined as protein loading control.
Figure 2 with 1 supplement
Phenotypic effects of GSK3 inhibition on monocyte-derived GM-MØ: enhanced expression of MAFB-dependent genes and proteins.
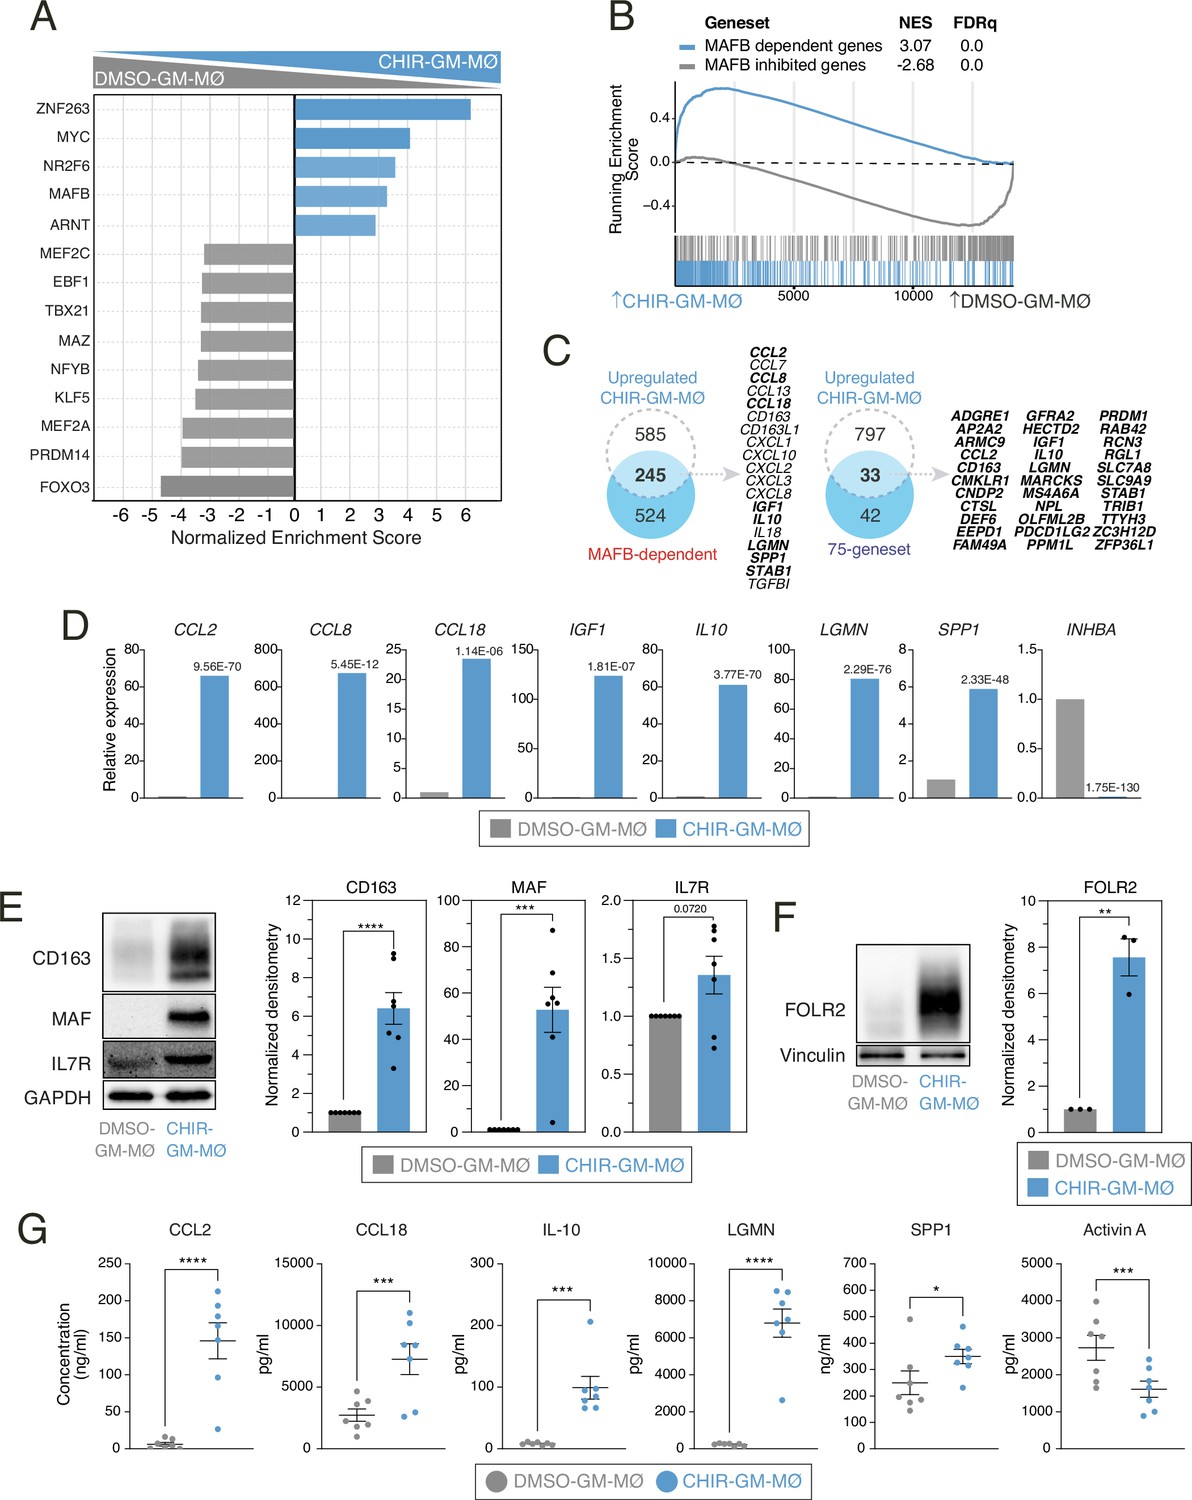
(A) DoRoThEA (Garcia-Alonso et al., 2019) analysis on the ranked comparison of the DMSO-GM-MØ and CHIR-GM-MØ transcriptomes. (B) Gene set enrichment analysis (GSEA) of MAFB-regulated gene sets (from GSE155719) on the ranked comparison of the DMSO-GM-MØ and CHIR-GM-MØ transcriptomes. NES and FDRq values are indicated in each case. (C) Overlap between the genes upregulated (|log2FC|>1; adjp<0.05) in CHIR-GM-MØ (relative to DMSO M-MØ) and MAFB-dependent genes (from GSE155719, left panel) or the 75-geneset of MAFB-regulated genes (right panel) (Simón-Fuentes et al., 2023), with indication of some of the overlapping genes. (D) Relative mRNA levels of the indicated genes in DMSO-GM-MØ and CHIR-GM-MØ, as determined by RNA-Seq on three independent samples (GSE256208). Adjp of the comparison, shown in each case, was assessed using DESeq2. (E) CD163, MAF, and IL7R protein levels in DMSO-GM-MØ and CHIR-GM-MØ, as determined by western blot (left panel). GAPDH protein levels were determined as protein loading control. Mean ± SEM of the MAF/GAPDH, IL7R/GAPDH, and CD163/GAPDH protein ratios from seven independent experiments are shown (right panels) (paired Student’s t-test: ***, p<0.005; ****, p<0.001). A representative western blot experiment is shown in each case. (F) FOLR2 protein levels in DMSO-GM-MØ and CHIR-GM-MØ, as determined by western blot (left panel). Vinculin protein levels were determined as protein loading control. Mean ± SEM of the FOLR2/Vinculin protein ratio from three independent experiments is shown (lower panel) (paired Student’s t-test: **, p<0.01). A representative western blot experiment is shown. (G) Production of the indicated soluble factors by DMSO-GM-MØ and CHIR-GM-MØ, as determined by ELISA. Mean ± SEM of seven independent samples are shown (paired Student’s t-test: *, p<0.05; **, p<0.01; ***, p<0.005; ****, p<0.001).
-
Figure 2—source data 1
Discriminant regulon expression analysis (DoRothEA) of DMSO-GM-MØ and CHIR-GM-MØ transcriptomes.
Top 15 transcription factors are shown.
- https://cdn.elifesciences.org/articles/102659/elife-102659-fig2-data1-v1.xlsx
-
Figure 2—source data 2
mRNA levels (read counts) of the indicated genes in DMSO-GM-MØ and CHIR-GM-MØ, as determined by RNA-Seq on three independent experiments.
- https://cdn.elifesciences.org/articles/102659/elife-102659-fig2-data2-v1.xlsx
-
Figure 2—source data 3
PDF file containing original western blots for Figure 2E, indicating the relevant bands.
- https://cdn.elifesciences.org/articles/102659/elife-102659-fig2-data3-v1.pdf
-
Figure 2—source data 4
Original files for western blot analysis displayed in Figure 2E.
- https://cdn.elifesciences.org/articles/102659/elife-102659-fig2-data4-v1.zip
-
Figure 2—source data 5
Protein ratios of MAF/GAPDH, IL7R/GAPDH, and CD163/GAPDH in DMSO-GM-MØ and CHIR-GM-MØ from seven independent experiments and statistical analysis.
- https://cdn.elifesciences.org/articles/102659/elife-102659-fig2-data5-v1.xlsx
-
Figure 2—source data 6
PDF file containing original western blots for Figure 2F, indicating the relevant bands.
- https://cdn.elifesciences.org/articles/102659/elife-102659-fig2-data6-v1.pdf
-
Figure 2—source data 7
Original files for western blot analysis displayed in Figure 2F.
- https://cdn.elifesciences.org/articles/102659/elife-102659-fig2-data7-v1.zip
-
Figure 2—source data 8
Protein ratios of FOLR2/Vinculin in DMSO-GM-MØ and CHIR-GM-MØ from three independent experiments and statistical analysis.
- https://cdn.elifesciences.org/articles/102659/elife-102659-fig2-data8-v1.xlsx
-
Figure 2—source data 9
Concentration of CCL2, CCL18, IL10, LGMN, SPP1, and Activin A in DMSO-GM-MØ and CHIR-GM-MØ from seven independent experiments and statistical analysis.
- https://cdn.elifesciences.org/articles/102659/elife-102659-fig2-data9-v1.xlsx
Figure 2—figure supplement 1
Gene ontology analysis of the genes upregulated (|log2FC|>1; adjp<0.05) in CHIR-GM-MØ (relative to DMSO GM-MØ) using Enrichr and the indicated databases.
Figure 3 with 3 supplements
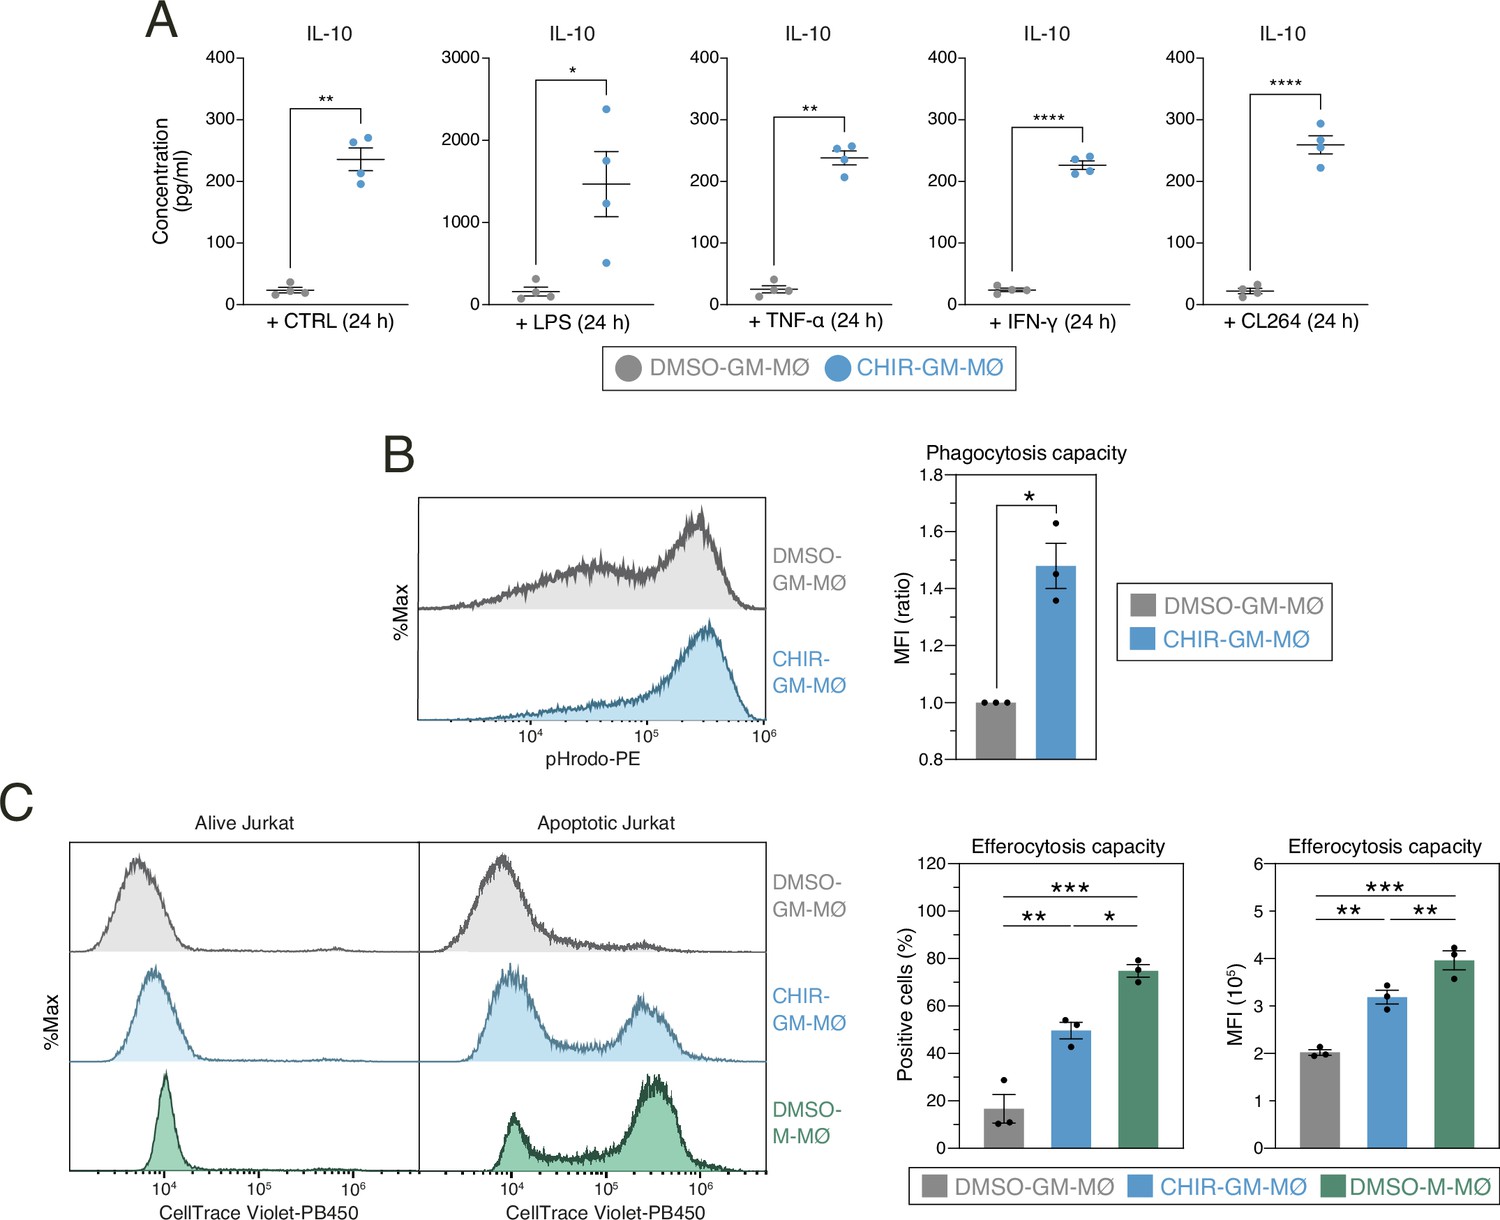
Functional consequences of GSK3 inhibition on monocyte-derived GM-MØ.
(A) Production of IL-10 by untreated (-) or stimulated (LPS, TNF, IFNγ, or CL264) DMSO-GM-MØ and CHIR-GM-MØ, as determined by ELISA. Mean ± SEM of four independent samples are shown (paired Student’s t-test: *, p<0.05; **, p<0.01; ***, p<0.005; ****, p<0.001). (B) Phagocytosis of pHRodo-labeled bacterial particles by DMSO-GM-MØ and CHIR-GM-MØ, as determined by flow cytometry. Mean ± SEM of three independent samples is shown (paired Student’s t-test: *, p<0.05). A representative flow cytometry analysis is shown in the left panel. (C) Efferocytosis capacity of DMSO-GM-MØ, CHIR-GM-MØ, and DMSO-M-MØ, as determined by flow cytometry using staurosporine-induced CellTrace Violet-labeled apoptotic Jurkat cells. The percentage of positive cells and mean fluorescence intensity are shown. Mean ± SEM of three independent samples are shown (one-way ANOVA with Fisher’s LSD test: *, p<0.05; **, p<0.01; ***, p<0.005). Representative flow cytometry histograms for CellTrace Violet emission of DMSO-GM-MØ, CHIR-GM-MØ, and DMSO-M-MØ are shown.
-
Figure 3—source data 1
Concentration of IL10 by untreated (-) or stimulated (LPS, TNF, IFNγ, or CL264) DMSO-GM-MØ and CHIR-GM-MØ from four independent experiments and statistical analysis.
- https://cdn.elifesciences.org/articles/102659/elife-102659-fig3-data1-v1.xlsx
-
Figure 3—source data 2
Phagocytosis of pHRodo-labeled bacterial particles.
Percentage of positive cells and mean fluorescence intensity in DMSO-GM-MØ and CHIR-GM-MØ from three independent experiments and statistical analysis.
- https://cdn.elifesciences.org/articles/102659/elife-102659-fig3-data2-v1.xlsx
-
Figure 3—source data 3
Efferocytosis of apoptotic Jurkat cells.
Percentage of positive cells and mean fluorescence intensity in DMSO-GM-MØ and CHIR-GM-MØ from three independent experiments and statistical analysis.
- https://cdn.elifesciences.org/articles/102659/elife-102659-fig3-data3-v1.xlsx
Figure 3—figure supplement 1

Oxygen consumption rate (OCR) profile of DMSO-GM-MØ and CHIR-GM-MØ monitored using the Seahorse Biosciences extracellular flux analyzer at the indicated time points.
Cells were treated sequentially, as indicated, with 1 mM oligomycin (Oligo), 0.6 plus 0.4 mM carbonyl cyanide p-(trifluoromethoxy)phenylhydrazone (FCCP), and 1 mM rotenone plus 1 mM antimycin A (Rot/AA).
Figure 3—figure supplement 2

Extracellular acidification rate (ECAR), a proxy for the rate of lactate production, measured in DMSO-GM-MØ and CHIR-GM-MØ under basal conditions after the stimulation with 1 mM oligomycin and at the indicated time points.
Figure 3—figure supplement 3
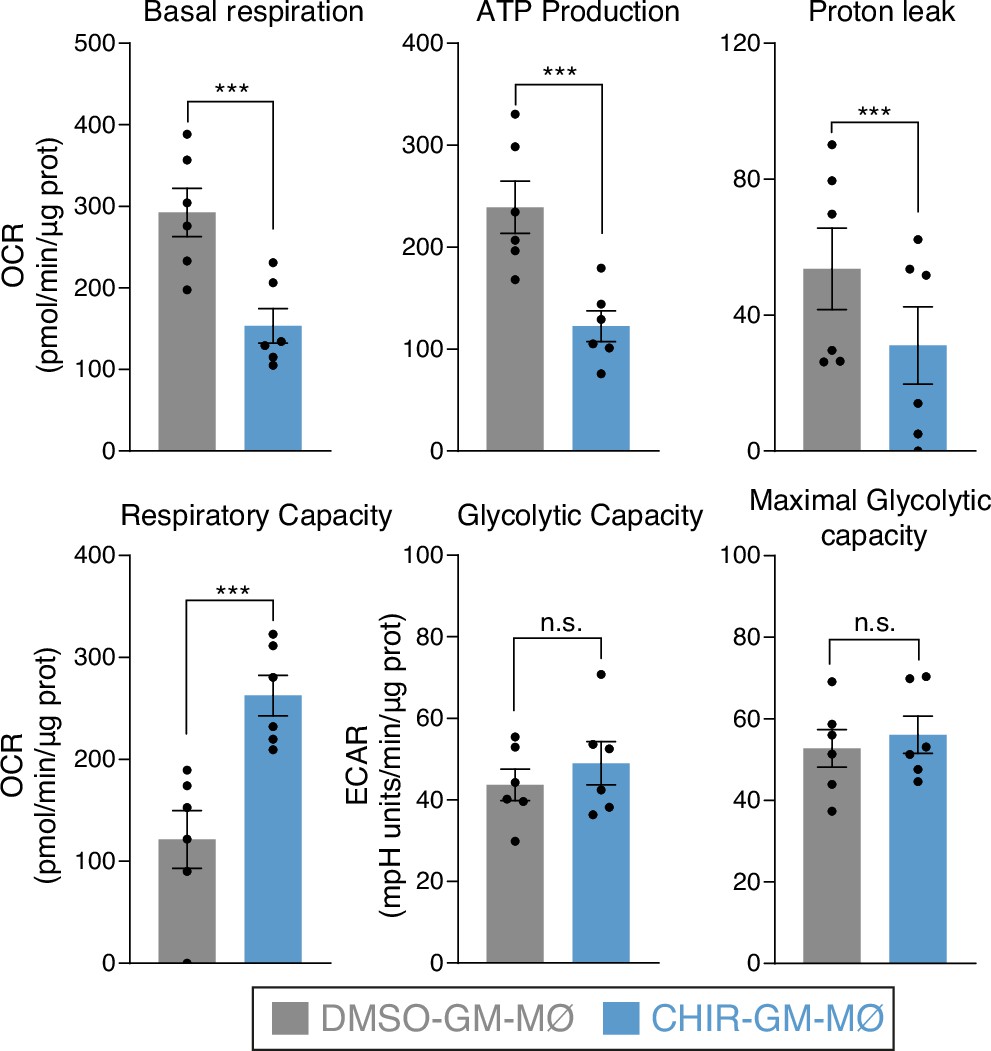
Metabolic parameters obtained from the oxygen consumption rate (OCR) and extracellular acidification rate (ECAR) profiling after subtraction of the rotenone/antimycin-insensitive respiration.
Basal OCR is the oxygen consumption rate in the absence of effectors. ATP turnover is considered as the oligomycin-sensitive respiration, maximal respiration is the OCR value in the presence of the uncoupler carbonyl cyanide p-(trifluoromethoxy)phenylhydrazone (FCCP), glycolytic capacity is the ECAR value after the inhibition with oligomycin of the mitochondrial ATP synthesis (paired Student’s t-test: ***, p<0.005; n.s., not significant). Results are normalized according to protein concentrations and presented as mean ± SEM of six independent samples.
Figure 4 with 1 supplement
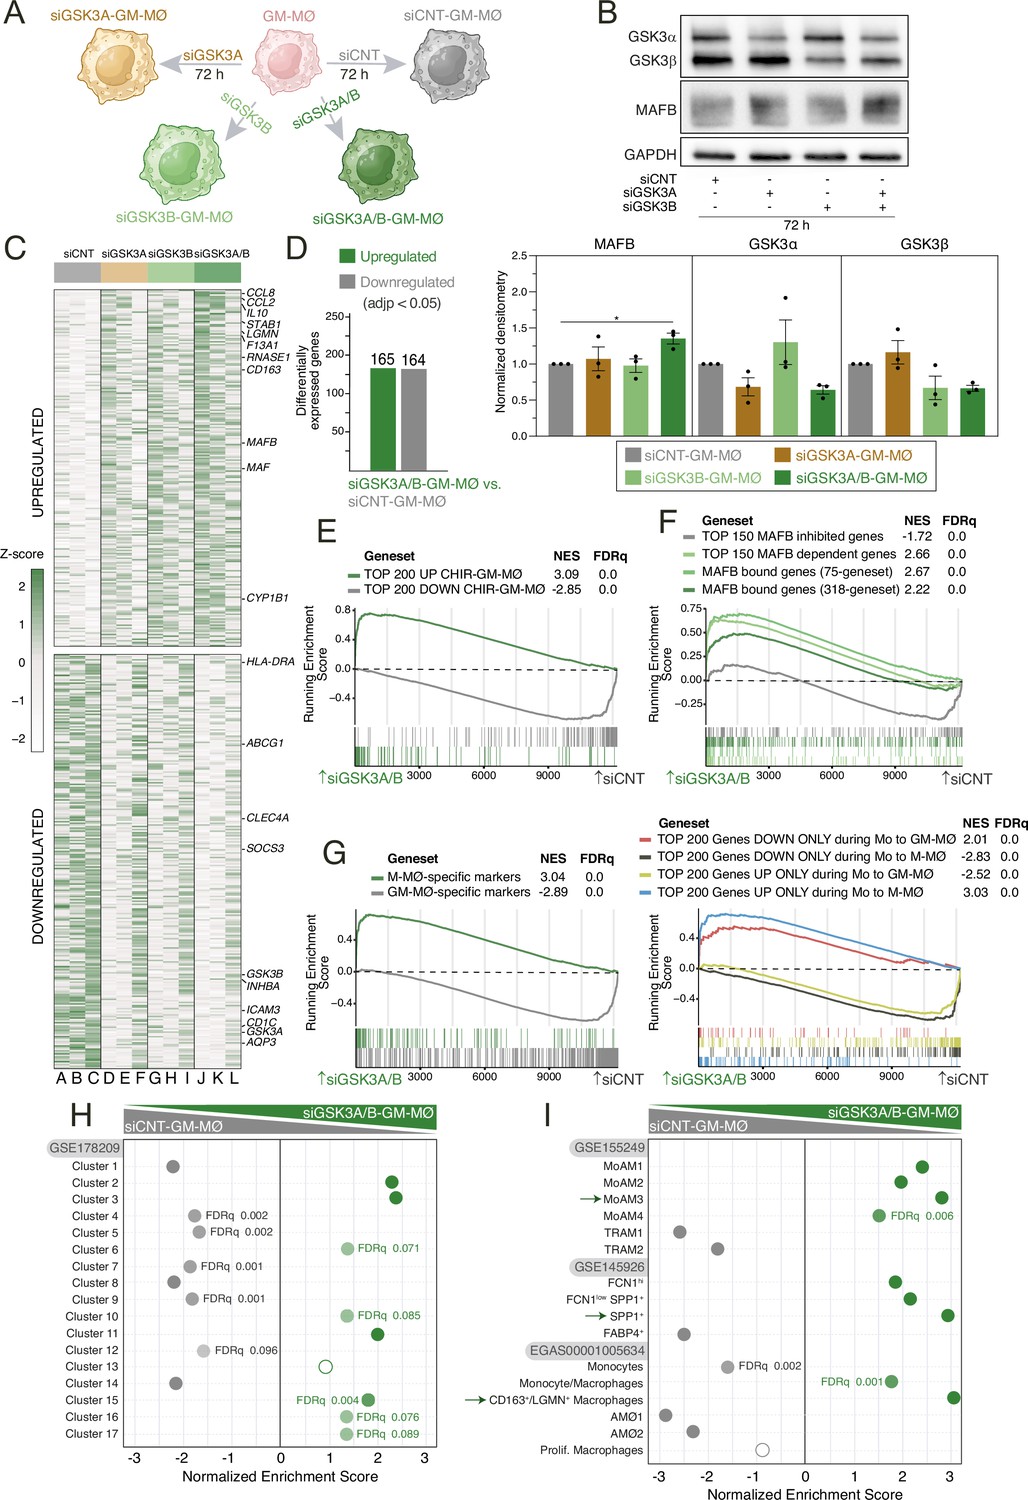
Transcriptional effects of GSK3 knockdown in monocyte-derived GM-MØ.
(A) Schematic representation of the siRNA-mediated GSK3 knockdown procedure in monocyte-derived GM-MØ. Figure 4 A was created with BioRender.com. (B) Total GSK3α, GSK3β, and MAFB protein levels in monocyte-derived GM-MØ after siRNA-mediated GSK3A and/or GSK3B silencing, as determined by western blot (upper panel). GAPDH protein levels were determined as protein loading control. Mean ± SEM of GSK3β/GAPDH and GSK3α/GAPDH protein ratios from the three independent experiments are shown (lower panel) (one-way ANOVA with Dunnett’s test: *, p<0.05). (C) Heatmap of the relative expression of the genes significantly altered after GSK3A and GSK3B knockdown in siCNT-GM-MØ (lanes A–C), siGSK3A-GM-MØ (lanes D–F), siGSK3B-GM-MØ (lanes G–I), siGSK3A/B-GM-MØ (lanes J–L). Representative genes are indicated. (D) Number of differentially expressed genes (adjp<0.05) between siGSK3A-GM-MØ, siGSK3B-GM-MØ, or siGSK3A/B-GM-MØ and siCNT-GM-MØ. Differential gene expression was assessed using DESeq2. (E) Gene set enrichment analysis (GSEA) of the genes whose expression is significantly modulated by CHIR-99021 in either GM-MØ (from Figure 1, this manuscript) or in ex vivo isolated alveolar macrophages (AMØ, see below in Figure 6) on the ranked comparison of the siGSK3A/B-GM-MØ vs. siCNT-GM-MØ transcriptomes. (F) GSEA of the indicated gene sets (from GSE68061) on the ranked comparison of the siGSK3A/B-GM-MØ vs. siCNT-GM-MØ transcriptomes. (G) Summary of GSEA of the indicated gene sets (from GSE188278) on the ranked comparison of siGSK3A/B-GM-MØ vs. siCNT-GM-MØ. (H) Summary of GSEA of the gene sets that define the tissue-resident monocyte and macrophage states (MoMac-VERSE) Mulder et al., 2021 on the ranked comparison of the siGSK3A/B-GM-MØ vs. siCNT-GM-MØ transcriptomes. FDRq values are indicated only if FDRq>0.0; empty dots, not significant. (I) Summary of GSEA of the gene sets that characterize the macrophage subsets identified in severe COVID-19 (Wendisch et al., 2021; Liao et al., 2020; Grant et al., 2021) on the ranked comparison of siGSK3A/B-GM-MØ vs. siCNT-GM-MØ. FDRq values are indicated only if FDRq>0.0; empty dots, not significant.
-
Figure 4—source data 1
PDF file containing original western blots for Figure 4B, indicating the relevant bands.
- https://cdn.elifesciences.org/articles/102659/elife-102659-fig4-data1-v1.pdf
-
Figure 4—source data 2
Original files for western blot analysis displayed in Figure 4B.
- https://cdn.elifesciences.org/articles/102659/elife-102659-fig4-data2-v1.zip
-
Figure 4—source data 3
Protein ratios of GSK3β/GAPDH and GSK3α/GAPDH in monocyte-derived GM-MØ after siRNA-mediated GSK3A and/or GSK3B silencing from the three independent experiments and statistical analysis.
- https://cdn.elifesciences.org/articles/102659/elife-102659-fig4-data3-v1.xlsx
Figure 4—figure supplement 1

Summary of gene set enrichment analysis (GSEA) of the gene sets that characterize the macrophage subsets identified in severe COVID-19 (Wendisch et al., 2021; Liao et al., 2020; Grant et al., 2021) on the ranked comparison of siGSK3A-GM-MØ vs. siCNT-GM-MØ (square symbols), siGSK3B-GM-MØ vs. siCNT-GM-MØ (star symbols), and siGSK3A/B-GM-MØ vs. siCNT-GM-MØ.
FDRq values are indicated only if FDRq>0.0; empty dots, not significant.
Figure 5 with 3 supplements
Transcriptional effects of GSK3 inhibition on human peripheral blood monocytes.
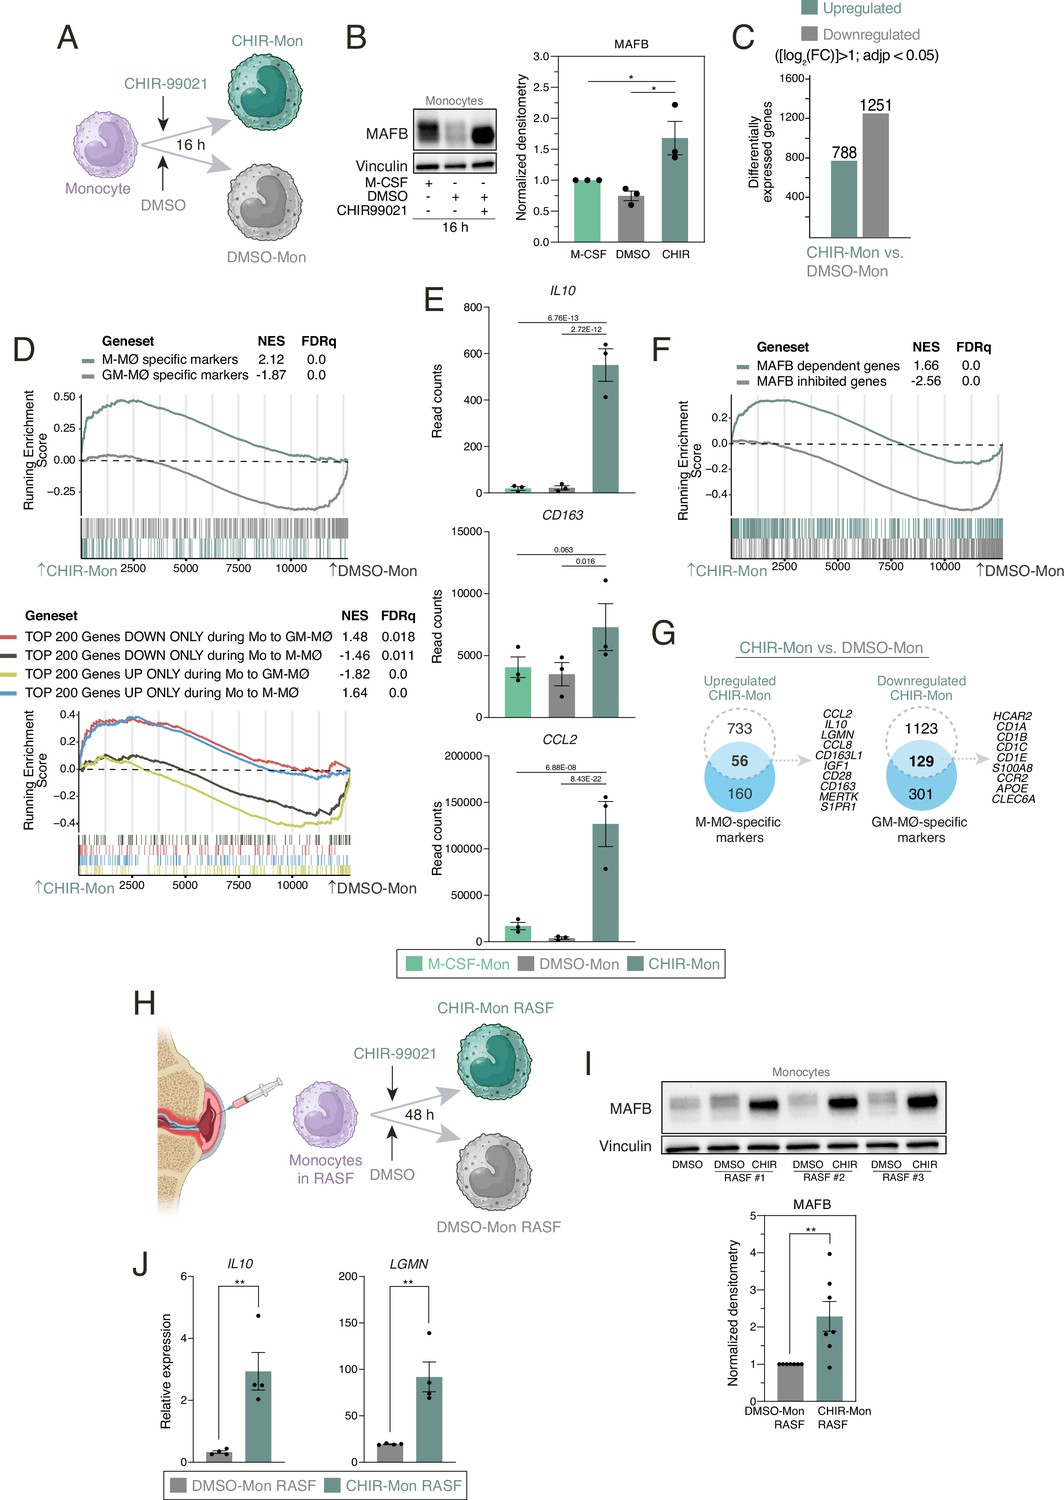
(A) Schematic representation of the exposure of human monocytes to CHIR-99021 or DMSO for 16 hr. Figure 5A was created with BioRender.com. (B) MAFB protein levels in monocytes exposed for 16 hr to DMSO, CHIR-99021, or M-CSF, as determined by western blot (left panel). Vinculin protein levels were determined as protein loading control. Mean ± SEM of the MAFB/Vinculin protein ratio from the three independent experiments is shown (right panel) (one-way ANOVA with Fisher’s LSD test: ***, p<0.005). (C) Number of differentially expressed genes ([log2FC]>1; adjp<0.05) between DMSO-Mon and CHIR-Mon. Differential gene expression was assessed using DESeq2. (D) Gene set enrichment analysis (GSEA) of the indicated gene sets (from GSE68061, upper panel; from GSE188278, lower panel) on the ranked comparison of the DMSO-Mon and CHIR-Mon transcriptomes. NES and FDRq values are indicated in each case. (E) Relative mRNA levels of the indicated genes in monocytes exposed for 16 hr to DMSO, CHIR-99021, or M-CSF, as determined by RNA-Seq on three independent samples (GSE256538). Adjp of the comparison, shown in each case, was assessed using DESeq2. (F) GSEA of MAFB-regulated gene sets (from GSE155719) on the ranked comparison of the DMSO-Mon and CHIR-Mon transcriptomes. NES and FDRq values are indicated in each case. (G) Overlap between the genes upregulated (|log2FC|>1; adjp<0.05) in CHIR-Mon (relative to DMSO-Mon) and M-MØ-specific marker genes (from GSE68061) (left panel) and genes downregulated (|log2FC|>1; adjp<0.05) in CHIR-Mon (relative to DMSO-Mon) and GM-MØ-specific marker genes (from GSE68061) (right panel), with indication of some of the overlapping genes. (H) Schematic representation of the exposure of human monocytes to synovial fluid from rheumatoid arthritis patients (RASF) for 48 hr in the presence or absence of CHIR-99021. Figure 5H created with BioRender.com. (I) MAFB protein levels in monocytes exposed to three independent samples of RASF in the presence of DMSO or CHIR-99021, as determined by western blot (upper panel). Vinculin protein levels were determined as protein loading control. Mean ± SEM of the MAFB/Vinculin protein ratio from seven independent experiments using three monocyte preparations and three unrelated RASF (lower panel) (paired Student’s t-test: **, p<0.01). (J) Relative expression of IL10 and LGMN in monocytes exposed to RASF in the presence of DMSO or CHIR-99021, as determined by RT-PCR. Mean ± SEM of the results from the three independent samples are shown (paired Student’s t-test: **, p<0.01).
-
Figure 5—source data 1
PDF file containing original western blots for Figure 5B, indicating the relevant bands.
- https://cdn.elifesciences.org/articles/102659/elife-102659-fig5-data1-v1.pdf
-
Figure 5—source data 2
Original files for western blot analysis displayed in Figure 5B.
- https://cdn.elifesciences.org/articles/102659/elife-102659-fig5-data2-v1.zip
-
Figure 5—source data 3
Protein ratios of MAFB/Vinculin in monocytes exposed for 16 hr to DMSO, CHIR-99021, or M-CSF from the three independent experiments and statistical analysis.
- https://cdn.elifesciences.org/articles/102659/elife-102659-fig5-data3-v1.xlsx
-
Figure 5—source data 4
Relative mRNA levels of the indicated genes in monocytes exposed for 16 hr to DMSO, CHIR-99021, or M-CSF on three independent experiments.
- https://cdn.elifesciences.org/articles/102659/elife-102659-fig5-data4-v1.xlsx
-
Figure 5—source data 5
DF file containing original western blots for Figure 5I, indicating the relevant bands.
- https://cdn.elifesciences.org/articles/102659/elife-102659-fig5-data5-v1.pdf
-
Figure 5—source data 6
Original files for western blot analysis displayed in Figure 5I.
- https://cdn.elifesciences.org/articles/102659/elife-102659-fig5-data6-v1.zip
-
Figure 5—source data 7
Protein ratios of MAFB/Vinculin in monocytes exposed to synovial fluid from rheumatoid arthritis patients (RASF) in the presence of DMSO or CHIR-99021 from seven independent experiments and statistical analysis.
- https://cdn.elifesciences.org/articles/102659/elife-102659-fig5-data7-v1.xlsx
-
Figure 5—source data 8
Relative expression of IL10 and LGMN in monocytes exposed to synovial fluid from rheumatoid arthritis patients (RASF) in the presence of DMSO or CHIR-99021 from four independent experiments and statistical analysis.
- https://cdn.elifesciences.org/articles/102659/elife-102659-fig5-data8-v1.xlsx
Figure 5—figure supplement 1

Gene set enrichment analysis (GSEA) of bona fide MAFB-bound genes (‘75-genelist’) (Simón-Fuentes et al., 2023) on the ranked comparison of the transcriptomes of CHIR-Mon vs. DMSO-Mon.
NES and FDRq value are indicated.
Figure 5—figure supplement 2

Summary of gene set enrichment analysis (GSEA) of the gene sets that characterize the macrophage subsets identified in severe COVID-19 (Wendisch et al., 2021; Liao et al., 2020; Grant et al., 2021) on the ranked comparison of the transcriptomes of CHIR-Mon vs. DMSO-Mon.
FDRq values are indicated only if FDRq>0.0; empty dots, not significant.
Figure 5—figure supplement 3

Overlap between the genes upregulated (|log2FC|>1; adjp<0.05) in CHIR-Mon (relative to M-CSF-Mon) and M-MØ-specific marker genes (left panel) and genes downregulated (|log2FC|>1; adjp<0.05) in CHIR-Mon (relative to M-CSF-Mon) and GM-MØ-specific marker genes (right panel), with indication of some shared genes.
Figure 6 with 3 supplements
Transcriptional and phenotypic effects of GSK3 inhibition on ex vivo isolated human alveolar macrophages.
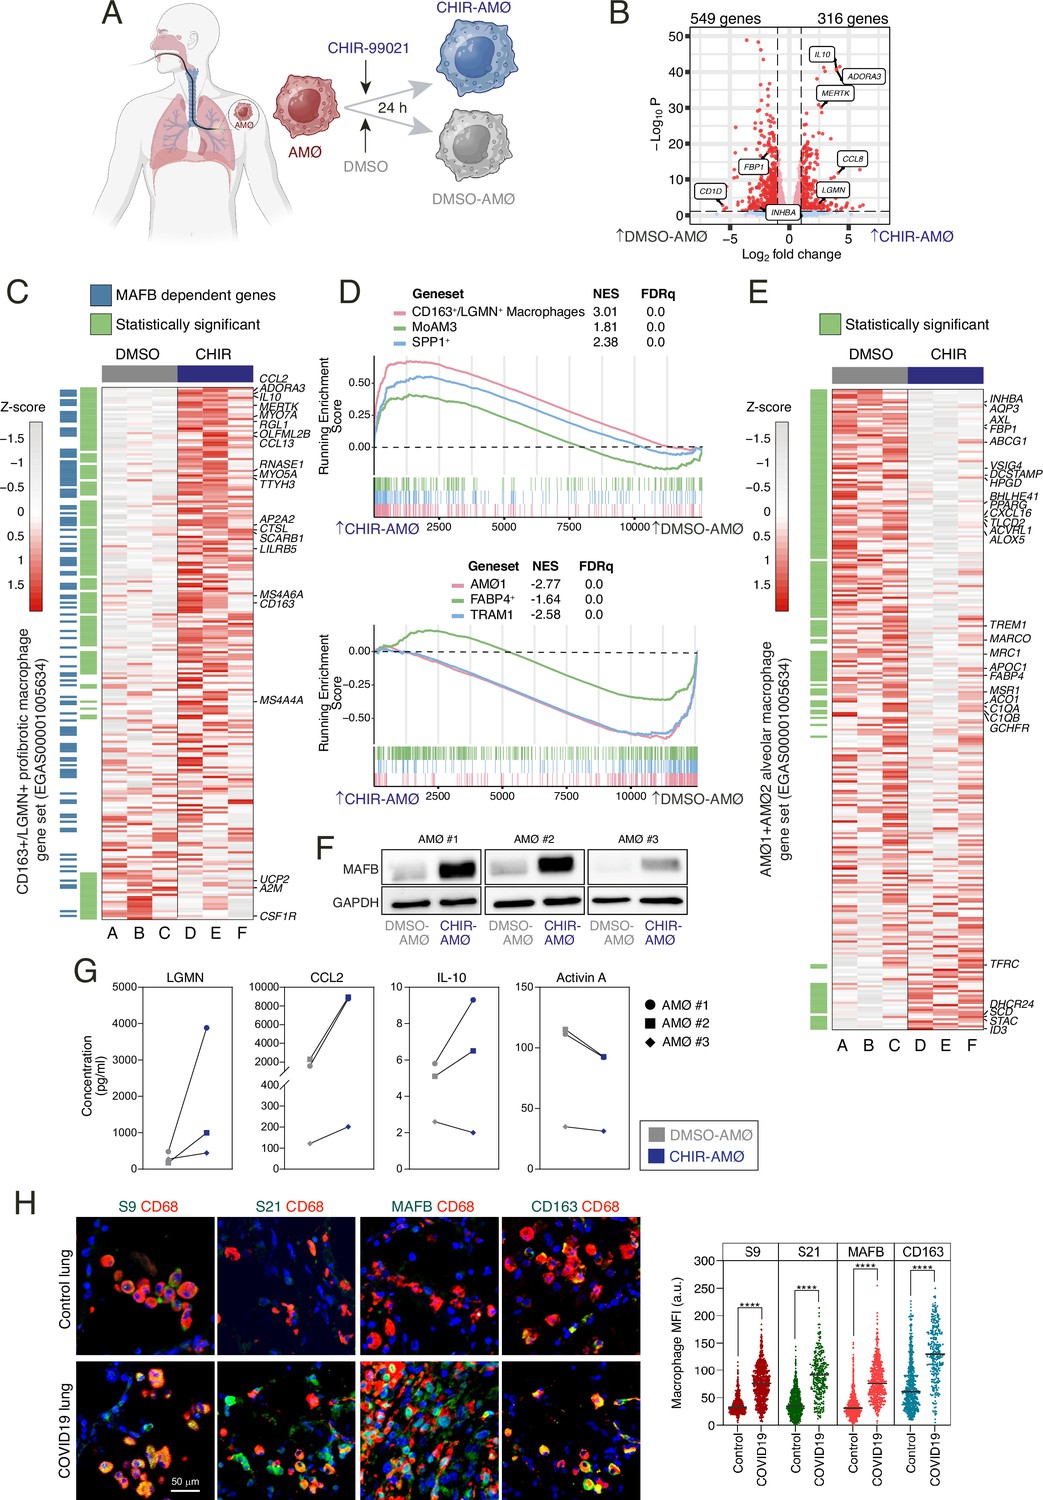
(A) Schematic representation of the exposure of ex vivo isolated human alveolar macrophages to CHIR-99021 or DMSO for 24 hr. Figure 6A created with BioRender.com. (B) Volcano plot depicting the differentially expressed genes between CHIR-AMØ and DMSO-AMØ. (C) Heatmap of the relative expression of the genes within the CD163+/LGMN+ pro-fibrotic monocyte-derived macrophage cluster (from EGAS00001005634) (Wendisch et al., 2021) in DMSO-AMØ (lanes A–C) and CHIR-AMØ (lanes D–F). Differentially expressed between CHIR-AMØ and DMSO-AMØ are shown in green, and MAFB-dependent genes (GSE155719) are shown in blue. Representative genes are indicated. (D) (Upper panel) Gene set enrichment analysis (GSEA) of the gene sets that characterize the monocyte-derived pro-fibrotic macrophage subsets identified in severe COVID-19, namely CD163+/LGMN+ (EGAS00001005634) (Wendisch et al., 2021), MoAM3 (GSE155249) (Grant et al., 2021), and SPP1+ (GSE145926) (Liao et al., 2020), on the ranked comparison of the transcriptomes of CHIR-AMØ vs. DMSO-AMØ. NES and FDRq values are indicated in each case. (Lower panel) GSEA of the gene sets that characterize tissue-resident alveolar macrophages in severe COVID-19, namely AMØ1 (EGAS00001005634) (Wendisch et al., 2021), TRAM1+ (GSE155249) (Grant et al., 2021), and FABP4+ (GSE145926) (Liao et al., 2020) on the ranked comparison of the transcriptomes of CHIR-AMØ vs. DMSO-AMØ. (E) Heatmap of the relative expression of the genes within the alveolar macrophage signature (including all the genes overexpressed in the AMØ1 and AMØ2 macrophages clusters from EGAS00001005634) (Wendisch et al., 2021) in DMSO-AMØ (lanes A–C) and CHIR-AMØ (lanes D–F). Differentially expressed between CHIR-AMØ and DMSO-AMØ are indicated in green, and selected genes are shown. (F) MAFB protein levels in three independent samples of ex vivo isolated AMØ exposed to DMSO or CHIR-99021 for 24 hr, as determined by western blot. GAPDH protein levels were determined as protein loading control. (G) Production of the indicated soluble factors by three independent preparations of DMSO-AMØ and CHIR-AMØ, as determined by ELISA. (H) Expression of inactive GSK3 (S9, pSer9-GSK3β; S21, pSer21-GSK3α), MAFB, and CD163 in human lung macrophages. Representative human lung tissues from COVID (n=2) and control (n=3) patients co-stained for CD68 (macrophage marker, red), Ser21-phosphorylated GSK3α, Ser9-phosphorylated GSK3β, MAFB or CD163 (green), and DAPI (nuclei, blue), as indicated (scale bar, 50 μm) (left panel). Plots show mean fluorescence intensity (MFI) (in arbitrary units, a.u.) of single-cell CD68+ macrophages stained for each antibody (right panel) (paired Student’s t-test: ****, p<0.001).
-
Figure 6—source data 1
PDF file containing original western blots for Figure 6F, indicating the relevant bands.
- https://cdn.elifesciences.org/articles/102659/elife-102659-fig6-data1-v1.pdf
-
Figure 6—source data 2
Original files for western blot analysis displayed in Figure 6F.
- https://cdn.elifesciences.org/articles/102659/elife-102659-fig6-data2-v1.zip
-
Figure 6—source data 3
Concentration of CCL2, IL10, LGMN, and Activin A in DMSO-AMØ and CHIR-AMØ from three independent preparations and statistical analysis.
- https://cdn.elifesciences.org/articles/102659/elife-102659-fig6-data3-v1.xlsx
-
Figure 6—source data 4
Mean fluorescence intensity of single-cell CD68+ macrophages stained with antibodies for inactive GSK3, MAFB, and CD163 in human lung macrophages from two independent COVID-19 samples.
- https://cdn.elifesciences.org/articles/102659/elife-102659-fig6-data4-v1.xlsx
Figure 6—figure supplement 1

Overlap between the genes upregulated or downregulated in CHIR-AMØ (|log2FC|>1 and adjp<0.05) and the CD163+/LGMN+ pro-fibrotic macrophage cluster defined in EGAS00001005634 (Wendisch et al., 2021) (left panel) or the gene sets of MAFB-dependent (middle panel) and MAFB-inhibited (right panel) genes defined in GSE155719 (Simón-Fuentes et al., 2023).
Figure 6—figure supplement 2

Overlap between the genes upregulated or downregulated in CHIR-AMØ (|log2FC|>1 and adjp<0.05, or just adjp<0.05) and the alveolar macrophage signature as defined in EGAS00001005634 (AMØ1 and AMØ2 clusters) (Wendisch et al., 2021) (left panel), GSE155249 (TRAM1 and TRAM2 clusters) (Grant et al., 2021) (middle panel), or in Melms et al., 2021 (right panel).
Figure 6—figure supplement 3

Summary of gene set enrichment analysis (GSEA) of the indicated gene sets (from GSE68061 and GSE188278) on the ranked comparison of the DMSO-AMØ and CHIR-AMØ transcriptomes.
FDRq values are indicated only if FDRq>0.0.
Figure 7 with 7 supplements
Differential expression of GSK3-regulated genes in human lung interstitial and alveolar macrophages.
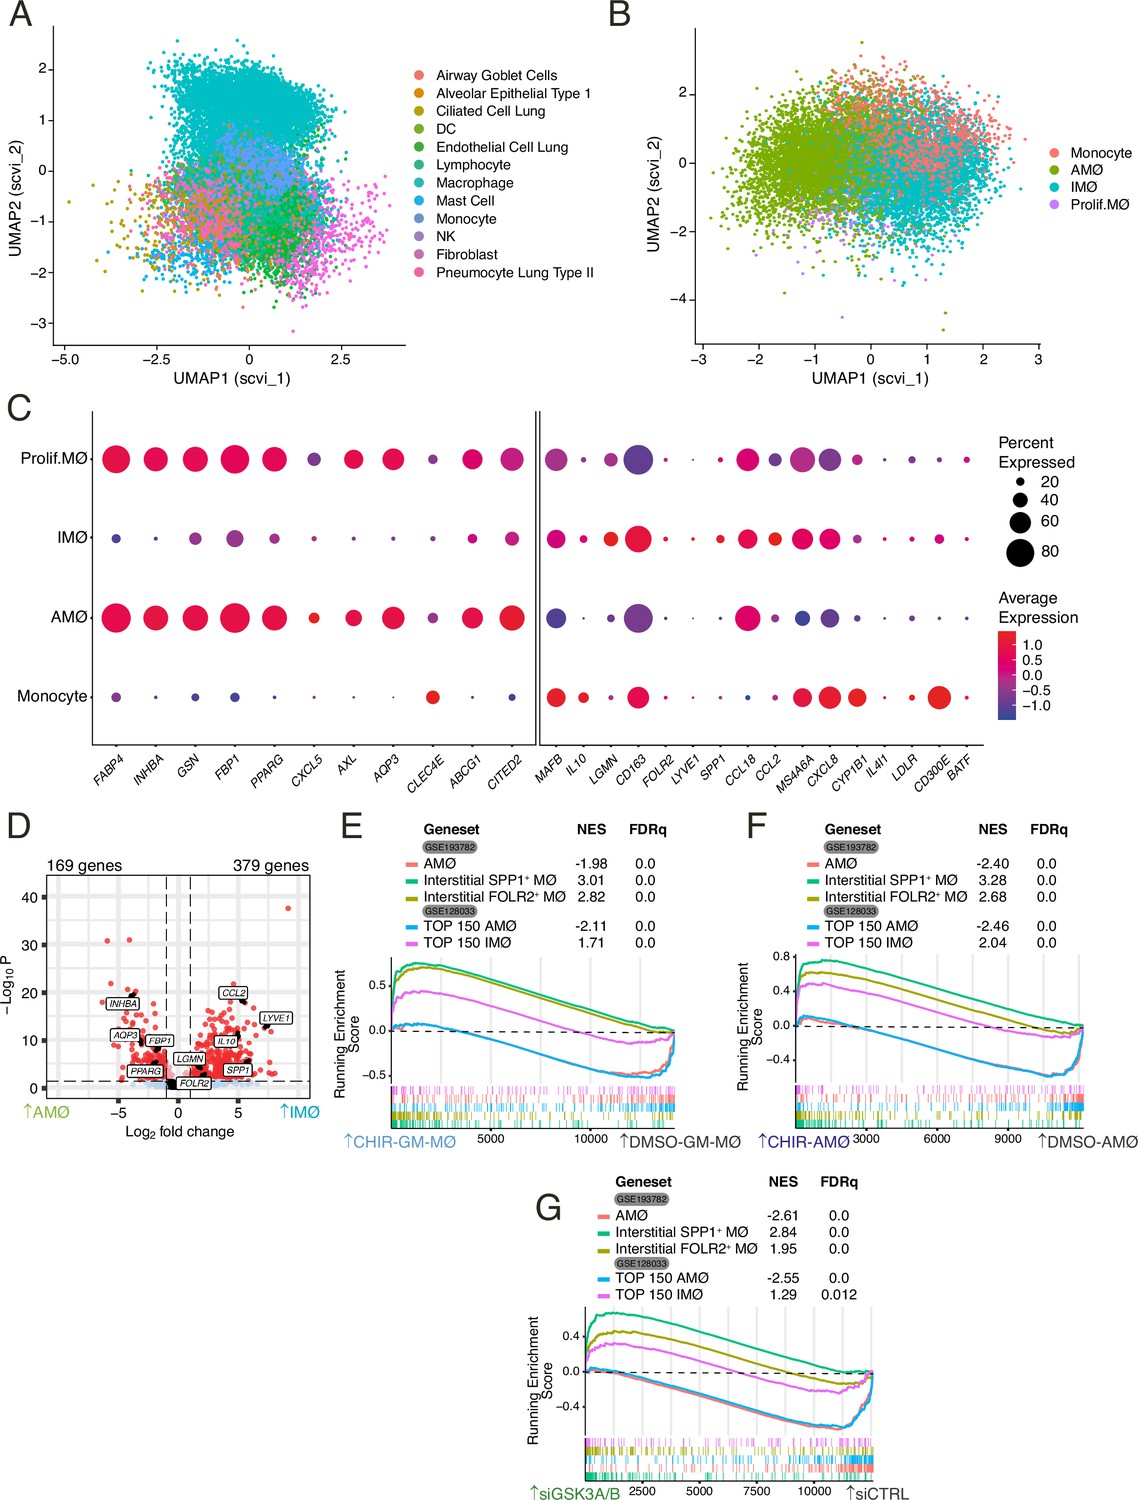
(A) Embedding of 21,310 single-cell transcriptomes from human lungs in UMAP (Uniform Manifold Approximation and Projection) with the scVI reduction. Cell-type annotation is based on the expression of canonical marker genes, as reported in Morse et al., 2019. (B) Two-dimensional embedding computed by UMAP with the scVI reduction on computationally identified macrophages after filtering according to number of genes per cell (nFeature, >200 and <6000), Unique Molecular Identifiers (nCount, >1000), and % of mitochondrial genes (<15%). (C) Relative expression of the indicated genes in the four macrophage subsets defined upon re-clustering of the macrophages identified in the single-cell RNA sequencing reported in GSE128033 (Morse et al., 2019). (D) Volcano plot illustrating the differentially expressed genes between the interstitial macrophage (IMØ) and alveolar macrophage (AMØ) subsets defined upon re-analysis of the single-cell RNA sequencing reported in GSE128033 (Morse et al., 2019). (E–G) Gene set enrichment analysis (GSEA) of the gene sets that define human lung AMØ or IMØ macrophage subsets (GSE128033 and GSE193782) (Morse et al., 2019; Li, 2022) on the ranked comparison of CHIR-GM-MØ vs. DMSO-GM-MØ transcriptomes (E), CHIR-AMØ vs. DMSO-AMØ transcriptomes (F), or siGSK3A/B-GM-MØ vs. siCNT-GM-MØ (G).
Figure 7—figure supplement 1

Number of cells from single-cell RNA sequencing on human lungs from eight independent donors (from GSE128033) (Morse et al., 2019), after filtering according to number of genes per cell (nFeature, >200 and <6000), Unique Molecular Identifiers (nCount, >1000) and % of mitochondrial genes (<15%).
Figure 7—figure supplement 2

UMAP (Uniform Manifold Approximation and Projection), with the scVI reduction, embedding of 21,310 single-cell transcriptomes from human lungs as reported in GSE128033 (Morse et al., 2019), with color-coding indicating distinct cell clusters.
Figure 7—figure supplement 3

UMAP (Uniform Manifold Approximation and Projection), with the scVI reduction, embedding of 21,310 single-cell transcriptomes from human lungs as reported in GSE128033 (Morse et al., 2019), with color-coding indicating donor origin.
Figure 7—figure supplement 4

Color-coded expression of the indicated genes after projection onto the UMAP (Uniform Manifold Approximation and Projection) embedding shown in Figure 7—figure supplements 2 and 3.
Figure 7—figure supplement 5

UMAP (Uniform Manifold Approximation and Projection), with the scVI reduction, embedding of single-cell transcriptomes from human lung macrophages as reported in GSE128033 (Morse et al., 2019), with color-coding indicating distinct cell clusters.
Figure 7—figure supplement 6

UMAP (Uniform Manifold Approximation and Projection), with the scVI reduction, embedding of single-cell transcriptomes from human lungs as reported in GSE128033 (Morse et al., 2019), with color-coding indicating donor origin.
Figure 7—figure supplement 7
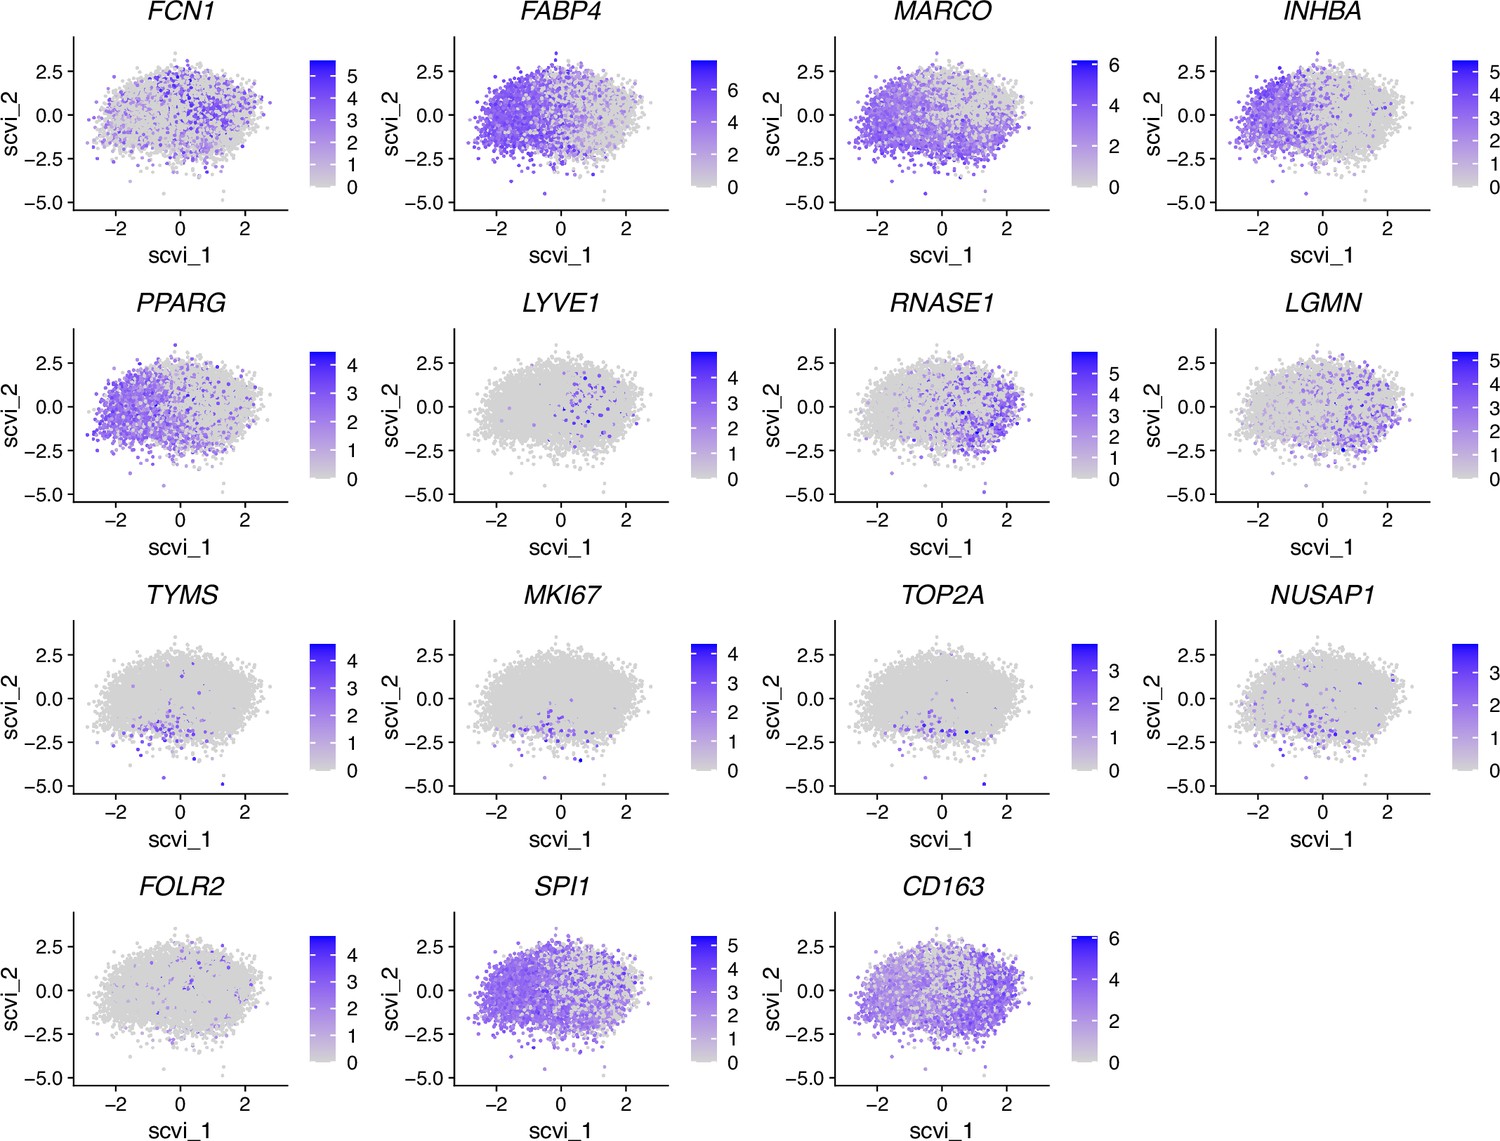
Color-coded expression of the genes used for macrophage definition (CD163, FABP4, LYVE1, FCN1), as well as proliferation-associated genes (TYMS, MKI67, TOP2A, NUSAP1) and other bona fide macrophage marker genes (SPI1, FOLR2), after projection onto the UMAP embedding as shown in Figure 7—figure supplements 5 and 6.
Author response image 1

Total GSK3β, p-Ser9-GSK3β and MAFB levels in three preparations of freshly purified monocytes either unstimulated (-) or stimulated with M-CSF (10 ng/ml) or GM-CSF (1,000 U/ml) at different time points, as determined by Western blot (upper panel).
Vinculin protein levels were determined as protein loading control. Mean ± SEM of the GSK3β/Vinculin, p-Ser9-GSK3β/Vinculin, and MAFB/Vinculin protein ratios from the three independent experiments are shown (lower panel) (paired Student’s t test: *, p<0.05; ****, p<0.001).
Author response image 2
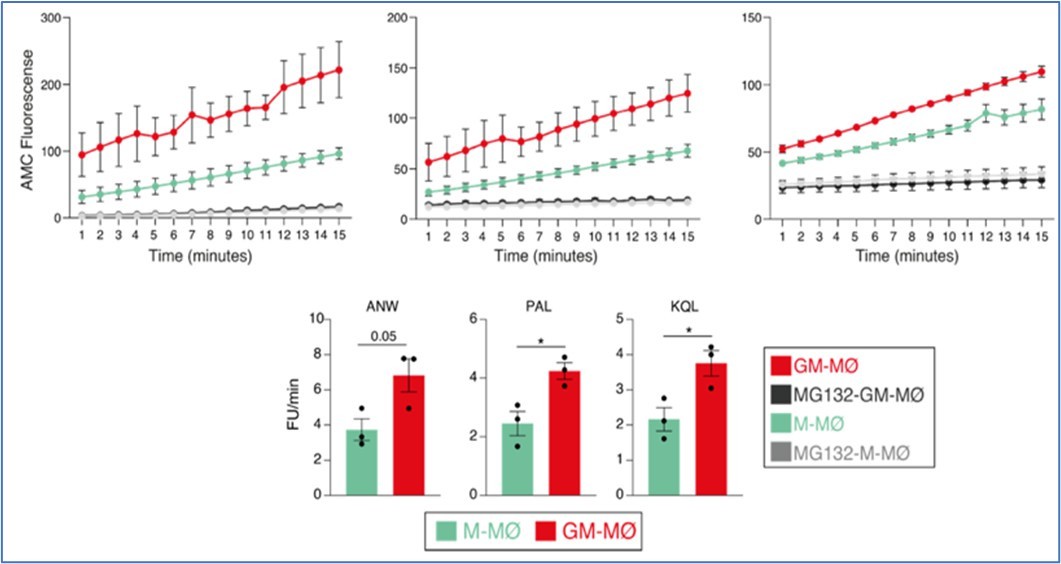
Immunoproteasome activity in M-MØ and GM-MØ, either untreated or exposed to MG132, as determined using the Immunoproteasome Activity Fluorometric Assay Kit II (UBPBio) on the three indicated peptides (upper panel).
Mean ± SEM of three independent experiments are shown (paired Student’s t test: *, p<0.05) (lower panel).
Author response image 3

A.
Schematic representation of the exposure of MG132 to GM-MØ for 6 hours. B. MAFB protein levels in four independent preparations of GM-MØ exposed to either DMSO (DMSO-GM-MØ) or the proteasome inhibitor MG132 (MG132-GM-MØ) for 6 hours, as determined by Western blot (left panel). GAPDH protein levels were determined as protein loading control. Mean ± SEM of the MAFB/GAPDH protein ratios from the four independent experiments are shown (right panel) (paired Student’s t test: ***, p<0.005). C. Relative mRNA levels of the indicated genes in DMSO-GM-MØ and MG132-GM-MØ, as determined by RT-PCR on seven independent samples (paired Student’s t test: ***, p<0.005; ****, p<0.001).
Additional files
-
MDAR checklist
- https://cdn.elifesciences.org/articles/102659/elife-102659-mdarchecklist1-v1.pdf
-
Supplementary file 1
Transcriptional datasets used in the present study.
- https://cdn.elifesciences.org/articles/102659/elife-102659-supp1-v1.xlsx
-
Source code 1
- https://cdn.elifesciences.org/articles/102659/elife-102659-code1-v1.docx
Download links
A two-part list of links to download the article, or parts of the article, in various formats.
Downloads (link to download the article as PDF)
Open citations (links to open the citations from this article in various online reference manager services)
Cite this article (links to download the citations from this article in formats compatible with various reference manager tools)
Reprogramming of GM-CSF-dependent alveolar macrophages through GSK3 activity modulation
eLife 14:RP102659.
https://doi.org/10.7554/eLife.102659.3


