Anxiety dissociates the adaptive functions of sensory and motor response enhancements to social threats
- PSL Research University, France
- Université Pierre et Marie Curie, France
Figures
Figure 1

Model predictions for the effect of gaze direction on emotion categorization.
Left panel: prediction of an effect of gaze direction on decision bias. Upper left panel: if gaze direction biases the interpretation of negative facial expressions in favor of the emotion signaling higher threat, direct gaze would additively bias the choice selection toward anger. Lower left panel: the predicted psychometric function would accordingly be shifted to the left for direct gaze, as participants will be biased toward interpreting faces displaying a direct gaze as angry. Maximal effects would appear for neutral (emotionless) expressions as highlighted through the filled grey area on the emotion axis that represents the difference between the two psychometric functions for direct and averted gaze. Right panel: prediction of an effect of gaze direction on perceptual sensitivity. Upper right panel: if gaze direction increases the sensitivity to the facial features diagnostic of the emotion signaling higher threat, direct gaze would now multiplicatively boost the processing of an angry expression displaying a direct gaze. Lower right panel: the predicted psychometric function would now show an increased slope for threat-signaling emotions, with maximal effects at low emotion strengths (as shown in the filled grey area on the emotion axis).
Figure 2
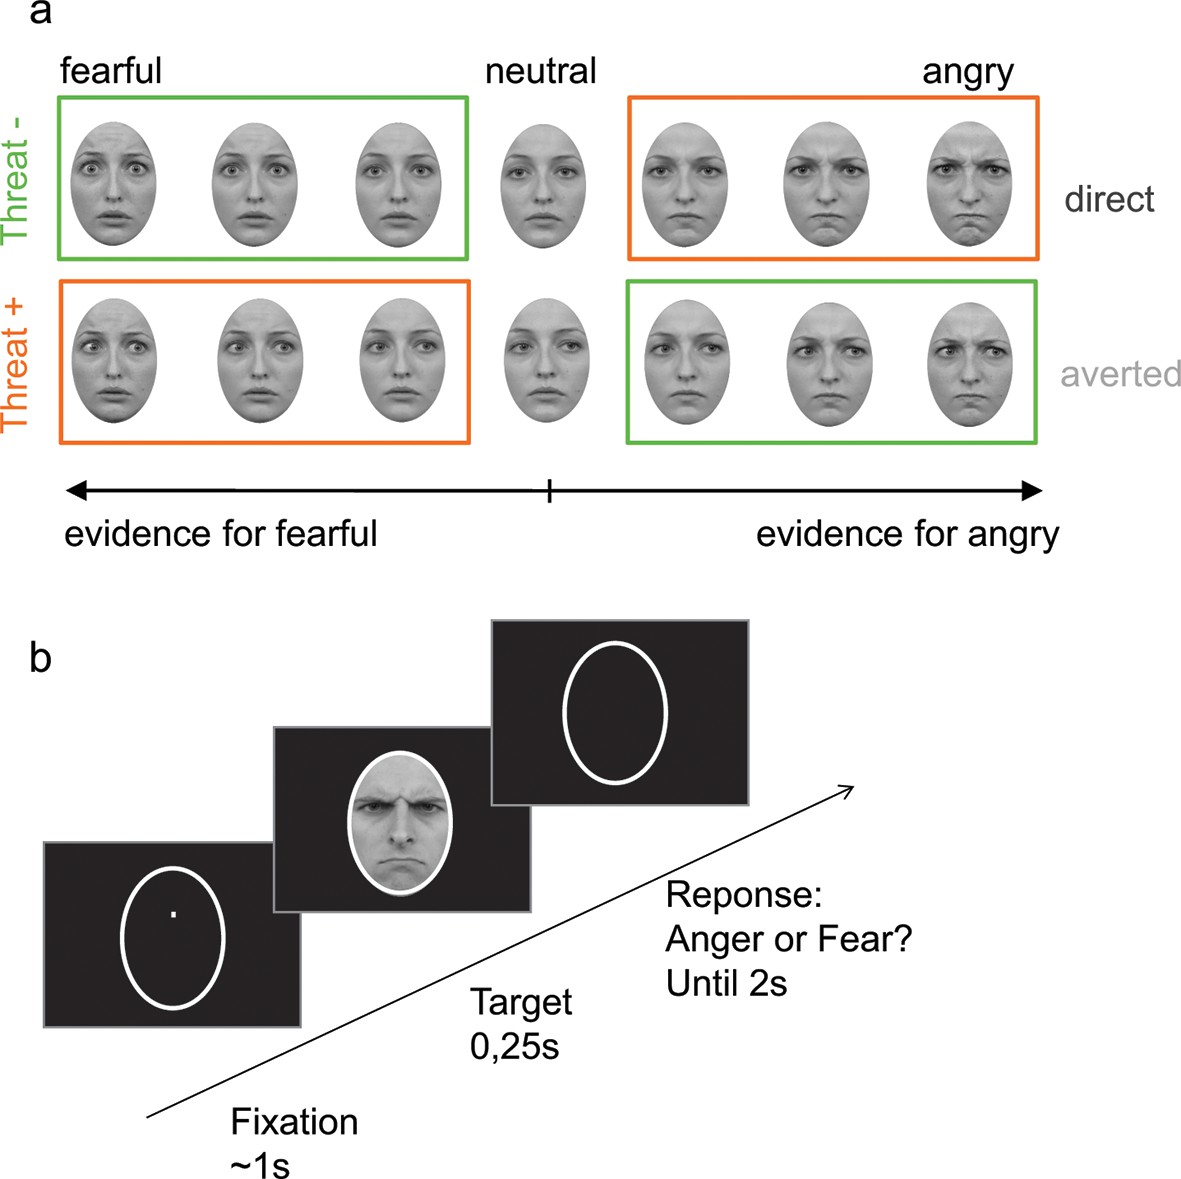
Stimuli and experimental procedure.
(a) Examples of morphed expressions for one identity: morphs from neutral to intense fearful/angry expressions providing evidence for one or the other emotion. Stimuli displayed either an averted or a direct gaze. THREAT+ conditions (in orange) correspond to combinations of gaze and emotion that signal higher threat for the observer as compared to THREAT− conditions (in green). (b) Following fixation, a facial expression appeared for 250 ms, after which the participant had to indicate whether the face expressed anger or fear within 2 seconds. No feedback was provided after response.
Figure 3
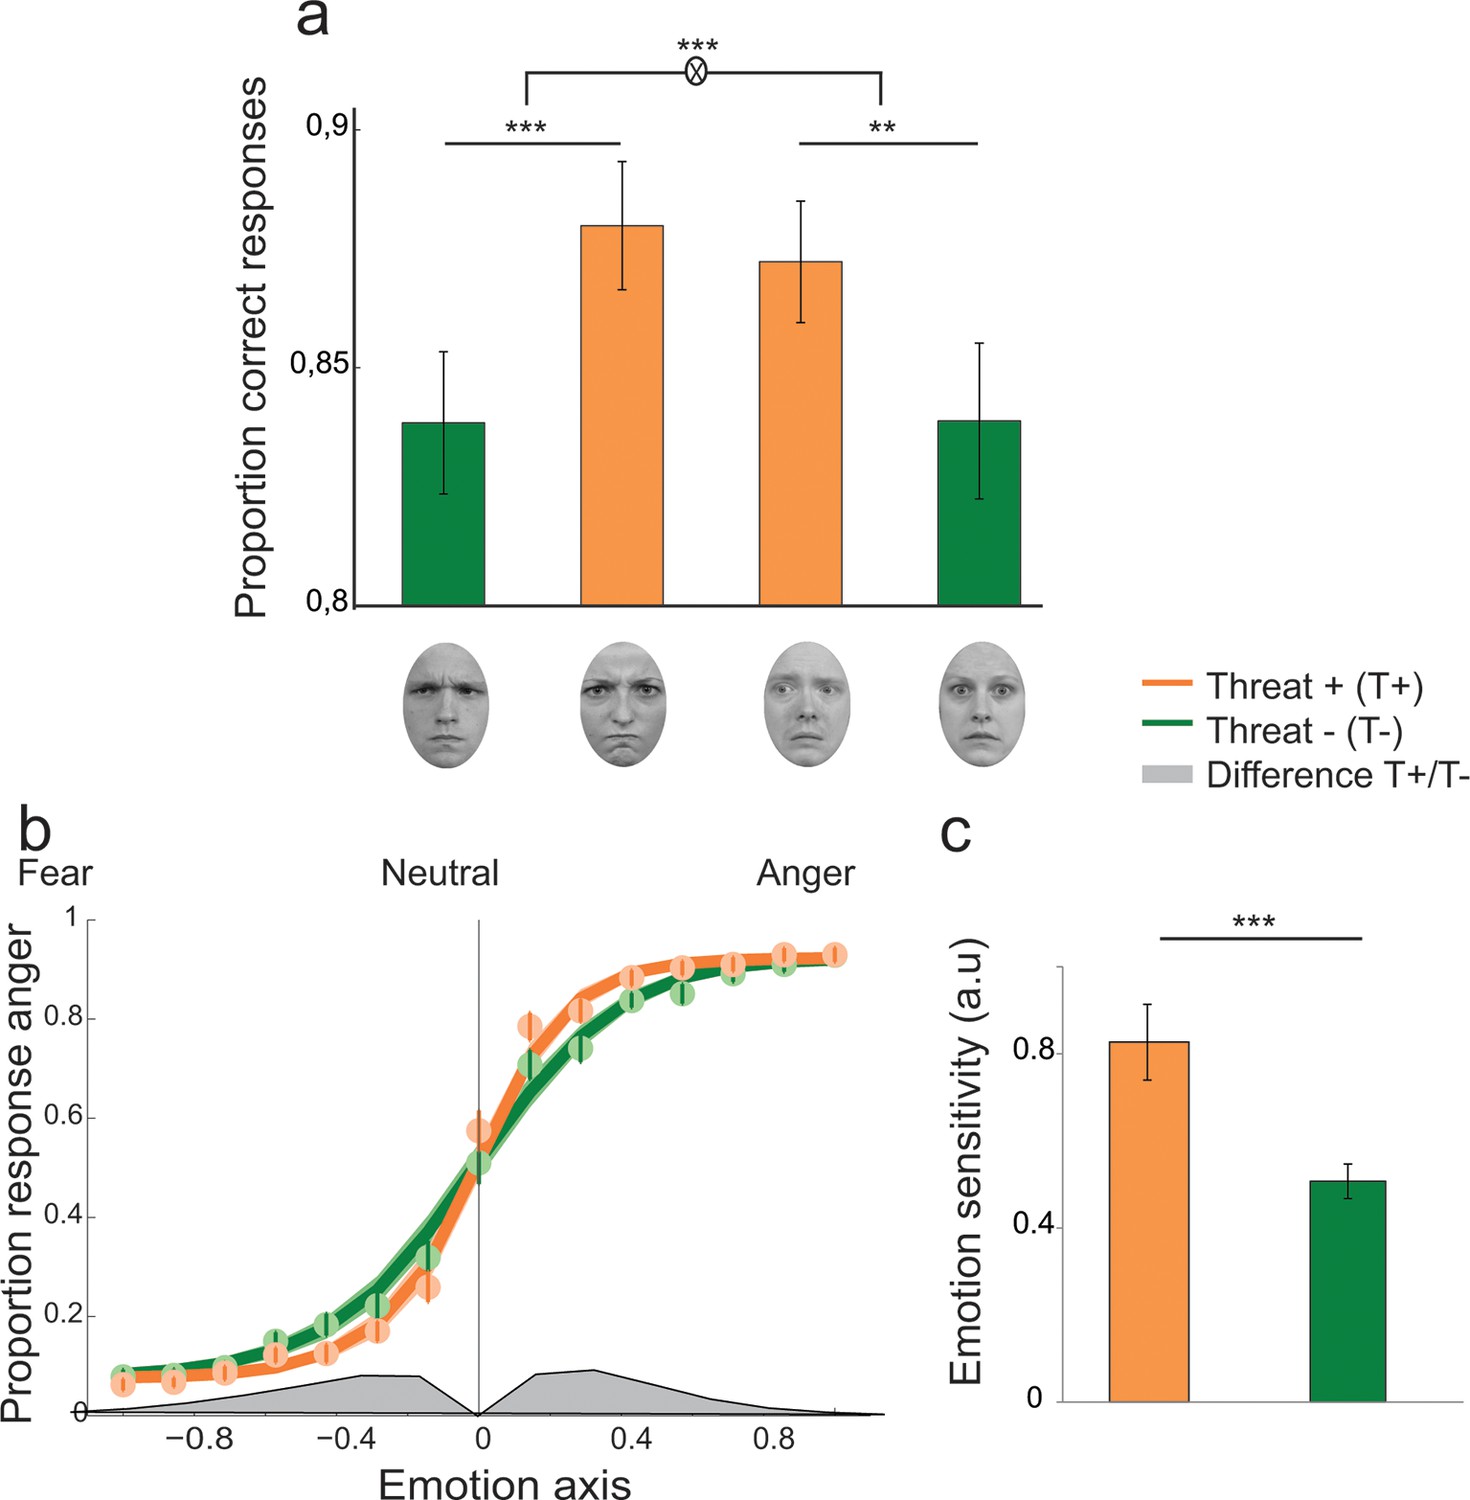
Enhanced recognition accuracy and perceptual sensitivity to threat-signaling emotions.
(a) Proportion of correct responses for (from left to right) averted/anger, direct/anger, averted/fear and direct/fear. THREAT+ combinations of gaze and emotion (in orange) were associated with increased recognition accuracy. (b) Psychometric function representing the proportion of ‘anger’ responses as a function of the evidence for anger (proportion morph, 0 = neutral, negative towards fear, and positive towards anger) for THREAT+ (orange) and THREAT− (green) combinations of gaze and emotion. Dots and attached error bars indicate the human data (mean ± s.e.m.). Lines and shaded error bars indicate the predictions of the best-fitting model. (c) Parameter estimate for the slope of the psychometric curve (corresponding to emotion sensitivity) for THREAT+ and THREAT− combinations. **p < 0.01, ***p < 0.001.
Figure 4
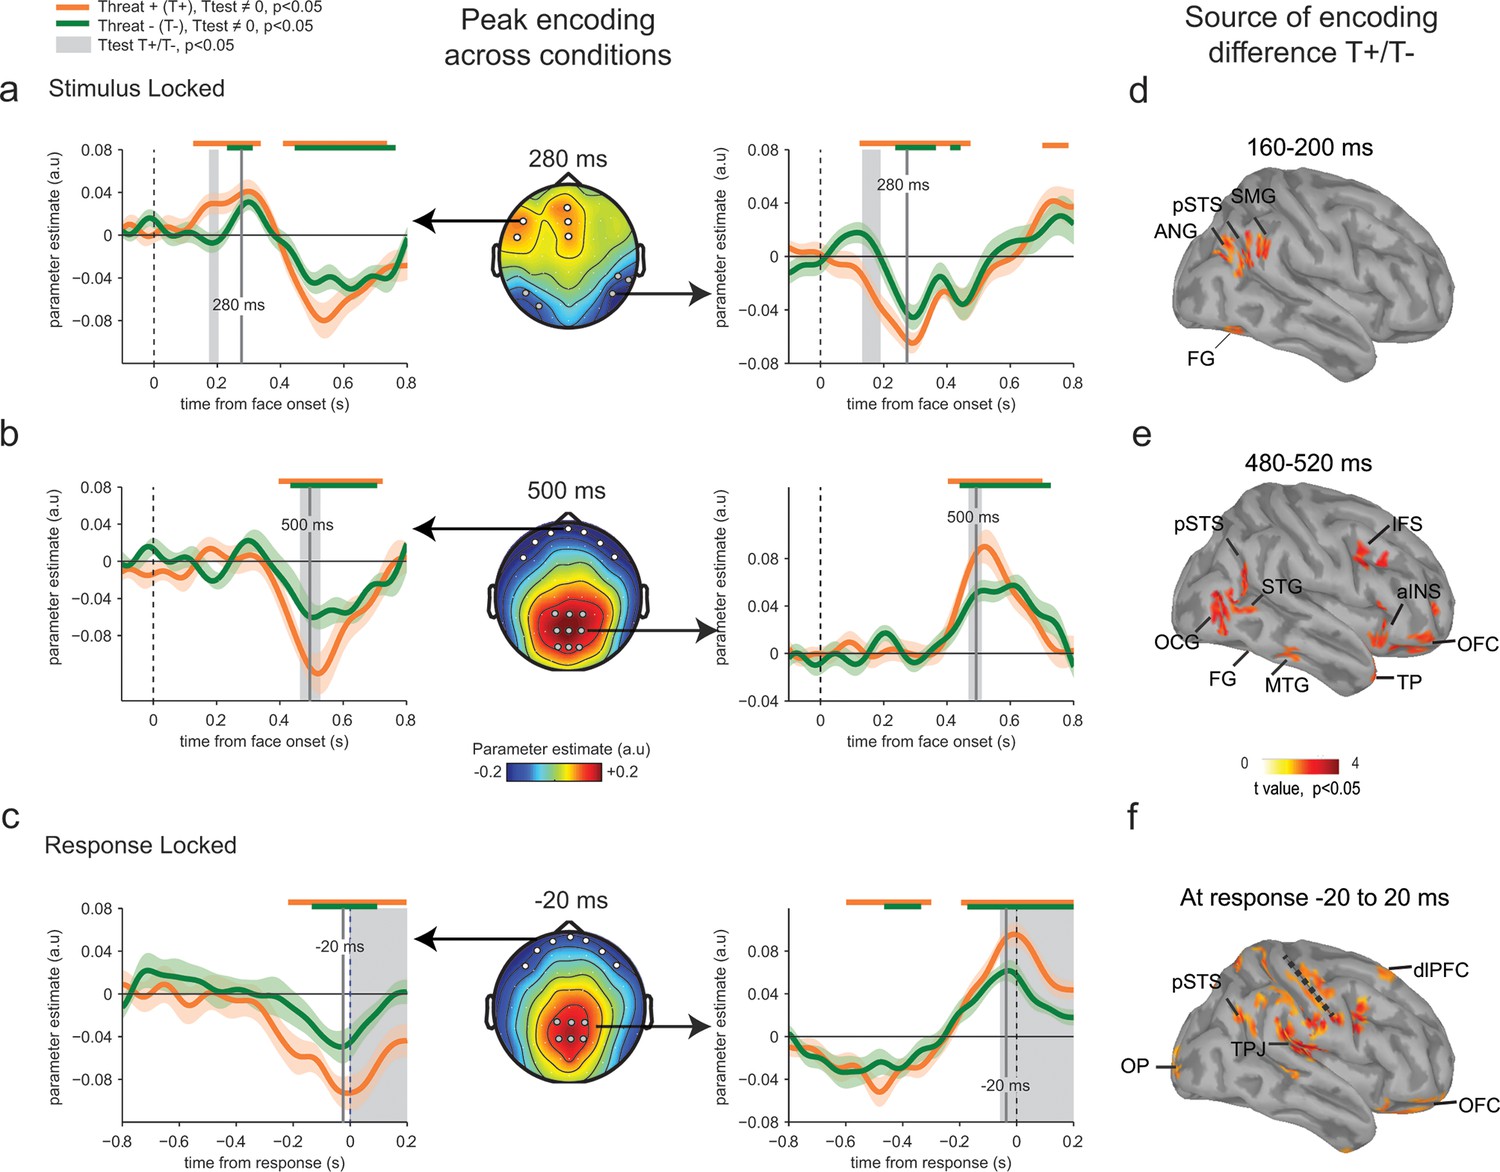
Enhanced neural encoding of threat-signaling emotions.
(a) Middle panel: scalp topography of neural encoding at 280 ms, corresponding to its first peak of the encoding of emotion strength averaged across conditions (peak of deviation from zero), and expressed as mean parameter estimates in arbitrary units (a.u.). Dots indicate electrodes of interest where neural encoding was maximal. Left and right panels: encoding time course for THREAT+ and THREAT− conditions at electrodes of interest. Shaded error bars indicate s.e.m. Thick orange and green lines indicate significance against zero at a cluster-corrected p-value of 0.05. Shaded grey areas indicate significant differences between THREAT+ and THREAT− conditions at p < 0.05. (b) Same conventions as (a) at the second neural encoding peak at 500 ms. (c) Same conventions as (a) at the third neural encoding peak at response time. (d) Estimated cortical sources of the encoding difference between THREAT+ and THREAT− conditions at the time of significant difference between conditions at 170 ms. (e) Same as (d) at 500 ms. (f) Same as (d) at response time. FG: fusiform gyrus, pSTS: posterior superior temporal sulcus, SMG: supramarginal gyrus, ANG: angular gyrus, STG: superior temporal gyrus, MTG: middle temporal gyrus, OCG: occipital gyrus, aINS: anterior insula, IFS: inferior frontal sulcus, TP: temporal pole, OFC: orbitofrontal cortex, OP: occipital pole, TPJ: temporo-parietal junction, dlPFC: dorsolateral prefrontal cortex.
Figure 5
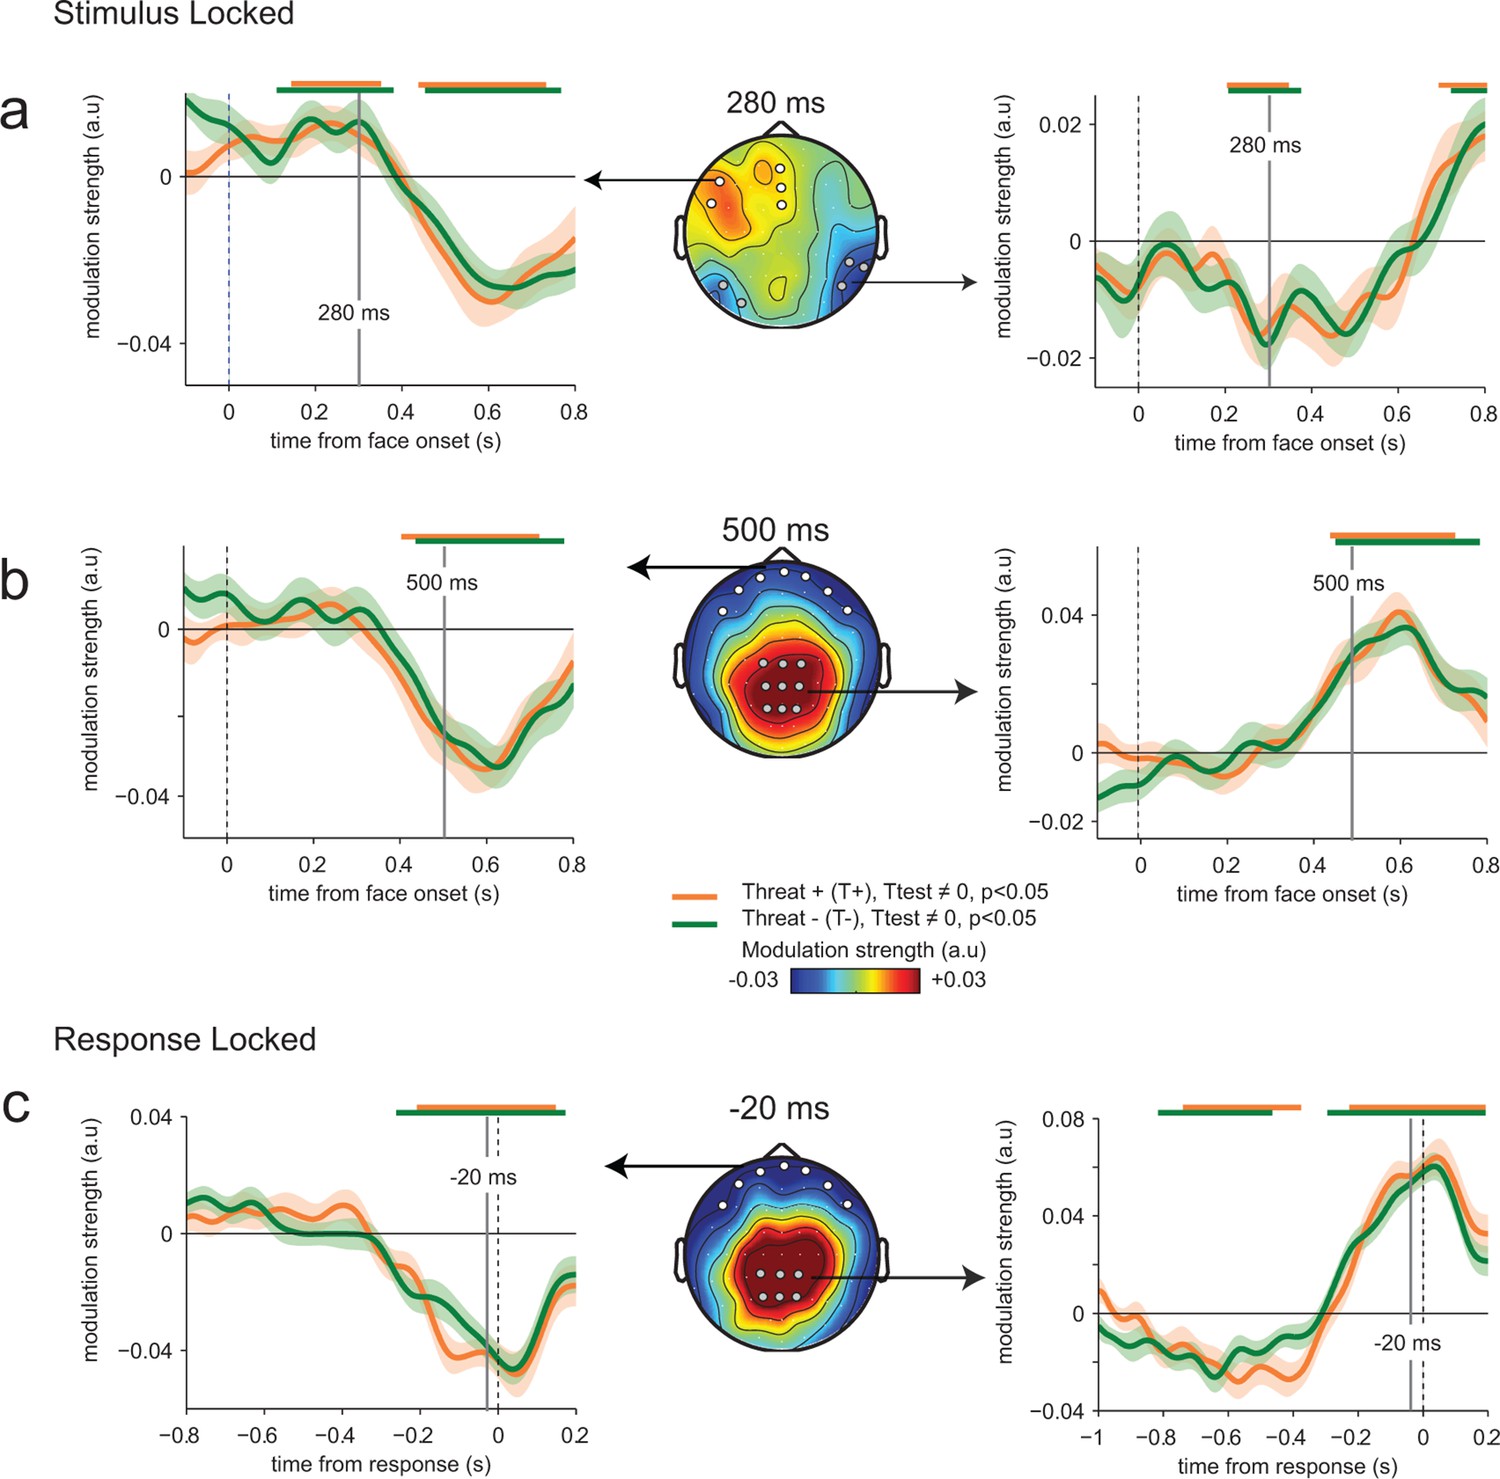
Absence of threat-dependent enhancement of neural-choice correlations.
(a) Middle panel: scalp topography of neural-choice correlations, expressed as the modulation of perceptual sensitivity by EEG encoding residuals at 280 ms, same time point shown in Figure 4a. Electrodes of interest indicated with dots are the same as in Figure 4a. Left and right panels, time course of the modulation of perceptual sensitivity by EEG encoding residuals expressed in arbitrary units (a.u.). Same conventions as in Figure 4a. (b) Same conventions as (a) at 500 ms. (c) Same conventions as (a) at response time. The variation of the modulation strength over time is consistent with the variation of the encoding parameter estimate. No difference between THREAT+ and THREAT− is observed.
Figure 6
Encoding of threat-signaling emotions in motor response lateralization measures.
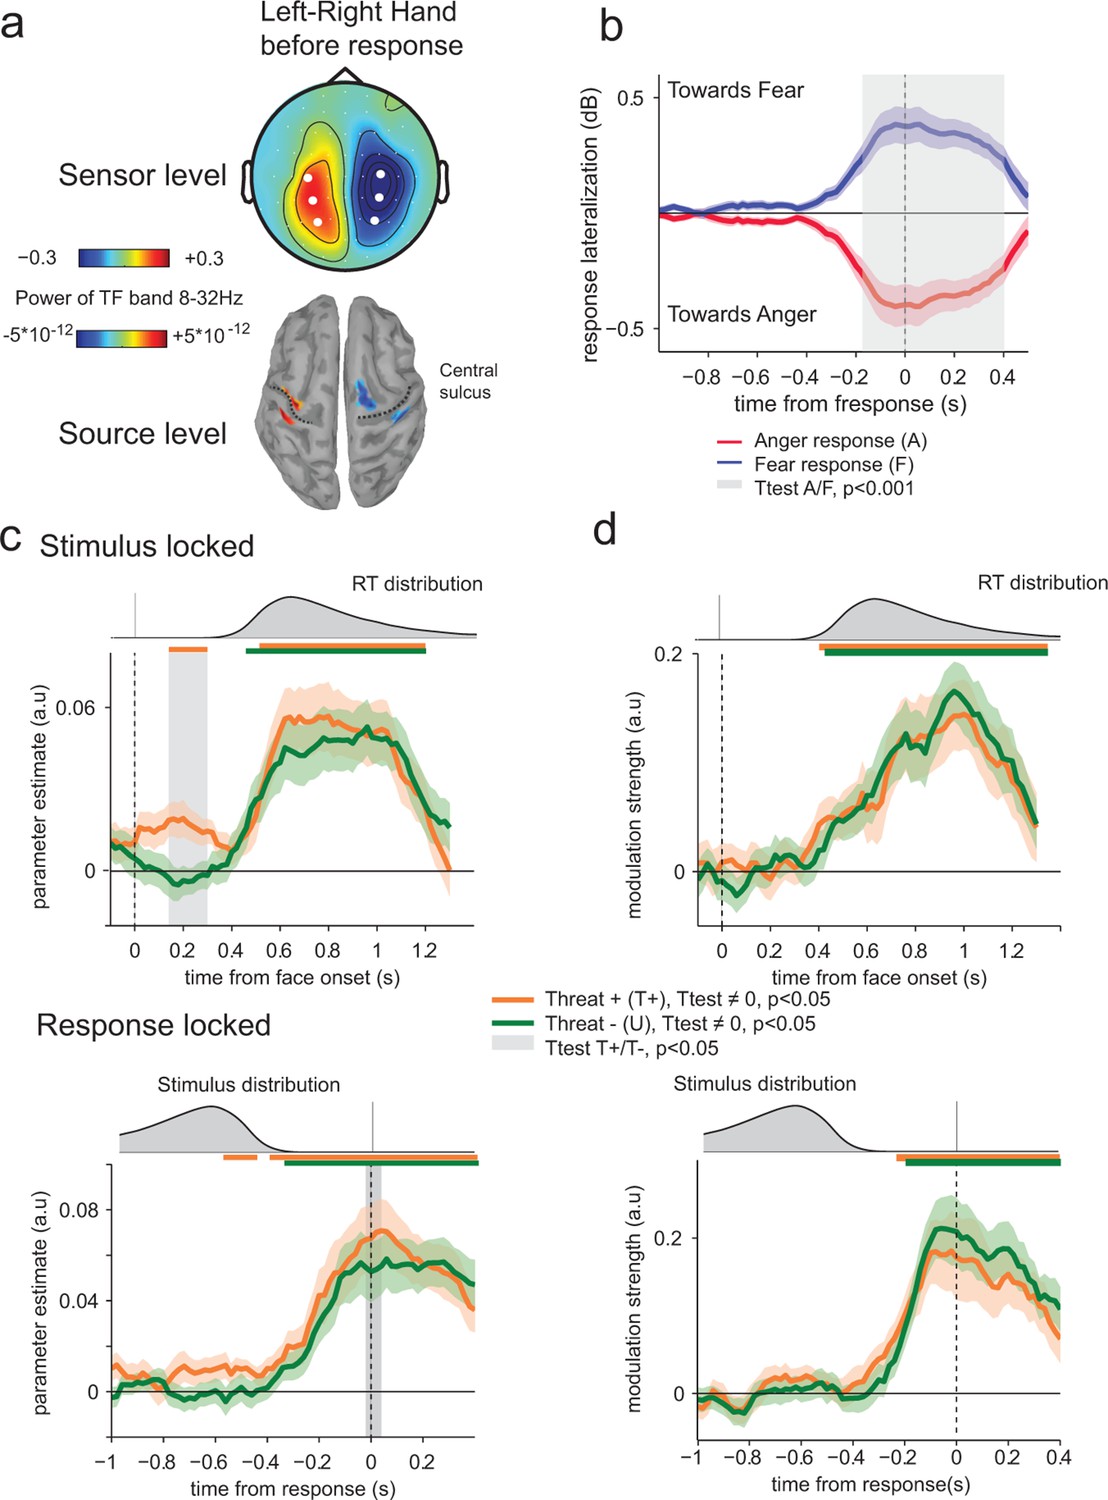
(a) Top panel, scalp topography before response of the time frequency power in the 8–32 Hz band in the last 100 ms before response, for the trials where subjects responded with their left hand minus the trials where they responded with their right hand. Dots correspond to the selected electrodes, where the effect was maximal. Bottom panel: corresponding neural sources. (b) Time course of response lateralization (time frequency power activity from the contralateral electrodes minus ipsilateral electrodes to the hand used to respond ‘fear’) towards anger and fear when the choice was anger (red) or fear (blue). Shaded error bars indicate s.e.m. The shaded gray area indicates a significant difference in motor lateralization between Anger and Fear responses. (c) Encoding of emotion strength in response lateralization index for THREAT+ (orange) and THREAT− (green) conditions. Differences between conditions are observed at 200 ms after stimulus onset (stimulus-locked, upper panel) and at response time (response-locked, lower panel). Conventions are the same as in Figure 4. (d) Time course of neural-choice correlations, expressed as the modulation of additive bias by motor lateralization encoding residuals in arbitrary units (a.u.) stimulus-locked (upper panel) and response locked (lower panel). Conventions are the same as in Figure 4.
Figure 7
Encoding of emotion strength as a function of reaction times (RT) in motor and parietal structures.
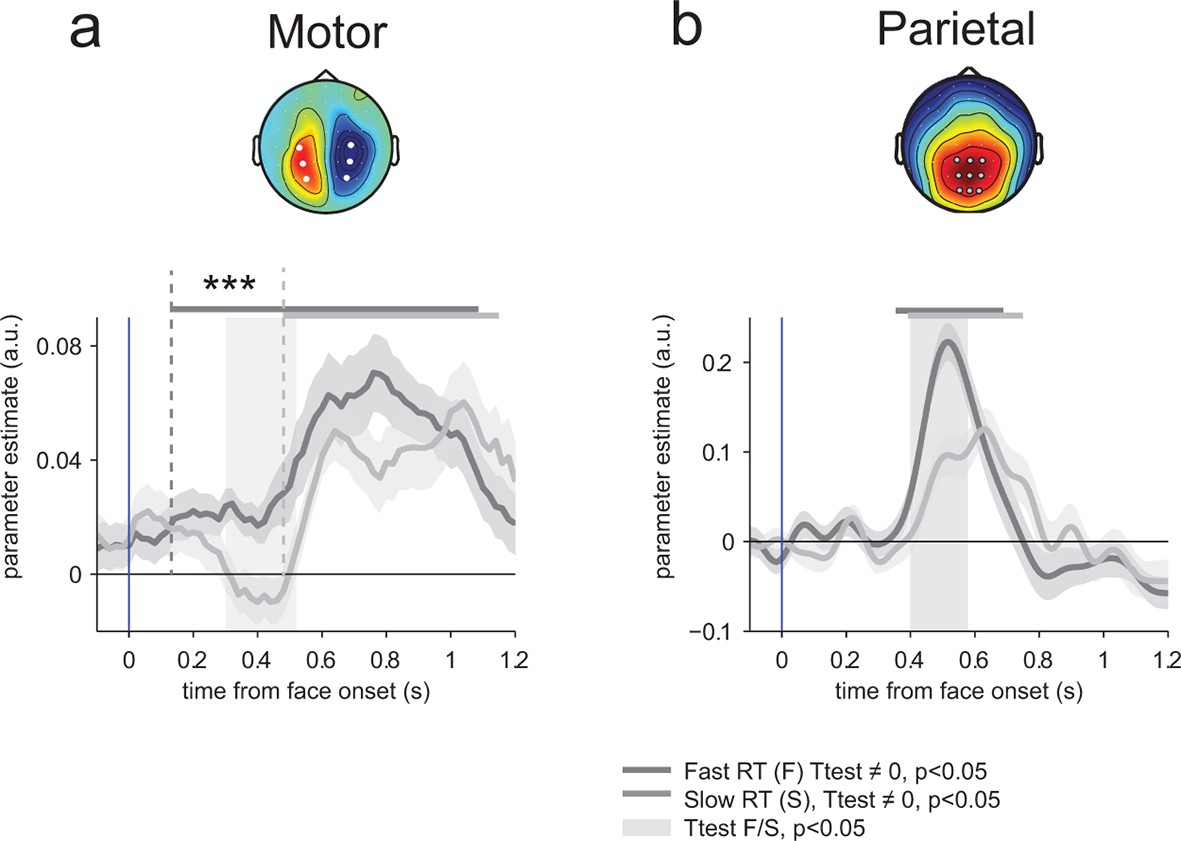
(a) Neural encoding of emotion strength for THREAT+ conditions in motor lateralization for fast and slow reaction times (RT): when RTs were fast, the encoding of emotion strength became significant at 150 ms and rose gradually until response; by contrast, when RTs were slow, the encoding of emotion strength became significant later at 540 ms. Shaded error bars indicate s.e.m. Thick dark and light grey lines indicate significance against zero at a cluster-corrected p-value of 0.05. Shaded grey bars indicate significant differences between fast and slow responses. Encoding latency is significantly different between fast and slow RTs, ***: p<0.001 (b) Emotion strength encoding in parietal electrodes. Convention are the same than (a). Fast responses are associated with a stronger neural encoding of emotion strength, but without any change in encoding latency.
Figure 8
Modulation of threat encoding by individual anxiety.
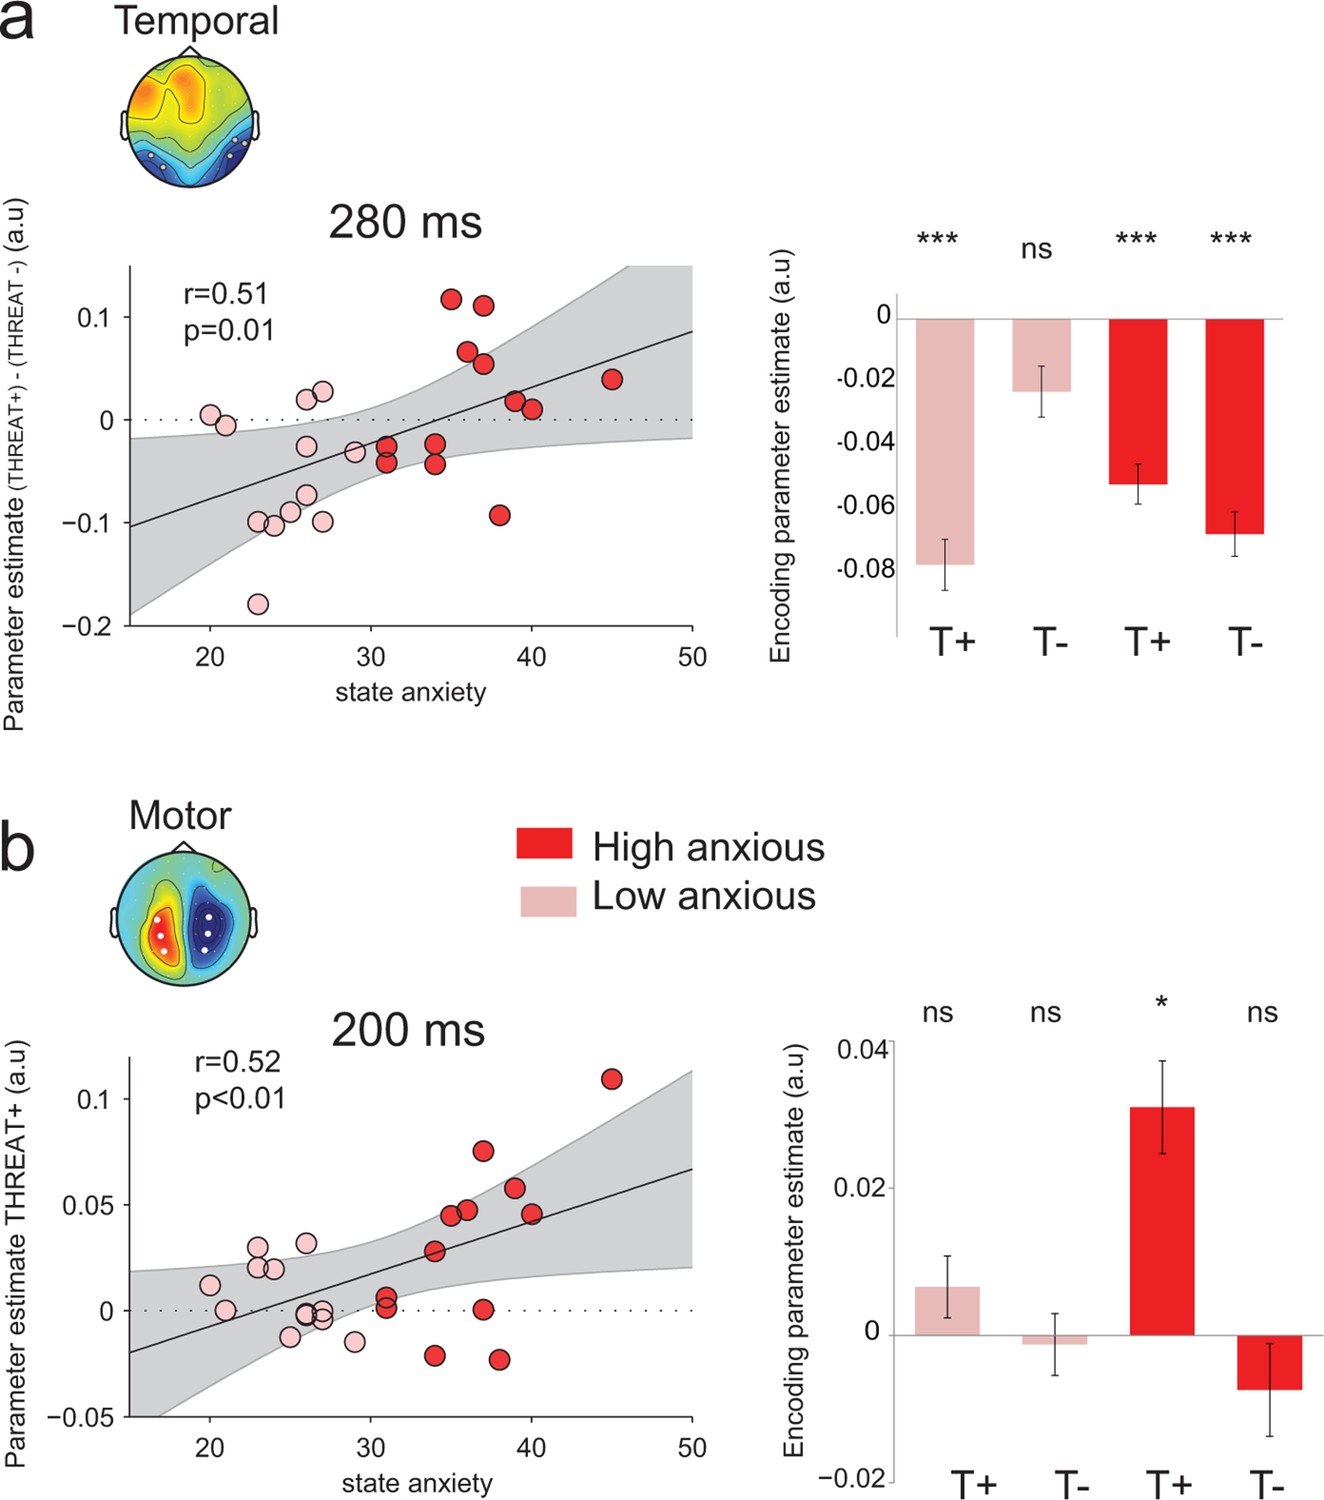
(a) Left panel: correlation (Pearson) between state anxiety and the difference of the encoding parameter estimates between THREAT+ and THREAT− conditions in temporal electrodes at 280 ms. Right panel: encoding parameter estimates in temporal electrodes split into high and low anxious individuals for both THREAT+ and THREAT− conditions at 280 ms. T+: THREAT+, T-: THREAT-. (b) Left, correlation (Pearson) between state anxiety and the encoding parameter estimates in motor lateralization signals for THREAT+ condition at 200 ms. Right, encoding parameter estimates in motor lateralization signals split into high and low anxious individuals for both THREAT+ and THREAT− conditions at 200 ms. ***: p<0.001, *p<0.05.
Download links
A two-part list of links to download the article, or parts of the article, in various formats.
Downloads (link to download the article as PDF)
Open citations (links to open the citations from this article in various online reference manager services)
Cite this article (links to download the citations from this article in formats compatible with various reference manager tools)
Anxiety dissociates the adaptive functions of sensory and motor response enhancements to social threats
eLife 4:e10274.
https://doi.org/10.7554/eLife.10274


