AI-enabled alkaline-resistant evolution of protein to apply in mass production
- School of Physics and Astronomy, Shanghai Jiao Tong University, China
- School of Life Sciences and Biotechnology, Shanghai Jiao Tong University, China
- Institute of Natural Sciences, Shanghai Jiao Tong University, China
- Shanghai National Centre for Applied Mathematics (SJTU Center), MOE-LSC, Shanghai Jiao Tong University, China
- Shanghai Artificial Intelligence Laboratory, China
- Changchun GeneScience Pharmaceuticals Co., Ltd., China
- Department of Biochemistry and Molecular Biology, School of Basic Medical Sciences, Harbin Medical University, China
- Zhangjiang Institute for Advanced Study, Shanghai Jiao Tong University, China
Figures
Figure 1 with 3 supplements
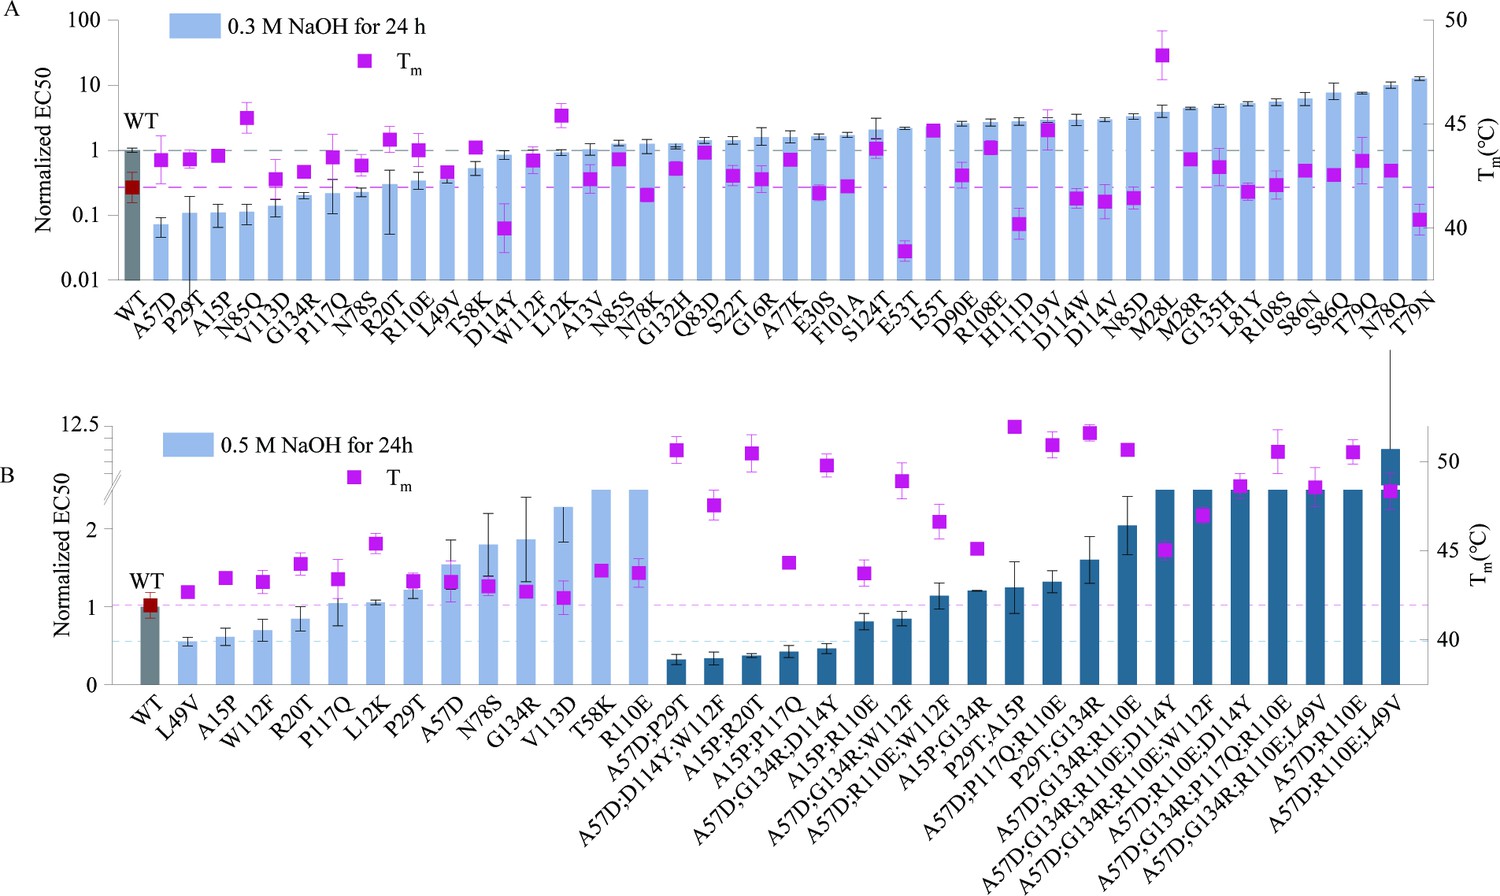
The experimental results from two rounds of design.
(A) Experimental results of single-point mutants. The melting temperatures of mutants are shown as red squares. The affinity of mutants after treatment with 0.3 M NaOH for 24 hr are shown as blue bars. (B) Experimental results of multi- and single-point mutants. The melting temperatures of mutants are shown as red squares. The affinity of single-point mutants after treatment with 0.5 M NaOH for 24 hr is shown as blue bars, while those of multi-point mutants are shown as green bars. The affinity values were normalized in the graph, with the wild-type EC50 set as 1. Error bars for EC50 values represent the 95% confidence interval, while error bars for the melting temperatures represent the standard deviation from three independent experiments.
-
Figure 1—source data 1
Original data corresponding to Figure 1A, B.
- https://cdn.elifesciences.org/articles/102788/elife-102788-fig1-data1-v1.xlsx
Figure 1—figure supplement 1

Experimental results of single-point mutants before alkali treatment.
The affinity of mutants is shown as purple bars. The affinity values were normalized in the graph, with the wild-type EC50 set as 1. Error bars for EC50 values represent the 95% confidence interval.
-
Figure 1—figure supplement 1—source data 1
Original data corresponding to Figure 1—figure supplement 1.
- https://cdn.elifesciences.org/articles/102788/elife-102788-fig1-figsupp1-data1-v1.xlsx
Figure 1—figure supplement 2

Experimental results of multi- and single-point mutants before alkali treatment.
The affinity of mutants is shown as blue bars. The affinity values were normalized in the graph, with the wild-type EC50 set as 1. Error bars for EC50 values represent the 95% confidence interval.
-
Figure 1—figure supplement 2—source data 1
Original data corresponding to Figure 1—figure supplement 2.
- https://cdn.elifesciences.org/articles/102788/elife-102788-fig1-figsupp2-data1-v1.xlsx
Figure 1—figure supplement 3

Distribution plot of the normalized EC50 values after 0.3 M NaOH treatment and Tm values of single-point mutants.
The Spearman correlation between the two values is −0.29. The affinity values were normalized in the graph, with the wild-type EC50 set as 1.
Figure 2
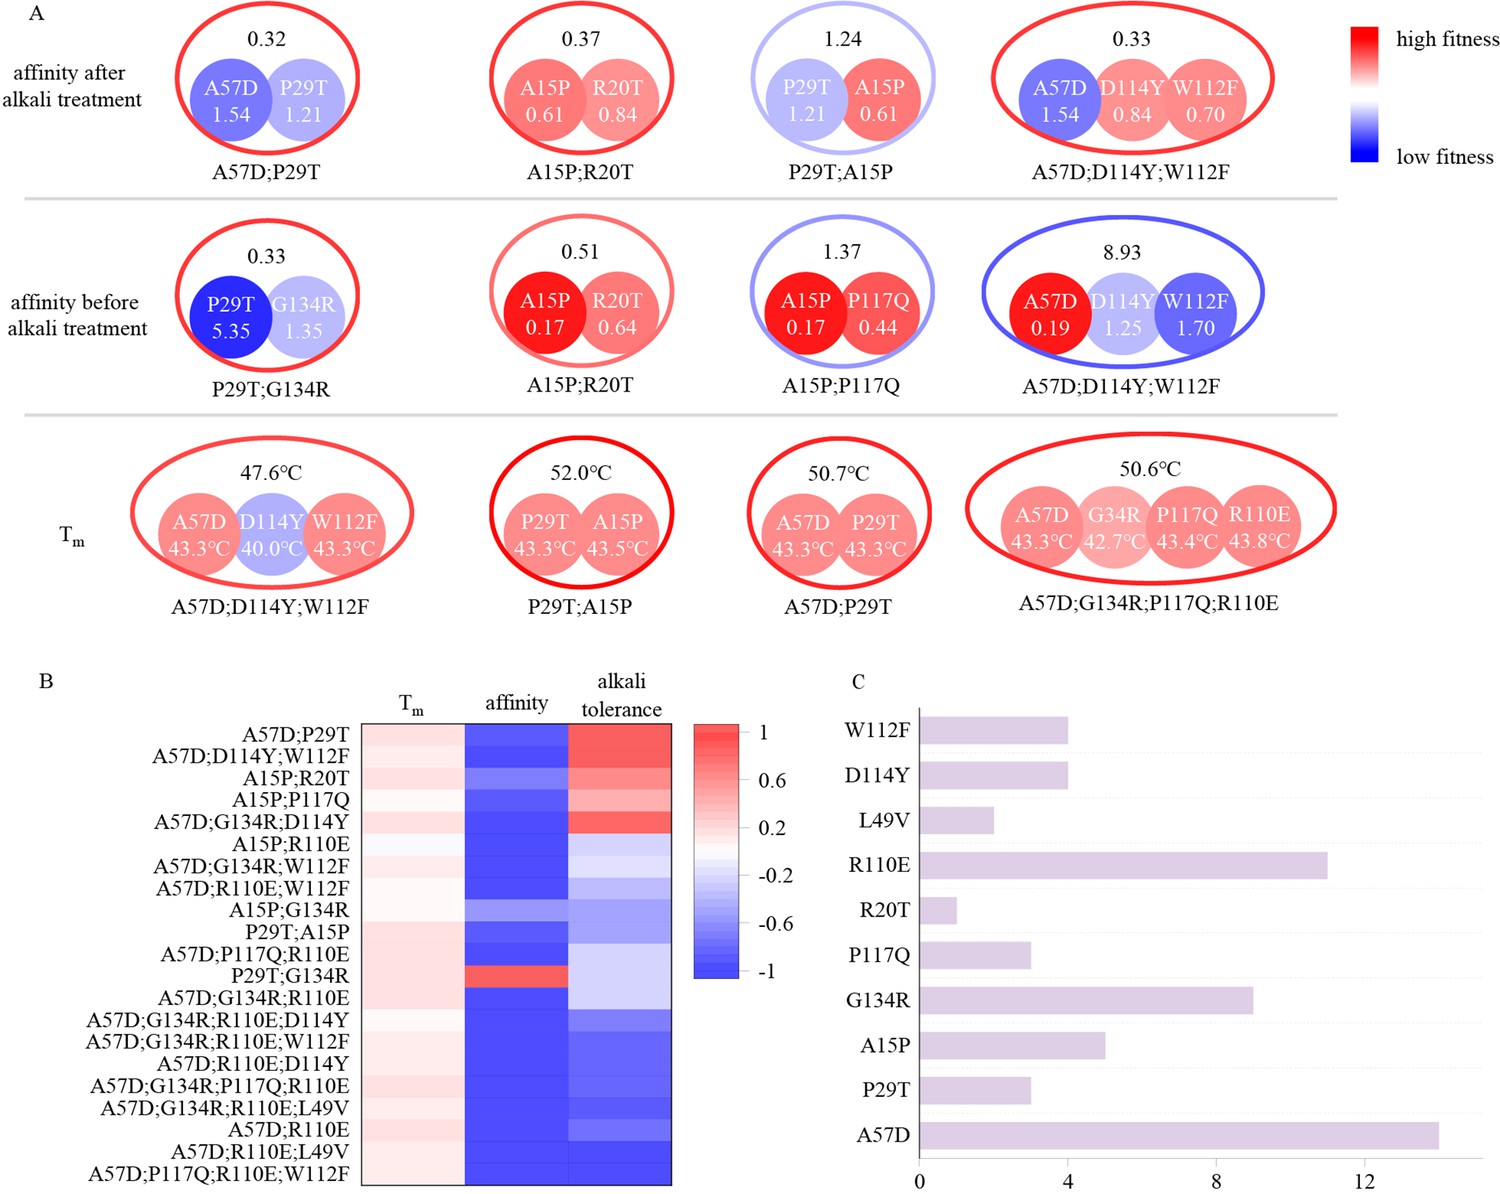
Schematic diagram illustrating the combined effects of single-point mutations.
(A) The colors (outer contours representing multi-point mutations and inner solid circles representing the included single-point mutations) and numerical values represent the EC50 values after alkali treatment with 0.5 M NaOH for 24 hr, the EC50 values before alkali treatment, and the Tm values. Blue indicates mutations inferior to the wild type, while red indicates mutations superior to the wild type. The EC50 values before and after alkali treatment are normalized, with the wild type set to 1. (B) Experimental evaluation of multi-point mutations. Different colors represent the proportions of improvement or decline in Tm, affinity, and alkali resistance of multi-point mutations compared to the corresponding best single-point mutations they include. (C) Distribution of the occurrences of single-point mutations included in the 20 multi-point mutation variants. The length of the bar represents the frequency of occurrence of each mutation.
Figure 3 with 1 supplement
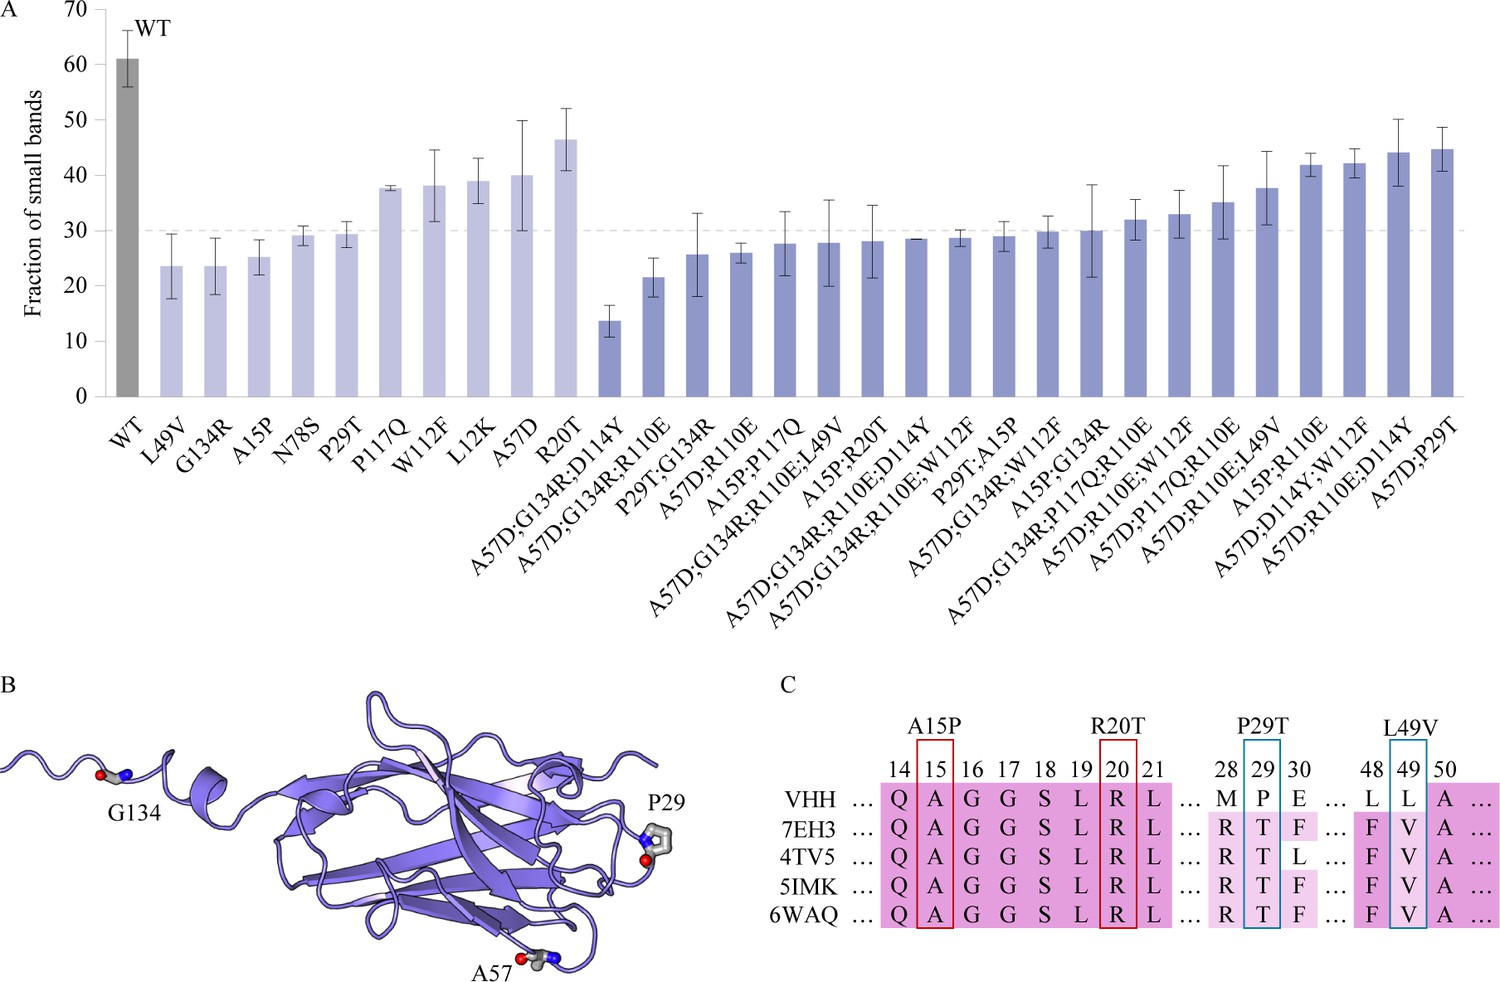
Characterization of the VHH antibody, including SDS-PAGE analysis, structural representation, and sequence alignment.
(A) The SDS–PAGE experimental results depict the proportion of small bands observed after alkali treatment for multi-point mutations and certain single-point mutations exhibiting relatively higher alkali resistance. Error bars for EC50 values represent the 95% confidence interval. (B) Structure of the VHH antibody. (C) The multiple sequence alignment of the VHH and several homologous sequences.
-
Figure 3—source data 1
Original data corresponding to Figure 3A.
- https://cdn.elifesciences.org/articles/102788/elife-102788-fig3-data1-v1.xlsx
Figure 3—figure supplement 1

Stability analysis of the wild type (WT) and the A57D;P29T mutant based on molecular dynamics (MD) simulations.
(A) The melting temperatures and binding affinity of the WT and the A57D;P29T mutant after treatment with 0.5 M NaOH for 24 hr. (B) Root-mean-squared deviation (RMSD) for 200 ns in MD simulations for both the WT and the mutant. (C) Root-mean-square fluctuations (RMSFs) for each residue in the WT and the mutant. (D) Comparison of the AlphaFold3 predicted structures of the WT and the mutant. (E) Comparison of hydrogen bonds and (F) solvent-accessible surface area (SASA) in the WT and the mutant.
-
Figure 3—figure supplement 1—source data 1
Original data corresponding to Figure 3—figure supplement 1B, C, E, F.
- https://cdn.elifesciences.org/articles/102788/elife-102788-fig3-figsupp1-data1-v1.xlsx
Figure 4
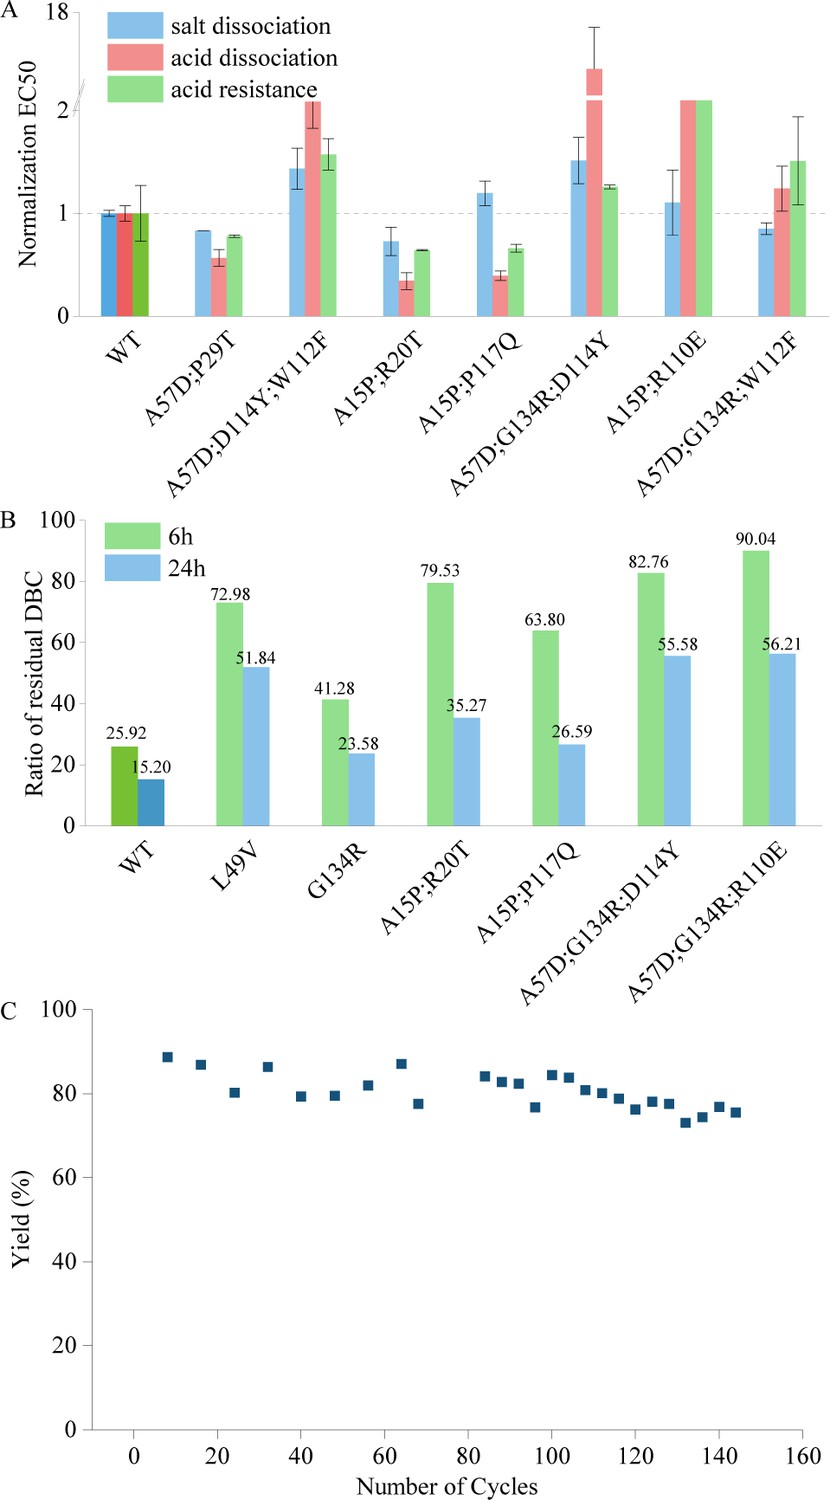
Performance of mutants in assays assessing features outside the model's evolutionary predictions.
(A) The tolerance of acid dissociation and salt dissociation, and the acid resistance of multi-point mutations with strong alkali resistance. All EC50 values are normalized, with the wild type set to 1. Error bars for EC50 values represent the 95% confidence interval. (B) Experiment results of residual dynamic binding capacity (DBC) at 10% breakthrough. The bars represent the ratio of the residual DBC after 0.5 M NaOH treatment for 6 and 24 hr to the residual DBC before treatment for multi-site mutants and the wild type. (C) Yield in affinity chromatography and the corresponding number of cycles. This figure illustrates the variation in yield during affinity chromatography across multiple cycles.
-
Figure 4—source data 1
Original data corresponding to Figure 4A–C.
- https://cdn.elifesciences.org/articles/102788/elife-102788-fig4-data1-v1.xlsx
Additional files
Download links
A two-part list of links to download the article, or parts of the article, in various formats.
Downloads (link to download the article as PDF)
Open citations (links to open the citations from this article in various online reference manager services)
Cite this article (links to download the citations from this article in formats compatible with various reference manager tools)
AI-enabled alkaline-resistant evolution of protein to apply in mass production
eLife 13:RP102788.
https://doi.org/10.7554/eLife.102788.3


