Increased listening effort and cochlear neural degeneration underlie speech-in-noise deficits in normal-hearing middle-aged adults
- Department of Communication Science and Disorders, School of Health and Rehabilitation Sciences, University of Pittsburgh, United States
- Department of Statistics, Virginia Polytechnic Institute and State University, United States
- Department of Bioengineering, Swanson School of Engineering, University of Pittsburgh, United States
- Department of Otolaryngology, School of Medicine, University of Pittsburgh, United States
Figures
Figure 1
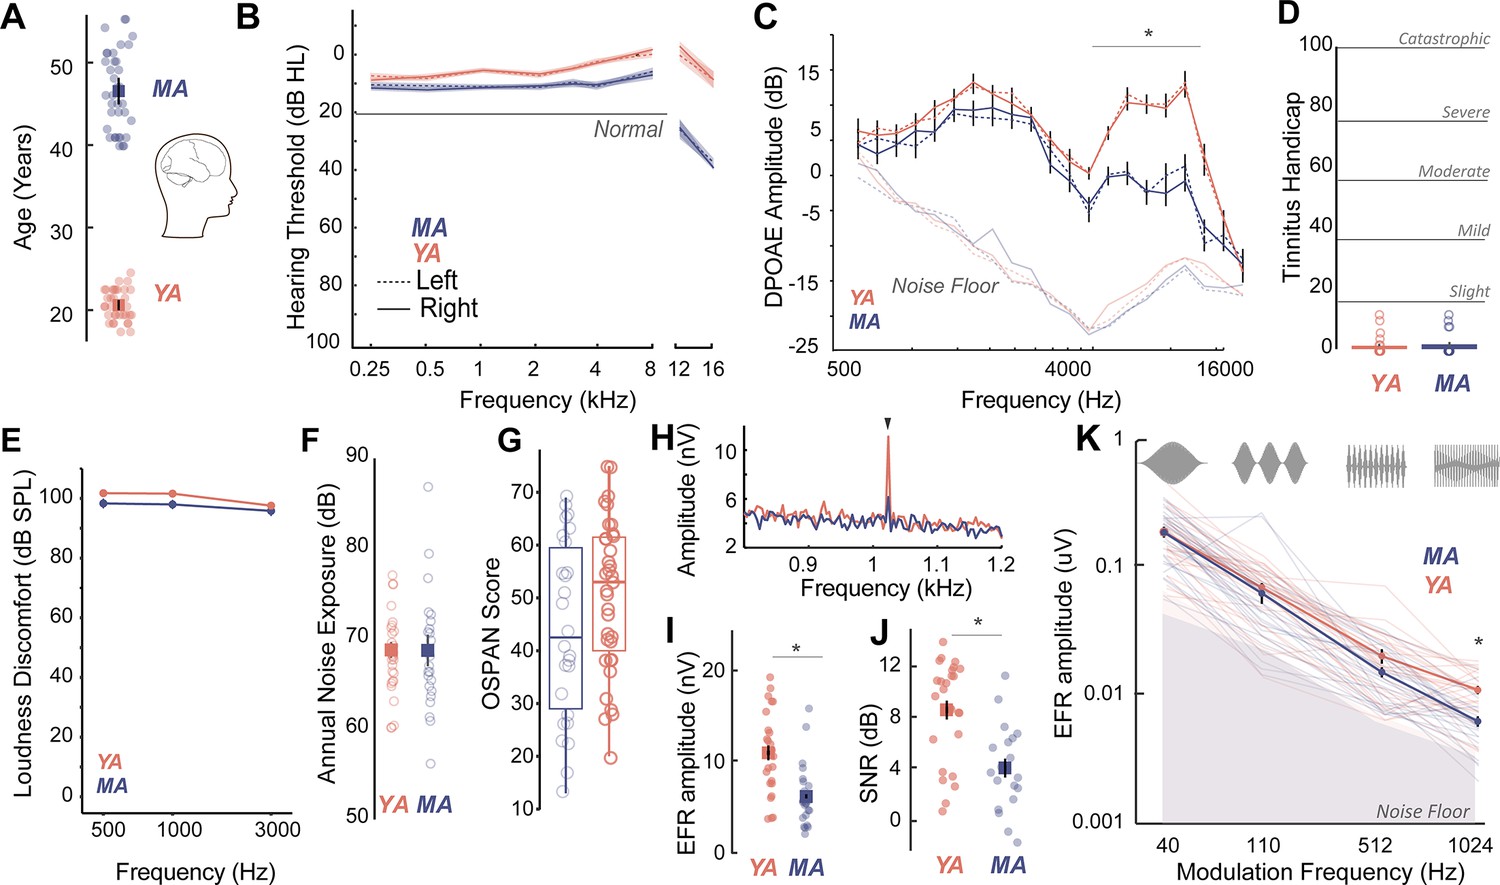
Age-related cochlear neural degeneration (CND) occurs prior to overt changes in hearing thresholds and can be assessed noninvasively by measuring phase-locked neural envelope following responses.
(A) Thirty seven middle-aged (MA, 40–55 years, mean = 46.1 ± 4.6 years) and 35 young adults (YA, 18–25 years, mean = 21.17 ± 1.8 years) participated in this study. (B) All participants had clinically normal-hearing thresholds, with some evidence of threshold losses at extended high frequencies above 8 kHz typically not tested in the clinic. Hearing thresholds in dB HL are shown on the Y-axis and frequency in kHz is plotted on the X-axis. (C) Outer hair cell function assessed using distortion product otoacoustic emissions (DPOAEs) is comparable between YA and MA up to 4 kHz and showed age-related decreases at higher frequencies. Both cohorts show no evidence of self-reported tinnitus (D) or hyperacusis measured as loudness discomfort levels (LDLs) (E), have comparable self-reported noise exposure levels (F), and present with comparable working memory scores assessed using operation span task (OSPAN) (G). (H) Envelope following responses (EFRs) to modulation frequencies of 1024 Hz can be reliably recorded in YA and MA using ‘tiptrodes’. The panel shows grand-averaged fast Fourier transform (FFT) traces for YA and MA. (I) MA showed significant declines in EFR amplitudes at 1024 Hz amplitude modulation (AM), with putative neural generators in the auditory nerve. (J) Signal-to-noise ratios were 8 dB on average for YA and 4 dB for MA. (K) Statistically significant decreases in EFR amplitudes were selective for 1024 Hz AM, the modulation frequency with putative generators in the auditory nerve. All panels: Error bars and shading represent standard error of the mean (SEM). Asterisks represent p<0.05, analysis of variance (ANOVA).
Figure 2
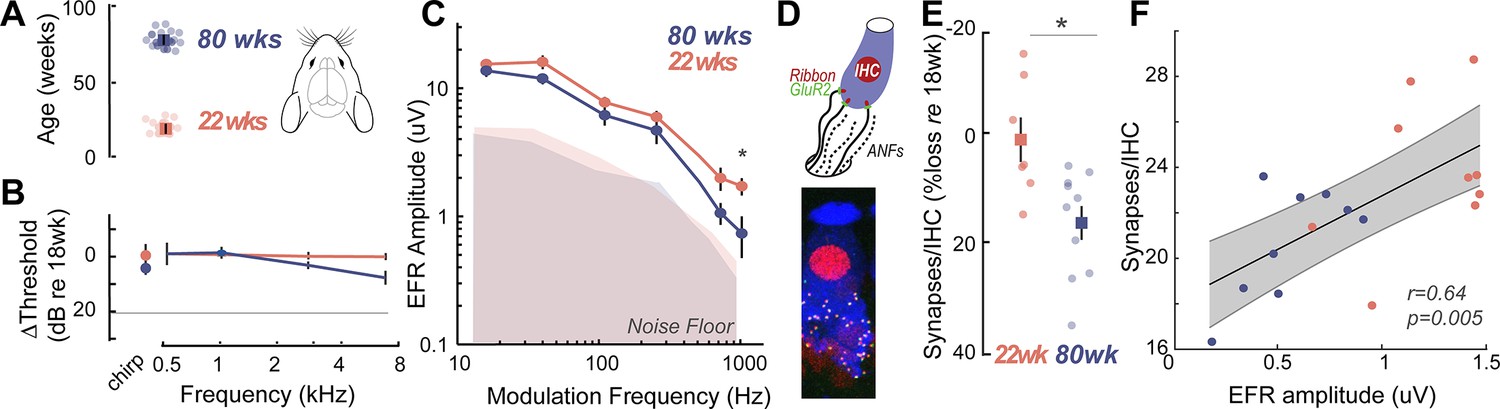
Cross-species experiments in a rodent model show that envelope following responses (EFRs) are a sensitive biomarker for histologically-confirmed cochlear neural degeneration (CND).
(A) Cross-species comparisons were made with young (22±0.86 weeks, n=14) and middle-aged (80±0.76 weeks, n=12) Mongolian gerbils, with identical stimuli, recording, and analysis parameters. (B) Middle-aged gerbils did not show any age-related decreases in hearing thresholds. (C) Age-related decreases in EFR amplitudes were isolated to the 1024 Hz modulation frequency, similar to middle-aged humans in Figure 1K. (D) CND was quantified using immunostained organ of Corti whole mounts, where afferent excitatory synapses were quantified using 3D reconstructed images. (E) Cochlear synapse counts at the 3 kHz cochlear region corresponding to the carrier frequency for the EFRs were significantly decreased in middle-aged gerbils, despite matched auditory thresholds. (F) EFR amplitudes at 1024 Hz amplitude modulation (AM) were significantly correlated with the number of remaining cochlear synapses, suggesting that these EFRs are a sensitive metric for CND with age. All panels: Error bars and shading represent standard error of the mean (SEM). Asterisks represent p<0.05, analysis of variance (ANOVA).
Figure 3
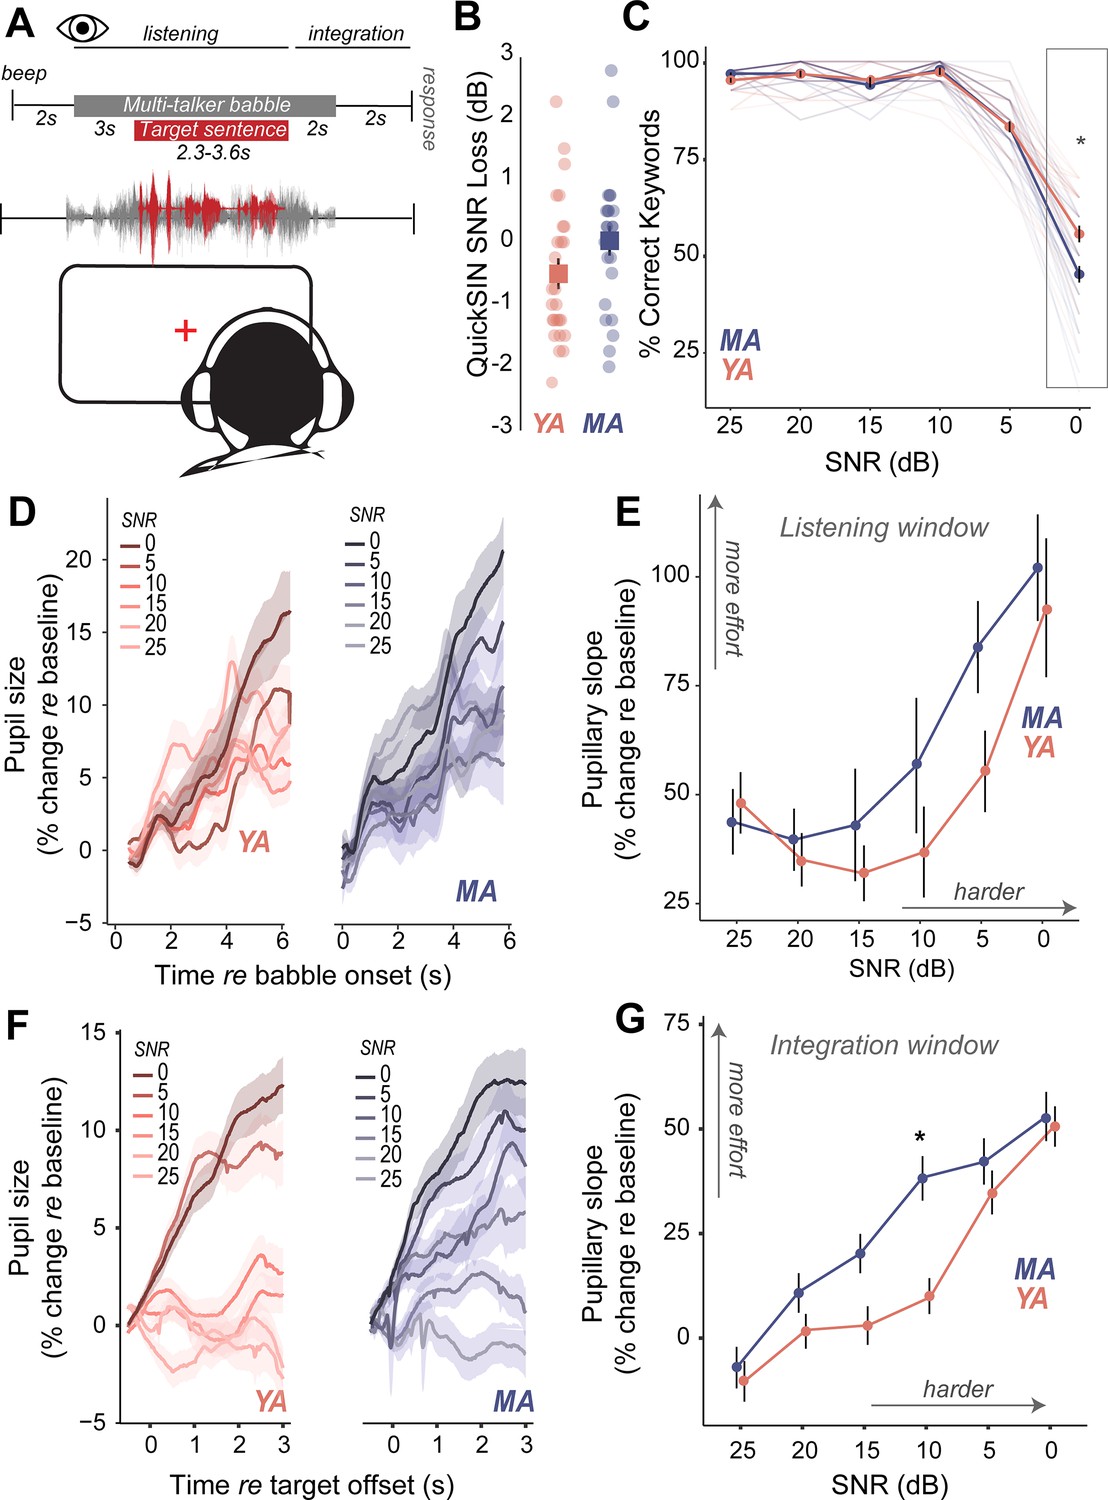
Increased listening effort precedes behavioral deficits in speech-in-noise perception in middle-aged adults.
(A) Speech perception in noise was assessed using the Quick Speech-in-Noise (QuickSIN) test, which presents moderate context sentences in varying levels of multi-talker babble. Pupillary measures were analyzed in two time-windows: (1) during stimulus presentation and (2) after target sentence offset and prior to response initiation. (B) No significant age-related differences were observed in clinical QuickSIN scores presented as dB signal-to-noise ratio (SNR) loss. (C) QuickSIN performance is matched between middle-aged (MA) and younger adults (YA) until the most difficult noise condition (SNR 0). The x-axis shows the SNR condition that the target sentences were presented in, with 25 dB being the easiest noise condition, and 0 dB being the most difficult noise condition. The y-axis shows participant accuracy in repeating keywords from the target sentences as percent correct. (D) Grand-averaged pupillary responses, measured during task listening as an index of effort, exhibit modulation with task difficulty, with greater pupillary dilations observed in harder conditions for both groups. (E) Middle-aged adults show consistently higher pupillary responses during performance on the QuickSIN task and at SNR levels prior to when overt behavioral deficits are observed. (F) Grand-averaged pupillary responses measured after target sentence offset as an index of effort exhibit greater modulation with task difficulty, compared to changes in the listening window. (G) Trends seen in the listening window were amplified in this integration window, with middle-aged adults showing even greater effort, especially at moderate SNRs where behavior was matched.
Figure 4
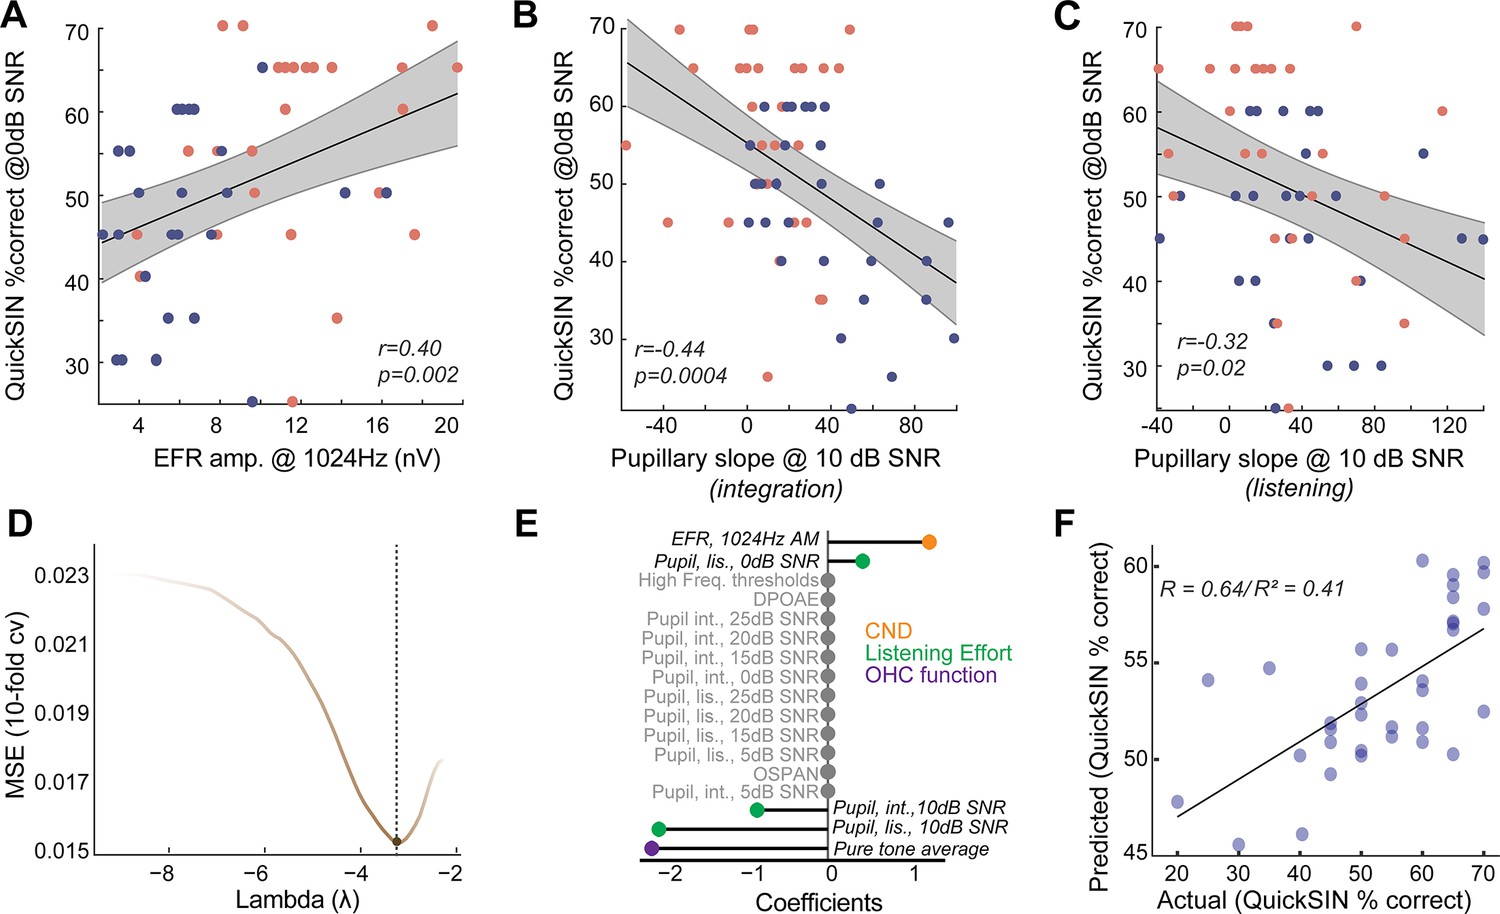
Listening effort and cochlear neural degeneration (CND) provide complementary contributions to speech-in-noise intelligibility.
(A) Behavioral performance at the most challenging signal-to-noise ratio (SNR) was significantly correlated with the envelope following response (EFR) measures of CND, with lower EFR amplitudes being associated with poorer behavioral performance. (B) Pupillary responses at 10 dB SNR from the integration window were significantly correlated with behavioral performance at 0 dB SNR. (B) These correlations between pupillary responses at 10 dB SNR and behavioral performance at 0 dB SNR were also found in the listening window, even though there were no group differences in age, further strengthening the link between listening effort at moderate SNRs and behavioral performance at challenging SNRs. (D) An elastic net regression model with 10-fold cross-validation (cv) was fit to the Quick Speech-in-Noise (QuickSIN) scores at 0 dB SNR. The tuning parameter Lambda controls the extent to which coefficients contributing least to predictive accuracy are suppressed. (E) A lollipop plot displaying the coefficients (β) contributing to explaining variance on QuickSIN performance suggests that CND, listening effort, and subclinical changes in hearing thresholds all contribute to QuickSIN performance. (F) QuickSIN scores predicted by the elastic net regression are correlated with actual participant QuickSIN scores.
Author response image 1
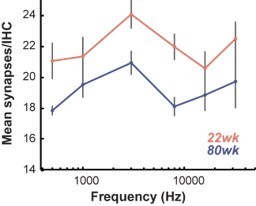
Cochlear synapse counts per inner hair cell (IHC) in young and middle-aged gerbils as a function of cochlear frequency.
Author response image 2
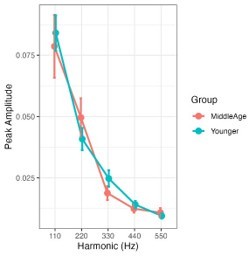
Harmonics analysis for the first four harmonics of envelope following responses elicited to the 110Hz AM stimulus.
Tables
Table 1
Comparison of air conduction thresholds using a three-way analysis of variance (ANOVA) (middle-aged adults [MA] =37, young adults [YA] =35).
| Effects | DFn | Sum Sq | Mean Sq | F-value | p-Value |
|---|---|---|---|---|---|
| Frequency | 6 | 5067 | 844 | 20.786 | <0.001*** |
| Ear | 1 | 3 | 3 | 0.068 | 0.8 |
| Group | 1 | 5831 | 5813 | 143.521 | <0.001*** |
| Freq:Ear | 6 | 85 | 14 | 0.349 | 0.9 |
| Freq:Group | 6 | 905 | 151 | 3.712 | <0.001*** |
| Ear:Group | 1 | 7 | 7 | 0.164 | 0.7 |
| Freq:Ear:Group | 6 | 234 | 39 | 0.961 | 0.5 |
| Residuals | 840 | 34125 | 41 |
-
*p<0.05; ***p<0.001.
Table 2
Comparison of extended high frequencies using three-way analysis of variance (ANOVA) (middle-aged adults [MA] =37, young adults [YA] =35).
| Effects | DFn | Sum Sq | Mean Sq | F-value | p-Value |
|---|---|---|---|---|---|
| Frequency | 2 | 21209 | 10605 | 74.523 | <0.001*** |
| Ear | 1 | 6 | 6 | 0.039 | 0.8 |
| Group | 1 | 32868 | 32868 | 230.978 | <0.001*** |
| Freq:Ear | 2 | 142 | 142 | 0.498 | 0.6 |
| Freq:Group | 2 | 6016 | 6016 | 21.137 | <0.001*** |
| Ear:Group | 1 | 152 | 152 | 1.069 | 0.3 |
| Freq:Ear:Group | 2 | 38 | 19 | 0.134 | 0.9 |
| Residuals | 350 | 49805 | 142 |
-
*p<0.05; ***p<0.001.
Table 3
Comparison of right ear distortion product otoacoustic emissions using a two-way analysis of variance (ANOVA) (middle-aged adults [MA] =34, young adults [YA] =31).
| Effects | DFn | DFd | F-value | p-Value |
|---|---|---|---|---|
| Group | 1 | 63 | 25.85 | <0.001*** |
| Freq | 9.55 | 601.56 | 58.786 | <0.001*** |
| Group:Freq | 9.55 | 601.56 | 7.341 | <0.001*** |
| 501:Group | 1 | 63 | 0.713 | 1.00 |
| 595:Group | 1 | 63 | 1.939 | 1.00 |
| 707:Group | 1 | 63 | 0.718 | 1.00 |
| 841:Group | 1 | 63 | 0.268 | 1.00 |
| 998:Group | 1 | 63 | 4.38 | 0.84 |
| 1188:Group | 1 | 63 | 0.794 | 1.00 |
| 1414:Group | 1 | 63 | 4.67 | 0.74 |
| 1681:Group | 1 | 63 | 1.724 | 1.00 |
| 2000:Group | 1 | 63 | 0.87 | 1.00 |
| 2378:Group | 1 | 63 | 0.059 | 1.00 |
| 2828:Group | 1 | 63 | 4.755 | 0.69 |
| 3365:Group | 1 | 63 | 2.095 | 1.00 |
| 4001:Group | 1 | 63 | 10.463 | 0.04* |
| 4757:Group | 1 | 63 | 18.015 | <0.001*** |
| 5658:Group | 1 | 63 | 29.947 | <0.001*** |
| 6727:Group | 1 | 63 | 37.01 | <0.001*** |
| 8000:Group | 1 | 63 | 28.94 | <0.001*** |
| 9514:Group | 1 | 63 | 39.235 | <0.001*** |
| 11314:Group | 1 | 63 | 26.847 | <0.001*** |
| 13454:Group | 1 | 63 | 7.771 | 0.147 |
| 160000:Group | 1 | 63 | 0.436 | 1.00 |
-
*p < .05; ***p < .001.
Table 4
Comparisons using one-way analyses of variance (ANOVAs).
| Measure | YA (n) | MA (n) | DFn | DFd | F-value | p-Value |
|---|---|---|---|---|---|---|
| THI | 33 | 37 | 1 | 68 | 0.834 | 0.364 |
| OSPAN | 34 | 34 | 1 | 66 | 3.501 | 0.066 |
| QuickSIN Clinical Score | 31 | 34 | 1 | 63 | 3.214 | 0.078 |
| NEQ | 32 | 32 | 1 | 66 | 0.8375 | 0.363 |
-
Adjusted p-values are reported using Bonferroni correction.
Table 5
Comparison of envelope following responses (EFRs) using two-way analyses of variance (ANOVAs) (middle-aged adults [MA] =29, young adults [YA] =28).
| Effects | DFn | DFd | F-value | p-Value |
|---|---|---|---|---|
| Group | 1 | 54 | 0.275 | 0.6 |
| AM | 1.47 | 79.49 | 151.407 | <0.001*** |
| Group:AM | 1.47 | 79.49 | 0.151 | 0.929 |
| 1024:Group | 1 | 55 | 23.8 | <0.001*** |
| 512:Group | 1 | 56 | 3.171 | 0.083 |
| 110:Group | 1 | 55 | 0.491 | 0.487 |
| 40:Group | 1 | 54 | 0.027 | 0.870 |
-
*p<0.05; ***p<0.001.
Table 6
Comparison of 22-week-old gerbil (n=14) and 80-week-old gerbil (n=12) envelope following responses (EFRs) using two-way analyses of variance (ANOVAs).
| Effects | DFn | DFd | F-value | p-Value |
|---|---|---|---|---|
| Group | 1 | 24 | 4.125 | 0.053 |
| AM | 2.68 | 64.28 | 74.636 | <0.001*** |
| Group:AM | 2.68 | 64.28 | 0.875 | 0.449 |
| 16:Group | 1 | 24 | 0.456 | 0.506 |
| 40:Group | 1 | 24 | 2.461 | 0.130 |
| 110:Group | 1 | 24 | 3.056 | 0.093 |
| 256:Group | 1 | 24 | 1.959 | 0.174 |
| 724:Group | 1 | 24 | 2.483 | 0.128 |
| 1024:Group | 1 | 24 | 5.158 | 0.032* |
-
*p < .05; ***p < .001.
Table 7
Comparison of synapse counts at 3000 Hz in 22- and 80-week-old gerbils using one-way analysis of variance (ANOVA).
| Measure | 22 weeks (n) | 80 weeks (n) | DFn | DFd | F-value | p-Value |
|---|---|---|---|---|---|---|
| Synapse counts | 14 | 12 | 1 | 16 | 4.877 | 0.042* |
-
*p<0.05; ***p<0.001.
Table 8
Comparison of Quick Speech-in-Noise (QuickSIN) performance using a mixed-design analysis of variance (ANOVA) (middle-age adults [MA] =34, young adults [YA] =31).
| Effects | DFn | DFd | F-value | p-value |
|---|---|---|---|---|
| Group | 1 | 372 | 3.79 | 0.0522 |
| SNR | 5 | 372 | 541.81 | <0.001*** |
| Group:SNR | 5 | 372 | 6.57 | <0.001*** |
| 0:Group | 1 | 62 | 10.512 | 0.001* |
| 5:Group | 1 | 62 | 0.002 | 0.956 |
| 10:Group | 1 | 62 | 1.336 | 0.252 |
| 15:Group | 1 | 62 | 1.834 | 0.180 |
| 20:Group | 1 | 62 | 0.227 | 0.634 |
| 25:Group | 1 | 62 | 4.980 | 0.0292* |
-
*p < .05; ***p < .001.
Table 9
Fixed-effect estimates for the model of pupillary responses from 0 s to 5.8 s time-locked to the babble masker onset to examine the effect of signal-to-noise ratio (SNR) and age group (observations =96,612, groups: participant × SNR =332, participant =63).
| Fixed effect | Estimate | SE | 95% CI | t | p |
|---|---|---|---|---|---|
| Intercept | 7.26 | 1.26 | [4.79, 9.73] | 5.76 | <0.001*** |
| ot1 | 48.14 | 10.62 | [27.33, 68.94] | 4.53 | <0.001*** |
| ot2 | –30.44 | 6.90 | [-43.96,–16.92] | –4.41 | <0.001*** |
| SNR 0 | –0.43 | 1.80 | [–3.95, 3.09] | –0.24 | 0.811 |
| SNR 5 | –3.45 | 1.80 | [–6.98, 0.07] | –1.92 | 0.055 |
| SNR 10 | –3.53 | 1.80 | [−7.06,–0.01] | –1.96 | 0.049* |
| SNR 15 | –3.72 | 1.77 | [−7.19,–0.25] | –2.10 | 0.035* |
| SNR 20 | –2.32 | 1.80 | [–5.85, 1.20] | –1.29 | 0.197 |
| ot1 × SNR 0 | 44.77 | 14.58 | [16.19, 73.34] | 3.07 | 0.002* |
| ot1 × SNR 5 | 7.21 | 14.59 | [–21.39, 35.81] | 0.49 | 0.621 |
| ot1 × SNR 10 | –11.30 | 14.59 | [–39.90, 17.30] | –0.77 | 0.439 |
| ot1 × SNR 15 | –16.19 | 14.34 | [–44.29, 11.92] | –1.13 | 0.259 |
| ot1 × SNR 20 | –13.08 | 14.58 | [–41.65, 15.50] | –0.90 | 0.370 |
| ot2 × SNR 0 | 44.88 | 9.26 | [26.73, 63.02] | 4.85 | <0.001*** |
| ot2 × SNR 5 | 61.77 | 9.27 | [43.60, 79.94] | 6.66 | <0.001*** |
| ot2 × SNR 10 | 26.06 | 9.27 | [7.88, 44.23] | 2.81 | 0.005* |
| ot2 × SNR 15 | 14.74 | 9.11 | [–3.11, 32.59] | 1.62 | 0.105 |
| ot2 × SNR 20 | 20.07 | 9.26 | [1.92, 38.22] | 2.17 | 0.030* |
| Group (MA vs. YA) | 1.03 | 1.85 | [–2.60, 4.65] | 0.55 | 0.579 |
| Group × SNR 0 | 1.53 | 2.64 | [–3.65, 6.70] | 0.58 | 0.564 |
| Group × SNR 5 | 1.87 | 2.63 | [–3.28, 7.02] | 0.71 | 0.476 |
| Group × SNR 10 | –4.82e–03 | 2.60 | [–5.10, 5.10] | –1.85e–03 | 0.999 |
| Group × SNR 15 | –1.26 | 2.62 | [–6.39, 3.88] | –0.48 | 0.632 |
| Group × SNR 20 | –1.26 | 2.64 | [–6.44, 3.91] | –0.48 | 0.632 |
| ot1 × Group | –4.37 | 15.56 | [–34.87, 26.14] | –0.28 | 0.779 |
| ot1 × Group × SNR 0 | 13.71 | 21.46 | [–28.35, 55.77] | 0.64 | 0.523 |
| ot1 × Group × SNR 5 | 32.89 | 21.35 | [–8.94, 74.73] | 1.54 | 0.123 |
| ot1 × Group × SNR 10 | 24.20 | 21.16 | [–17.26, 65.66] | 1.14 | 0.253 |
| ot1 × Group × SNR 15 | 15.46 | 21.28 | [–26.25, 57.18] | 0.73 | 0.468 |
| ot1 × Group × SNR 20 | 8.97 | 21.45 | [–33.07, 51.00] | 0.42 | 0.676 |
| ot2 × Group | –4.89 | 10.11 | [–24.70, 14.92] | –0.48 | 0.628 |
| ot2 × Group × SNR 0 | 3.18 | 13.65 | [–23.57, 29.93] | 0.23 | 0.816 |
| ot2 × Group × SNR 5 | –11.65 | 13.57 | [–38.26, 14.96] | –0.86 | 0.391 |
| ot2 × Group × SNR 10 | 16.76 | 13.46 | [–9.62, 43.13] | 1.24 | 0.213 |
| ot2 × Group × SNR 15 | 14.82 | 13.53 | [–11.70, 41.35] | 1.10 | 0.273 |
| ot2 × Group × SNR 20 | 12.19 | 13.63 | [–14.54, 38.91] | 0.89 | 0.371 |
-
Growth curve formula: lmer(Pupil ~ (ot1 + ot2)*Group*SNR + (0+ot1+ot2 | participant) + (ot1 +ot2 | participant:SNR), control = lmerControl(optimizer = ‘bobyqa’), REML = FALSE). Orthogonal polynomial terms: ot1=linear (slope); ot2=quadratic (curvature).
-
*p<0.05; ***p<0.001.
Table 10
Fixed-effect estimates for model of pupillary responses from 0 s to 3 s time-locked to Quick Speech-in-Noise (QuickSIN) target sentence offset to examine the effect of signal-to-noise ratio (SNR) and age group (observations =63,184, groups: participant × SNR =359, participant =63).
| Fixed effect | Estimate | SE | 95% CI | t | p |
|---|---|---|---|---|---|
| Intercept | –0.36 | 0.81 | [–1.95, 1.22] | –0.45 | 0.652 |
| ot1 | –10.33 | 6.06 | [–22.20, 1.54] | –1.71 | 0.088 |
| ot2 | –2.24 | 3.12 | [–8.35, 3.88] | –0.72 | 0.474 |
| SNR 0 | 7.40 | 1.00 | [5.45, 9.36] | 7.43 | <0.001*** |
| SNR 5 | 6.93 | 1.00 | [4.97, 8.88] | 6.95 | <0.001*** |
| SNR 10 | 1.86 | 1.00 | [–0.09, 3.82] | 1.87 | 0.062 |
| SNR 15 | 0.84 | 1.01 | [–1.13, 2.81] | 0.83 | 0.404 |
| SNR 20 | –0.55 | 1.00 | [–2.50, 1.41] | –0.55 | 0.583 |
| ot1 × SNR 0 | 60.92 | 7.15 | [46.91, 74.92] | 8.52 | <0.001*** |
| ot1 × SNR 5 | 45.16 | 7.15 | [31.15, 59.16] | 6.32 | <0.001*** |
| ot1 × SNR 10 | 20.10 | 7.15 | [6.10, 34.11] | 2.81 | 0.005* |
| ot1 × SNR 15 | 13.38 | 7.21 | [–0.76, 27.51] | 1.85 | 0.064 |
| ot1 × SNR 20 | 12.27 | 7.15 | [–1.74, 26.28] | 1.72 | 0.086 |
| ot2 × SNR 0 | –3.41 | 4.19 | [–11.62, 4.81] | –0.81 | 0.416 |
| ot2 × SNR 5 | –14.97 | 4.19 | [-23.19,–6.75] | –3.57 | <0.001*** |
| ot2 × SNR 10 | 6.43 | 4.19 | [–1.78, 14.65] | 1.53 | 0.125 |
| ot2 × SNR 15 | 8.83 | 4.23 | [0.54, 17.12] | 2.09 | 0.037* |
| ot2 × SNR 20 | 7.83 | 4.19 | [–0.39, 16.05] | 1.87 | 0.062 |
| Group (MA vs YA) | –0.30 | 1.16 | [–2.57, 1.97] | –0.26 | 0.796 |
| Group × SNR 0 | 1.64 | 1.44 | [–1.18, 4.46] | 1.14 | 0.254 |
| Group × SNR 5 | 0.37 | 1.43 | [–2.43, 3.16] | 0.26 | 0.796 |
| Group × SNR 10 | 3.16 | 1.43 | [0.36, 5.97] | 2.21 | 0.027* |
| Group × SNR 15 | 3.79 | 1.45 | [0.95, 6.63] | 2.62 | 0.009* |
| Group × SNR 20 | 2.63 | 1.45 | [–0.22, 5.47] | 1.81 | 0.071 |
| ot1 × Group | 3.28 | 8.67 | [–13.72, 20.27] | 0.38 | 0.706 |
| ot1 × Group × SNR 0 | –0.89 | 10.33 | [–21.13, 19.36] | –0.09 | 0.932 |
| ot1 × Group × SNR 5 | 4.05 | 10.23 | [–15.99, 24.10] | 0.40 | 0.692 |
| ot1 × Group × SNR 10 | 25.33 | 10.26 | [5.21, 45.44] | 2.47 | 0.014* |
| ot1 × Group × SNR 15 | 14.01 | 10.40 | [–6.37, 34.39] | 1.35 | 0.178 |
| ot1 × Group × SNR 20 | 6.24 | 10.43 | [–14.20, 26.67] | 0.60 | 0.550 |
| ot2 × Group | 5.50 | 4.48 | [–3.29, 14.29] | 1.23 | 0.220 |
| ot2 × Group × SNR 0 | –11.67 | 6.04 | [–23.51, 0.18] | –1.93 | 0.053 |
| ot2 × Group × SNR 5 | 3.62 | 5.99 | [–8.11, 15.36] | 0.61 | 0.545 |
| ot2 × Group × SNR 10 | –6.72 | 6.01 | [–18.50, 5.06] | –1.12 | 0.264 |
| ot2 × Group × SNR 15 | –18.83 | 6.09 | [-30.77,–6.90] | –3.09 | 0.002* |
| ot2 × Group × SNR 20 | –17.10 | 6.10 | [-29.06,–5.15] | –2.80 | 0.005* |
-
Growth curve formula: lmer(Pupil ~ (ot1 +ot2)*Group*SNR + (ot1 +ot2 | participant) + (ot1 + ot2 | participant:SNR), control = lmerControl(optimizer = 'bobyqa'), REML = FALSE). Orthogonal polynomial terms: ot1=linear (slope); ot2=quadratic (curvature).
-
*p<0.05; ***p<0.001.
Appendix 1—key resources table
| Reagent type (species) or resource | Designation | Source or reference | Identifiers | Additional information |
|---|---|---|---|---|
| Genetic reagent (Meriones unguiculatus) | Crl:MON(Tum) | Charles River | 243 | |
| Antibody | ms(1gG1) α CtBP2 (mouse monoclonal) | BD Transduction Labs | BDB612044 | |
| Antibody | rb α MyosinVIIa (rabbit polyclonal) | Proteus Biosciences | 25-670 | |
| Antibody | ms(1gG2a) α GluA2 (mouse monoclonal) | Millipore | MAB397 | |
| Antibody | gt α ms (IgG2a) AF 488 (goat polyclonal) | Thermo Fisher | A-21131 | |
| Antibody | gt α ms (IgG1) AF 568 (goat polyclonal) | Thermo Fisher | A-21124 | |
| Antibody | dk α rb AF 647 (donkey polyclonal) | Thermo Fisher | A-31573 | |
| Chemical compound, drug | Isoflurane | Covetrus | 29405 | |
| Chemical compound, drug | Dexmedetomidine | Covetrus | 60984 | |
| Software, algorithm | Labview | National Instruments | https://www.ni.com/en-us/shop/labview.html | |
| Software, algorithm | MATLAB | MathWorks | https://www.mathworks.com/products/matlab.html | |
| Other | Eyelink 1000 Plus | SR Research | https://www.sr-research.com/eyelink-1000-plus/ | |
| Other | BioSemi Active Two EEG | BioSemi | https://www.biosemi.com/Products_ActiveTwo.htm | |
| Other | Insert earphones | Etymotic | ER-3C | |
| Other | Multi-I/O Processor- RZ6-A-P1 | TDT | https://www.tdt.com/product/rz6-multi-i-o-processor/ | |
| Other | ABR Amplifier, Medusa 4Z | TDT | https://www.tdt.com/product/medusa4z-amplifier/ |
Additional files
Download links
A two-part list of links to download the article, or parts of the article, in various formats.
Downloads (link to download the article as PDF)
Open citations (links to open the citations from this article in various online reference manager services)
Cite this article (links to download the citations from this article in formats compatible with various reference manager tools)
Increased listening effort and cochlear neural degeneration underlie speech-in-noise deficits in normal-hearing middle-aged adults
eLife 13:RP102823.
https://doi.org/10.7554/eLife.102823.3


