Physical constraints and biological regulations underlie universal osmoresponses
- Center for Quantitative Biology, Academy for Advanced Interdisciplinary Sudies, Peking University, China
- Peking-Tsinghua Center for Life Sciences, Academy for Advanced Interdisciplinary Sudies, Peking University, China
Figures
Figure 1
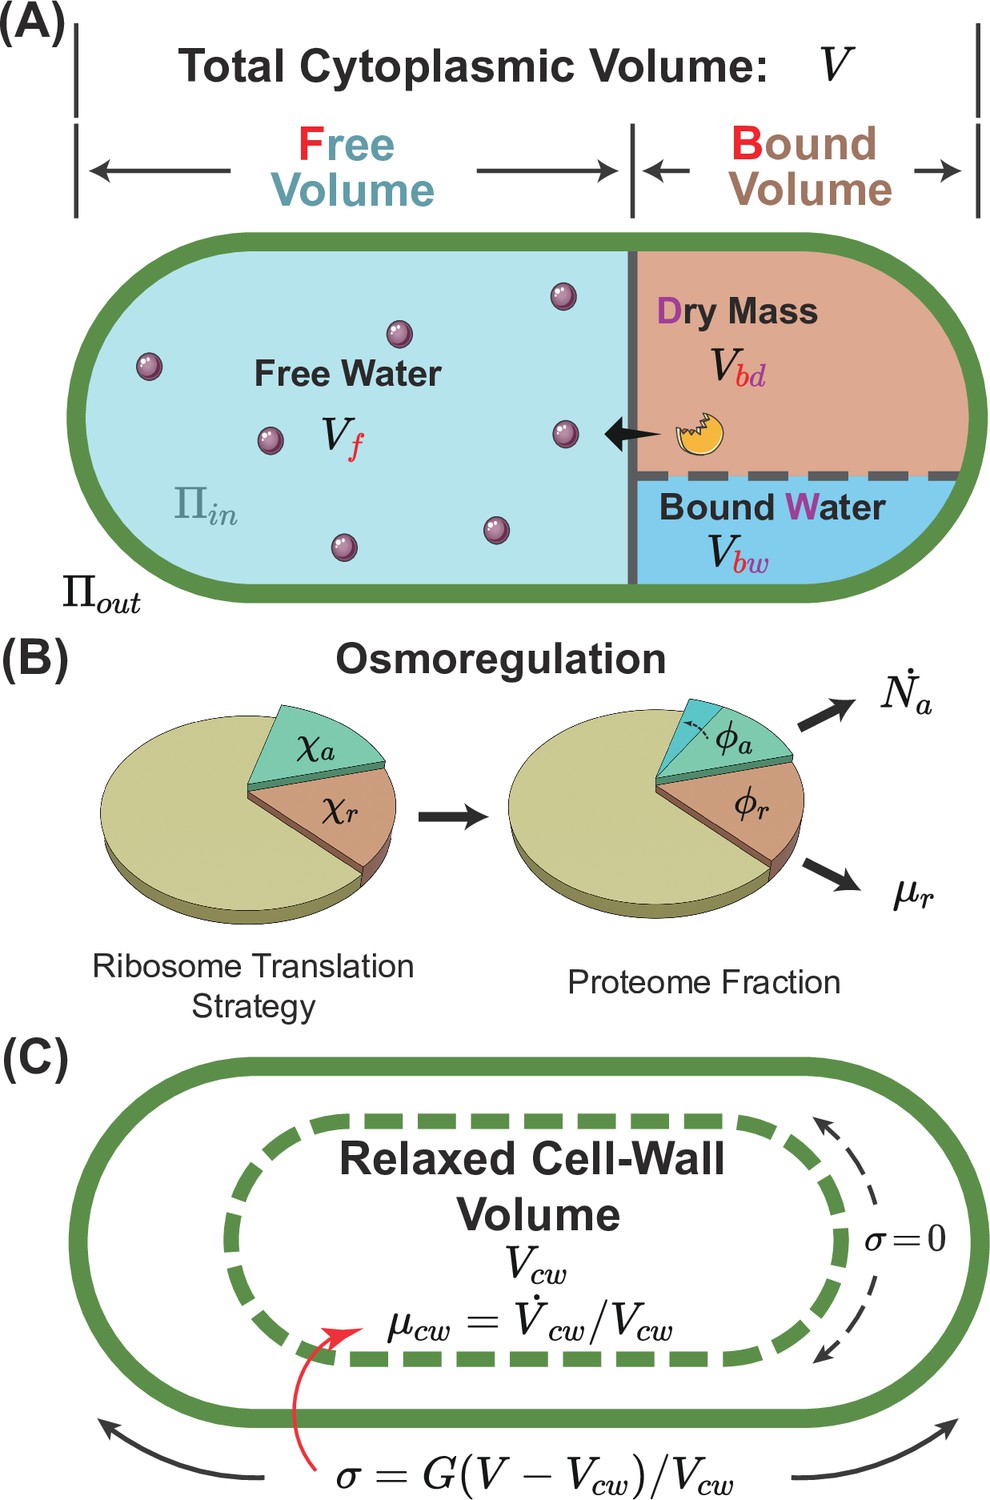
A schematic of the osmoresponse model.
(A) The total cytoplasmic volume includes the free and bound volumes. The free volume sets the internal osmotic pressure , where is the free volume and is the number of osmolyte molecules. The bound volume comprises the dry mass and bound water , i.e., , all proportional to the total protein mass. (B) We model osmoregulation through the change of ribosome translation strategy. When the protein density increases, the fraction of ribosomes translating the osmolyte-producing protein is upregulated, leading to the subsequent increase in the mass fraction of the osmolyte-producing protein . Here, denotes the dry-mass growth rate. (C) The cell-wall synthesis process is controlled by the turgor pressure , which is proportional to the cell-wall strain . Here, is the cytoplasmic volume, and is the relaxed cell-wall volume.
Figure 2
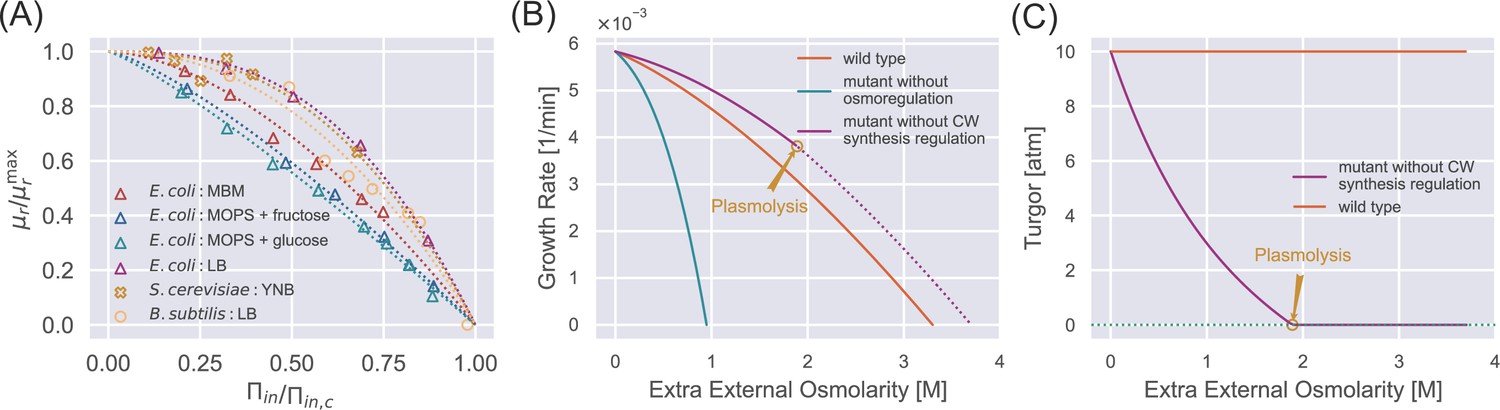
Steady-state properties under a constant external osmolarity.
(A) Normalized growth rate vs. normalized internal osmotic pressure of different species under various culture media. The experiment data (scatter markers) are fitted by our theoretical prediction Equation 10b. The data of E. coli are from Cayley et al., 1991; Dai et al., 2018; Rojas et al., 2014, the data of B. subtilis is from Rojas et al., 2017, and the data of S. cerevisiae is from our own experiments, where sorbitol is added to increase the external osmolarity. (B) Growth curves of wild-type (WT) cells, mutant cells without osmoregulation (), and mutant cells without cell-wall synthesis regulation (). The dotted line indicates the region where plasmolysis occurs for the mutant cells with . (C) Mutant cells without cell-wall synthesis regulation cannot maintain a stable turgor pressure in a hypertonic environment, while WT cells can maintain a constant turgor pressure. The mutant cells reach plasmolysis at a threshold of external osmolarity. In (B) and (C), the parameters for WT cells are chosen as the values for S. pombe, and the mutant values are set such that they have the same growth rate as the WT cells in the reference medium (Appendix 1—table 2).
-
Figure 2—source data 1
Data tables extracted from Figure 1 and Table 1 of Cayley et al., 1991.
- https://cdn.elifesciences.org/articles/102858/elife-102858-fig2-data1-v1.csv
-
Figure 2—source data 2
Data tables extracted from Figure 1A of Dai et al., 2018.
- https://cdn.elifesciences.org/articles/102858/elife-102858-fig2-data2-v1.csv
-
Figure 2—source data 3
Data tables extracted from Figure 1A of Rojas et al., 2014.
- https://cdn.elifesciences.org/articles/102858/elife-102858-fig2-data3-v1.csv
-
Figure 2—source data 4
Data tables extracted from Figure 3D of Rojas et al., 2017.
- https://cdn.elifesciences.org/articles/102858/elife-102858-fig2-data4-v1.csv
Figure 3 with 3 supplements

Transient dynamics after a constant osmotic shock.
(A) Numerical simulations of cells undergoing a constant 500 mM hyperosmotic shock. The dotted lines represent the steady-state values for the reference growth medium (green) and the medium after perturbation (yellow). (B) Numerical simulations of cells undergoing a constant 500 mM hypoosmotic shock. The purple circle in the third panel marks the growth rate peak during the supergrowth phase. (C) The dynamics of the internal state of a cell characterized by (). The dotted curve represents the constraint on the steady-state solution , and the solid trajectory is from numerical simulations. The triangles indicate the steady-state solution before the perturbation and the steady-state solution after the perturbation for a long enough time. The yellow open circle represents the immediate steady-state solution after applying the hyperosmotic shock. (D) The same analysis as (C) but for a constant 500 mM hypoosmotic shock. (E) The growth rate peak in the supergrowth phase (yellow) and the immediate value of turgor pressure after the hypoosmotic shock 𝜎𝑓 (green) vs. the amplitude of the hypoosmotic shock.
Figure 3—figure supplement 1
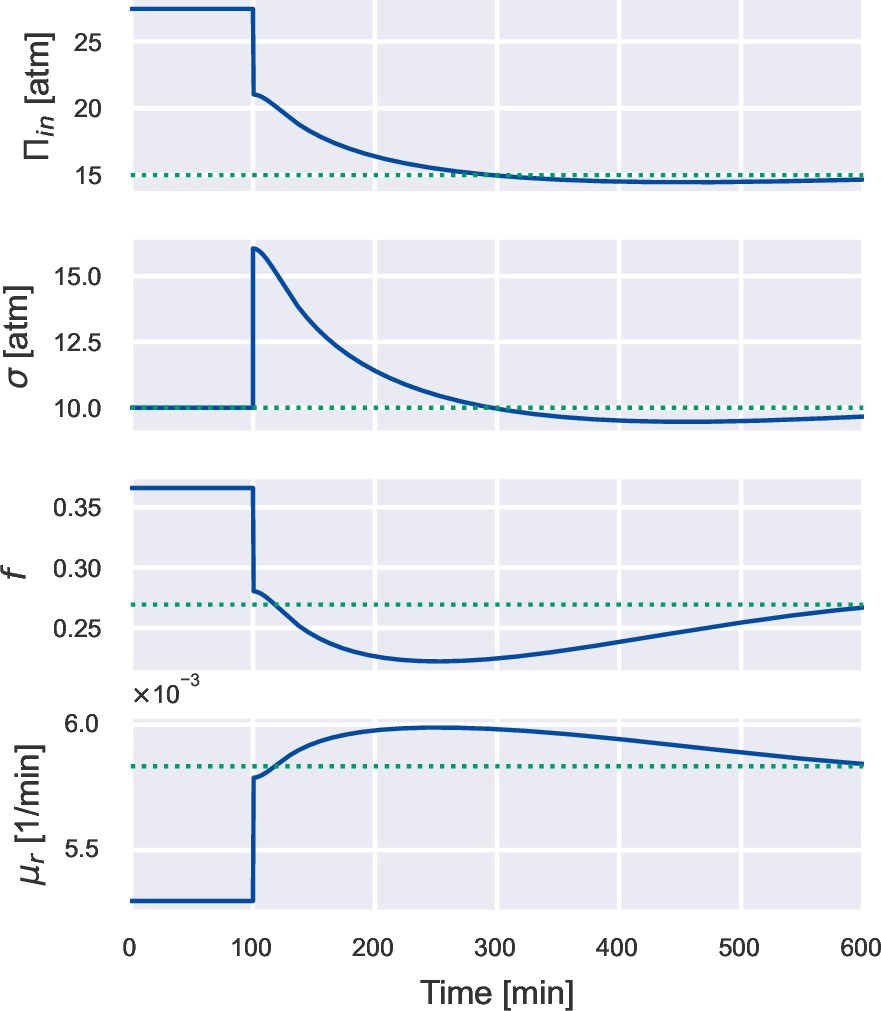
Dynamics of other variables under a constant 500 mM hypoosmotic shock.
Simulation of a cell undergoing a constant 500 mM hypoosmotic shock, the same simulation as Figure 3B. Here, we show the time dependence of the internal osmotic pressure, the turgor pressure, the free volume fraction , and the dry-mass growth rate . All these quantities relax to their steady-state values (dotted lines) on the timescale set by the doubling time.
Figure 3—video 1
The trajectory in the internal state space for a wide-type cell during a 500 mM hyperosmotic shock.
The video shown here corresponds to the dynamics depicted in Figure 3C.
Figure 3—video 2
The trajectory in the internal state space for a wide-type cell during a 500 mM hypoosmotic shock.
The video shown here corresponds to the dynamics depicted in Figure 3D.
Figure 4 with 2 supplements

Supergrowth phenomena under osmotic oscillation.
(A) Numerical simulations of wild-type (WT) S. pombe undergo 24 cycles of 500 mM osmotic oscillations with a 10 min period. We show a 30 min window average in the third panel of growth rate. (B–D) Quantitative agreement between simulations and experiments for the growth rate peak vs. different oscillation parameters, including (B) amplitude, (C) period length, and (D) number of periods. The red lines in (B, C) are predictions, and the blue line in (D) is fitting from which we infer the values of and . Green dots with error bars are experimental data from Knapp et al., 2019. (E) In the case of osmotic oscillation with a single period, the hyperosmotic period persists for 120 min before reverting to the reference medium. The vertical dotted blue line represents the minimal amplitude to induce cytoplasm jamming during the hyperosmotic period. The excess turgor pressure upon exiting the hyperosmotic period is approximately equal to the recovered turgor pressure during the hyperosmotic period. (F) The growth rate peak at different vs. the amplitude of a single oscillation. is the value of the WT S. pombe. Parameters of WT S. pombe are used in this figure unless otherwise mentioned (Table 1).
-
Figure 4—source data 1
Data tables extracted from Figure 4A–C of Knapp et al., 2019.
- https://cdn.elifesciences.org/articles/102858/elife-102858-fig4-data1-v1.csv
Figure 4—figure supplement 1

Dynamics of other variables under 24 cycles of 500 mM osmotic oscillation.
Simulation of a wild-type cell undergoing 24 cycles of 500 mM osmotic oscillation with a 10 min period, the same simulation as Figure 4A. We plot the cell-wall synthesis efficiency and the dry-mass density for better comparison with experimental data (Knapp et al., 2019).
Figure 4—figure supplement 2

The non-monotonic relationship between and amplitude.
Growth rate peak vs. oscillation amplitude under different numbers of oscillation periods. The total duration of the oscillation stimulus is fixed.
Appendix 1—figure 1

Fit of vs. for S. pombe growing in YE5S media, from which we infer the value of .
The data is extracted from Molines et al., 2022.
-
Appendix 1—figure 1—source data 1
Data tables extracted from Figure S1A of Molines et al., 2022.
- https://cdn.elifesciences.org/articles/102858/elife-102858-app1-fig1-data1-v1.csv
Appendix 1—figure 2
Dynamics of osmoresponse for unwalled cells.
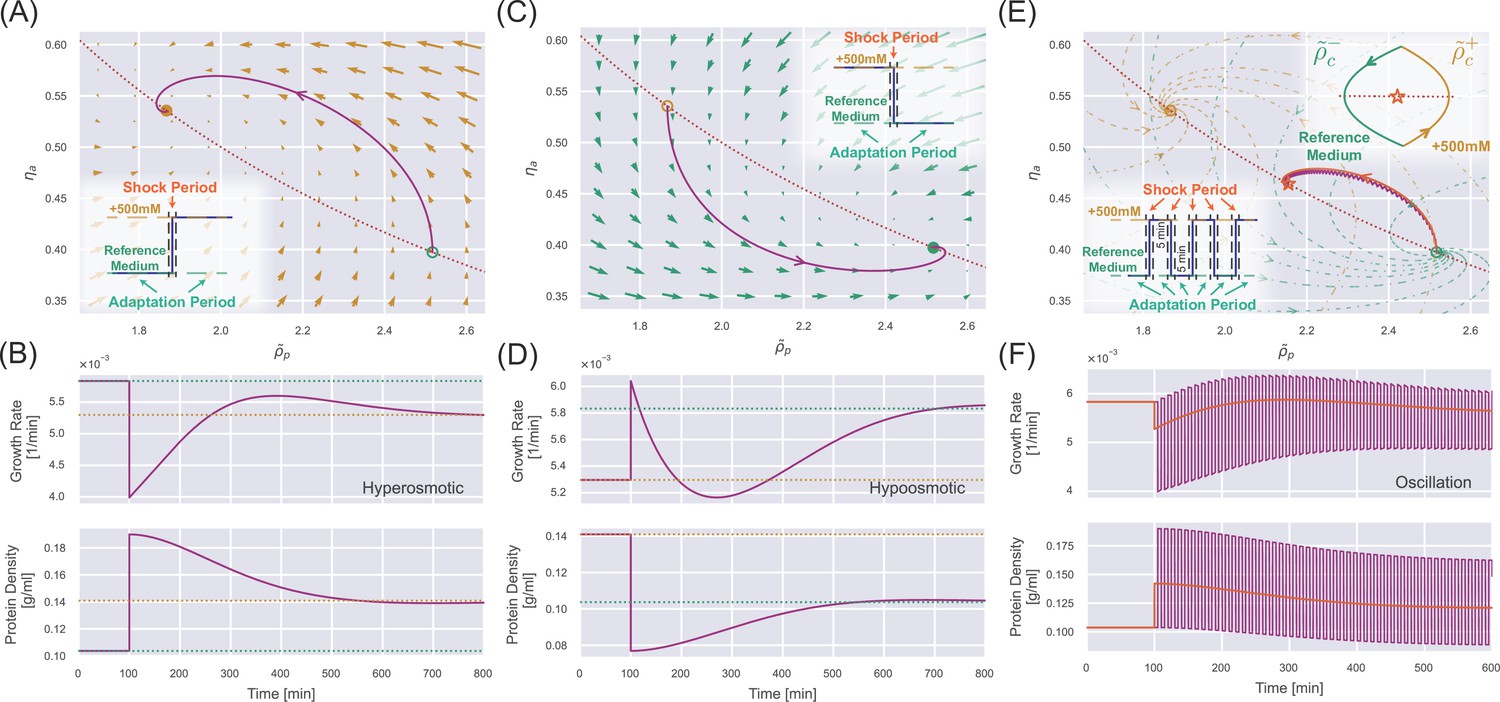
(A) The dynamics in the internal state space after a constant 500 mM hyperosmotic shock. The dotted curve represents , and the solid trajectory is from numerical simulations. The arrows represent the stream flow described by Equation 20 and Equation 21. The inset depicts the separation of timescale into shock periods and adaptation periods. (B) The temporal trajectory of growth rate (upper panel) and protein density (lower panel) corresponding to the 500 mM hyperosmotic shock in (A). The dashed lines represent the steady-state values in the reference medium (green) and the medium after perturbation (yellow). (C) The same analysis as (A) but for a constant 500 mM hypoosmotic shock. (D) The same analysis as (B) but for a constant 500 mM hypoosmotic shock. (E) The trajectory of the internal state during a 500 mM osmotic oscillation with a 10 min period (the purple line). The low inset depicts the separation of timescale into shock periods and adaptation periods. The upper inset shows that the trajectory finally converges to a periodic circle around a dynamic equilibrium point (marked by an orange star) on the red dotted curve . The trajectory for a constant hyperosmotic shock with an amplitude of 222 mM (orange curve) almost coincides with the trajectory for the oscillator shock. (F) The purple curves represent the temporal trajectory of growth rate (upper panel) and protein density (lower panel) corresponding to the 500 mM osmotic oscillation in (E). The orange curves represent the corresponding ones for the constant hyperosmotic shock with an amplitude of 222 mM.
Appendix 1—figure 3
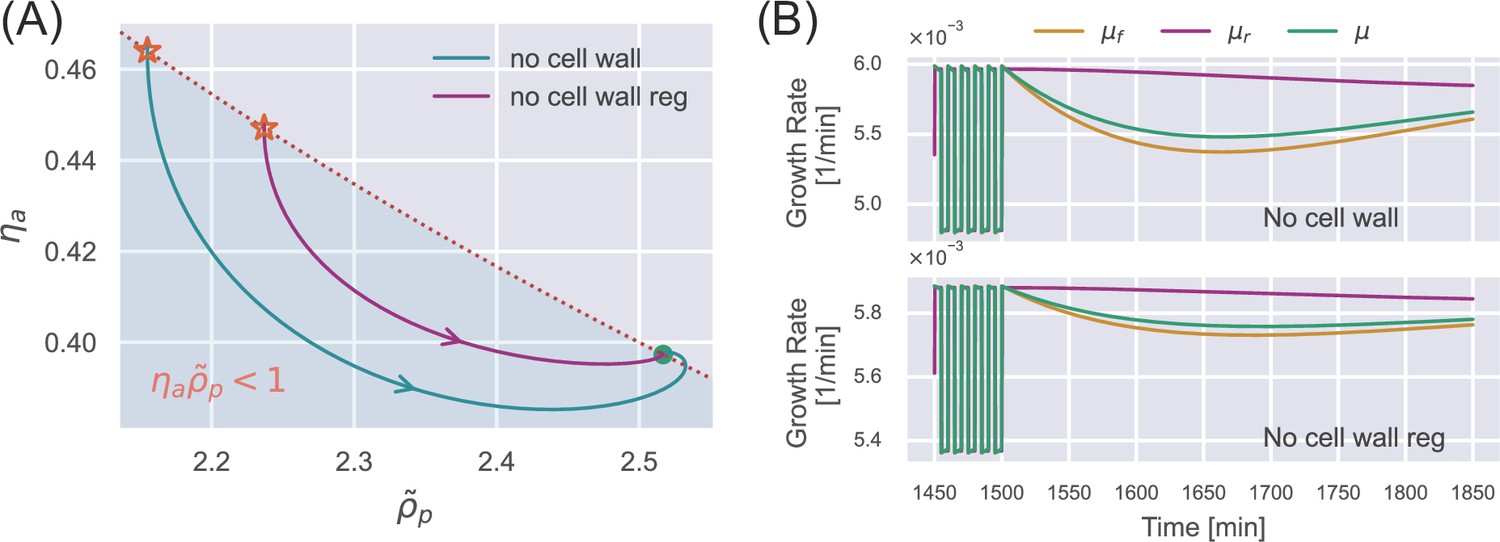
Dynamics of deficient cells after removing a sufficiently long oscillatory stimulus.
(A) An oscillation stimulus is initially applied in the simulation until the cell reaches the periodic steady state (stars). The external osmolarity is then switched to the reference growth medium. The internal state evolves toward the steady state in the reference growth medium. Here, we show the results of an unwalled cell (blue curve) and a walled cell deficient in cell-wall synthesis regulation (purple curve). (B) The time dependence of the various growth rates corresponding to the simulations in (A).
Appendix 1—figure 4

The relationship between the growth rate peak and the turgor pressure at the growth rate peak under different amplitudes of hypoosmotic shock.
The solid lines are the theoretical predictions, Equation A23. The open circles are obtained by approximating the turgor pressure as the immediate value after the shock in Equation A23. The gray crosses represent the peak growth rates obtained by direct simulations using different . As the color goes from light to dark, gradually decreases to zero.
Appendix 1—figure 5

The upper panel shows the time dependence of the external osmolarity, and the lower panel shows the trajectory of the turgor pressure under a mild osmotic oscillation.
Appendix 1—figure 6

Trajectory of a wild-type walled cell in the internal state space during a 500 mM osmotic oscillation.
During the oscillation, the equilibrium points move along the dotted curve . The circles indicate the equilibrium points during the first oscillation cycle, while the triangles indicate their positions after a large enough number of oscillations.
Appendix 1—figure 7

Time dependence of the free-volume growth rate , the dry-mass growth rate , and the overall growth rate μ under 500 mM osmotic oscillations.
Here, we show the results of an intact wild-type (WT) cell (upper panel), a walled cell deficient in cell-wall synthesis regulation (middle panel), and an unwalled cell (lower panel).
Appendix 1—figure 8

Given 24 cycles of osmotic oscillations with a period of 10 min, we vary the parameter , which dictates the sensitivity of cell-wall synthesis regulation.
A higher growth rate peak is observed as the sensitivity increases, irrespective of the oscillation amplitude. The dotted line represents the growth rate in the reference growth medium.
Videos
Appendix 1—video 1
The trajectory in the internal state space for an unwalled cell during a 500 mM osmotic oscillation with a 10 min period.
The video shown here corresponds to the dynamics depicted in Appendix 1—figure 2E.
Appendix 1—video 2
The trajectory in the internal state space for a wide-type cell during a 500 mM osmotic oscillation with a 10 min period.
The video shown here corresponds to the dynamics depicted in Appendix 1—figure 6.
Tables
Table 1
Model parameters for different species in their corresponding reference growth media.
| E. coli | Value | Reference | ||
|---|---|---|---|---|
| 1 [atm] | Rojas and Huang, 2018 | |||
| 1.68 [ml/g] | Deduce from Scott Cayley et al., 2000 | |||
| MBM (Cayley et al., 1991) | MOPS+fructose (Dai et al., 2018) | MOPS+glucose (Dai et al., 2018) | LB (Rojas et al., 2014) | |
| 0.743 [1/hr] | 0.776 [1/hr] | 1.14 [1/hr] | 2.05 [1/hr] | |
| 1.54 [Osm] | 1.49 [Osm] | 1.61 [Osm] | 2.18 [Osm] | |
| 1.68 | 1.30 | 1.18 | 2.72 | |
| Bacillus subtilis (LB) | Value | Reference | ||
| 19 [atm] | Whatmore and Reed, 1990 | |||
| 2.52 [1/hr] | Fit to Rojas et al., 2017 | |||
| 2.18 | ||||
| 3.09 [Osm] | ||||
| S. pombe (YE5S) | Value | Reference | ||
| 0.2 [Osm] | Atilgan et al., 2015 | |||
| 10 [atm] | Lemière and Chang, 2023 | |||
| 0.282 [g/ml] | Odermatt et al., 2021 | |||
| 0.104 [g/ml] | See Section B of Appendix 1 | |||
| μ | 0.35 [1/hr] | Knapp et al., 2019 | ||
| 0.788 | Fit to Molines et al., 2022 (Section B of Appendix 1) | |||
| 0.584 | Atilgan et al., 2015 | |||
| 2.60 [ml/g] | See Section B of Appendix 1 | |||
| 17.1 [atm] | ||||
| 3.5 [Osm] | ||||
| 100 [1/(min atm)] | ||||
| 0.267 [g/ml] | Deduce from Molines et al., 2022 (Section B of Appendix 1) | |||
| 3.03 | Copied from S. cerevisiae in YPD | |||
| 0.974 | Set according to | |||
| 0.371 [1/hr] | Set according to | |||
| 2.25 [(atm ml)/(g min)] | Set according to | |||
| 0.1 [min] | ||||
| 12.5 [min] | Fit to Knapp et al., 2019 | |||
| 1.7 | ||||
| S. cerevisiae (YPD) | Value | Reference | ||
| 0.26 [Osm] | ||||
| 3.1 [atm] | Lemière and Chang, 2023 | |||
| 0.295 [g/ml] | Feijó Delgado et al., 2013 | |||
| μ | 0.448 [1/hr] | Our experiment | ||
| 0.6 | Miermont et al., 2013 | |||
| 0.155 [g/ml] | See Section B of Appendix 1 | |||
| 0.994 [g/ml] | See Section B of Appendix 1 | |||
| 4.29 [ml/g] | See Section B of Appendix 1 | |||
| 0.450 [1/hr] | Fit to our data | |||
| 3.52 [Osm] | ||||
| 2.54 | ||||
| 3.03 | Set according to | |||
Appendix 1—table 1
The fraction of protein mass in the total dry mass, , and the fraction of cytoplasmic protein mass in the total protein mass, .
| E. coli | Value | Reference |
|---|---|---|
| 0.8 | Cayley et al., 1991 | |
| 0.68 | Cayley et al., 1991 | |
| S. cerevisiae and S. pombe | Value | Reference |
| 0.65 | Chong et al., 2015 | |
| 0.4 | Yamada and Sgarbieri, 2005 |
Appendix 1—table 2
Comparison of the model parameters between defective cells and intact cells.
Variables with are for the reference growth medium.
| Parameters | S. pombe(WT) | S. pombe(No osmoregulation) | S. pombe(No CW synthesis regulation) | S. pombe(No CW) |
|---|---|---|---|---|
| 0.2 [Osm] | 0.2 [Osm] | 0.2 [Osm] | 0.2 [Osm]+ 10 [atm] | |
| 10 [atm] | 10 [atm] | 10 [atm] | ||
| 0.104 [g/ml] | 0.104 [g/ml] | 0.104 [g/ml] | 0.104 [g/ml] | |
| 0.35 [1/hr] | 0.35 [1/hr] | 0.35 [1/hr] | 0.35 [1/hr] | |
| 0.788 | 0.788 | 0.788 | 0.788 | |
| 0.584 | 0.584 | 0.584 | ||
| 2.60 [ml/g] | 2.60 [ml/g] | 2.60 [ml/g] | 2.60 [ml/g] | |
| 17.1 [atm] | 17.1 [atm] | 17.1 [atm] | ||
| 3.5 [Osm] | 1.15 [Osm] | 3.5 [Osm] + 10 [atm] | 3.5 [Osm] + 10 [atm] | |
| 100 [1/(min atm)] | 100 [1/(min atm)] | 100 [1/(min atm)] | 100 [1/(min atm)] | |
| 0.267 [g/ml] | 0.267 [g/ml] | 0.267 [g/ml] | 0.267 [g/ml] | |
| 10 [atm] | 10 [atm] | 10 [atm] | ||
| 3.03 | 3.03 | 3.03 | 3.03 | |
| 0.974 | 0 | 0.974 | 0.974 | |
| 0.371 [1/hr] | 0.371 [1/hr] | 0.371 [1/hr] | 0.371 [1/hr] | |
| 2.25 [(atm ml)/(g min)] | 0.894 [(atm ml)/(g min)] | 2.25 [(atm ml)/(g min)] | 2.25 [(atm ml)/(g min)] | |
| 0.1 [min] | 0.1 [min] | |||
| 12.5 [min] | 12.5 [min] | |||
| 1.7 | 1.7 | 0 |
Appendix 1—table 3
A summary of the symbols involved in our model.
| Symbol | Description |
|---|---|
| total cytoplasmic volume | |
| free volume: cytoplasmic volume occupied by free water | |
| bound volume: cytoplasmic volume occupied by dry mass and bound water | |
| volume occupied by bound water | |
| dry volume: volume occupied by dry mass | |
| relaxed cell-wall volume | |
| free volume fraction | |
| bound volume per total protein mass | |
| cytoplasmic osmotic pressure | |
| external osmotic pressure | |
| critical cytoplasmic osmolarity where cell growth arrests | |
| critical external osmolarity where cell growth arrests | |
| turgor pressure | |
| cell-wall elastic modulus | |
| elastic strain of the cell wall | |
| water permeability of the cell membrane | |
| number of osmolyte molecules in cytoplasm | |
| total mass of the proteome | |
| mass of the osmolyte-producing protein | |
| mass of the ribosomal protein | |
| protein density | |
| critical protein density where cell growth arrests | |
| normalized protein density | |
| normalized critical protein density | |
| normalization factor in protein density | |
| mass fraction of the osmolyte-producing protein in total proteome | |
| mass fraction of the ribosomal protein in total proteome | |
| fraction of ribosome translating osmolyte-producing protein | |
| fraction of ribosome translating ribosomal protein | |
| largest possible fraction of ribosome translating osmolyte-producing protein | |
| sensitivity of osmoregulation to intracellular crowding | |
| sensitivity of cell-wall synthesis regulation to turgor pressure | |
| timescale of up(down)-regulation of cell-wall synthesis regulation | |
| osmolyte production rate | |
| maximum osmolyte production rate | |
| ribosomal protein production rate | |
| maximum ribosomal protein production rate | |
| efficiency of osmoregulation | |
| efficiency of cell-wall synthesis regulation | |
| crowding factor | |
| μ | growth rate of total volume |
| growth rate of ribosomal protein (dry mass) | |
| growth rate of free volume | |
| growth rate of relaxed cell-wall volume | |
| peak growth rate of total volume during supergrowth phase |
Additional files
-
MDAR checklist
- https://cdn.elifesciences.org/articles/102858/elife-102858-mdarchecklist1-v1.docx
-
Appendix 1—figure 1—source data 1
Data tables extracted from Figure S1A of Molines et al., 2022.
- https://cdn.elifesciences.org/articles/102858/elife-102858-app1-fig1-data1-v1.csv
Download links
A two-part list of links to download the article, or parts of the article, in various formats.
Downloads (link to download the article as PDF)
Open citations (links to open the citations from this article in various online reference manager services)
Cite this article (links to download the citations from this article in formats compatible with various reference manager tools)
Physical constraints and biological regulations underlie universal osmoresponses
eLife 13:RP102858.
https://doi.org/10.7554/eLife.102858.3


