An extensive program of periodic alternative splicing linked to cell cycle progression
- University of North Carolina at Chapel Hill, United States
- University of Toronto, Canada
- Chinese Academy of Science, China
Figures
Figure 1 with 1 supplement
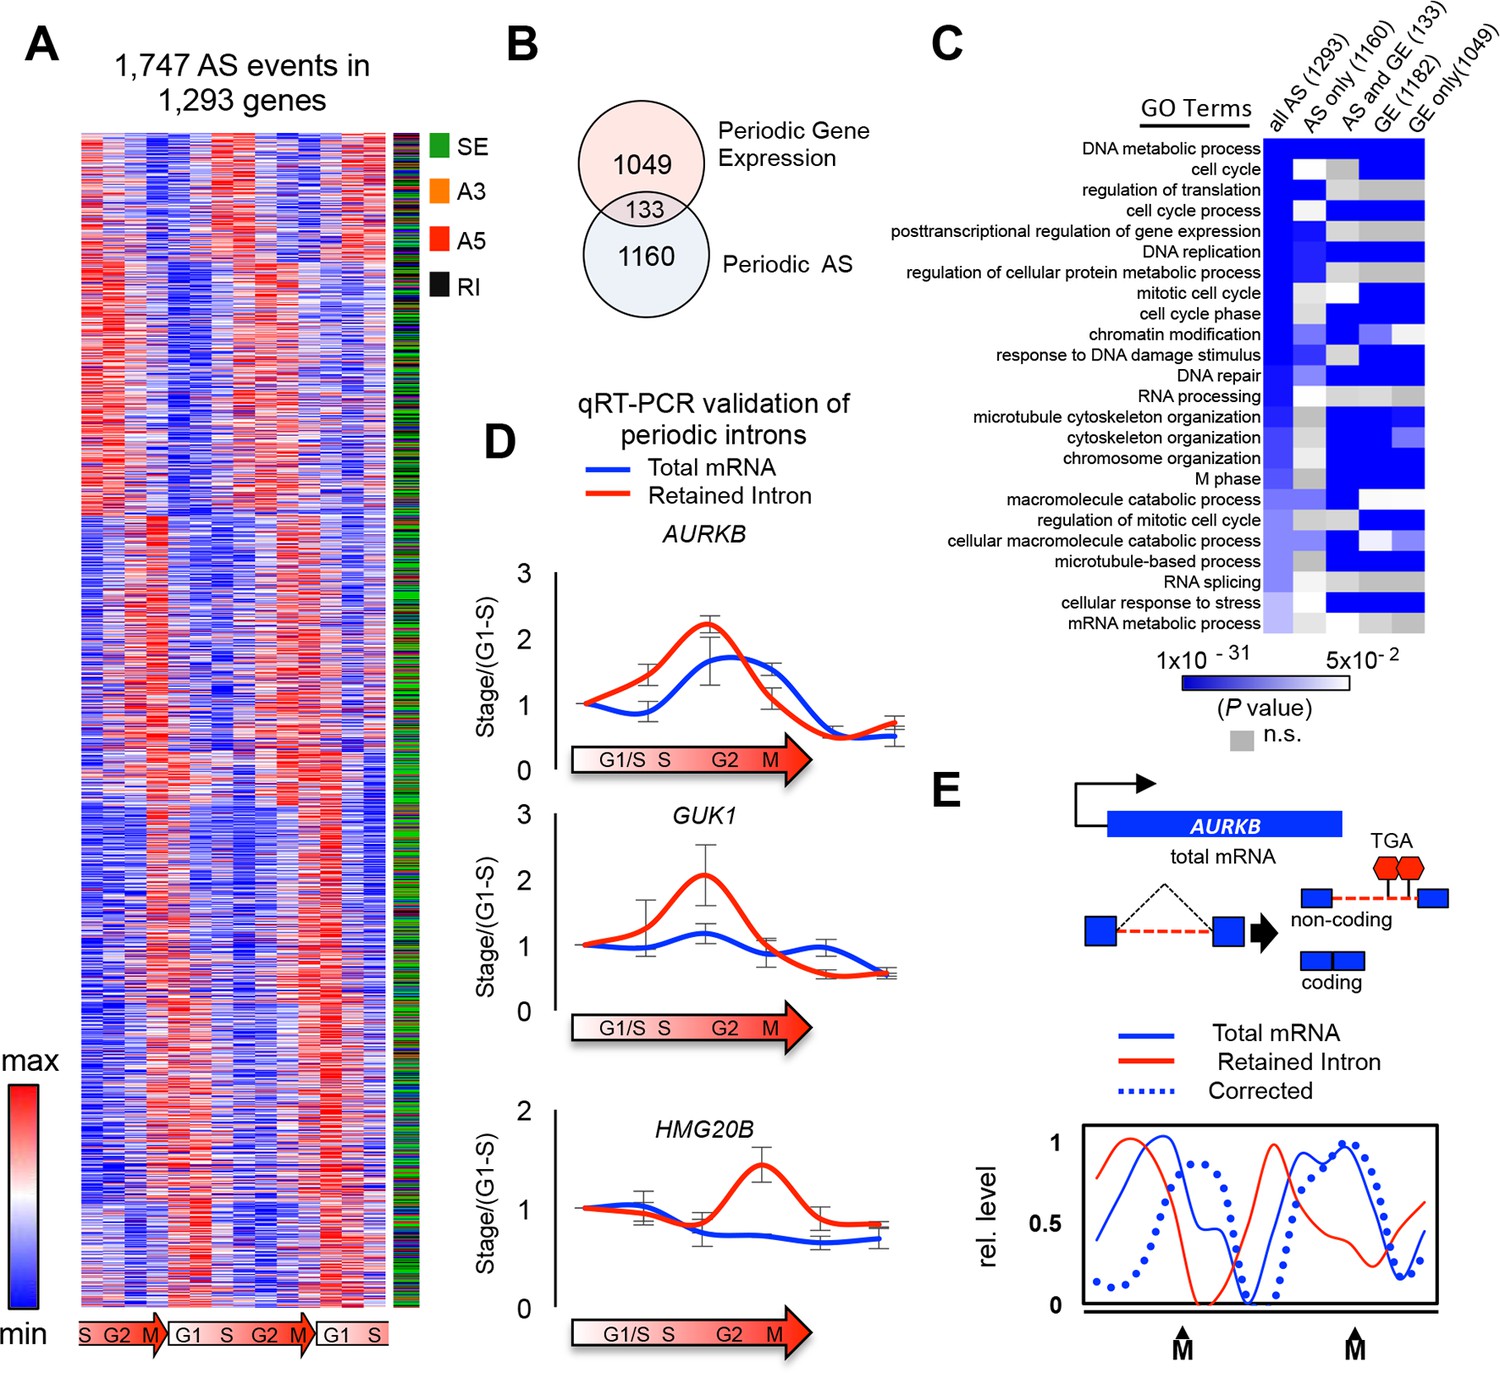
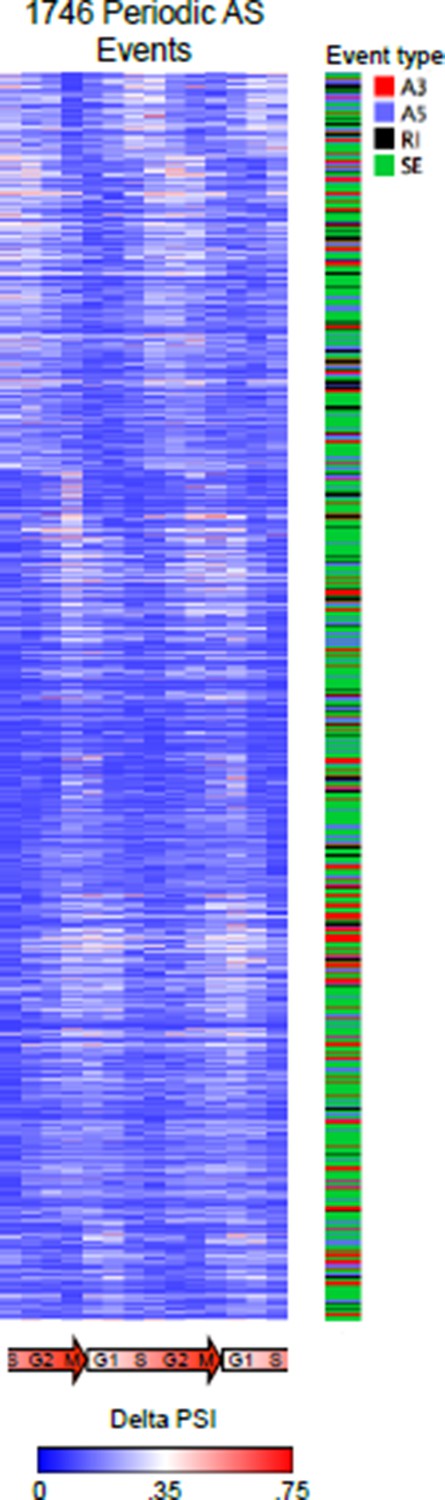
Global detection of periodic cell cycle-dependent alternative splicing.
(A) Heat map representation of periodically spliced events. Row-normalized relative PSI values are shown. Diagram below indicates cell cycle phase. (B) Overlap between periodically spliced genes and periodically expressed genes detected by RNA-Seq. (C) Heat map representation of enriched Gene Ontology terms shown as log (p-value). Three gene sets were analyzed separately: all genes with periodic AS, genes with periodic AS only, and genes with both periodic AS and periodic expression. (D) Real-time quantitative PCR analysis of periodic retained introns and total mRNAs for three selected genes. Cells were synchronized by double thymidine block and samples were collected 0, 3, 6, 9, 12 and 15 hr post release. Errors bars represent standard deviation of the mean. Diagram below indicates cell cycle stage. (E) Schematic representation of AURKB AS pattern. Line graph showing the relationship between intron retention and mRNA levels for the AURKB gene across the cell cycle. Percent intron retention (solid red line) across cell cycle was used to determine the fraction of total mRNAs (solid blue line) not containing an intron, i.e. ‘corrected’ mRNA levels (dashed blue line).
Figure 1—figure supplement 1
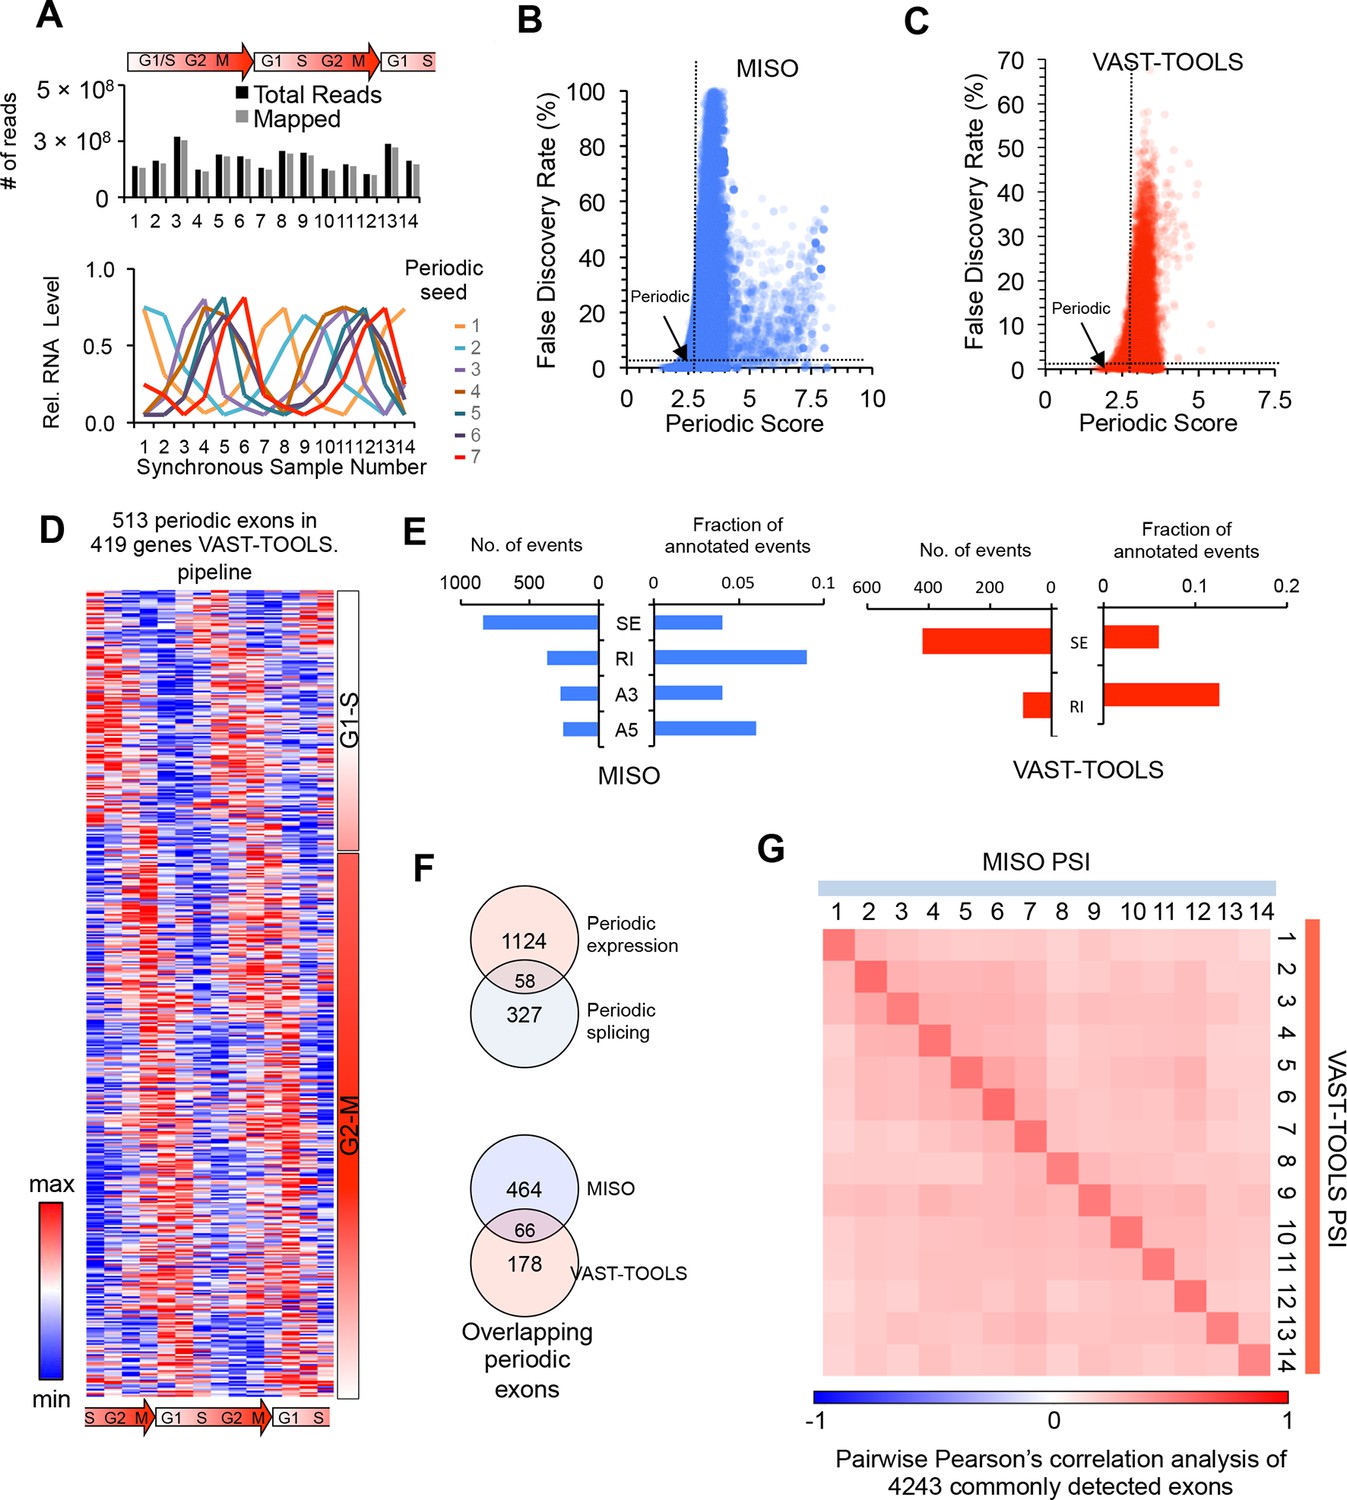
Identification of periodic AS by multiple analysis pipelines.
(A) Number of sequencing reads per sample (top). RNA-Seq reads and periodic seeds used for the identification of all periodically expressed and spliced genes (bottom, see methods). (B,C) Dot plot of periodic score and false discovery rate (FDR) for each exon analyzed by the MISO and VAST-TOOLS analysis pipelines. Dashed lines show FDR and periodic score cutoff (see methods). (D) Heat map representation of periodically-spliced events identified by the VAST-TOOLS pipeline. Data are row-normalized. Diagram below indicates cell cycle stage. (E) Bar graphs showing the number of periodic AS events identified separated by event type and shown as a fraction of total events identified (SE: skipped exon, RI: retained intron, A3: alternative 3’splice site, A5: alternative 5’splice site). MISO analysis (left panel in blue) and VAST-TOOLS analysis (right panel in red). (F) Venn diagram representation of the overlap between periodic AS identified by VAST-TOOLS and periodically expressed mRNAs (top). Venn diagram representation of the overlap between periodic AS events as identified by both VAST-TOOLS and MISO (bottom, see methods). (G) Spearman’s rank correlation analysis of each cell cycle time point according to commonly detected alternative exons by MISO and VAST-TOOLS. Spearman’s rho values are shown in heat map.
Figure 2 with 2 supplements
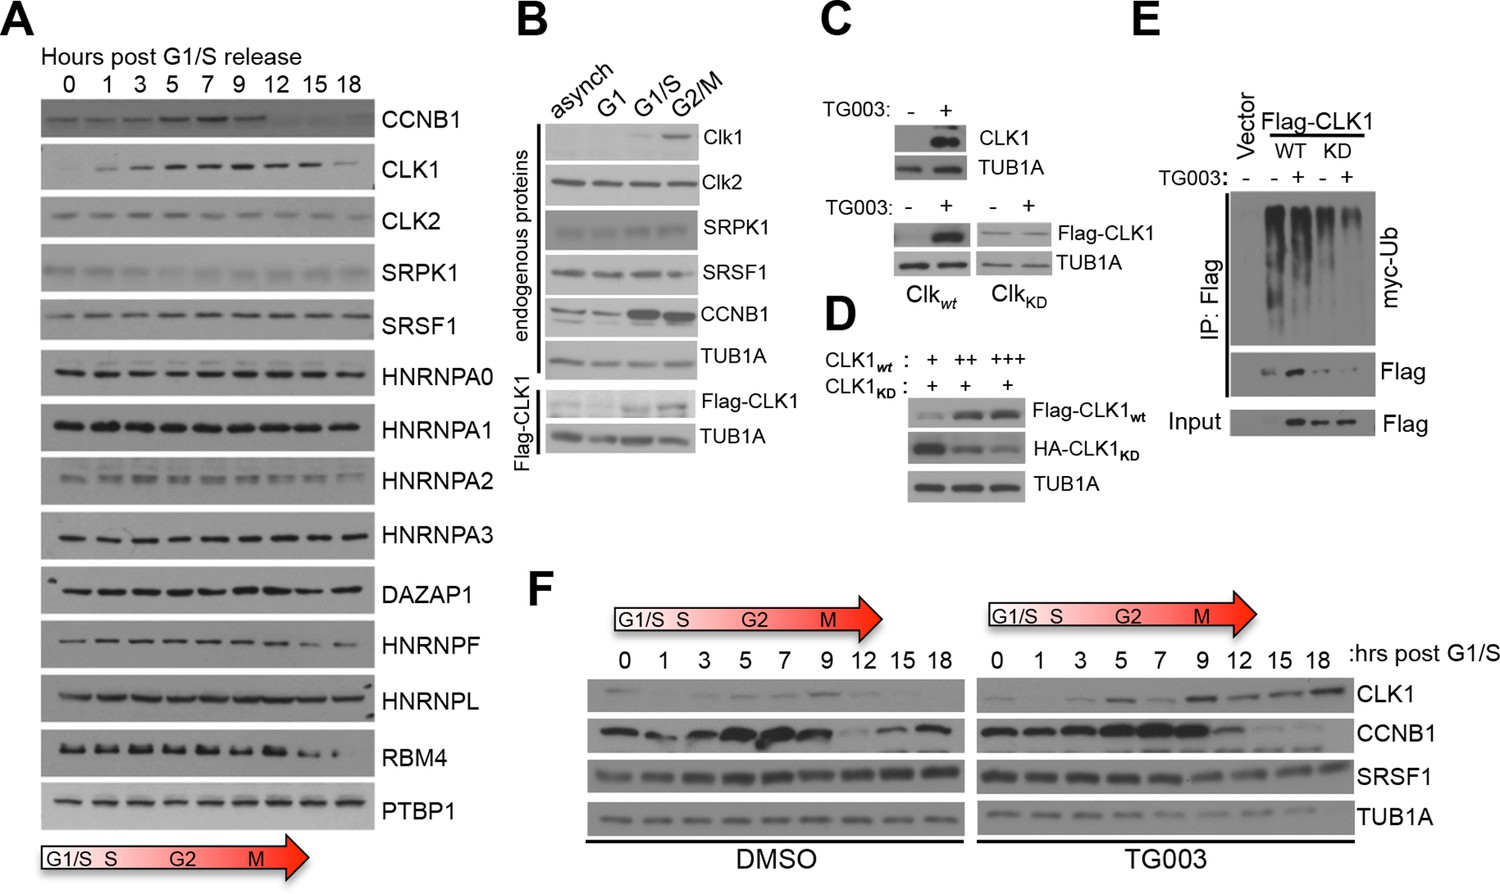
Cell cycle-dependent regulation of CLK1.
(A) Immunoblot analysis of proteins involved in splicing regulation in synchronized HeLa cells after release from double thymidine block. (B) Immunoblot analysis of selected proteins in asynchronous HeLa cells or cells arrested at different cell cycle stages. Stably expressed exogenous CLK1 levels were also assessed during the cell cycle (bottom panel). (C) Immunoblot of endogenous CLK1 (top) and exogenously-expressed wild type (CLK1wt) or kinase catalytically inactive (CLK1KD) proteins (bottom) upon treatment with 10 µM TG003. (D) Co-expression of CLK1WT and CLK1KD at different ratios. (E) Immunoprecipitation of CLK1 proteins co-expressed with myc-ubiquitin. Cells were treated with 10 μM TG003 and 10 μM MG132 prior to sample collection. (F) Immunoblot analysis of lysates from cells synchronized upon early S phase (double thymidine) release with or without TG003 treatment.
Figure 2—figure supplement 1
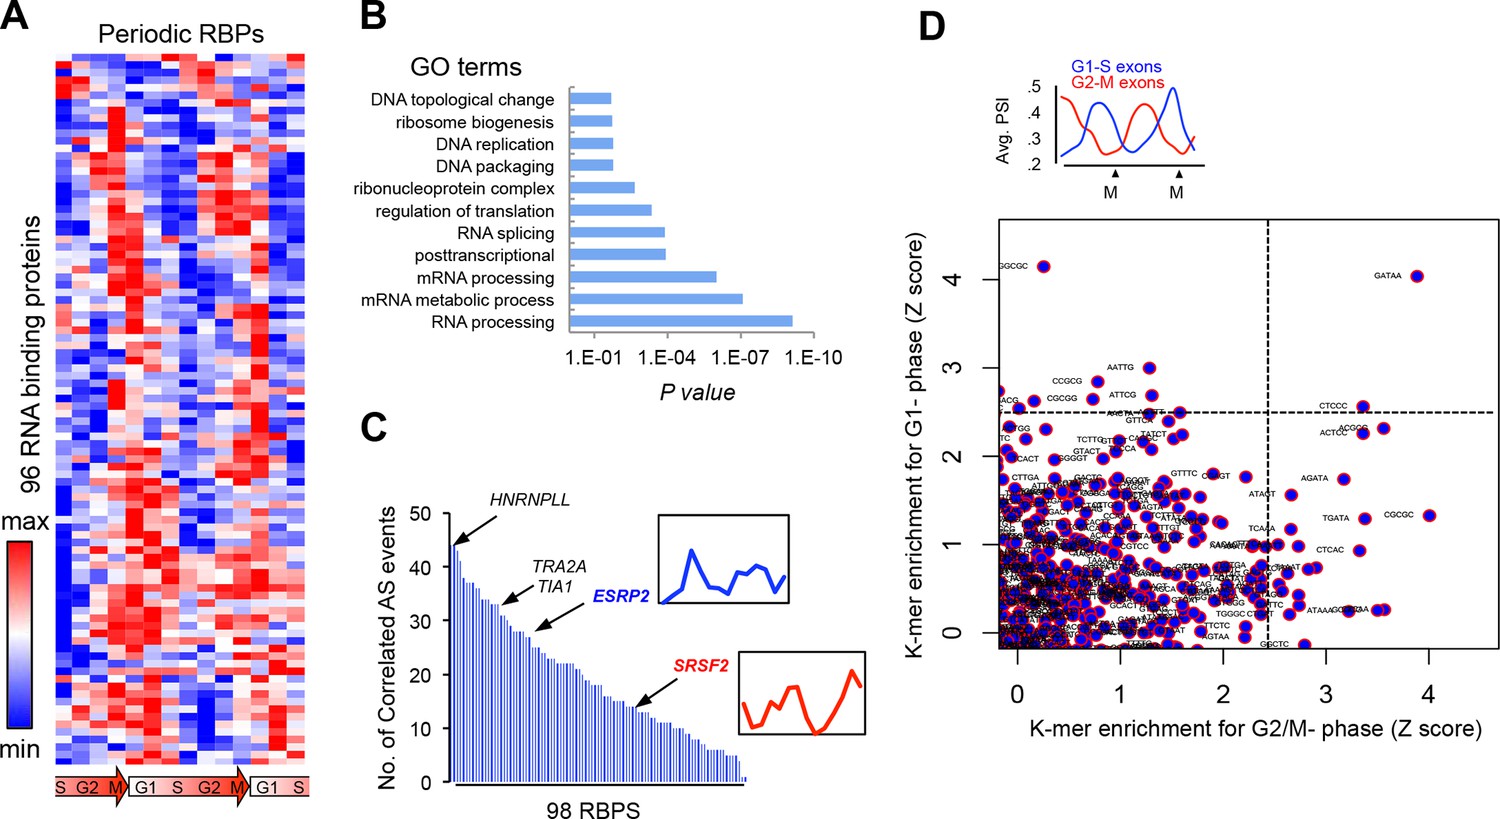
Periodic expression of RBPs.
(A) Heat map representation of RNA-bound proteins (RBPs) with periodic expression. Row-normalized FPKM levels are shown. (B) GO analyses for the functional enrichment in the periodic RBPs. (C) Number of periodic AS events that significantly correlate (Spearman’s Rho > |.75|, p<.05) with the expression pattern of each RBP during cell cycle. Expression pattern of known two known splicing factors, SRSF2 and ESRP2, is shown in inset. (D) Average PSI values of periodic that peak at either G1 (red line) or M phase (blue line) (top panel). k-mer enrichment in periodic exons as judged by Z score and separated by cell cycle phase (y-axis = G1-S and x-axis = G2-M) (bottom panel).
Figure 2—figure supplement 2
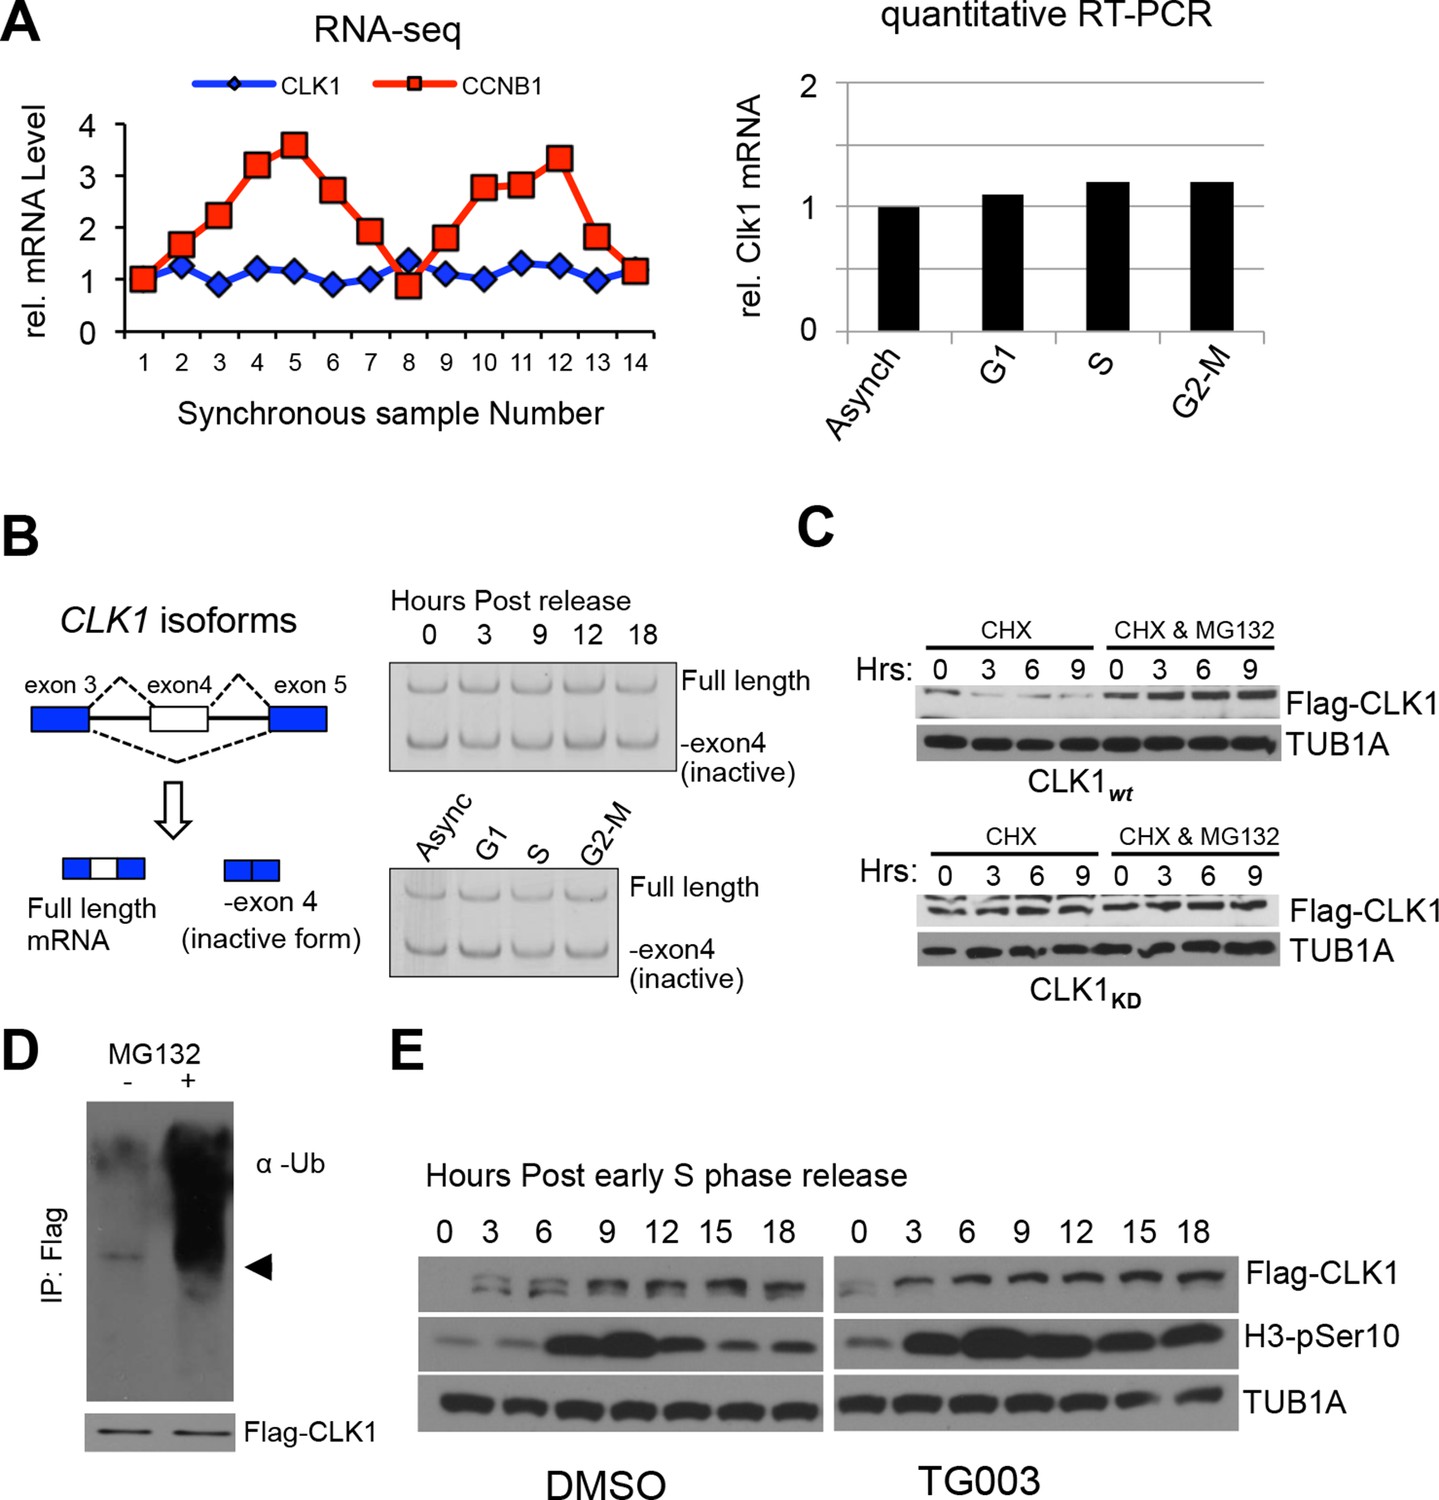
Regulation of CLK1 proteins levels during the cell cycle is degradation-dependent.
(A) CLK1 mRNAs as measured in synchronized cells by RNA-Seq (left) or in cells arrested at each cell cycle phase, followed by quantitative RT-PCR (right). (B) Diagram depicting alternative the splicing pattern for CLK1 pre-mRNA (left). The short form represents skipping of exon 4 that introduces a premature stop codon and is targeted by the non-sense mediated decay pathway, while long form represents the full-length active isoform. Right panels show levels of CLK1 variants, as measured by semi-quantitative RT-PCR with primers that simultaneously detect both forms, in cells upon early S phase release or in cells arrested at specific stages. (C) Protein stability of CLK1 is affected by its activity. Cyclohexamide chase experiment was used to measure the stability of CLK1 in cells expressing either CLK1wt or the catalytic mutant CLK1KD. MG132 was used to block proteasomal degradation. (D) Immunoprecipitation of Flag-CLK1 from cells after 3 hrs of MG132 treatment and subsequent detection of polyubiquitination by immonoblotting. The arrow indicates the expected position of unmodified CLK1. Bottom panel shows FLAG-CLK1 protein. (E) HeLa cells stably expressing Flag-CLK1 were synchronized by double thymidine block in the presence or absence of TG003. Phosphorylated histone 3B was detected as cell cycle marker.
Figure 3 with 1 supplement
CLK1 regulates a network of genes that control cell cycle progression.
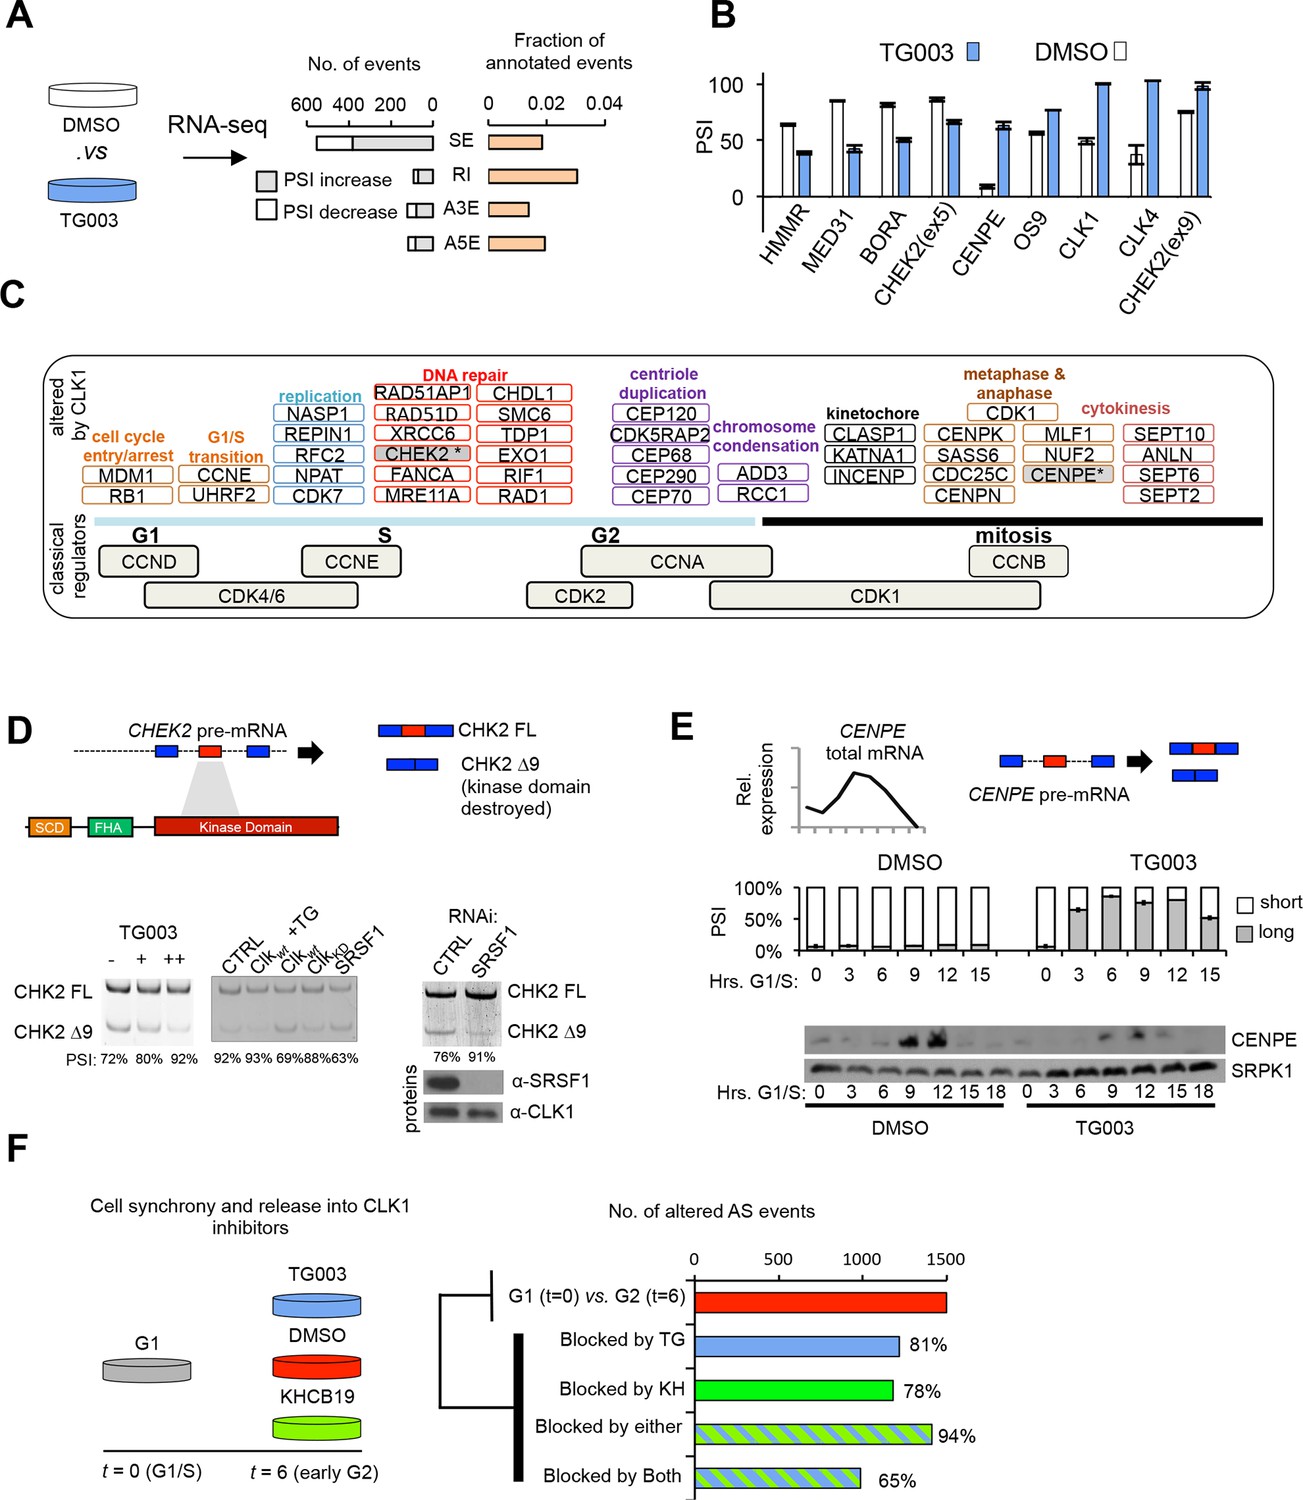
(A) Identification of endogenous CLK1 targets by RNA-Seq. Numbers of different AS types affected by treatment with the CLK1 inhibitor TG003 (left graph). SE, skipped exon; RI, retained intron; A3E, alternative 3’ exon; A5E, alternative 5’ exon. Fraction of total analyzed events that were affected by TG003 treatment (right graph). (B) Validation of TG003-responsive AS events by semi-quantitative RT-PCR. The bar graph shows the max-delta PSI for each AS event tested in a 24-hr time course of inhibition with 20μM TG003. (C) Representation of cell cycle control genes with CLK1-dependent AS events, organized by cell cycle phase and function. (D) Schematic representation of CHEK2 alternative splicing, showing that exon 9 encodes a region overlapping the kinase domain (upper panel). Semi-quantitative RT-PCR assessment of CHEK2 isoforms after treatment with TG003 or over-expression of the indicated factors (lower left panel). RNAi of SRSF1 in cells and subsequent analysis of CHEK2 splicing by semi-quantitative RT-PCR (lower right panel). PSI values are shown below gel. (E) Normalized CENPE total mRNA expression during an unperturbed cell cycle (triangle denotes mitosis, left panel) and diagram of CENPE splicing (right). TG003-treatment of HeLa cells released from G1/S arrest followed by semi-quantitative RT-PCR analysis of CENPE isoforms (bar graph). (F) Schematic of RNA-Seq analysis of CLK1 inhibition during cell cycle (left). AS events that were identified as being differentially regulated between G1 and G2 phase (top bar of bar graph) and number of events that were blocked by the indicated conditions (bottom 4 bars).
Figure 3—figure supplement 1
CLK1 regulates a network of genes that control cell cycle progression.
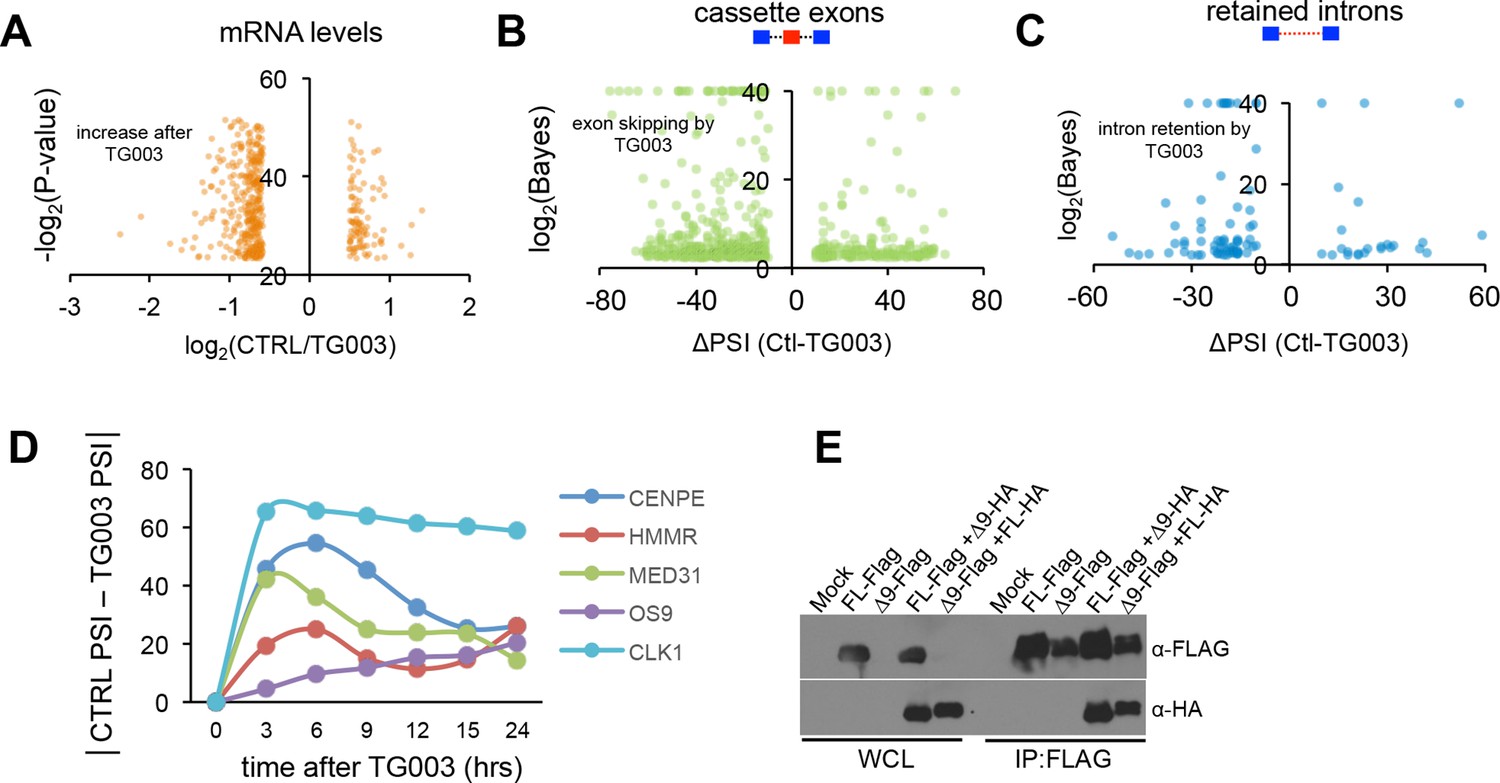
(A) Identification of endogenous CLK1 targets by RNA-Seq. Cells were treated with 10 μM TG003 for 18 hr and poly-A+ RNA was sequenced. Genes significantly up-regulated or down-regulated upon CLK1 inhibition (log(FPKM) are plotted, all plotted genes meet p<10-7). (B) Scatter plot representation of cassette exon inclusion after TG003 treatment by MISO analysis. Log Bayes factor values are shown on y-axis and delta PSI on x-axis. (C) Scatter plot representation of retained intron levels after TG003 treatment. Log Bayes factor values are shown on y-axis and delta PSI on x-axis. (C) Time course experiment after TG003 treatment. Cells were collected at the indicated time points and the absolute delta PSI is plotted. (E) Immonoblot analysis of reciprocal co-immunoprecipation experiments between CHEK2 isoforms as indicated.
Figure 4 with 2 supplements
CLK1 is required for cell cycle progression and proliferation.
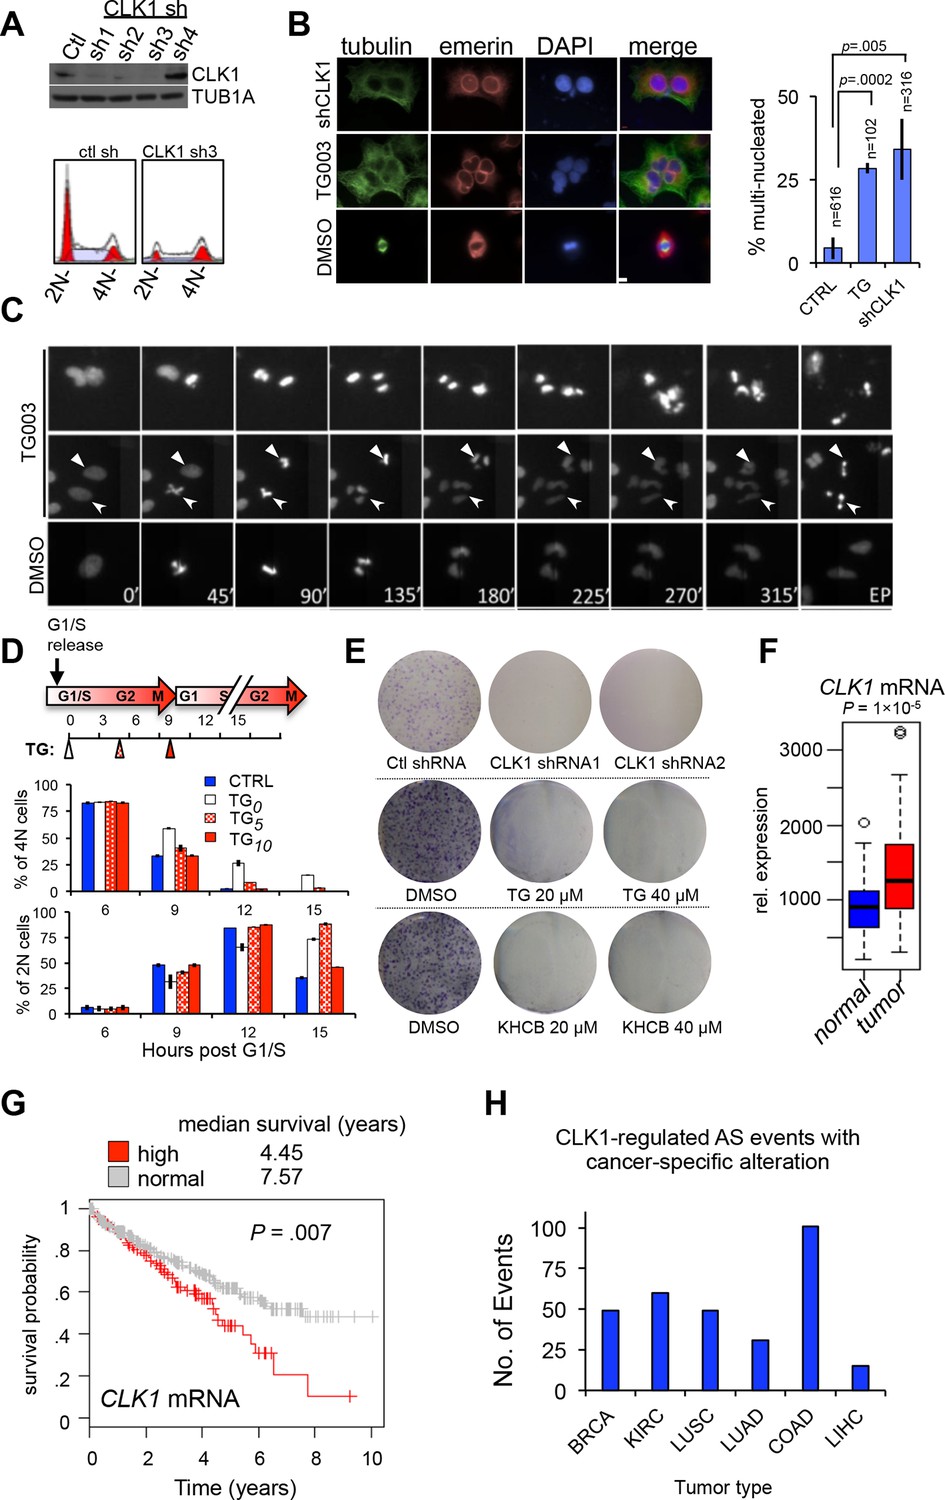
(A) Immunoblot analysis of CLK1 proteins after stable shRNA knockdown in HeLa cells. Bottom, DNA content as measured by propidium iodide staining following flow cytometry. (B) Immunofluorescence microscopy of A549 cells depleted of CLK1 by shRNA (top row), cells treated with 10 µM TG003 for 12 hr (middle row), and a control treatment with DMSO (bottom row); green: tubulin, red: emerin (nuclear envelope), and blue: DAPI. Scale bar 10 µm. Right bar graph shows the quantification of multinucleated cells. p values determined using Student’s t-test. (C) Static frames from a live-cell high-content imaging movie of HeLa cells expressing Histone H2B-GFP and treated with TG003 (top panel). Time after start of the experiment is indicated; EP, end point (~960 min). TG003 treated cells with apparent cell division defects (indicated by arrowheads in the bottom field) are shown in two independent fields. (D) Synchronized HeLa cells were treated with 20 µM TG003 at the indicated time points (0, 5, and 10 hr) and analyzed by propidium iodide staining and flow cytometry to measure DNA content. Percent of 2N (lower bar graph) and 4N (upper bar graph) cells were quantified at each time point as indicated in the treatment scheme (top). (E) Colony formation assay of HeLa cells depleted of CLK1 by shRNA, or continuously treated with TG003 or KHCB-19 at the indicated concentrations. (F) Box plot representation of CLK1 mRNA expression levels in paired normal and tumorous kidney tissue. 72 cases were analyzed. (G) Kaplan-Meier plot showing survival differences between patients with kidney tumors with high CLK1 (red, upper quartile) or reduced CLK1 (blue, lower three quartiles) expression. (H) Number of cancer-associated AS events that are also regulated by CLK1 in different tumor types. BRCA, Breast invasive carcinoma; COAD, Colorectal adenocarcinoma; KIRC, Kidney renal clear cell carcinoma; LUAD, Lung adenocarcinoma; LUSC, Lung squamous cell carcinoma; LIHC, liver hepatocellular carcinoma.
Figure 4—figure supplement 1
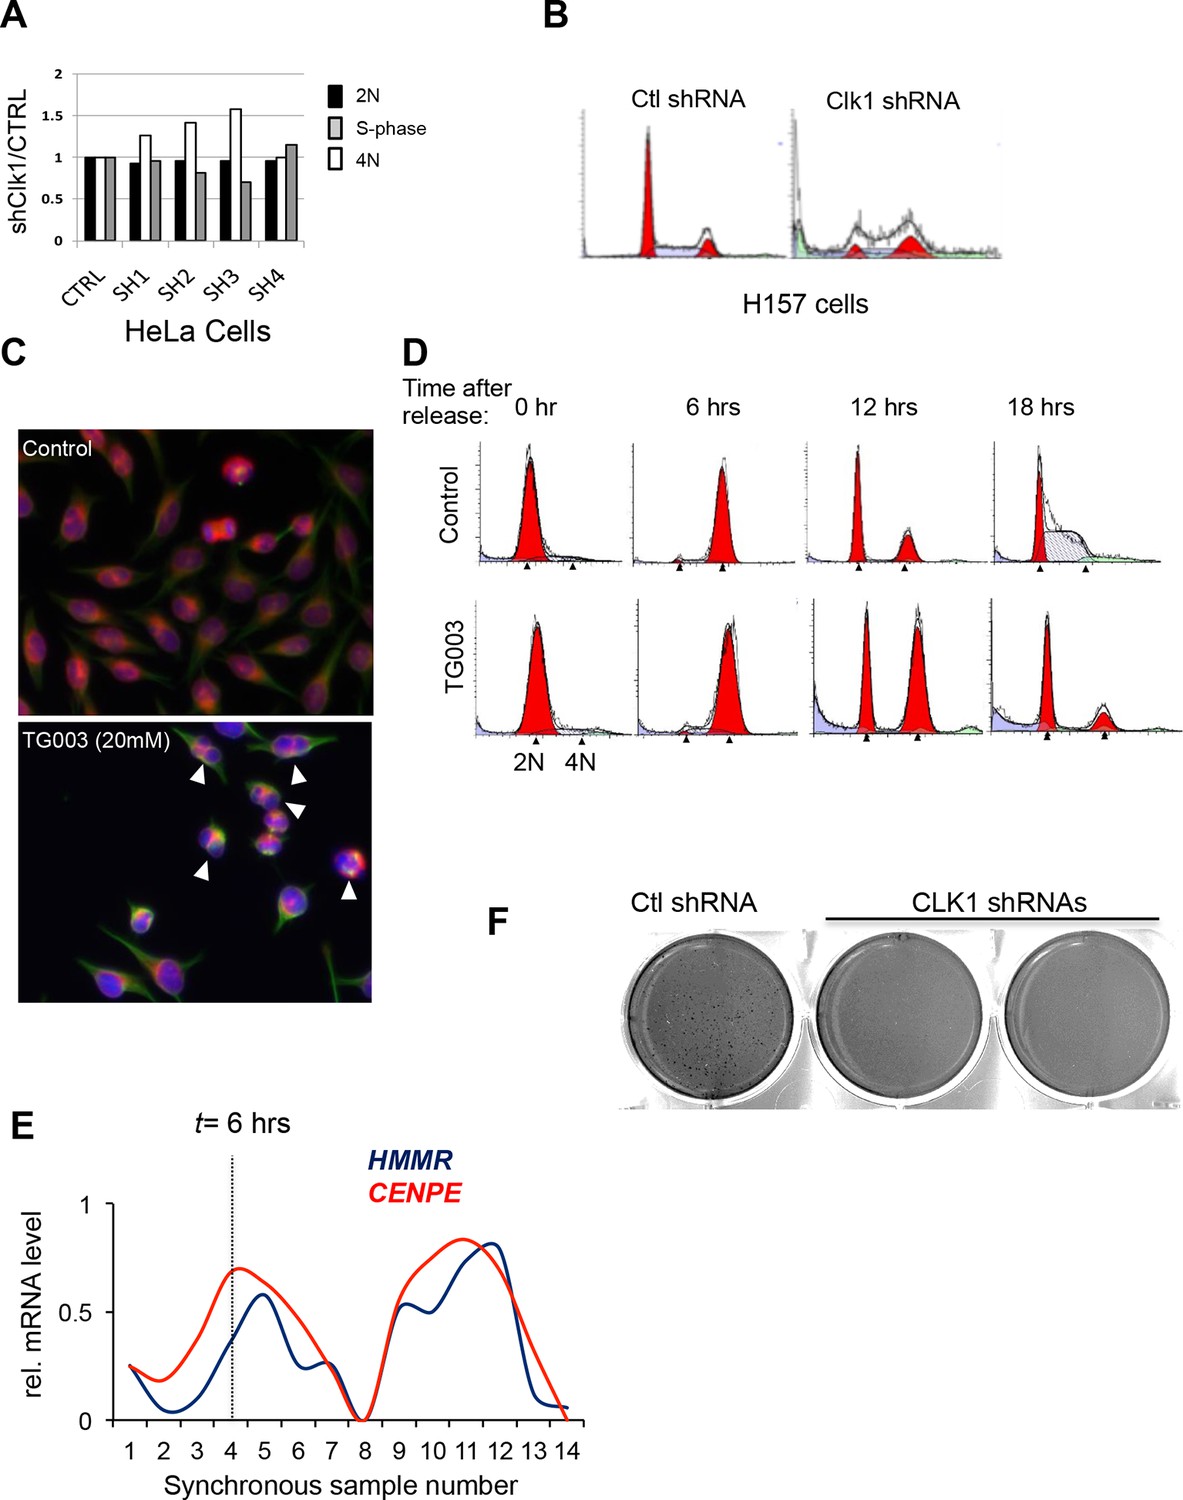
Loss of CLK1 results in cell cycle defects in multiple cell types.
(A) Cell cycle composition as measured by propidium iodide staining of DNA and flow cytometry analysis of cells that have been depleted of CLK1 by the indicated shRNAs. (B) Representative histograms of propidium iodide stained H157cells to determine cell cycle defect after RNAi of CLK1. (C) HeLa cells treated with TG003 also have defective cell division. Immunofluorescence microscopy was used to detect multi-nucleated cells, and a representative field is shown (green:tubulin, red:emerin, blue:DAPI). (D) Representative histograms of DNA content in synchronous HeLa cells treated with TG003. The time after early S phase release (when TG003 was added) is indicated, These data are associated with Figure 4 of the main text. (E) Representative image from anchorage-independent growth assays (soft agar assay) of HeLa cells after depletion of CLK1. (F) Relative mRNA expression levels of CENPE and HMMR during cell cycle. Data obtained from RNA-Seq analysis. Dashed line represents 6 hr after release from G1/S.
Figure 4—figure supplement 2
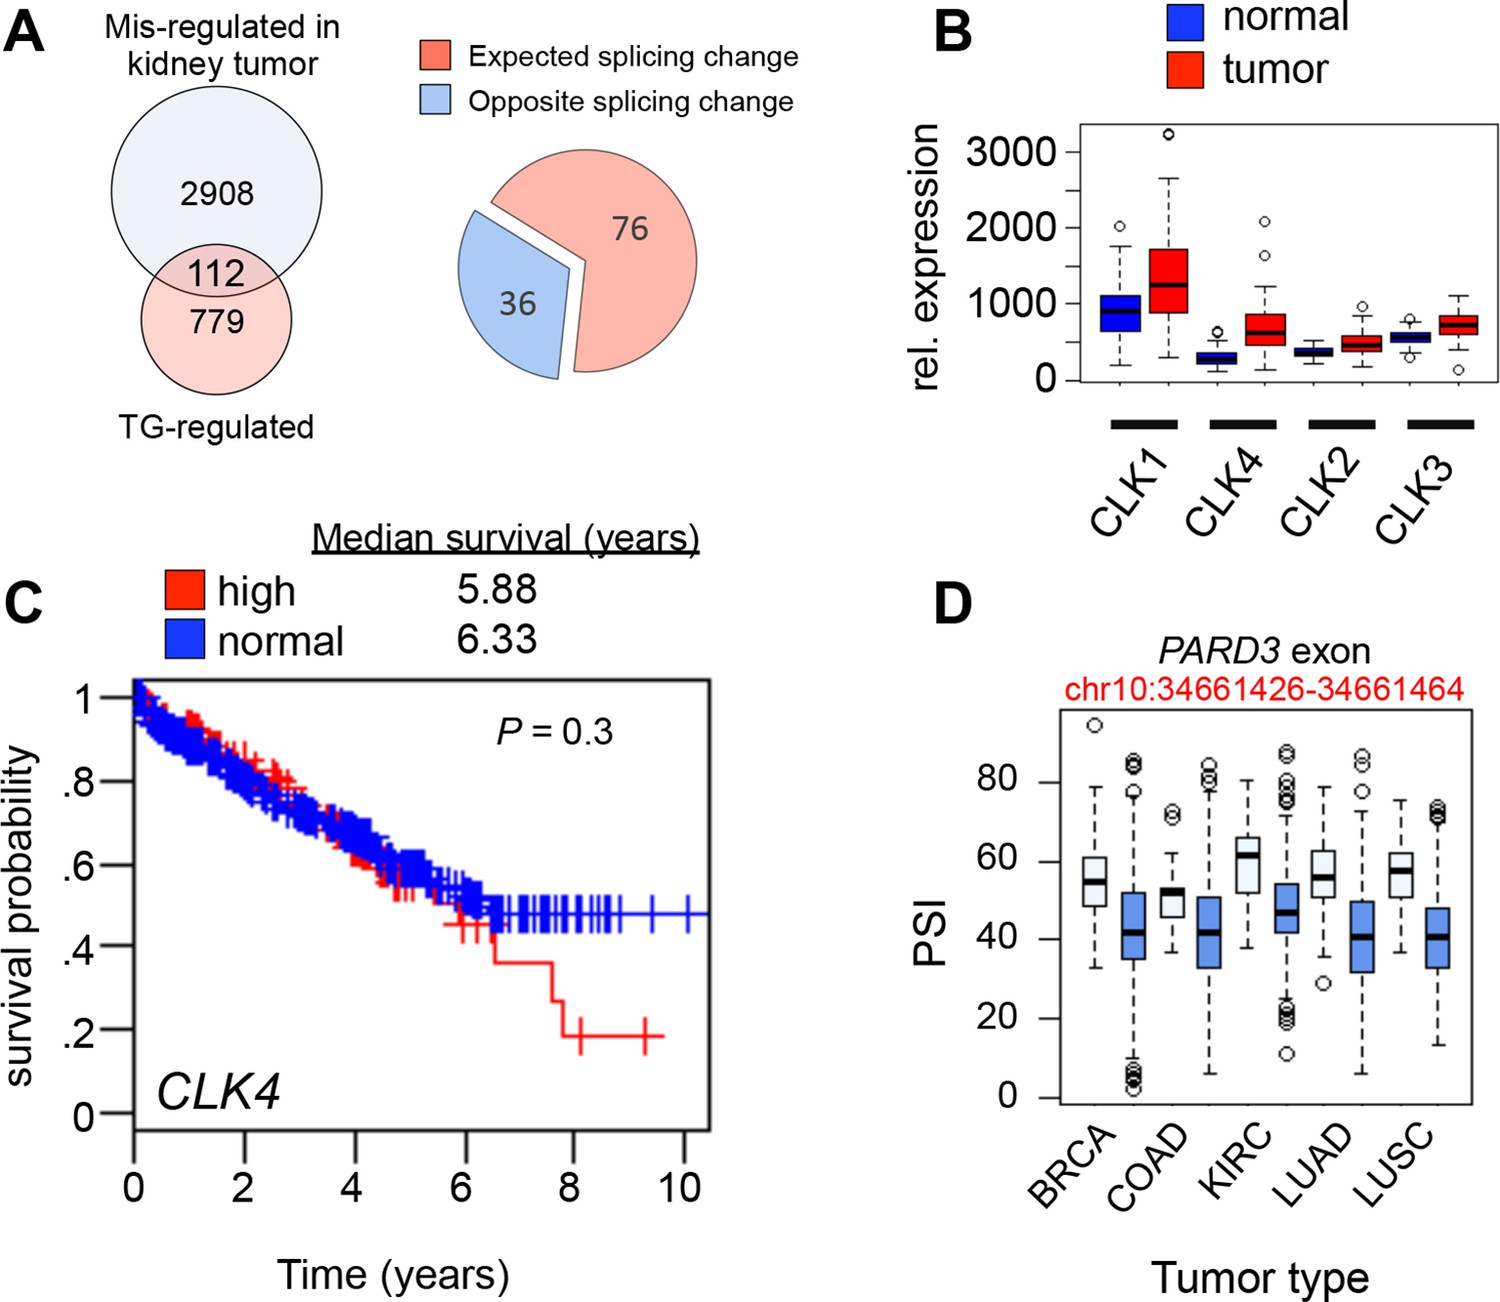
CLK1 mis-regulation in human cancer.
(A) Overlap of AS events that were altered in kidney cancers (as compared to normal kidney samples) and AS that was altered in asynchronous cells treated with TG003 (left panel). Pie chart denoting if AS in cancer occurred in the expected direction, that is, normal kidney resembled TG003 treatment while tumor kidney resembled untreated cells (see methods). (B) Boxplot representation of CLK1, CLK2, CLK3 and CLK4 mRNA levels in 72 paired normal vs. cancer kidney cancer (cRCC) samples. Kolmogorov-Smirnov test significance for each factors is as follows CLK1: p=3 × 10⁻⁵, CLK2: p=1.2 × 10⁻⁷, CLK3: p=2.8 × 10⁻¹², CLK4: p=2.2 × 10⁻¹⁶. (C) Kaplan-Meier plot of kidney (cRCC) patients with tumors expressing high CLK4 (red, upper quartile) vs. normal CLK4 (blue, 1–3 quartile). (D) PARD3 exon (chr10:34661426–34661464) PSI levels in five cancer cases are shown as an example of TG003-sensitive AS which is altered between normal and cancer tissues.
Author response image 1
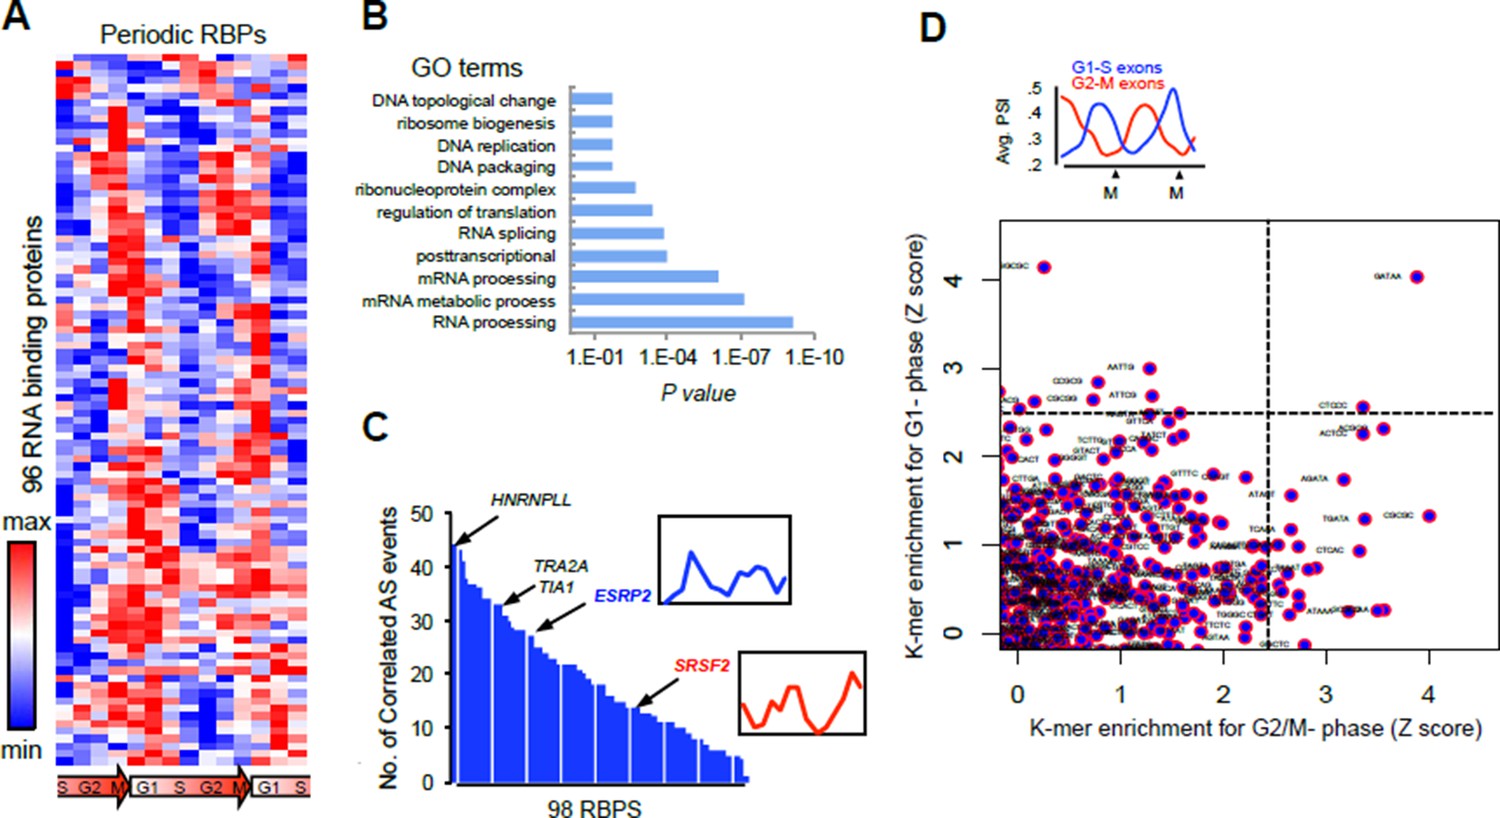
(A) Heat map representation of RNA-bound proteins (RBPs) with periodic expression.
Row-normalized FPKM levels are shown. (B) GO analyses for the functional enrichment in the periodic RBPs. (C) Number of periodic AS events that significantly correlate (Spearman’s Rho > [.75], P <..05) with the expression pattern of each RBP during cell cycle. Expression pattern of two known splicing factors, SRSF2 and ESRP2, is shown in inset. (D) Average PSI values of periodic that peak at either G1 (red line) or M phase (blue line) (top panel). k- mer enrichment in periodic exons as judged by Z score and separated by cell cycle phase (y-axis = G1-S and x-axis = G2-M) (bottom panel).
Author response image 2

AURKB splicing isoform with retained intron that contains a pre-mature stop codon is indeed a NMD target.
The inhibition of NMD causes accumulation of the intron-containing isoform.
Author response image 3
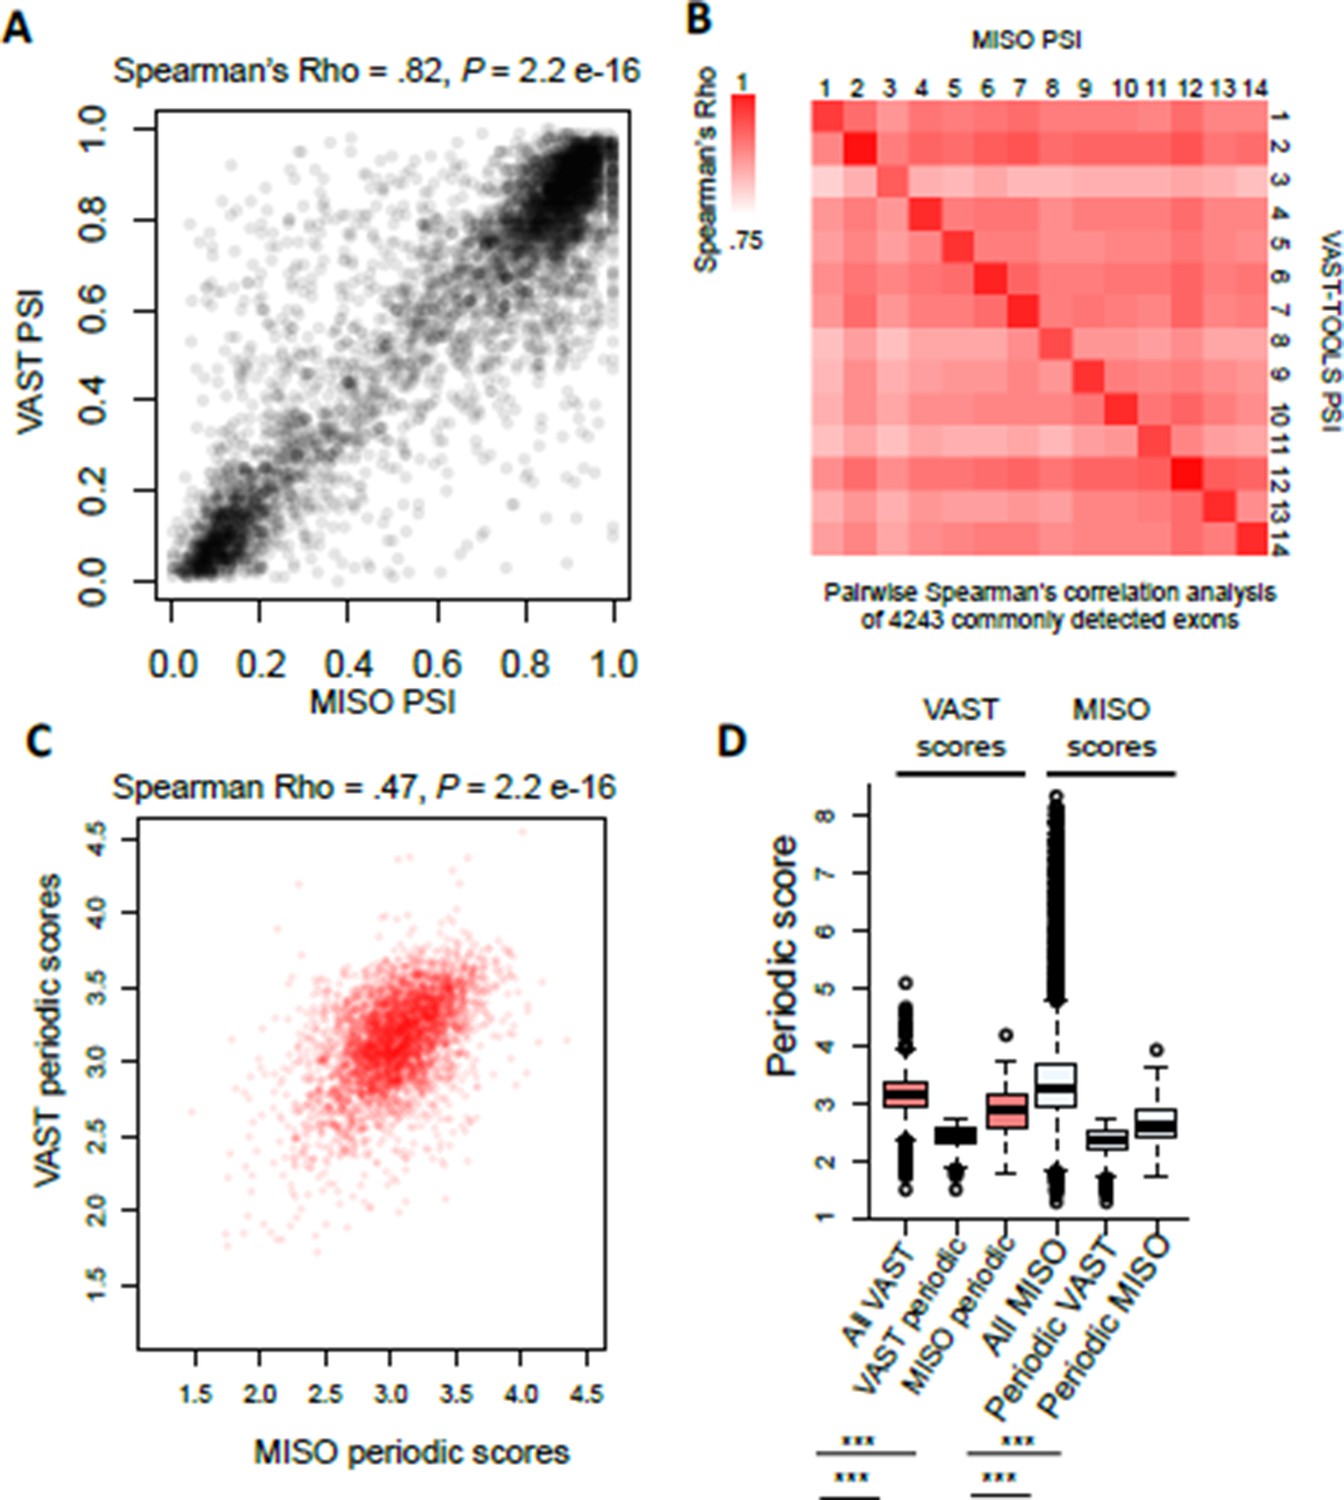
(A) Scatter plot representation of raw PSI values called by VAST- TOOLS and MISO pipelines.
(B) Heat map representation of possible pair-wise correlation between commonly detected exons by VAST-TOOLS and MISO. Note scale ranges from Spearman’s Rho 0.75-1.0. (C) Scatter plot representation of periodic scores of AS events detected by MISO and VAST- TOOLS pipelines. Spearman’s Rho is shown above with a P value of > 2.2e-16. (D) Boxplot representation of periodic scores measured by VAST-TOOLS or MISO for events detected for events detected as periodic by the different pipelines (statistical significance was measured by Kolmogorov–Smirnov test, *** = 1e-16).
Author response image 4
Different version of the heat map representation of periodically spliced events.
Raw PSI values are shown. Diagram below indicates cell cycle phase. The types of AS events were also indicated.
Author response image 5
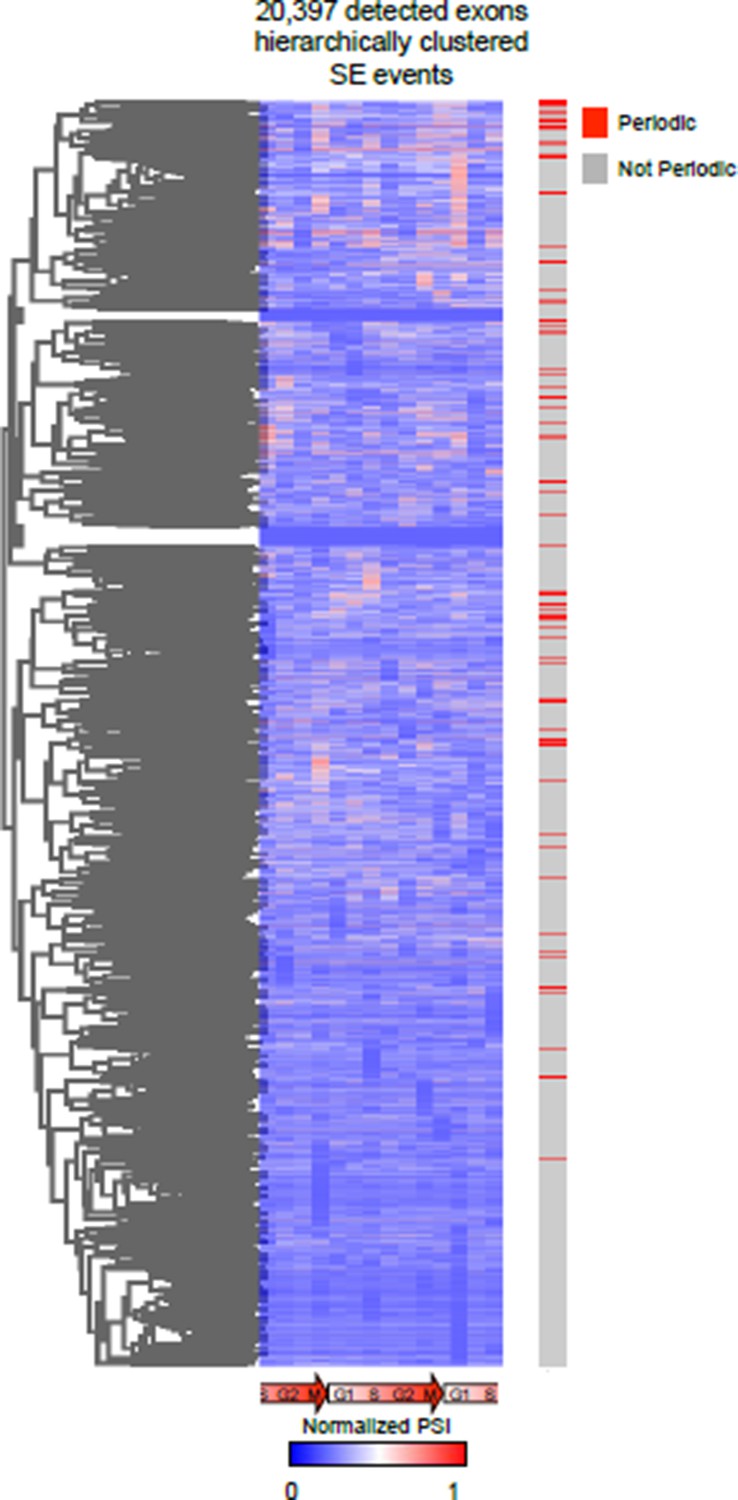
Unbiased hierarchical cluster of the PSI values of all AS events during cell cycle.
https://doi.org/10.7554/eLife.10288.026Videos
Video 1
Live-cell imaging of control HeLa cells stably expressing a GFP-H2B.
Cells were synchronized by single-thymidine block and released and imaged at 10X magnification (every ~15 min) for 960 min.
Video 2
Live-cell imaging of control HeLa cells stably expressing GFP-H2B.
Cells were synchronized by single-thymidine block and released into 1 μM of TG003 and imaged at 10X magnification (every ~15 min) for 960 min.
Video 3
Zoom of live-cell imaging of control HeLa cells.
Data associated with Figure 4D.
Video 4
Zoom of live-cell imaging of TG003-treated HeLa cells.
Data associated with Figure 4.
Video 5
Zoom of live-cell imaging of TG003-treated HeLa cells.
Data associated with Figure 4.
Additional files
-
Supplementary file 1
Periodic splicing events identified during the HeLa cell cycle and associated GO terms.
Data associated with Figure 1.
- https://doi.org/10.7554/eLife.10288.018
-
Supplementary file 2
AS events altered by CLK1 inhibition (TG003 10 μM for 16 hr) in 293T cells and associated GO terms.
Data associated with Figure 3.
- https://doi.org/10.7554/eLife.10288.019
-
Supplementary file 3
AS events altered by CLK1 inhibition (TG003 10 μM, KHCB19 10 μM) in synchronized HeLa cells.
Data associated with Figure 3.
- https://doi.org/10.7554/eLife.10288.020
-
Supplementary file 4
List of PCR primers, shRNA sequences and antibodies used in this study.
- https://doi.org/10.7554/eLife.10288.021
Download links
A two-part list of links to download the article, or parts of the article, in various formats.
Downloads (link to download the article as PDF)
Open citations (links to open the citations from this article in various online reference manager services)
Cite this article (links to download the citations from this article in formats compatible with various reference manager tools)
An extensive program of periodic alternative splicing linked to cell cycle progression
eLife 5:e10288.
https://doi.org/10.7554/eLife.10288


