Acetylcholine modulates prefrontal outcome coding during threat learning under uncertainty
- Department of Psychology, University of Toronto, Canada
- Collaborative Program in Neuroscience, University of Toronto, Canada
- Human Biology Program, University of Toronto, Canada
- Department of Cell and Systems Biology, University of Toronto, Canada
Figures
Figure 1 with 2 supplements
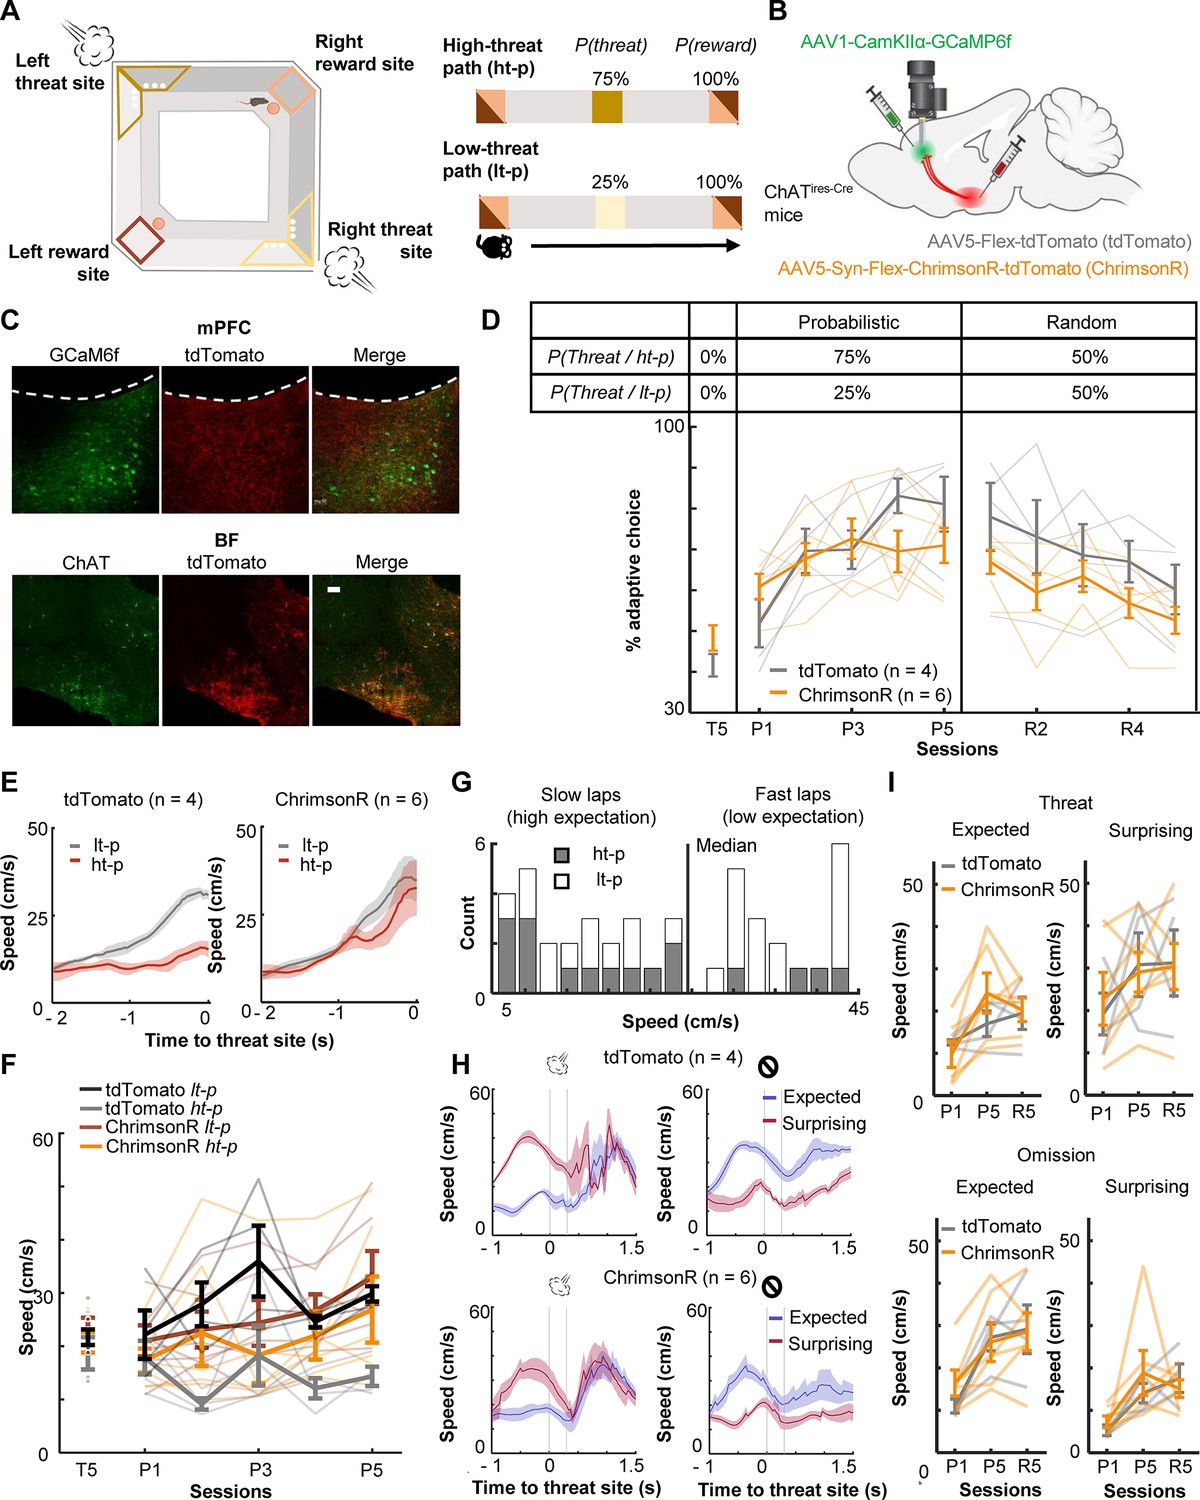
Optogenetic stimulation of basal forebrain–medial prefrontal cortex (BF–mPFC) cholinergic projections during threats impairs discrimination of two probabilistic outcome contingencies.
(A) The maze used in the probabilistic spatial learning task (left). The probability of threat and reward assigned to each of two paths connecting two reward sites (right). Mice received air puffs 75% of the time on one of the paths (high-threat path) and 25% of the time on the other path (low-threat path). The color of the squares indicates the locations on the maze as specified in the illustration on the left. (B) The site of GRIN lens implantation and viral vector infusion. (C) Images showing ChrimsonR-tdTomato expressing cholinergic terminals (red) near the GCaMP6f-expressing neurons (green) in the mPFC (top). Images showing colocalization of ChAT and virally infected cells expressing tdTomato in the BF (bottom). The scale bar represents 100 µm. (D) The proportion of laps in which mice chose the low-threat path (% adaptive path choice, one thin line/mouse, mean ± SEM). The table on top indicates the assigned threat probability for each path. Adaptive path choice in the pre-training (T5) and random stage (R1–5) was defined as choosing the path that was the low-threat path during the probabilistic stage (P1–5). (E) The movement speed of mice while they ran toward the threat sites in P5 (mean ± SEM). (F) The approaching speed toward the threat sites on two paths (one thin line/mouse, mean ± SEM). The speed was averaged over a 500-ms window before the threat site entry. (G) The distribution of the speed approaching the threat site in all laps in P5 in a representative mouse. Laps with the approaching speed below or above the median were categorized as ‘slow’ and ‘fast’ laps, respectively. Laps on the high-threat path (gray) were likely to be slow laps, while laps on the low-threat path (white) were likely to be fast laps, consistent with differential threat expectations between the paths. (H) The movement speed around the threat sites in fast and slow laps in P5 (mean ± SEM). The speed in fast laps with threats and slow laps with omissions showed the mice’s reaction to surprising outcomes (red). Conversely, the speed in slow laps with threats and fast laps with omissions showed their reaction to expected outcomes (blue). (I) The averaged speed during a 500-ms window starting from the threat site entry (one thin line/mouse, mean ± SEM). Laps were categorized into the combination of the approaching speed (fast or slow) and outcomes (threat or omission) and labeled as ‘expected’ and ‘surprising’ as defined in H.
-
Figure 1—source data 1
The proportion of laps in which mice chose the low-threat path (% adaptive path choice).
Data for panel D.
- https://cdn.elifesciences.org/articles/102986/elife-102986-fig1-data1-v1.xlsx
-
Figure 1—source data 2
The approaching speed toward the threat sites on two paths.
The speed was averaged over a 500-ms window before the threat site entry. Data for panel F.
- https://cdn.elifesciences.org/articles/102986/elife-102986-fig1-data2-v1.xlsx
Figure 1—figure supplement 1
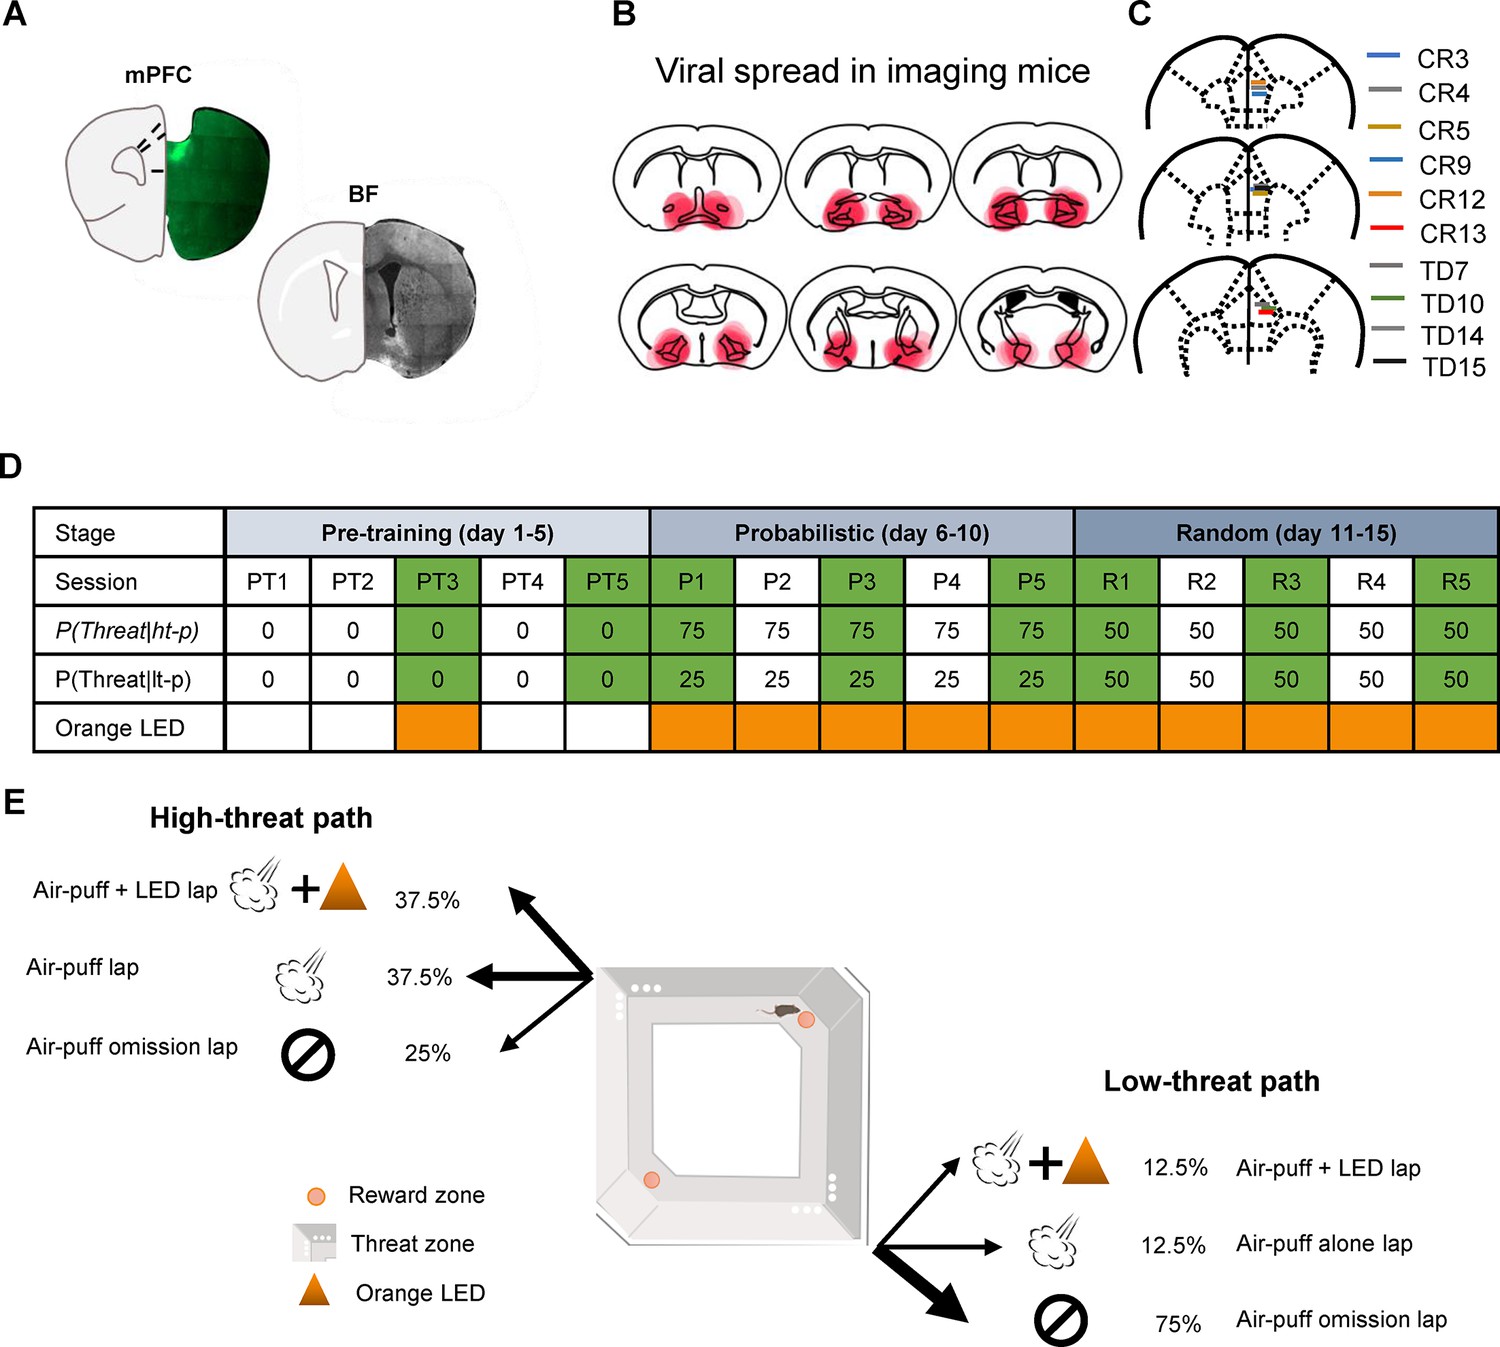
Histological verifications and experimental design of the calcium imaging with optogenetic manipulation.
(A) Images showing viral spread (green) and GRIN lens location in the medial prefrontal cortex (mPFC) and viral spread (white) in the basal forebrain (BF). (B) Schematic representations of virus spread in the BF. Each red translucent area indicates the spread in each mouse infused with AAV5-Syn-Flex-ChrimsonR-tdTomato. (C) GRIN lens location in the prelimbic region of mice expressing ChrimsonR-tdTomato (CR) and tdTomato alone (TD). (D) Task schedule of the imaging experiment. The green color indicates the day on which calcium imaging was conducted. The orange color indicates the day on which LED stimulation was applied to the imaging window during a subset of air-puff delivery. (E) Schematic representation of three lap types. On both paths, ~50% of air-puff delivery was accompanied by LED stimulation.
Figure 1—figure supplement 2
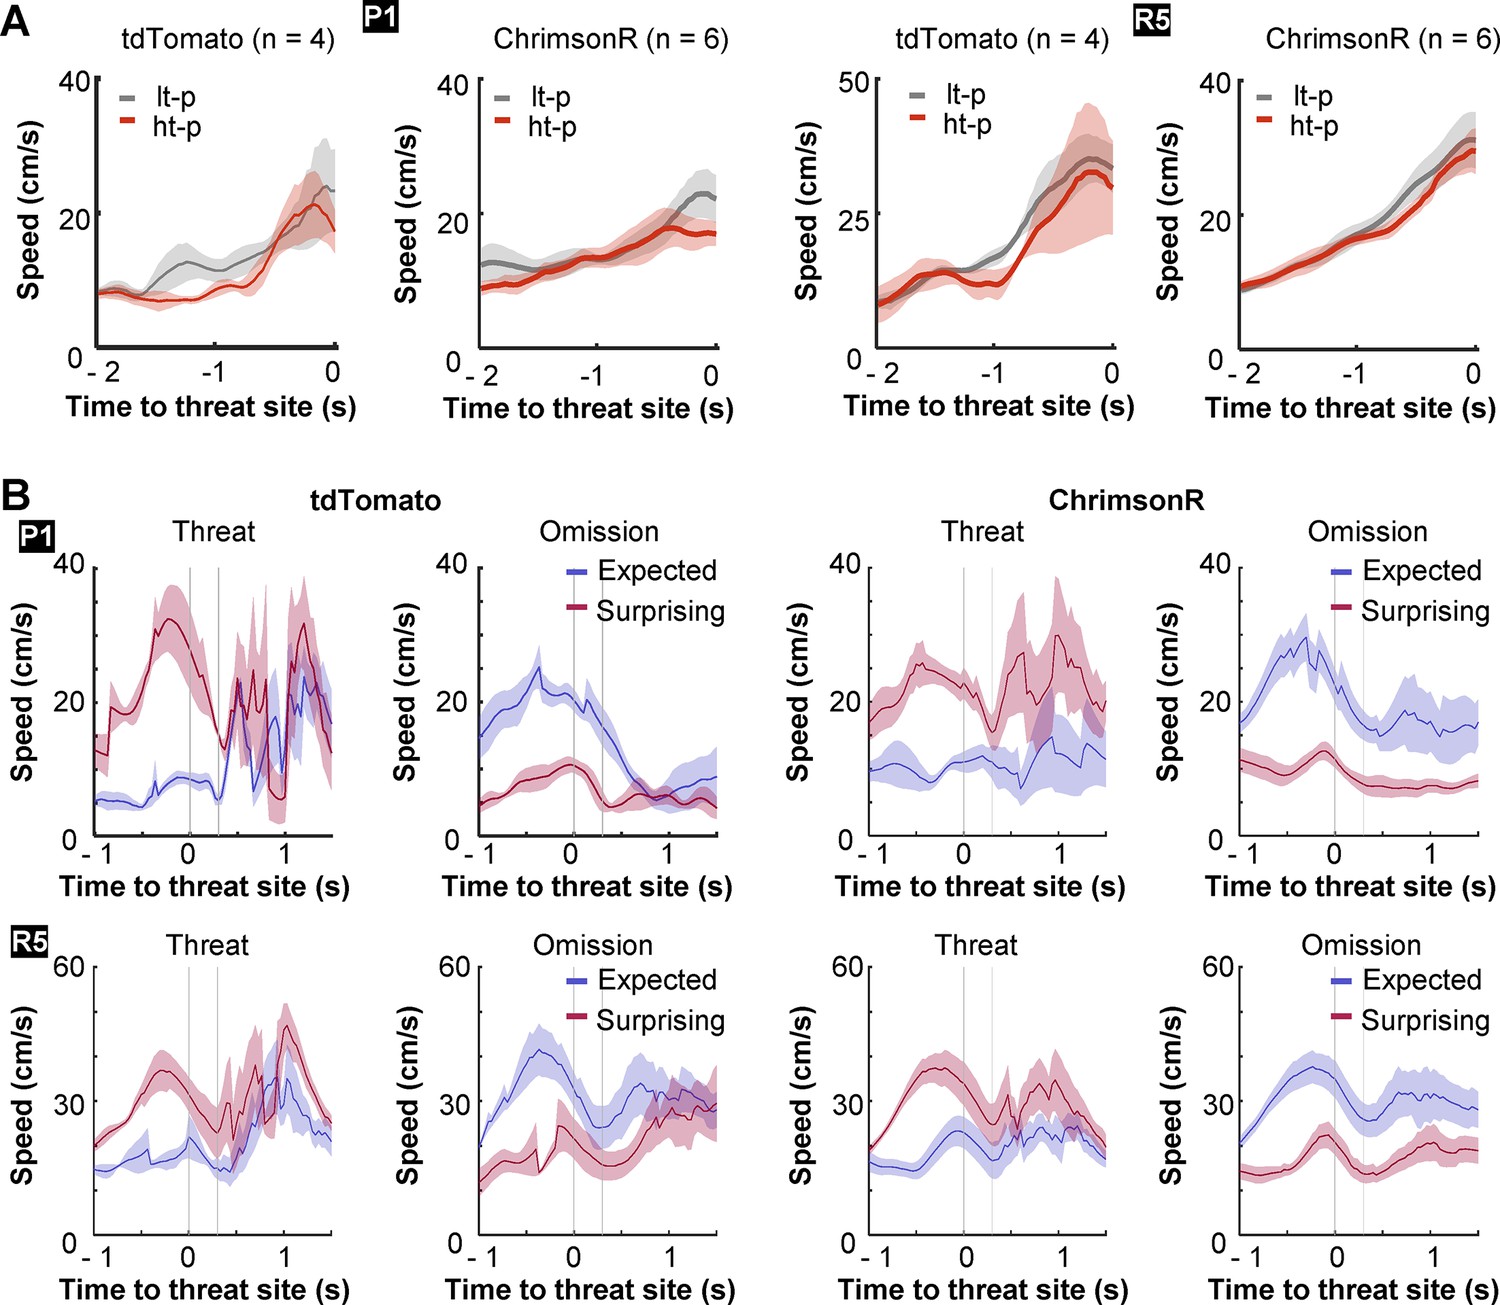
Differentiation of movement speed depending on threat probabilities and expectations.
(A) The movement speed of mice while they approached the threat sites in the first session of the probabilistic stage (P1) and the last session of the random stage (R5). The running speed was averaged separately for the high-threat path with a 75% chance of air-puff delivery (ht-p) and the other low-threat path with a 25% chance of air-puff delivery (lt-p). Neither group differentiated the speed toward the threat site between the two paths in these sessions. Lines indicate the mean, and shaded areas indicate SEM. (B) Expectation-dependent differentiation of reactions to outcomes in P1 and R5. Laps were categorized into two types, fast and slow laps, based on the speed toward the threat sites (median split in each session). In each type, laps were further categorized into two types depending on whether mice received an air puff (threat) or not (omission). Fast laps with threats and slow laps with omissions were used to examine mice’s reaction to surprising outcomes (red). Conversely, slow laps with threats and fast laps with omissions were used to examine their reaction to expected outcomes (blue). In R5, both groups moved faster after surprising threats than expected threats. In parallel, they took longer to accelerate after surprising omissions than expected omissions. Such differentiation was present only weakly in P1. Lines indicate the mean, and shaded areas indicate SEM.
Figure 2 with 1 supplement
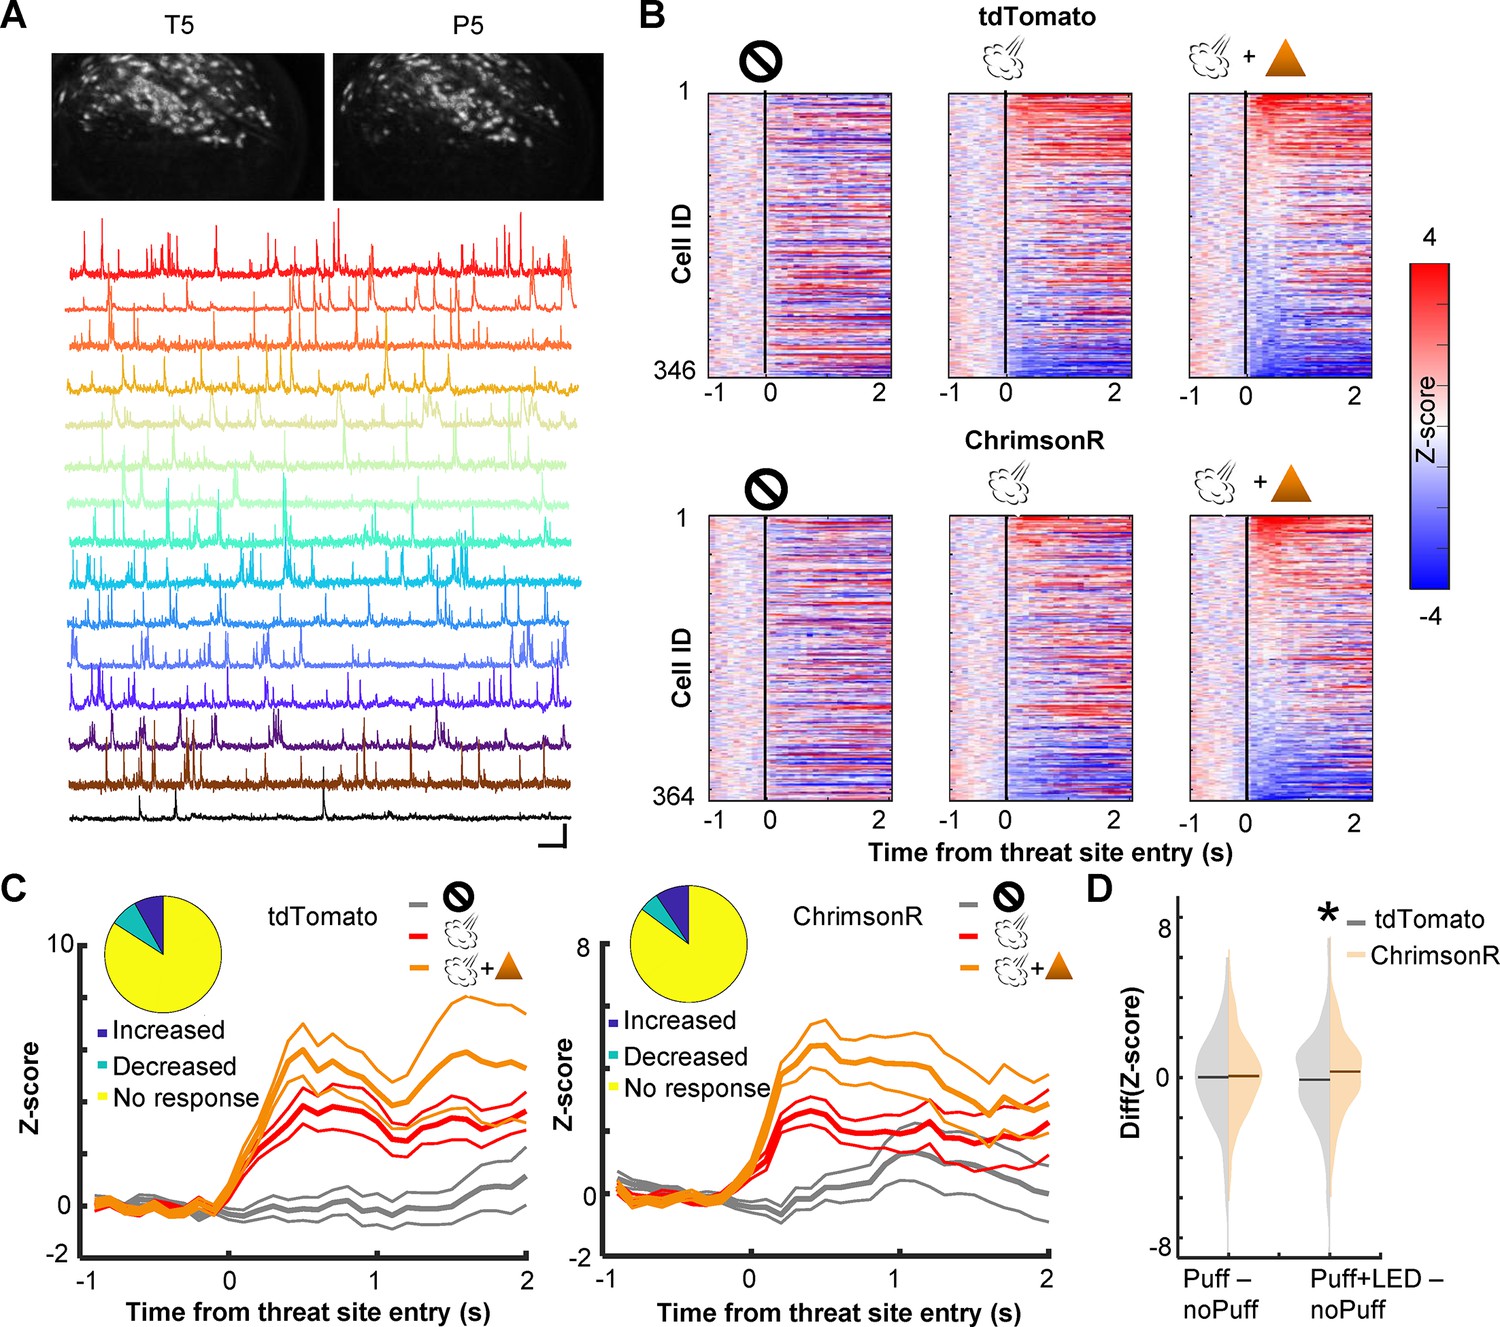
Cholinergic terminal stimulation augments PL cell activity in response to threats.
(A) Field of views in a representative mouse from the last pre-training session (T5) and the fifth probabilistic session (P5; top). White contours represent registered cells of the corresponding session. Calcium traces of extracted cells (bottom). Scale bars represent 50 s × 5 z-score. (B) Pseudocolor plots showing the z-normalized cell activity aligned to the threat site entry during puff-omission (left), puff (middle), and puff and LED (right) laps. In all panels, cells were sorted by the response magnitude in puff and LED laps. (C) Z-normalized cell activity aligned to the threat site entry of threat-responding cells (mean ± SEM). (Inset) The proportion of cells with increased activity (blue) and those with decreased activity (green). (D) The distribution of the change in cell activity evoked by air puffs or air puffs and LED. Horizontal lines show the median. Z-normalized activity was averaged over a 500-ms window starting from the threat site entry in each lap type. The average activity in omission laps was subtracted from the average activity in puff laps or puff and LED laps. *p < 0.05.
Figure 2—figure supplement 1
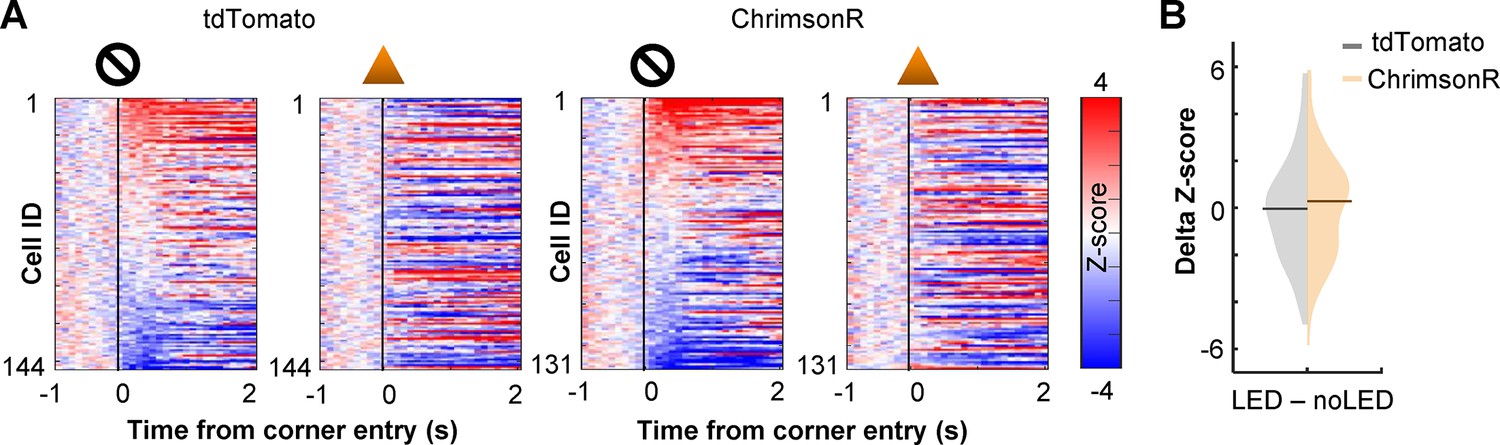
Effects of cholinergic terminal stimulation on location-selective activity of PL cells.
(A) Pseudocolor plots showing PL cell activity during one pre-training session during which mice ran on the maze without air-puff delivery. The activity was z-normalized with the mean and SD of the activity during a 1-s window before the entry to the corner of the maze that would become a threat site in subsequent days. In half of the laps, LED stimulation was applied to the imaging window upon the corner entry. The activity was normalized separately for laps with LED stimulation (right, LED) and the others without (left, noLED). Cells were sorted by the activity at the corner in noLED laps. (B) The distribution of the change in cell activity evoked by LED stimulation. Horizontal lines show the median. Z-normalized activity was averaged over a 500-ms window starting from the corner entry in each lap type. The average activity in noLED laps was subtracted from the average activity in LED laps. The degree of activity change with LED stimulation did not differ depending on the expression of ChrimsonR in cholinergic terminals (Kolmogorov–Smirnov test, p = 0.237).
Figure 3 with 1 supplement
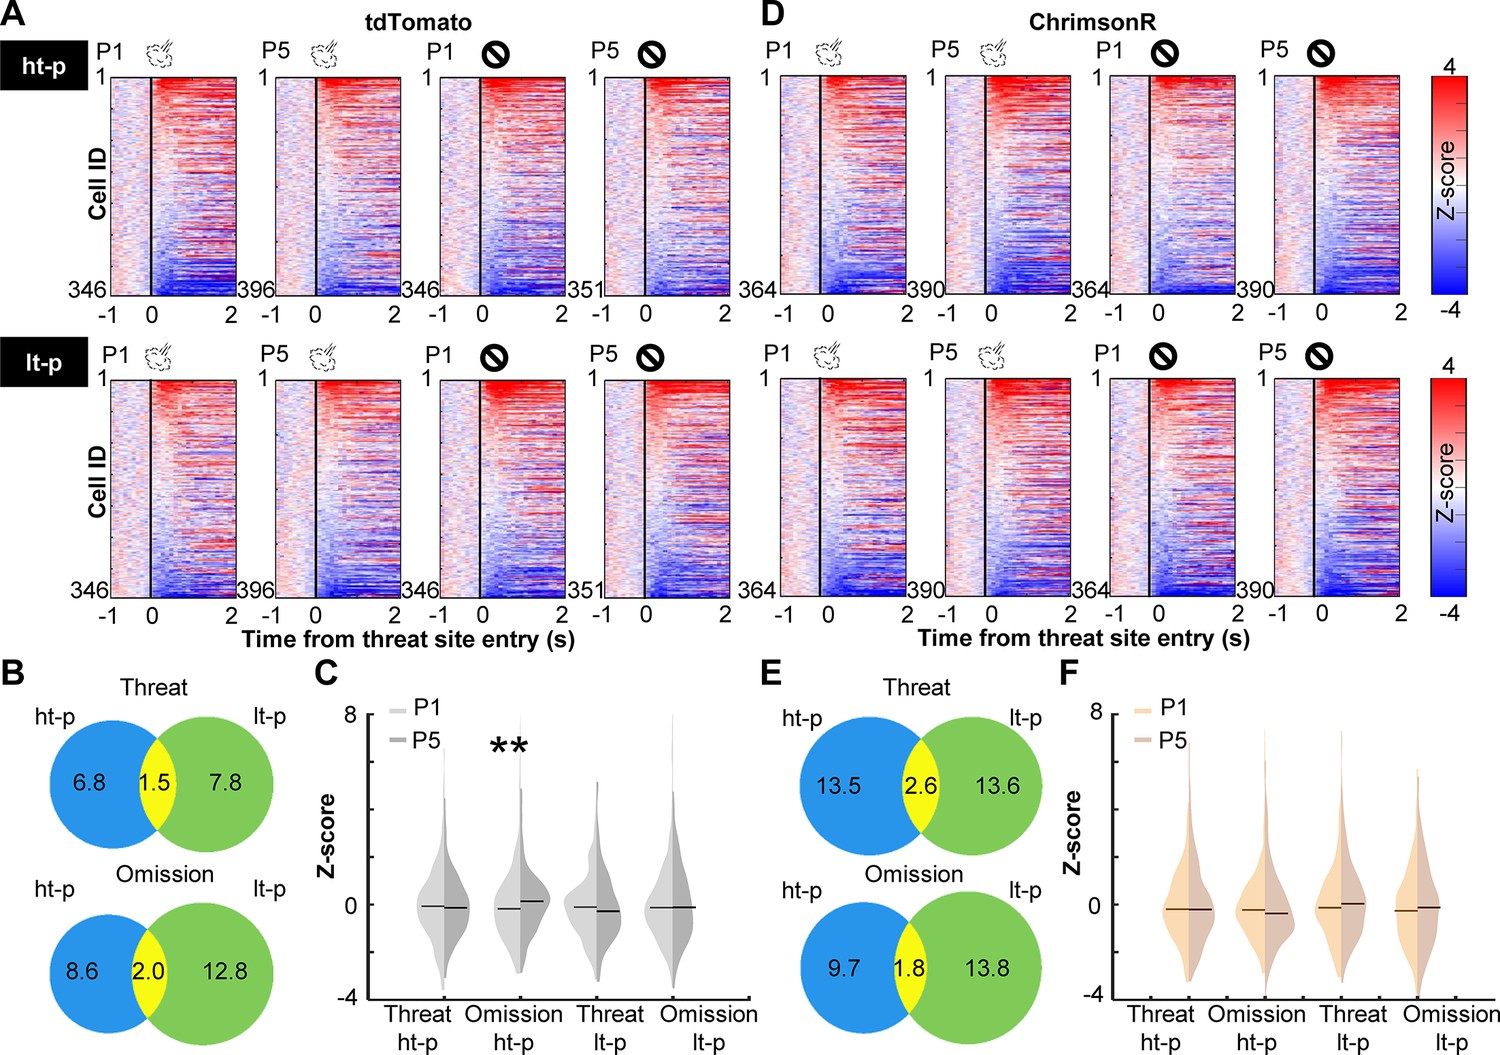
Cholinergic terminal stimulation abolishes learning-induced strengthening of PL cell responses to rare threat omission.
(A) The changes in PL cell activity upon the threat site entry in tdTomato mice. Pseudocolor plots showing the z-normalized cell activity aligned to the threat site entry during the first (P1) and last session (P5) of the probabilistic stage. Laps were categorized into four types based on the path (high-threat path, ht-p; low-threat path, lt-p) and the threat state (threat delivery or omission). Cells were sorted by their activity in the threat site in each panel. (B) Venn diagrams depicting the proportion of cells responding to threats and their omissions on the ht-p (blue) and the lt-p (green) as well as their overlap (yellow) in P5. The numbers show the percentage of cells in each category. (C) The distribution of z-normalized activity in the threat sites in P1 (light gray) and P5 (dark gray) with horizontal bars depicting the median. (D–F) The same as A–C for PL cell activity in ChrimsonR-expressing mice. **p < 0.01.
Figure 3—figure supplement 1

Learning-dependent changes in outcome-related activity of PL cells.
(A) Venn diagrams depicting the proportion of cells responding to threats and their omission on the high-threat path (ht-p; blue) and the low-threat path (lt-p; green), as well as their overlap (yellow) during the first session of the probabilistic stage. In both groups, outcomes on two paths were represented by distinct groups of cells. The numbers indicate the proportions of cells in each category. (B) The distribution of cell activity evoked by threats and their omission. Horizontal lines show the median. Z-normalized activity was averaged over a 500-ms window starting from the threat site entry in each lap type. During the first session (P1, left), two groups showed comparable magnitude of responses to threats and their omission on the ht-p and lt-p paths (Kolmogorov–Smirnov test, threat on ht-p, p = 0.731; omission on ht-p, p = 0.682; threat on lt-p, p = 0.404; omission on lt-p, p = 0.142). In the last session (P5, right), omission-evoked activity on the ht-p was weaker in ChrimsonR-expressing mice than no opsin control mice (p < 0.001). The group difference in other activity types did not reach statistical significance (α = 0.05/4; threat on ht-p, p = 0.054; threat on lt-p, p = 0.017; omission on lt-p, p = 0.409). One no opsin mouse was removed from the analysis on omission-evoked activity in P5 because it did not experience omission on the ht-p. ***p < 0.001.
Figure 4 with 2 supplements
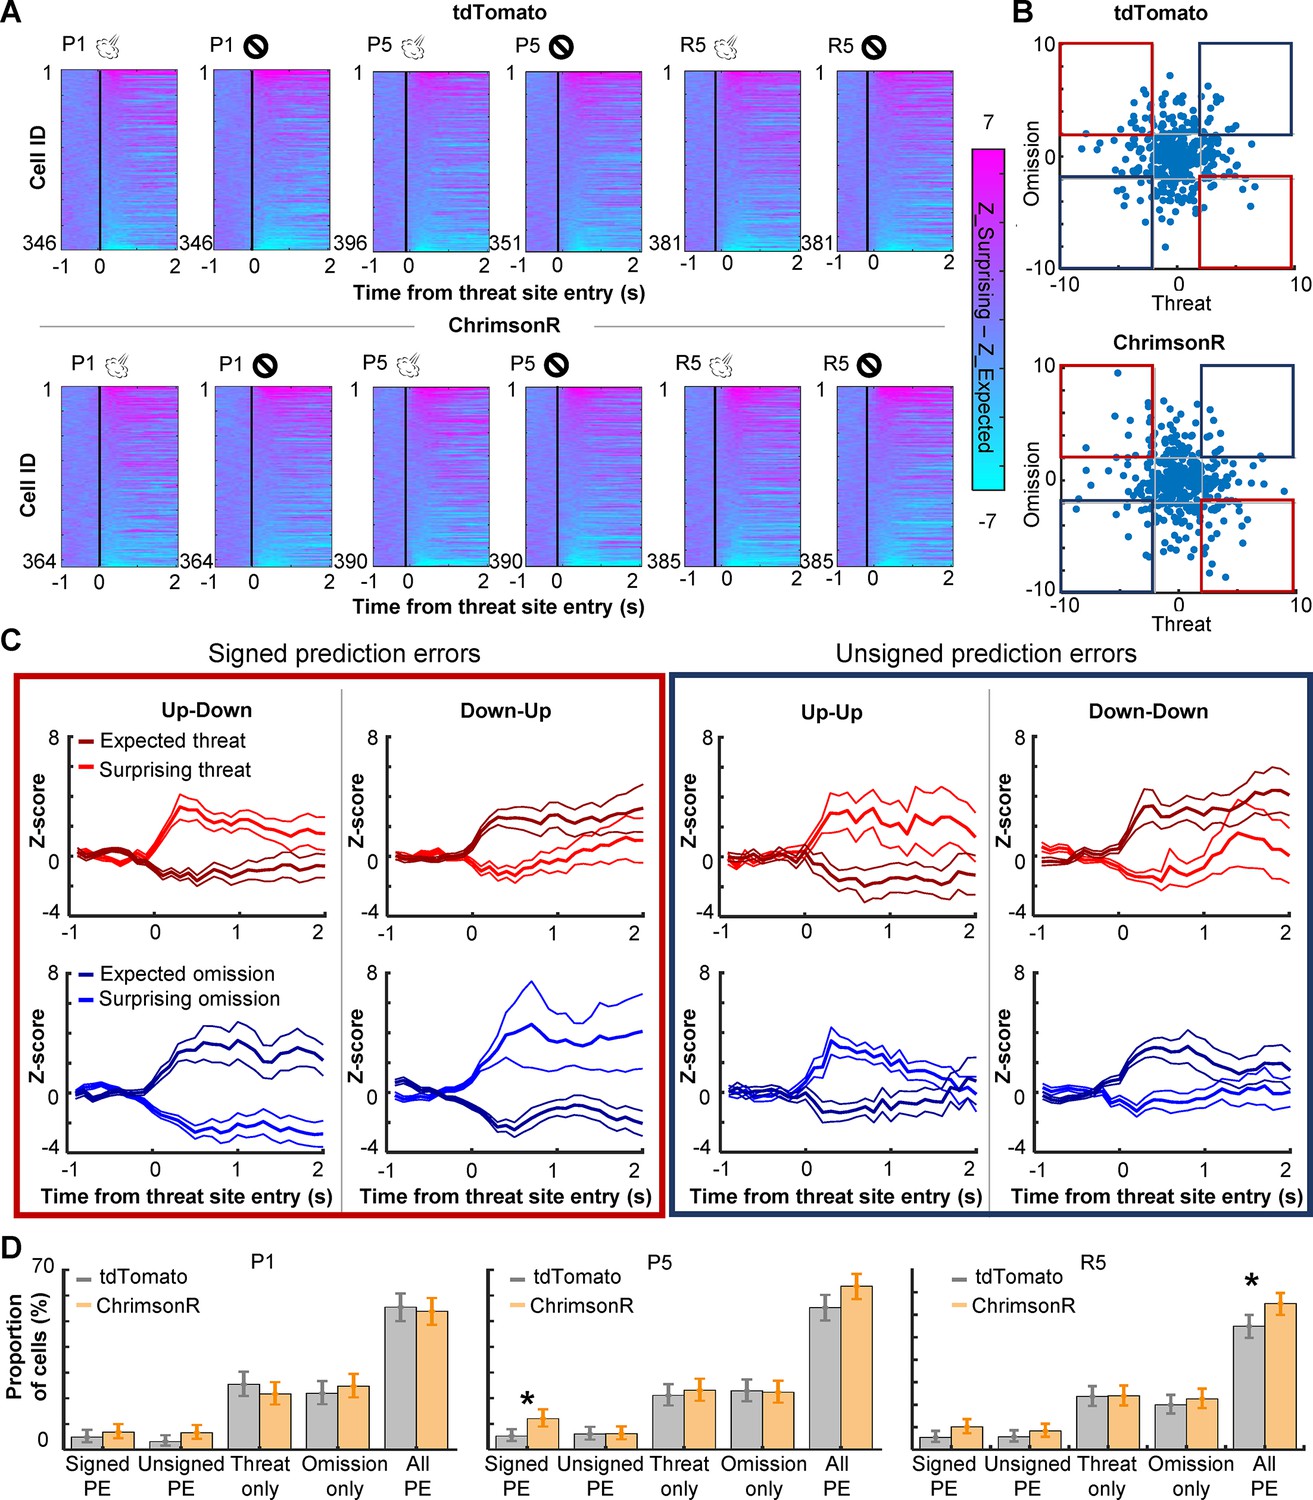
PL cells differentiate outcome-related activity depending on outcome expectations.
(A) Pseudocolor plots showing the differentiation of outcome-related activity between expected and surprising outcomes during the first (P1) and last session (P5) of the probabilistic stage. The color depicts the difference in z-normalized cell activity between laps with expected outcomes and lap with surprising outcomes. Cells were sorted by the activity difference in the threat site in each panel. (B) Expectation-dependent differentiation of cell activity in response to threats (x axis) and their omission (y axis; one dot per cell) in P5. The z-normalized activity was averaged during a 500-ms window starting from the threat site entry. The averaged values in laps with expected outcomes were subtracted from those with surprising outcomes (differential activity). Blue squares highlight cells with the same response direction to surprising threats and omissions (unsigned prediction errors). Red squares highlight cells with an opposite response direction to surprising threats and omissions (signed prediction errors). (C) The averaged z-normalized activity across cells with different types of activity differentiation (mean ± SEM). A cell was selected when its differential activity for threats or their omission was greater than 2 (Up) or smaller than –2 (Down). Cells with significant differential activity for both threat delivery and omission were then further categorized into four types depending on their response direction. The activity of cells with significant differentiation only for one outcome type was depicted in Figure 4—figure supplement 1. (D) The proportion of cells in various differential activity types. Cells selective for outcome expectations were categorized into four types as defined in C and Figure 4—figure supplement 1. Error bars show the upper and lower confidence limit (α = 0.05). PE, prediction errors. R5, the last session of the random stage. *p < 0.05.
Figure 4—figure supplement 1
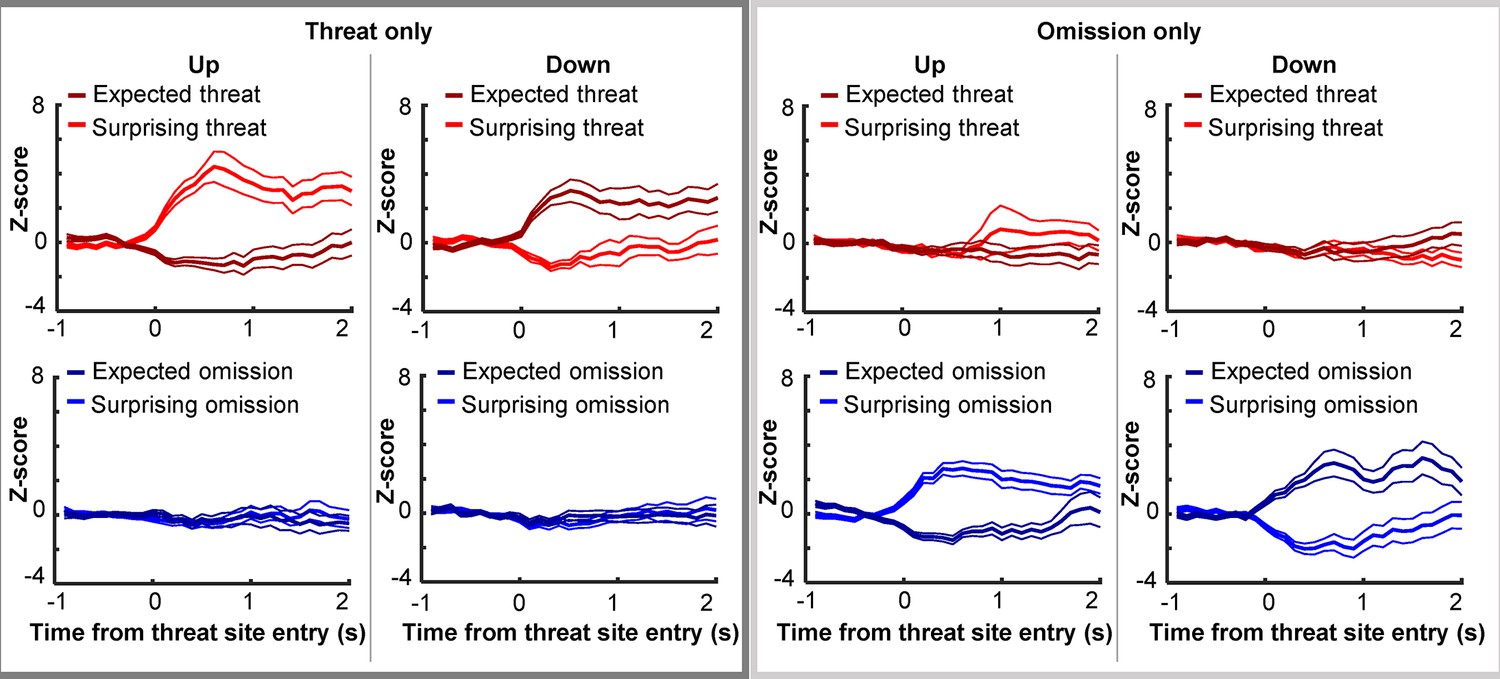
Expectation-dependent differentiation of outcome-related activity of PL cells.
Figure 4—figure supplement 2
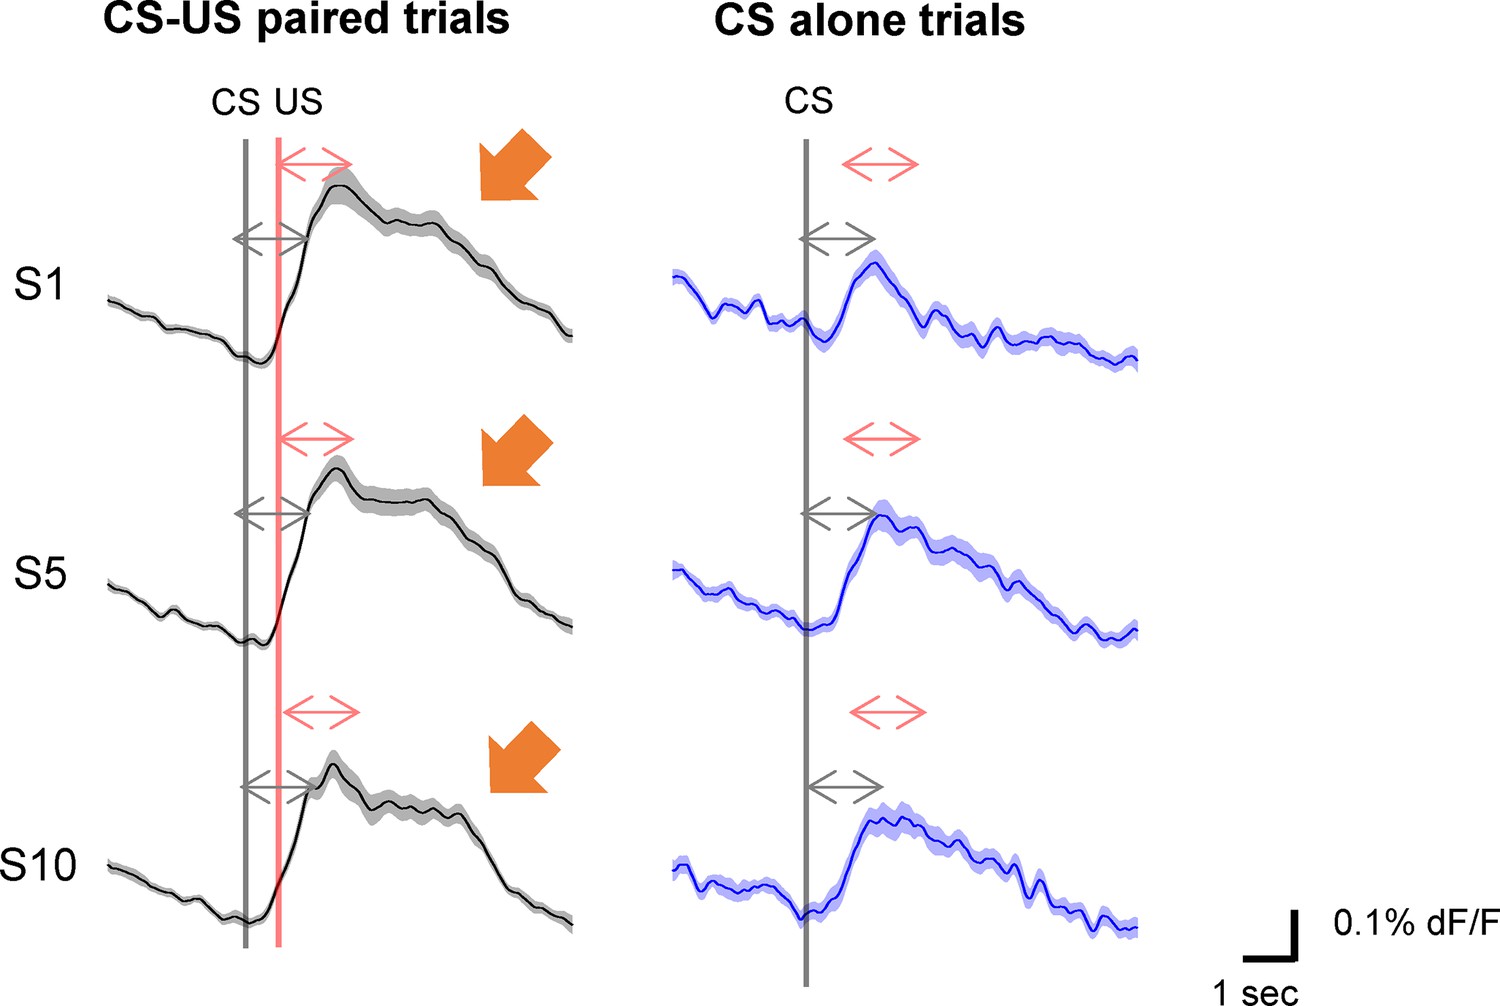
Lack of omission-evoked activation of cholinergic terminals in the PL.
Figure 5 with 2 supplements
Threat-evoked phasic cholinergic signals constrain learning from surprising outcomes in a stable but probabilistic environment.
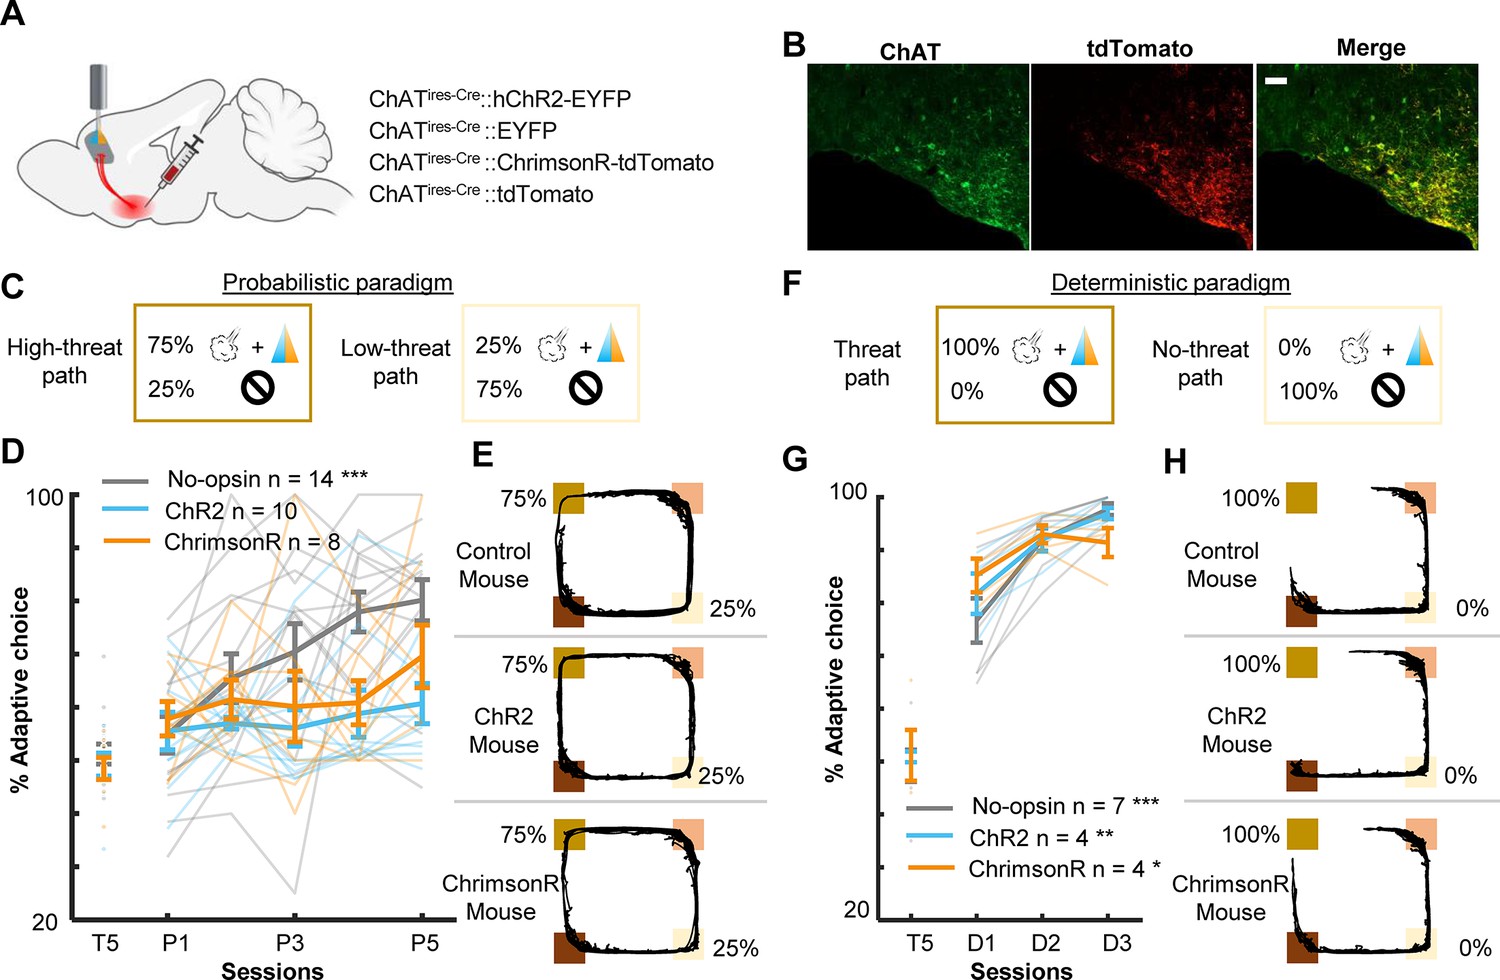
(A) Sites of viral vector infusion and optic fiber implantation. (B) Representative images showing co-localization of ChAT and virally infected cells expressing tdTomato. The scale bar represents 100 µm. (C) The effect of cholinergic terminal stimulation on mice’s behavior during the probabilistic paradigm. Schematic representation of threat probability and light stimulation on each path. LED stimulation was applied to the PL to activate the basal forebrain (BF) cholinergic terminals during every threat delivery. (D) The percentage of laps in which mice chose the low-threat path. (E) Movement trajectories of a representative mouse from each group. The locations of threat and reward sites were specified with the same color scheme as in Figure 1A. (F–H) Same as C–E for the deterministic paradigm. *p < 0.05, **p < 0.01, ***p < 0.001.
-
Figure 5—source data 1
The percentage of laps in which mice chose the low-threat path in the probabilistic paradigm.
Data for panel D.
- https://cdn.elifesciences.org/articles/102986/elife-102986-fig5-data1-v1.xlsx
-
Figure 5—source data 2
The percentage of laps in which mice chose the low-threat path in the deterministic paradigm.
Data for panel G.
- https://cdn.elifesciences.org/articles/102986/elife-102986-fig5-data2-v1.xlsx
Figure 5—figure supplement 1
Locations of viral spread and optic fiber implants in mice underwent bilateral optogenetic manipulations.
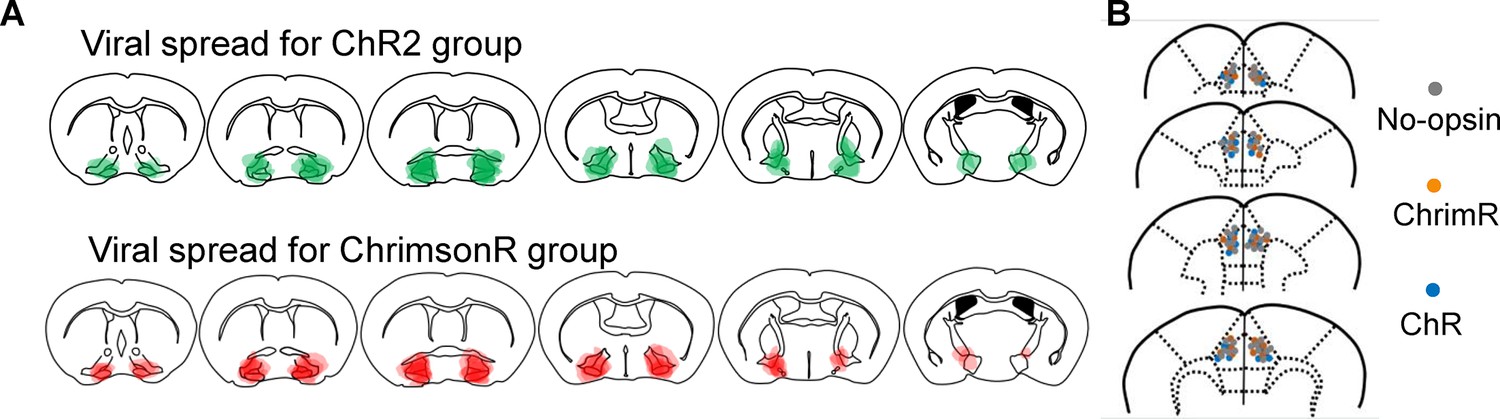
(A) Schematic representations of virus spread in the basal forebrain for mice expressing channelrhodopsin-EYFP (green, top) or ChrimsonR-tdTomato (red, bottom). Each translucent area indicates the viral spread in each mouse. (B) Schematic representations of optic fiber location (one dot/each fiber placement in each mouse).
Figure 5—figure supplement 2
Movement patterns and the design of correlation analysis.
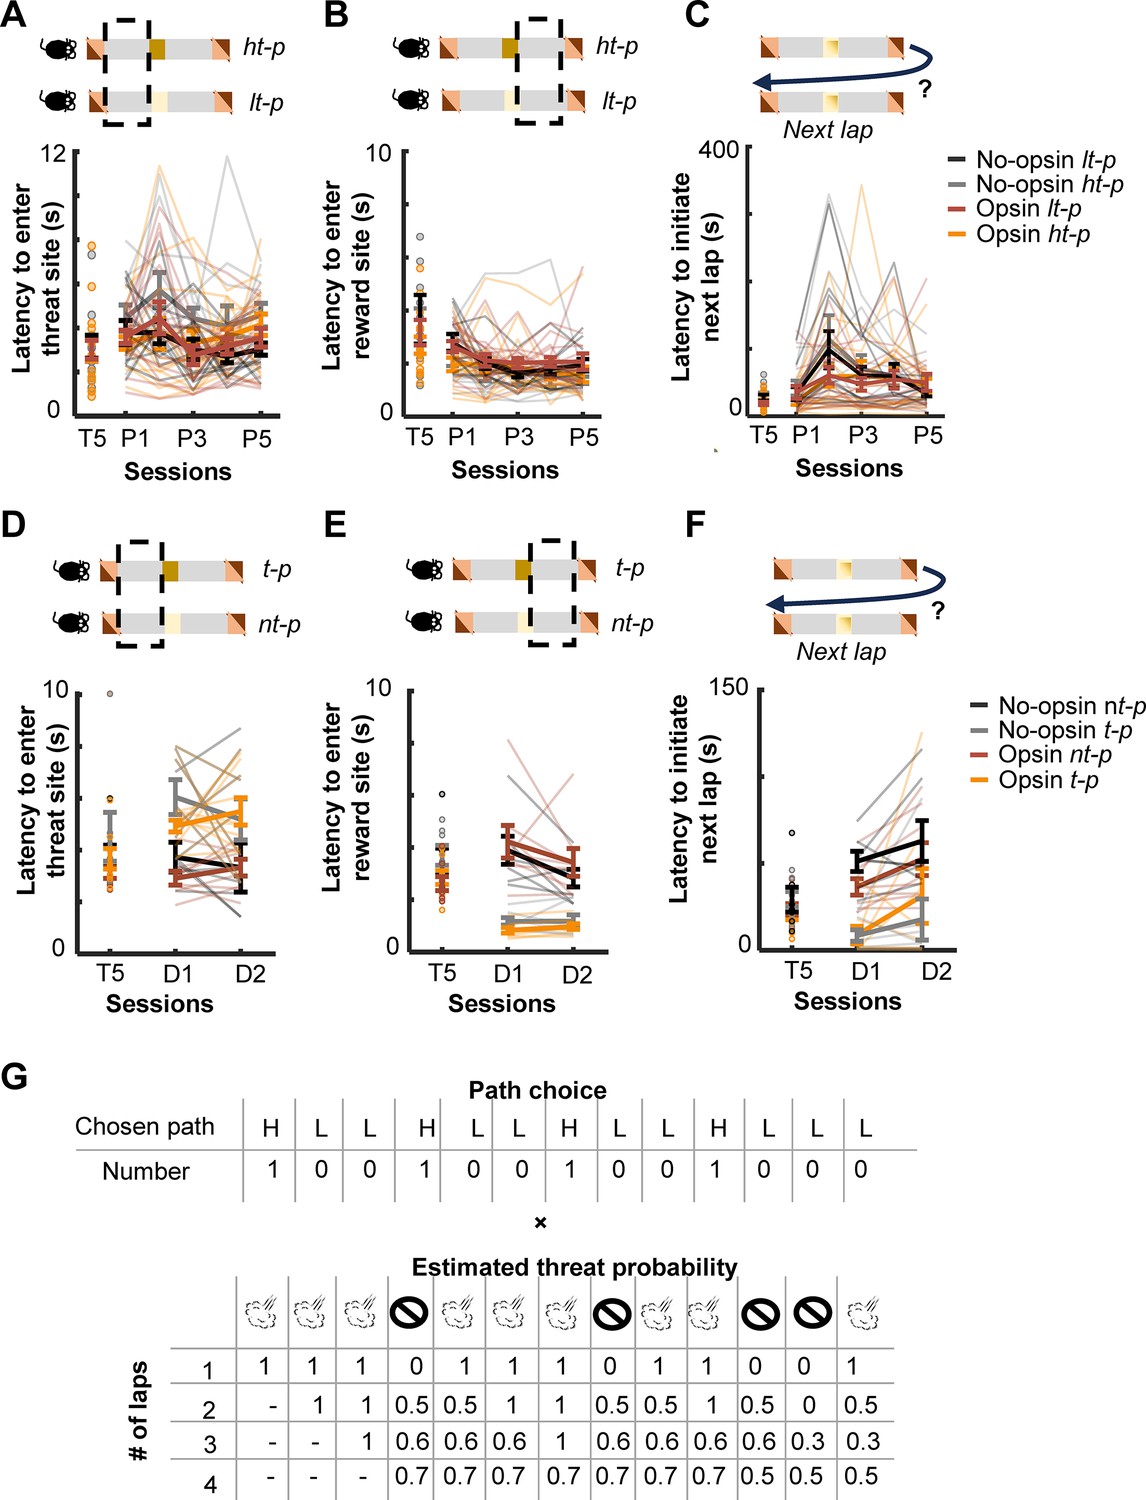
(A) Movement patterns on the high- (ht-p) and low-threat path (lt-p) during the last pre-training session (T5) and all probabilistic sessions (P1–P5). No opsin, n = 11; Opsin, n = 15. The time taken from the reward site exit to the threat site entry. (B) The time taken from the threat site exit to the reward site entry. (C) Time in the reward site before initiating a subsequent lap. (D) Movement patterns on the path with threats (t-p) and path without threats (nt-p) during the last pre-training session (T5) and all deterministic sessions (D1–2). The time taken from the reward site exit to the threat site entry. (E) The time taken from the threat site exit to the reward site entry. (F) Time in the reward site before initiating a subsequent lap. (G) Schematic explanation of the correlation analysis in Figure 6B. The path that each mouse took in each lap was converted to 1 and 0 for the high- and low-threat path, respectively. In parallel, threat probabilities were estimated based on threat occurrence across different numbers of trials. We then calculated a Pearson correlation coefficient between the path choice and estimated threat probability.
-
Figure 5—figure supplement 2—source data 1
Movement patterns on the high- and low-threat path during the last pre-training session and all probabilistic sessions.
Data for panels A-C.
- https://cdn.elifesciences.org/articles/102986/elife-102986-fig5-figsupp2-data1-v1.xlsx
-
Figure 5—figure supplement 2—source data 2
Movement patterns on the path with threats and path without threats during the last pre-training session and all deterministic sessions.
Data for panels D-F.
- https://cdn.elifesciences.org/articles/102986/elife-102986-fig5-figsupp2-data2-v1.xlsx
Figure 6
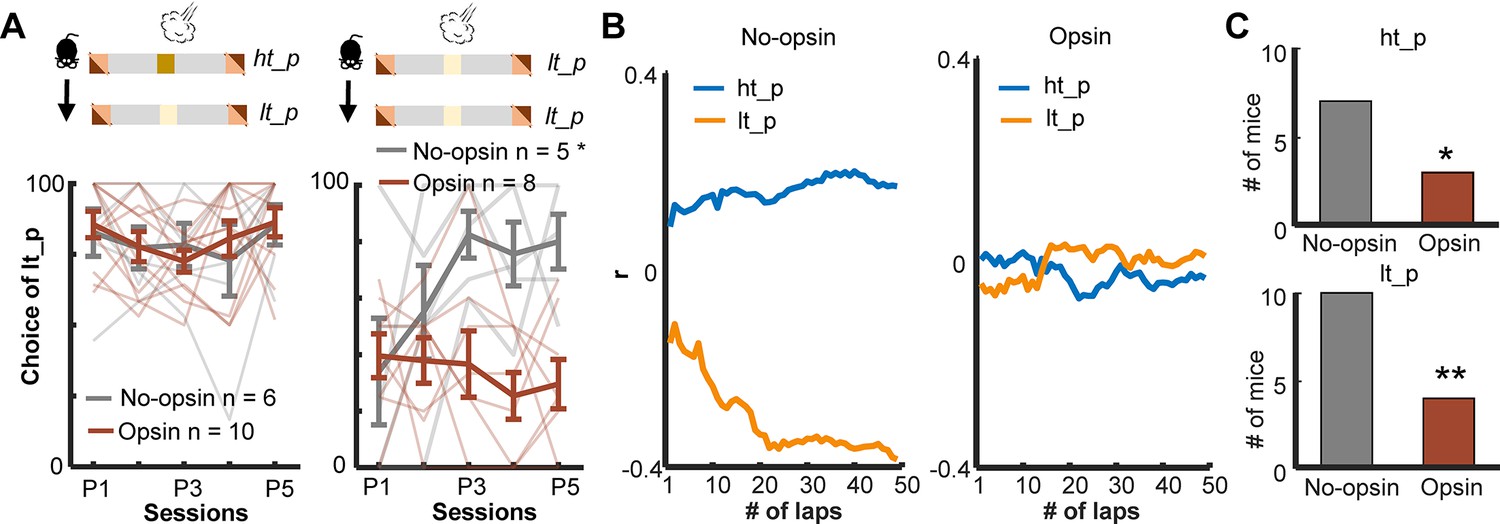
Enhanced threat-evoked phasic cholinergic signals impair the integration of outcome information over time.
(A) The probability of choosing the low-threat path (lt-p) after an air-puff delivery on the high-threat path (ht-p; left; one thin line/mouse, mean ± SEM). Only mice with usable data in all five sessions were used for this analysis. (B) Correlation coefficients between the actual path choice and threat probability calculated with the different number of previous laps from representative mice. The greater positive values for the ht-p and negative values for the lt-p indicate stronger correlations with the estimated threat probability (see Figure 5—figure supplement 2G). (C) Numbers of mice showing significant correlations between the estimated threat probability and the choice of the ht-p (top). *p < 0.05, **p < 0.01.
-
Figure 6—source data 1
The probability of choosing the low-threat path after an air-puff delivery on the high-threat path.
Data for panel A.
- https://cdn.elifesciences.org/articles/102986/elife-102986-fig6-data1-v1.xlsx
Figure 7
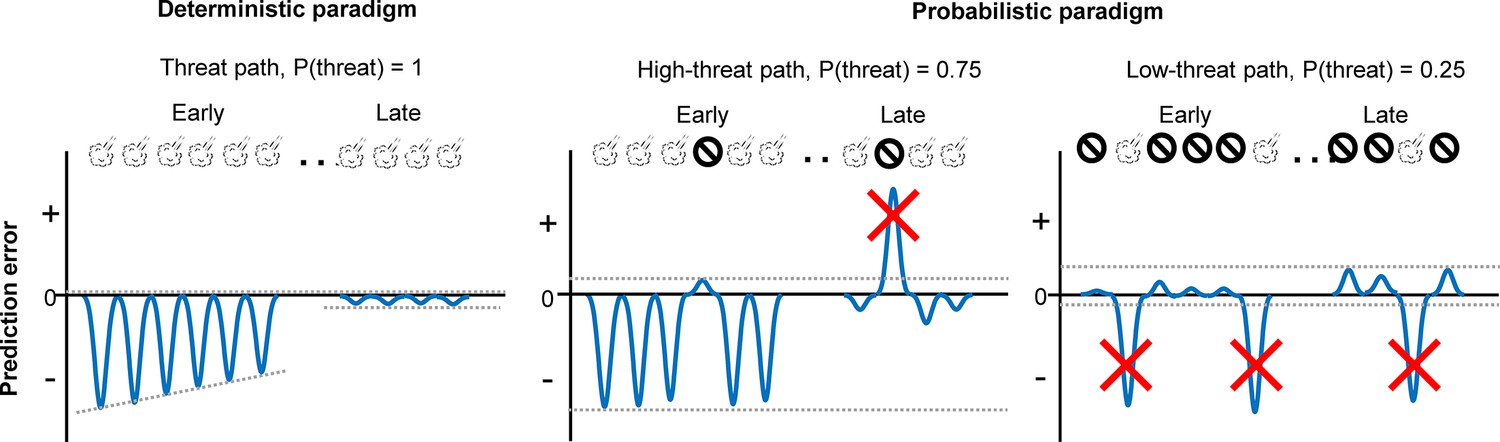
Schematic representations of aversive prediction errors in the deterministic and probabilistic paradigms.
Aversive prediction errors become positive for unexpected threat delivery while negative for unexpected threat omission (McNally et al., 2011; Iordanova et al., 2021). Red crosses indicate prediction error signals with abnormally large amplitude. We argue that the role of outcome-evoked phasic cholinergic signals is to suppress learning from these occasional surprising outcomes.
Additional files
-
Supplementary file 1
Summary of the number of imaged cells in each mouse.
- https://cdn.elifesciences.org/articles/102986/elife-102986-supp1-v1.xlsx
-
MDAR checklist
- https://cdn.elifesciences.org/articles/102986/elife-102986-mdarchecklist1-v1.docx
Download links
A two-part list of links to download the article, or parts of the article, in various formats.
Downloads (link to download the article as PDF)
Open citations (links to open the citations from this article in various online reference manager services)
Cite this article (links to download the citations from this article in formats compatible with various reference manager tools)
Acetylcholine modulates prefrontal outcome coding during threat learning under uncertainty
eLife 13:RP102986.
https://doi.org/10.7554/eLife.102986.2


