Therapeutic effects of PDGF-AB/BB against cellular senescence in human intervertebral disc
- Department of Orthopaedics, Emory University School of Medicine, United States
- Atlanta VA Medical Center, United States
- Emory Orthopaedics and Spine Center, United States
- Department of Surgery, McGill University, Canada
Figures
Figure 1 with 1 supplement
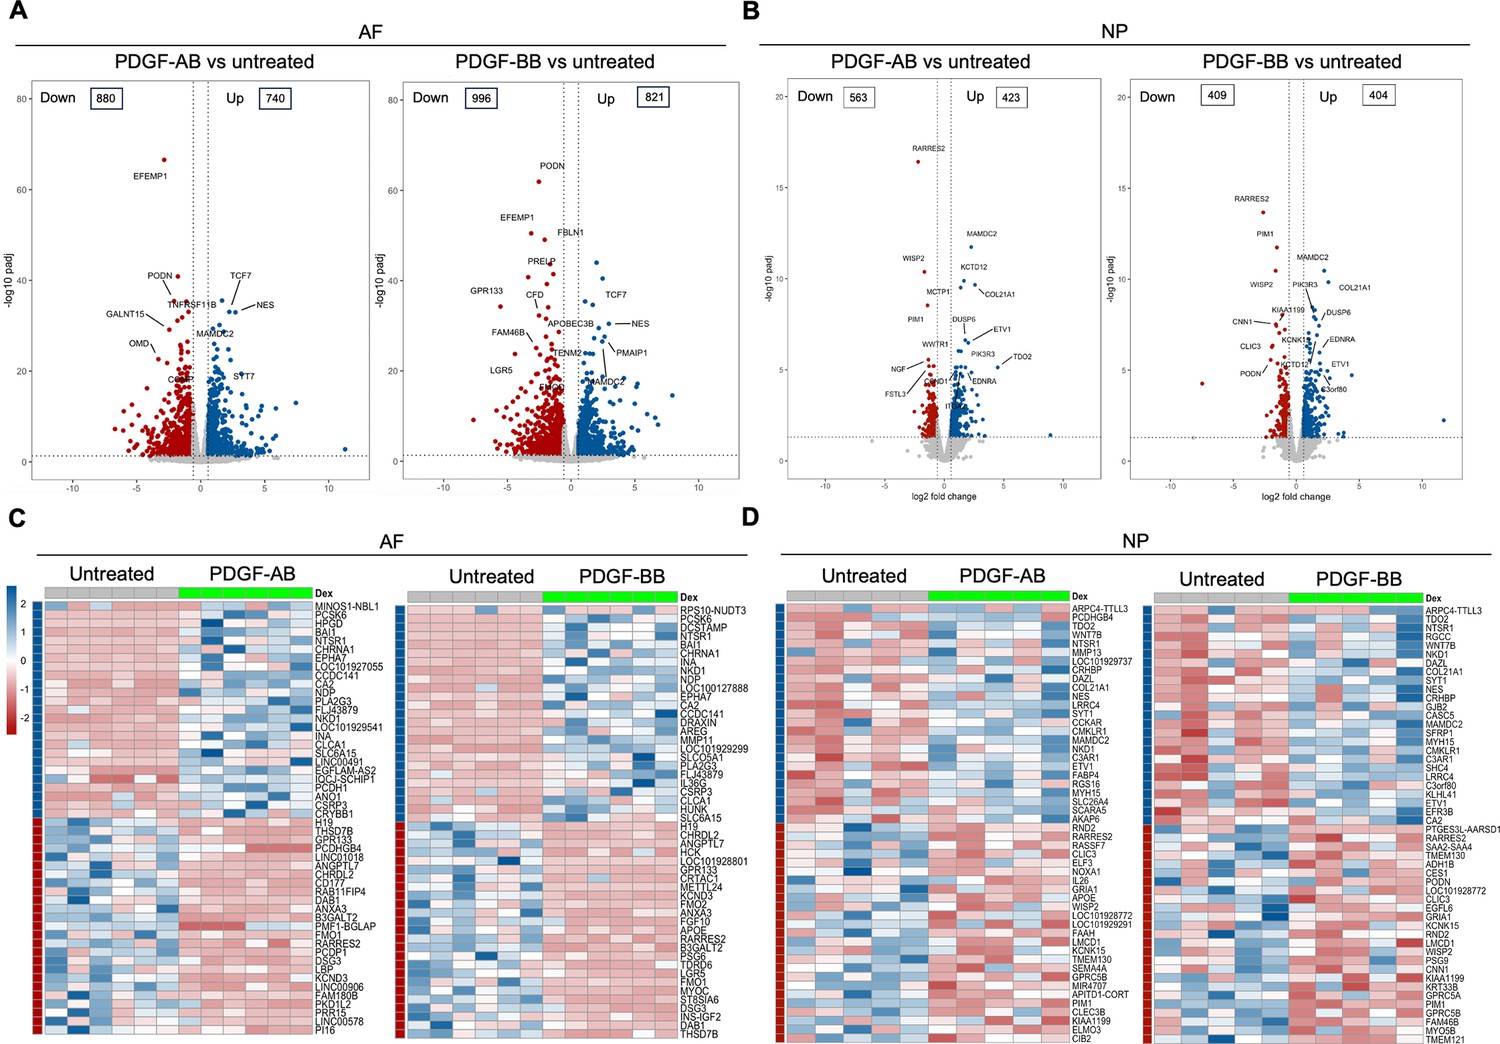
Transcriptomics of annulus fibrosus (AF) and nucleus pulposus (NP) cells in response to platelet-derived growth factor (PDGF)-AB/BB treatment.
(A, B) Volcano plots showing the differentially expressed genes (DEGs) in AF (A) and NP (B) cells treated with rhPDGF-AB/BB for 5 d (cutoff: |FC|>1.5 and FDR < 0.05). DEGs were annotated in the plot according to false discovery rate (FDR). (C, D) Heatmap plots showing the top 50 DEGs in rhPDGF-AB/BB-treated AF (C) and NP (D) cells based on fold change. NP: n=5 samples. AF: n=6 samples.
Figure 1—figure supplement 1
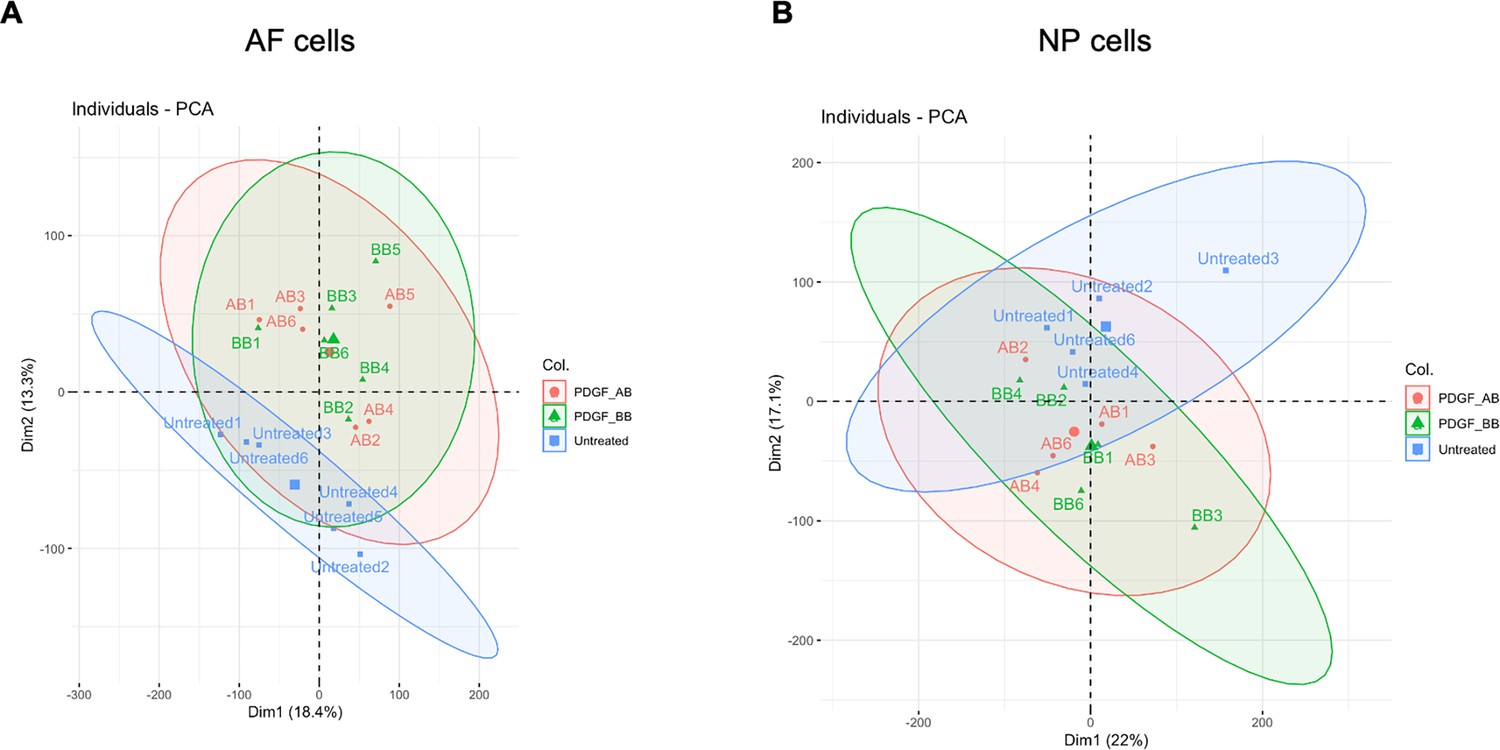
Principle component analysis (PCA) of nucleus pulposus (NP) and annulus fibrosus (AF) samples treated with rhPDGF-AB and BB.
(A, B) PCA plot of NP (A) cells and AF cell (B) showed the distinct cluster between untreated and treated samples. The clusters of PDGF-AB and BB samples were overlapping. NP: n=5 each group. AF: n=6 each group.
Figure 2
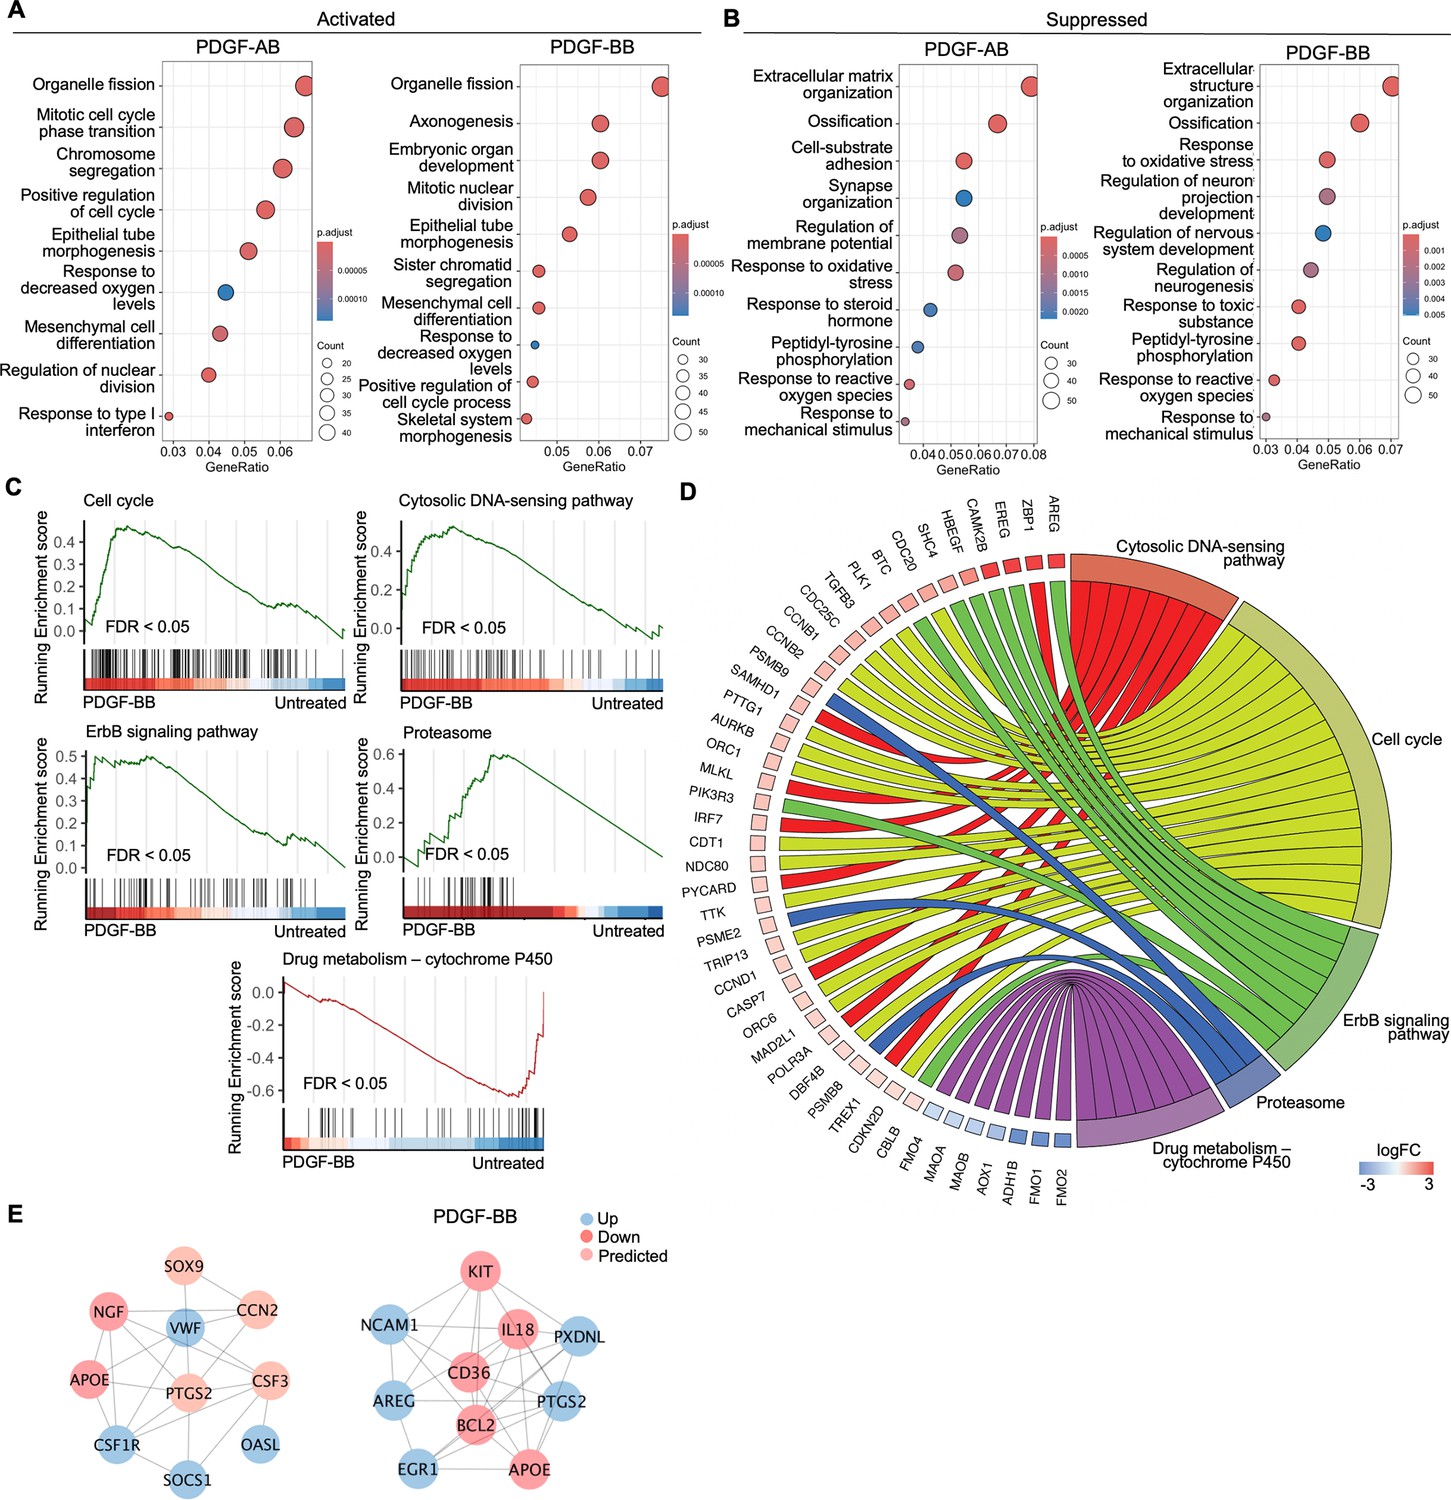
Functional analysis of annulus fibrosus (AF) cells treated with platelet-derived growth factor (PDGF)-AB/BB.
(A, B) Gene ontology (GO) analysis for biological process using upregulated (A) and downregulated (B) differential expression genes (DEGs) in AF cells. Y-axis label represents gene ontology (GO) terms, and x-axis represents geneRatio (geneRatio refers to the proportion of genes that are annotated in specific GO term within all the input genes). The size of the bubble represents the gene counts enriched in a particular GO term and the color indicates the false discovery rate (FDR) of GO terms. (C) Gene set enrichment analysis (GSEA) on the entire transcriptome profile demonstrated an upregulation of the cell cycle, cytosolic DNA-sensing pathway, ErbB signaling pathway, and proteasome and a downregulation of drug metabolism-cytochrome P450 pathway in rhPDGF-BB-treated NP cells. (D) The leading edge genes associated with these pathways were shown using a chord diagram. (E) Protein-protein interaction network using DEGs was constructed in STRING and visualized in Cytoscape.
Figure 3 with 1 supplement
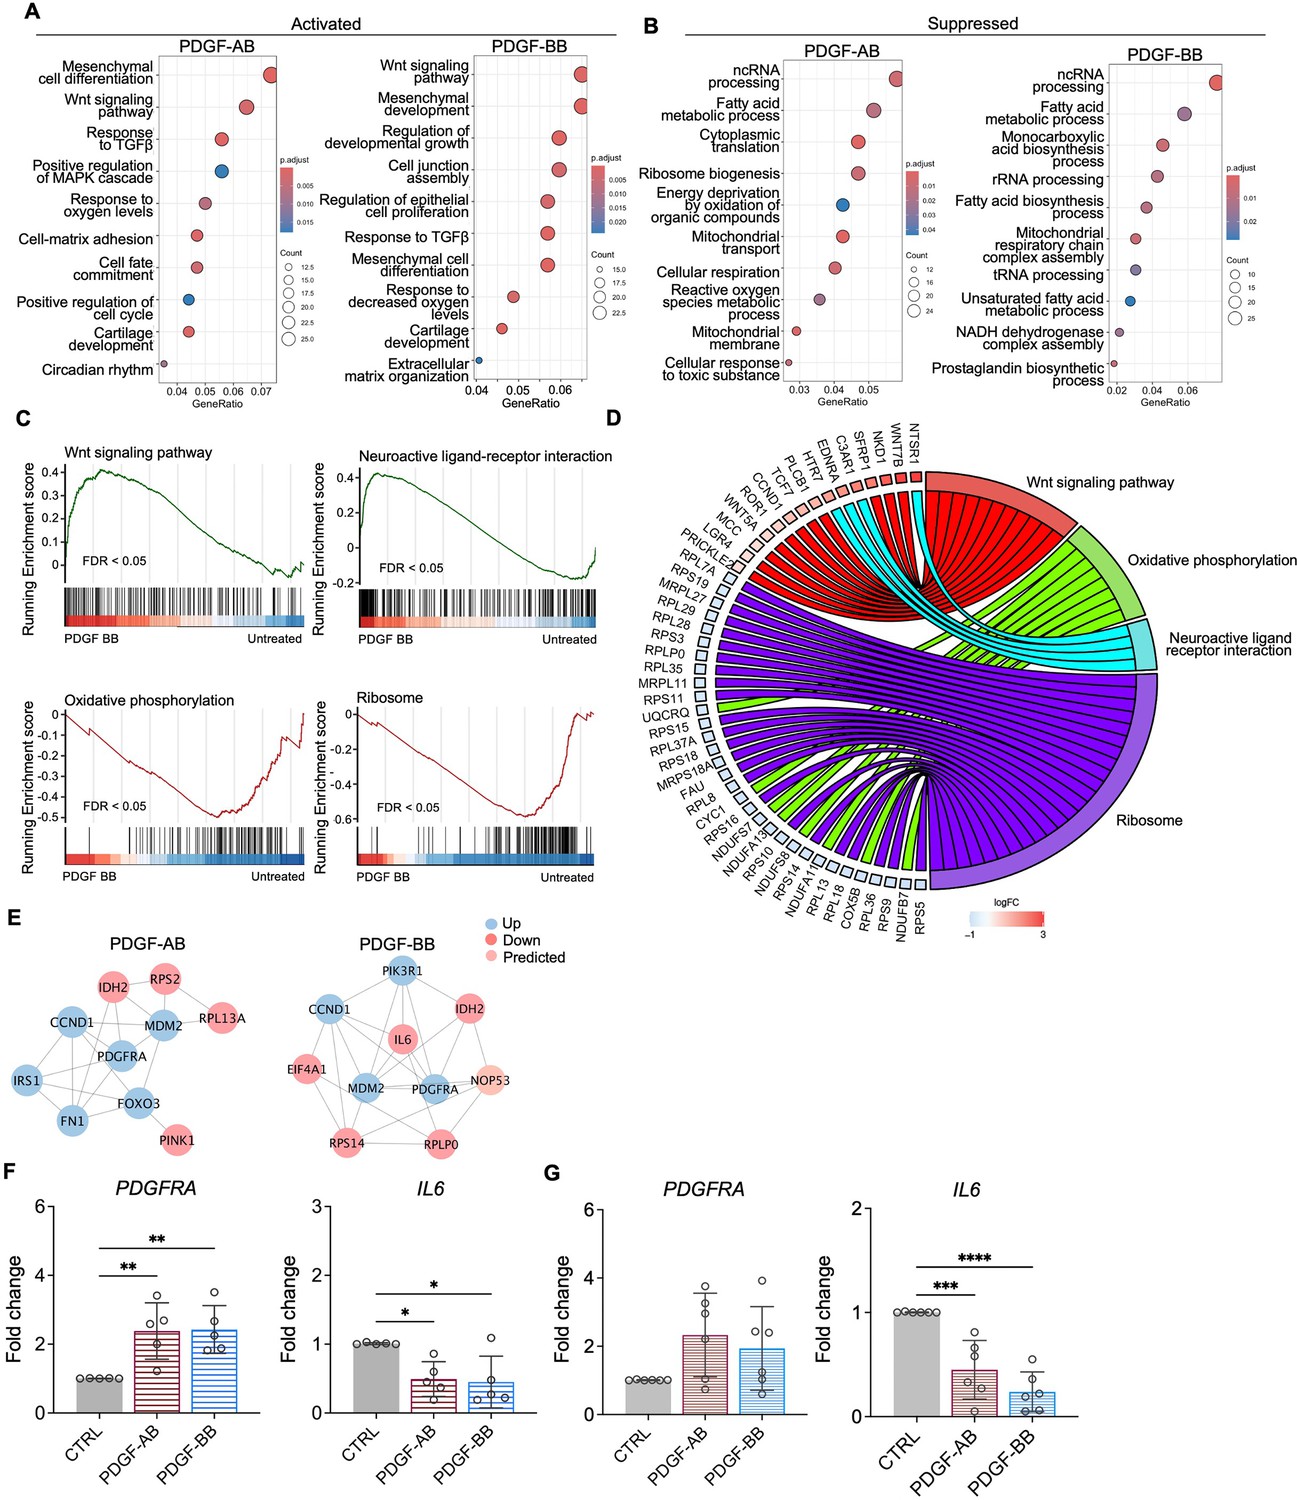
Functional analysis of nucleus pulposus (NP) cells treated with platelet-derived growth factor (PDGF)-AB/BB.
(A, B) Gene ontology (GO) analysis for biological process using upregulated (A) and downregulated (B) differential expression genes (DEGs) in NP cells. Y-axis label represents GO terms, and x-axis represents geneRatio (geneRatio refers to the proportion of genes that are annotated in specific GO term within all the input genes). The size of the bubble represents the gene counts enriched in a particular GO term and the color indicates the false discovery rate (FDR) of GO terms. (C) Gene set enrichment analysis (GSEA) on the entire transcriptome profile demonstrated an upregulation of Wnt signaling pathway and a downregulation of oxidative phosphorylation and ribosome in rhPDGF-BB-treated NP cells. (D) The leading-edge genes associated with these pathways were shown using a chord diagram. (E) Protein-protein interaction network using DEGs was constructed in STRING and visualized in Cytoscape. (F, G) The changes in the gene expression of PDGFRA and IL6 were verified in NP (F) and annulus fibrosus (AF) (G) cells treated with rhPDGF-AB (40 ng/ml) or -BB (20 ng/ml) for 5 d. One-way ANOVA testing was performed to assess the effects of treatment on NP and AF cells with subsequent Dunnett post hoc testing. Data are presented as mean with SD. NP: n=5; AF: n=6. *p<0.05. **p<0.01. ***p<0.001. ****p<0.0001.
-
Figure 3—source data 1
Excel file containing the measures displayed in Figure 3.
- https://cdn.elifesciences.org/articles/103073/elife-103073-fig3-data1-v1.xlsx
Figure 3—figure supplement 1
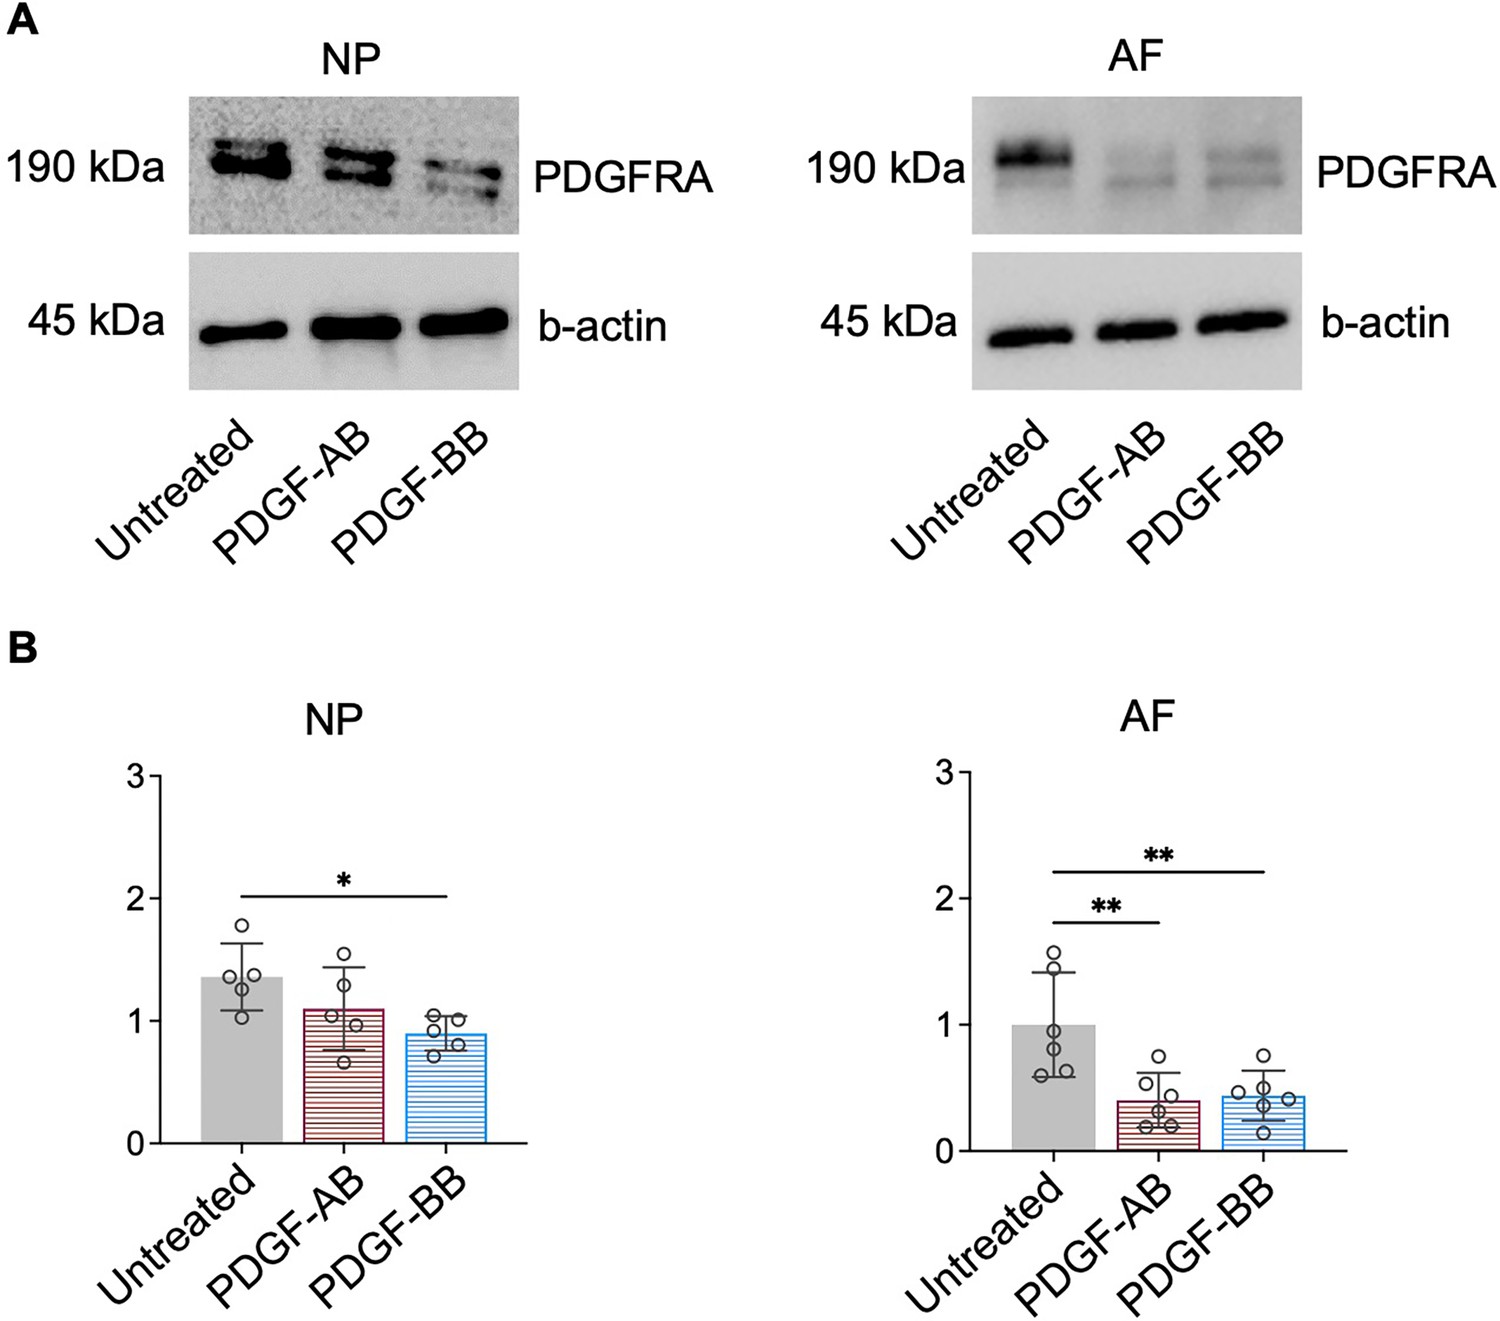
Protein expression of PDGFRA was decreased in nucleus pulposus (NP) and annulus fibrosus (AF) samples were treated with rhPDGF-AB and BB.
(A) Representative images of western blot of PDGFRA in NP (left) and AF (right) cells. (B) Quantification of western blot results showing decreased PDGFRA expression in treated samples compared to the untreated group. NP: n=5; AF: n=6. One-way ANOVA with Dunnett post hoc testing was performed. The data is presented as mean with SD. *p<0.05. **p<0.01.
-
Figure 3—figure supplement 1—source data 1
Excel file containing the measures of PDGFRA protein expression levels in untreated and platelet-derived growth factor (PDGF)-treated disc cells.
- https://cdn.elifesciences.org/articles/103073/elife-103073-fig3-figsupp1-data1-v1.xlsx
-
Figure 3—figure supplement 1—source data 2
PDF file containing original western blots for Figure 3—figure supplement 1, indicating the bands and treatments.
- https://cdn.elifesciences.org/articles/103073/elife-103073-fig3-figsupp1-data2-v1.zip
-
Figure 3—figure supplement 1—source data 3
Original files for western blots displayed in Figure 3—figure supplement 1.
- https://cdn.elifesciences.org/articles/103073/elife-103073-fig3-figsupp1-data3-v1.zip
Figure 4
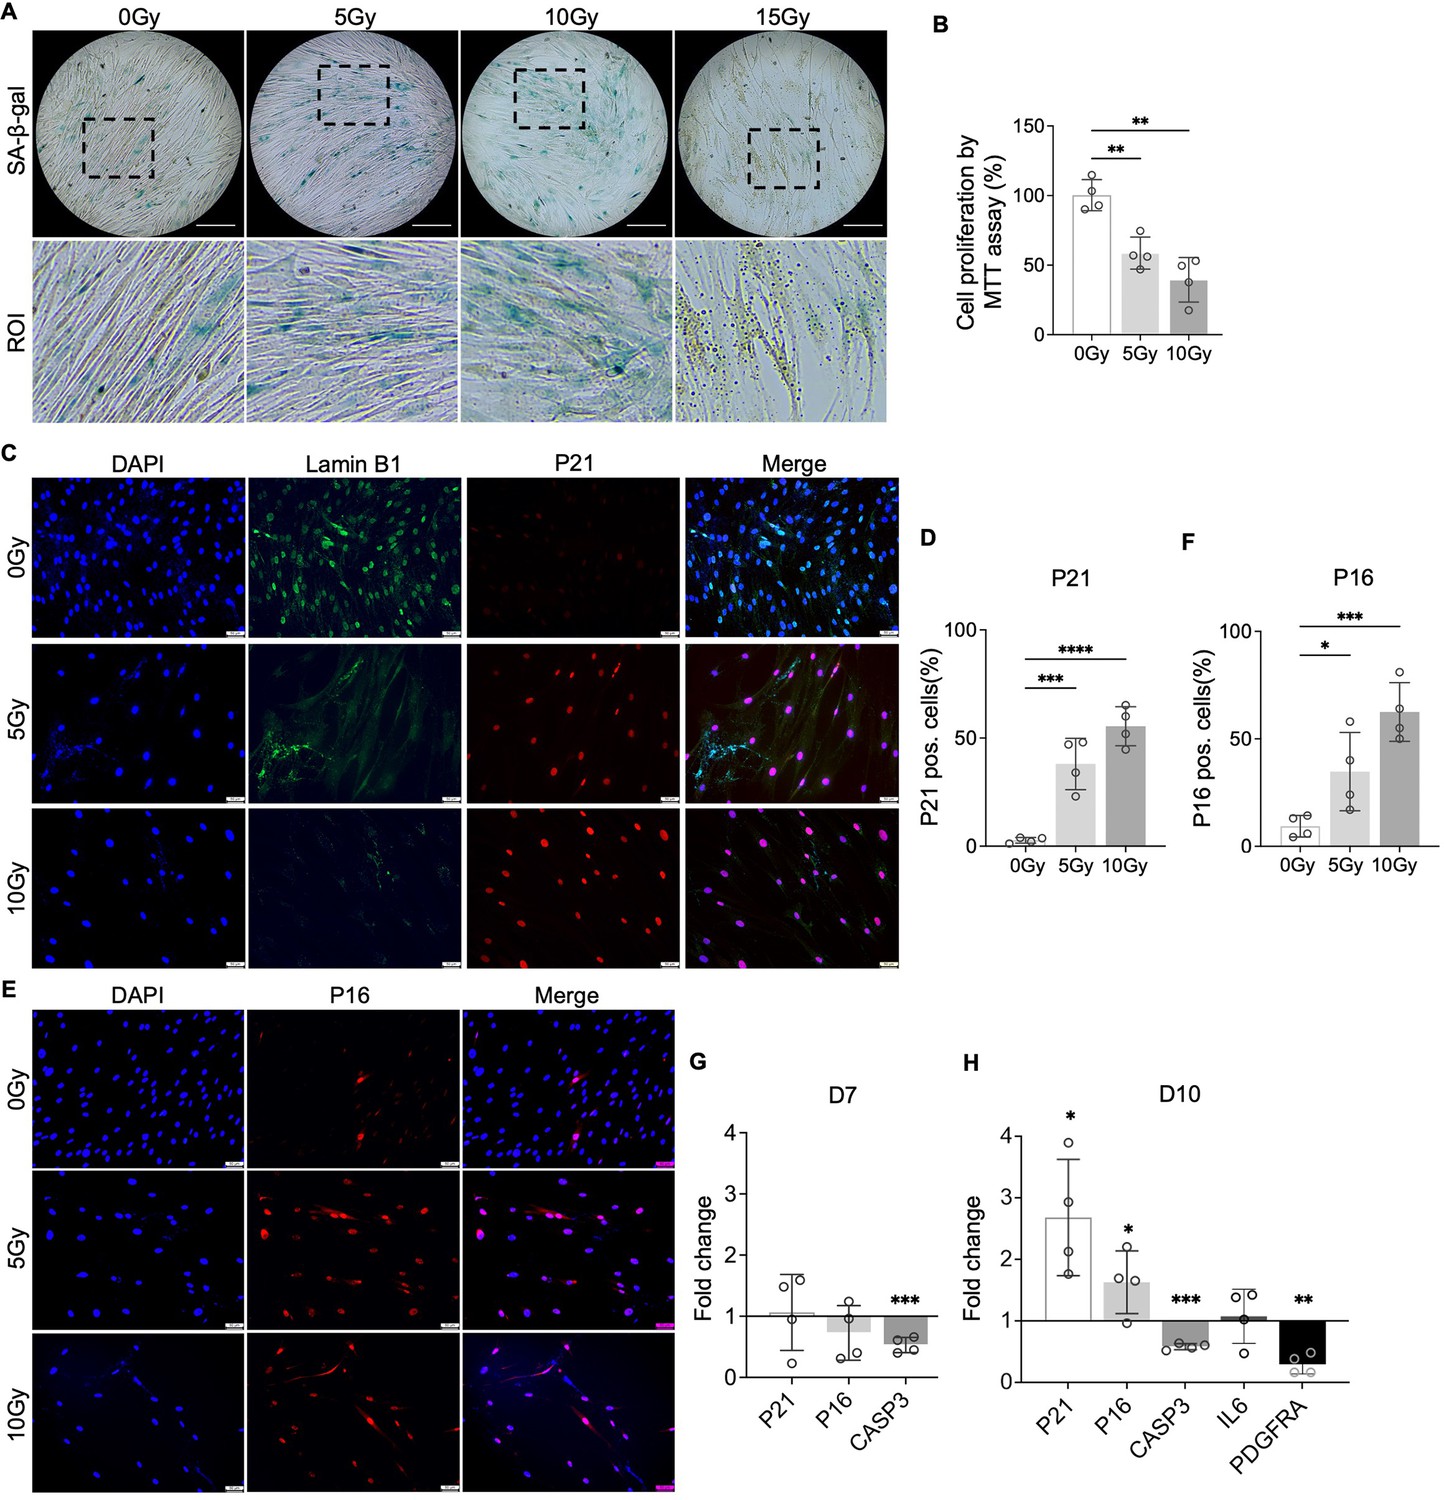
Cellular senescence induction by irradiation.
(A) Senescence-associated β-galactosidase (SA-β-gal) staining in healthy nucleus pulposus (NP) cells under different doses of irradiation at day 7. Images were captured under 10 X magnification using Echo microscope. ROI: region of interest. Scale bar = 200 µm. (B) MTT assay showed decreased cell proliferation after irradiation at day 7. One-way ANOVA testing was performed to assess the effects of irradiation dosage on NP and annulus fibrosus (AF) cells with subsequent Dunnett post hoc testing. Data are presented as mean with SD. n=4. **p<0.01. (C) Immunocytochemistry staining on Lamin B1 and P21 in irradiated cells at day 7. Scale bar = 50 µm. (D) Quantification of P21-positive cells. One-way ANOVA testing was performed to assess the effects of irradiation dosage on NP and AF cells with subsequent Dunnett post hoc testing. Data are presented as mean with SD. n=4. ***p<0.001. ****p<0.0001. (E) Immunocytochemistry staining on P16 in irradiated cells at day 7. Scale bar = 50 µm. (F) Quantification of P16 positive cells. One-way ANOVA testing was performed to assess the effects of irradiation dosage on NP and AF cells with subsequent Dunnett post hoc testing. Data are presented as mean with SD. n=4. *p<0.05. ***p<0.001. (G) Changes in the gene expression levels of P21, P16, and CASP3 in NP cells under 10 Gy of irradiation compared to the non-irradiated group at day 7 and 10 timepoints. (H) The gene expression of PDGFRA was reduced under 10 Gy of irradiation compared to the non-irradiated group at day 10. t-test was utilized to analyze the effects of ionizing radiation on the expression of senescence markers in cells (G, H). Data are presented as mean with SD. n=4. *p<0.05. **p<0.01. ***p<0.001.
-
Figure 4—source data 1
Excel file containing the measures displayed in Figure 4.
- https://cdn.elifesciences.org/articles/103073/elife-103073-fig4-data1-v1.xlsx
Figure 5

Platelet-derived growth factor (PDGF)-AB/BB treatment inhibited the progression of senescence in healthy nucleus pulposus (NP) and annulus fibrosus (AF) cells exposed to irradiation.
(A-F) Cell cycle analysis by DAPI staining in irradiated healthy NP (A–C) and AF (D–F) cells treated with rhPDGF-AB (40 ng/ml) or BB (20 ng/ml) for 10 d. The upper panel shows the data obtained from NP cells, and lower panel shows the data from AF cells. Representative graphs (A, D) showing the changes in cell cycle progression in NP and AF cells after treatment. (B, E) Quantification of cell cycle analysis showed the cell percentage in each phase. Two-way ANOVA with Dunnett post hoc testing was performed. n=4 each group. Data are presented as mean with SD. *p<0.05. (C, F) The cell percentage in the S phase was shown to examine the effects of treatment on cell proliferation. One-way ANOVA with Dunnett post hoc testing was performed. n=4 each group. Data are presented as mean with SD. *p<0.05. **p<0.01. (G) SA-β-gal staining in irradiated healthy NP (upper panel) and AF cells (lower panel) showing the reduced senescence-associated β-galactosidase (SA-β-gal) positive cells after treatment. Images were captured under 10 X magnification using the Echo microscope. ROI: region of interest. Scale bar = 200 µm.
-
Figure 5—source data 1
Excel file containing the measures displayed in Figure 5.
- https://cdn.elifesciences.org/articles/103073/elife-103073-fig5-data1-v1.xlsx
Figure 6
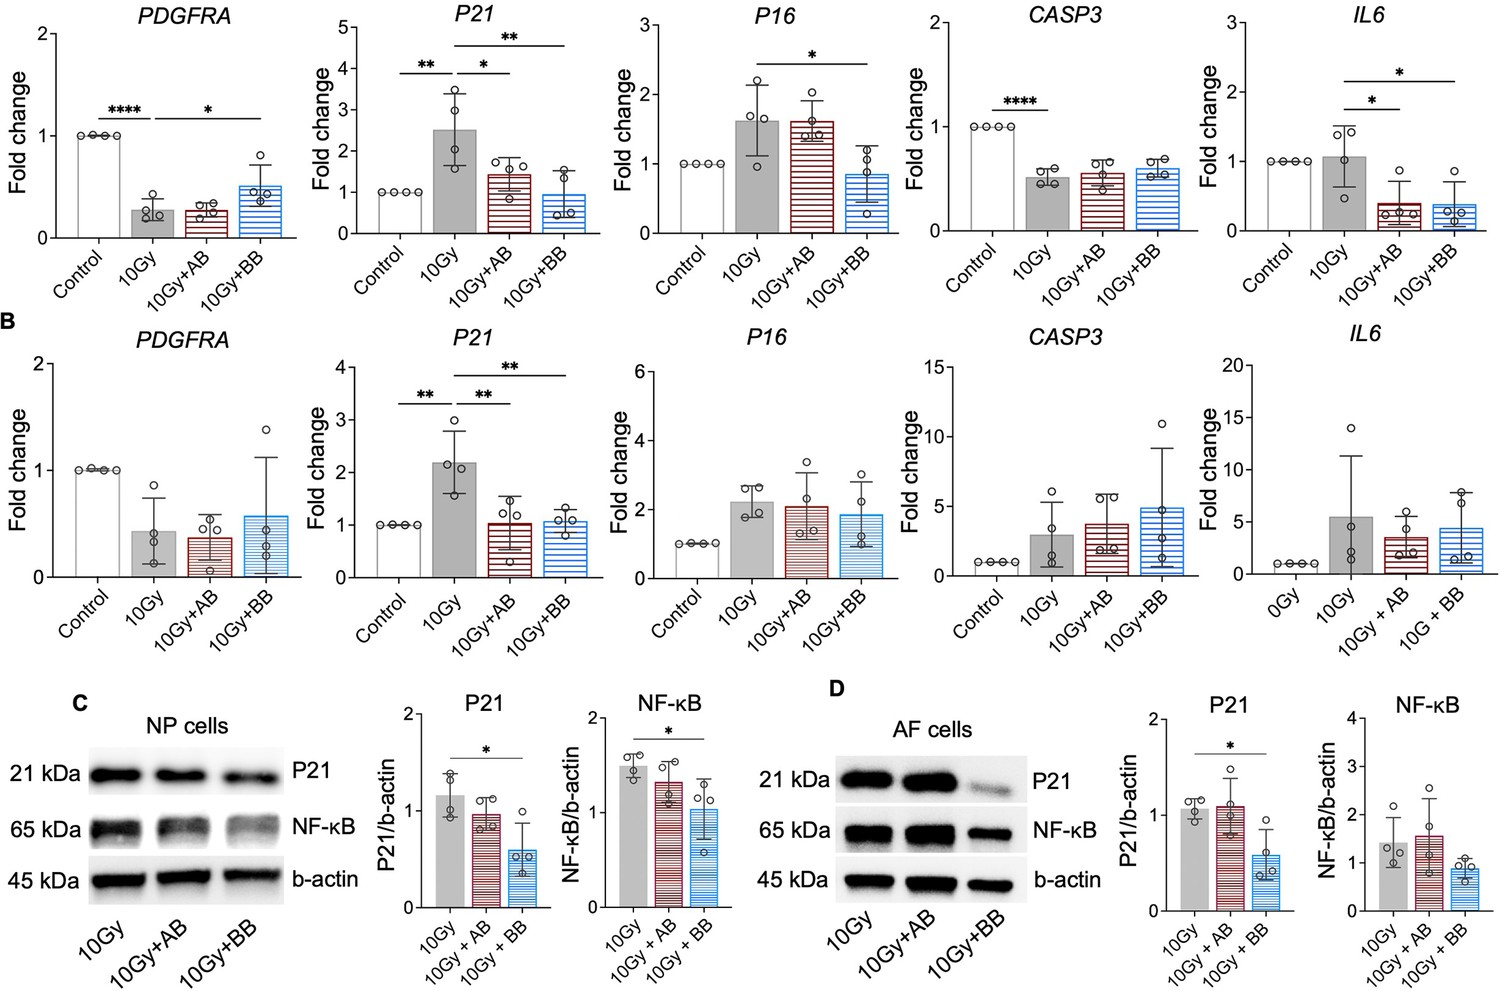
Platelet-derived growth factor (PDGF)-AB/BB treatment suppressed the expression of senescence-associated regulators.
(A, B) Changes in the gene expression of PDGFRA, P21, P16, CASP3, and IL6 in irradiated nucleus pulposus (NP) (A) and annulus fibrosus (AF) (B) cells treated with rhPDGF-AB/BB. (C, D) Protein expression levels of P21 and NF-κB in irradiated NP (C) and AF (D) cells treated with rhPDGF-AB/BB. n=4 each group. One-way ANOVA with Dunnett post hoc testing was performed. The data is presented as mean with SD. *p<0.05. **p<0.01. ****p<0.0001.
-
Figure 6—source data 1
Excel file containing the measures displayed in Figure 6.
- https://cdn.elifesciences.org/articles/103073/elife-103073-fig6-data1-v1.xlsx
-
Figure 6—source data 2
PDF file containing the original western blots for Figure 6, indicating the bands and treatments.
- https://cdn.elifesciences.org/articles/103073/elife-103073-fig6-data2-v1.zip
-
Figure 6—source data 3
Original files for western blots displayed in Figure 6.
- https://cdn.elifesciences.org/articles/103073/elife-103073-fig6-data3-v1.zip
Tables
Table 1
Donor information.
| Grade | Age | Sex | Cell type |
|---|---|---|---|
| 4 | 67 | M | NP & AF |
| 5 | 61 | M | NP & AF |
| 5 | 61 | M | NP & AF |
| 4 or 5 | 65 | F | NP & AF |
| 4 or 5 | 81 | F | AF |
| 4 | 53 | F | AF |
| 4 | 64 | F | NP |
| 1 | 19 | M | NP & AF |
| 1 | 21 | M | NP & AF |
| 1 | 25 | F | NP & AF |
| 1 | 27 | F | NP & AF |
Table 2
Sequence of primers.
| Gene | Primer sequence |
|---|---|
| P21 | Forward: 5’-GAC ACCACT GGA GGG TGA CT-3’ Reverse: 5’-CAGGTC CAC ATG GTC TTC CT-3’ |
| P16 | Forward: 5’-CCAACGCACCGAATAGTTACG-3’ Reverse: 5’-GCGCTGCCCATCATCATG-3’ |
| IL6 | Forward: 5’-CCGGGAACGAAAGAGAAGCT-3’ Reverse: 5’-GCGCTTGTGGAGAAGGAGTT-3’ |
| CCNB1 | Forward: 5’-ACTGGGTCGGGAAGTCACTG-3’ Reverse: 5’-CATTCTTAGCCAGGTGCTGC-3’ |
| CCND1 | Forward: 5’-CTGTGCTGCGAAGTGGAAAC-3’ Reverse: 5’-TCTGTTTGTTCTCCTCCGCC-3’ |
| CASP3 | Forward: 5’-TGG TTC ATC CAG TCG CTT TG-3’ Reverse: 5’-ATT CTG TTG CCA CCT TTC G-3’ |
| MKI67 | Forward: 5’-ATTTGCTTCTGGCCTTCCCC-3’ Reverse: 5’-CCAAACAAGCAGGTGCTGAG-3’ |
| ACTB | Forward: 5’-CTC TTC CAG CCT TCC TTC CT-3’ Reverse: 5’-AGC ACT GTG TTG GCG TAC AG-3’ |
Additional files
Download links
A two-part list of links to download the article, or parts of the article, in various formats.
Downloads (link to download the article as PDF)
Open citations (links to open the citations from this article in various online reference manager services)
Cite this article (links to download the citations from this article in formats compatible with various reference manager tools)
Therapeutic effects of PDGF-AB/BB against cellular senescence in human intervertebral disc
eLife 13:RP103073.
https://doi.org/10.7554/eLife.103073.3


