Small-molecule activation of TFEB alleviates Niemann–Pick disease type C via promoting lysosomal exocytosis and biogenesis
- Collaborative Innovation Center of Yangtze River Delta Region Green Pharmaceuticals, College of Pharmaceutical Sciences, Zhejiang University of Technology, China
- Department of Molecular, Cellular, and Developmental Biology, University of Michigan, United States
Figures
Figure 1 with 6 supplements
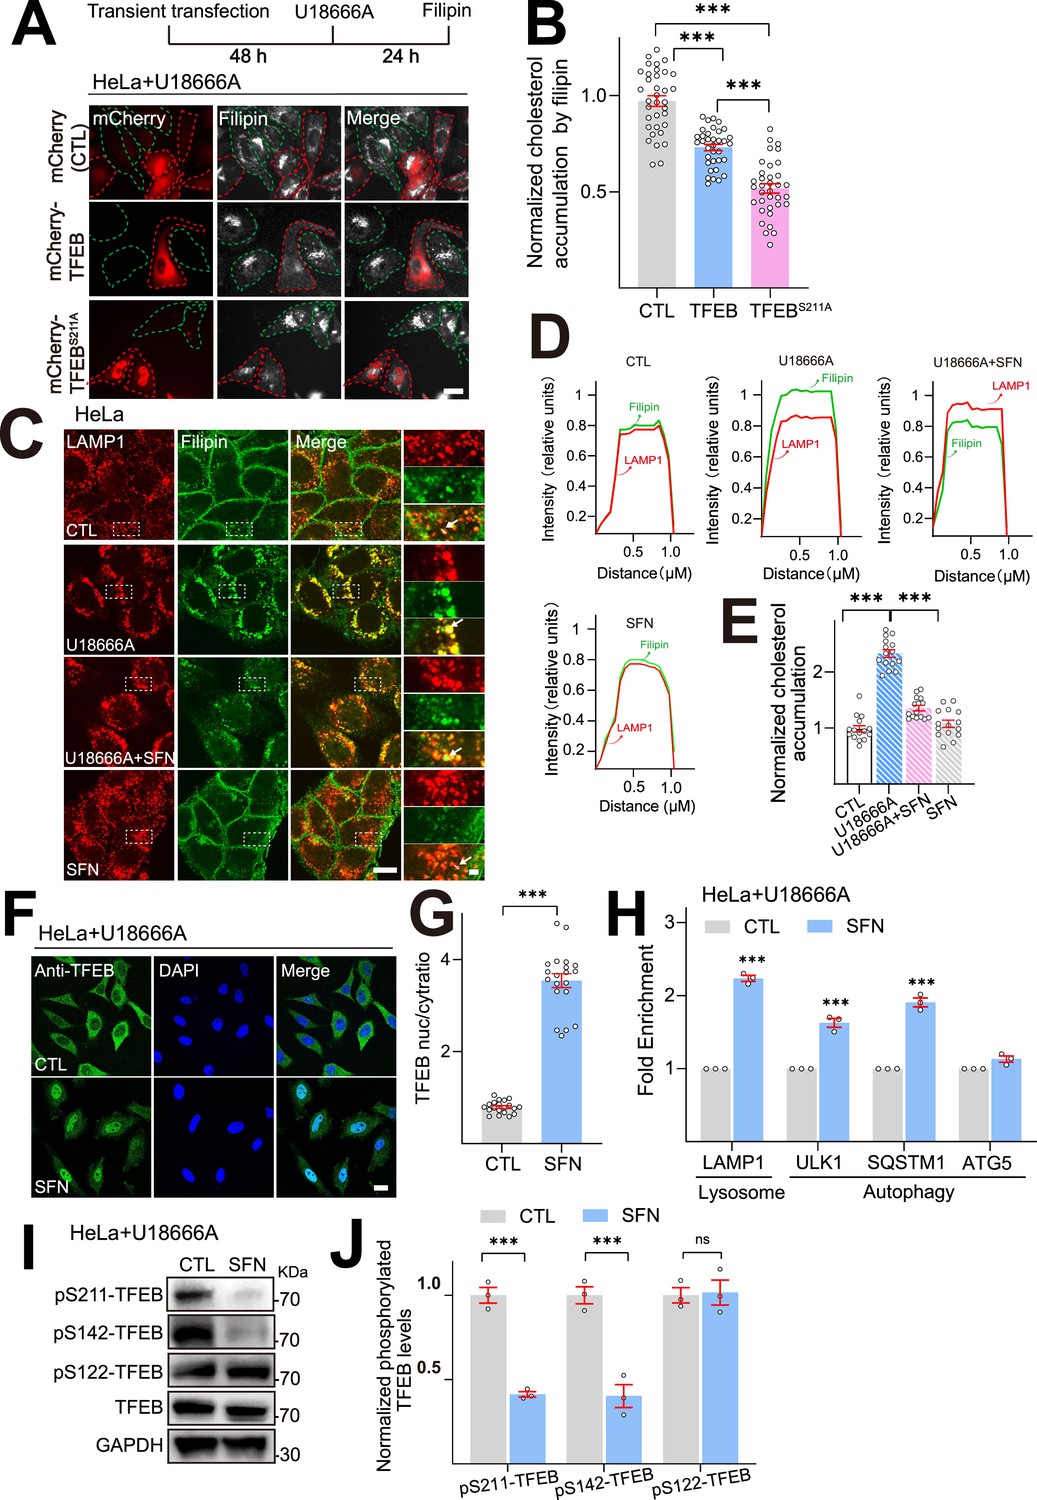
TFEB overexpression or pharmacological activation of TFEB ameliorates cholesterol accumulation in U18666A-induced HeLa NPC1 model.
(A) Overexpression of TFEB/TFEB S211A reduced cellular cholesterol levels in U18666A-induced HeLa NPC1 model. Filipin staining of HeLa transiently transfected by mCherry, mCherry-TFEB and mCherry- TFEB S211A plasmid for 48 h, followed by U18666A (2.5 μM) for 24 h. Overlay phase-contrast images are shown together with the red (mCherry-TFEB/TFEB S211A) and white (filipin). In each image, the red circles point to the successfully transfected cells, green circles represent the untransfected cells. Scale bar, 20 μm. (B) Quantification of cholesterol accumulation from (A). N = 30 randomly selected cells from n = 3 independent experiments. (C) Sulforaphane (SFN) reduces lysosomal (LAMP1) cholesterol accumulation (filipin) in HeLa NPC1 cells. HeLa cells were exposed to U18666A (2.5 μM) in the absence or the presence of SFN (15 μM) for 24 h. Each panel shows fluorescence images taken by confocal microscopes. The red signal is LAMP1-mCherry driven by stable transfection, and the green signal is filipin. (D) Each panel shows the fluorescence intensity of a line scan (white line on the blown-up image) through the double-labeled object indicated by the white arrow. Scale bar, 20 μm or 2 μm (for zoom-in images). (E) Quantification of cholesterol levels shown in (C). N = 15 randomly selected cells from n = 3 experiments. (F) SFN (15 μM, 24 h) induced TFEB nuclear translocation in HeLa NPC1 cells. Nuclei were counterstained with DAPI (blue). Scale bar, 20 μm. (G) Average ratios of nuclear vs. cytosolic TFEB immunoreactivity shown in (F). N = 20 randomly selected cells from n = 3 experiments. (H) SFN-induced mRNA expression of TFEB target genes in HeLa NPC1 model. HeLa cells were cotreated with U18666A (2.5 µM) and SFN (15 μM) for 24 h (n = 3). (I) Western blot analysis of TFEB phosphorylation by SFN (15 μM, 24 h) in HeLa NPC1 cells. (J) Quantification of ratios of pS211-, pS142-, pS122-TFEB vs. total TFEB as shown in (I) (n = 3). For all the panels, average data are presented as mean ± s.e.m.; ***p<0.001.
-
Figure 1—source data 1
Original western blots for Figure 1I, indicating the relevant bands and treatments.
- https://cdn.elifesciences.org/articles/103137/elife-103137-fig1-data1-v1.zip
-
Figure 1—source data 2
Original files for western blot analysis displayed in Figure 1I.
- https://cdn.elifesciences.org/articles/103137/elife-103137-fig1-data2-v1.zip
Figure 1—figure supplement 1
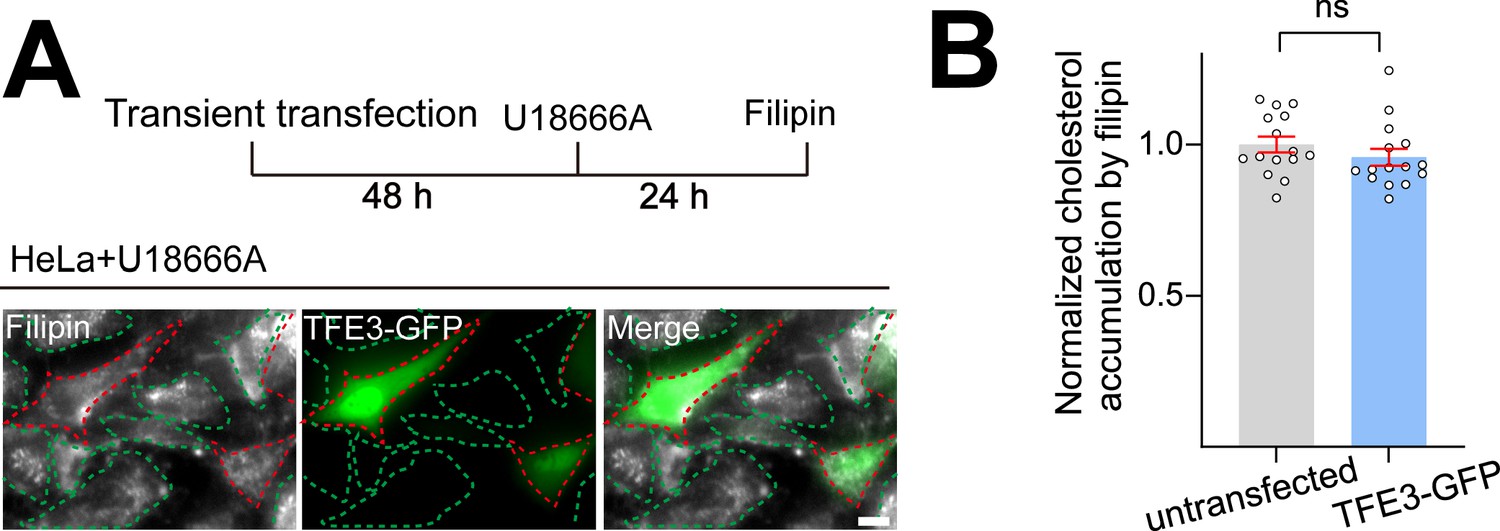
The effect of TFE3 overexpression on lysosomal cholesterol levels in HeLa NPC1 model.
(A) HeLa cells were transiently transfected with TFE3-GFP plasmid for 48 h, followed by U18666A (2.5 μM, 24 h) treatment and Filipin staining was carried out. Overlay phase contrast images are shown together with the green (TFEB-GFP) and white (filipin). In each image, the red circles point to the successfully transfected cells, green circles represent the untransfected cells. Scale bar, 20 μm. (B) Quantification of cholesterol levels in untransfected and TFEB-GFP-transfected cells from (A). N = 15 randomly selected cells from n = 3 independent experiments. Data are presented as mean ± s.e.m.
Figure 1—figure supplement 2
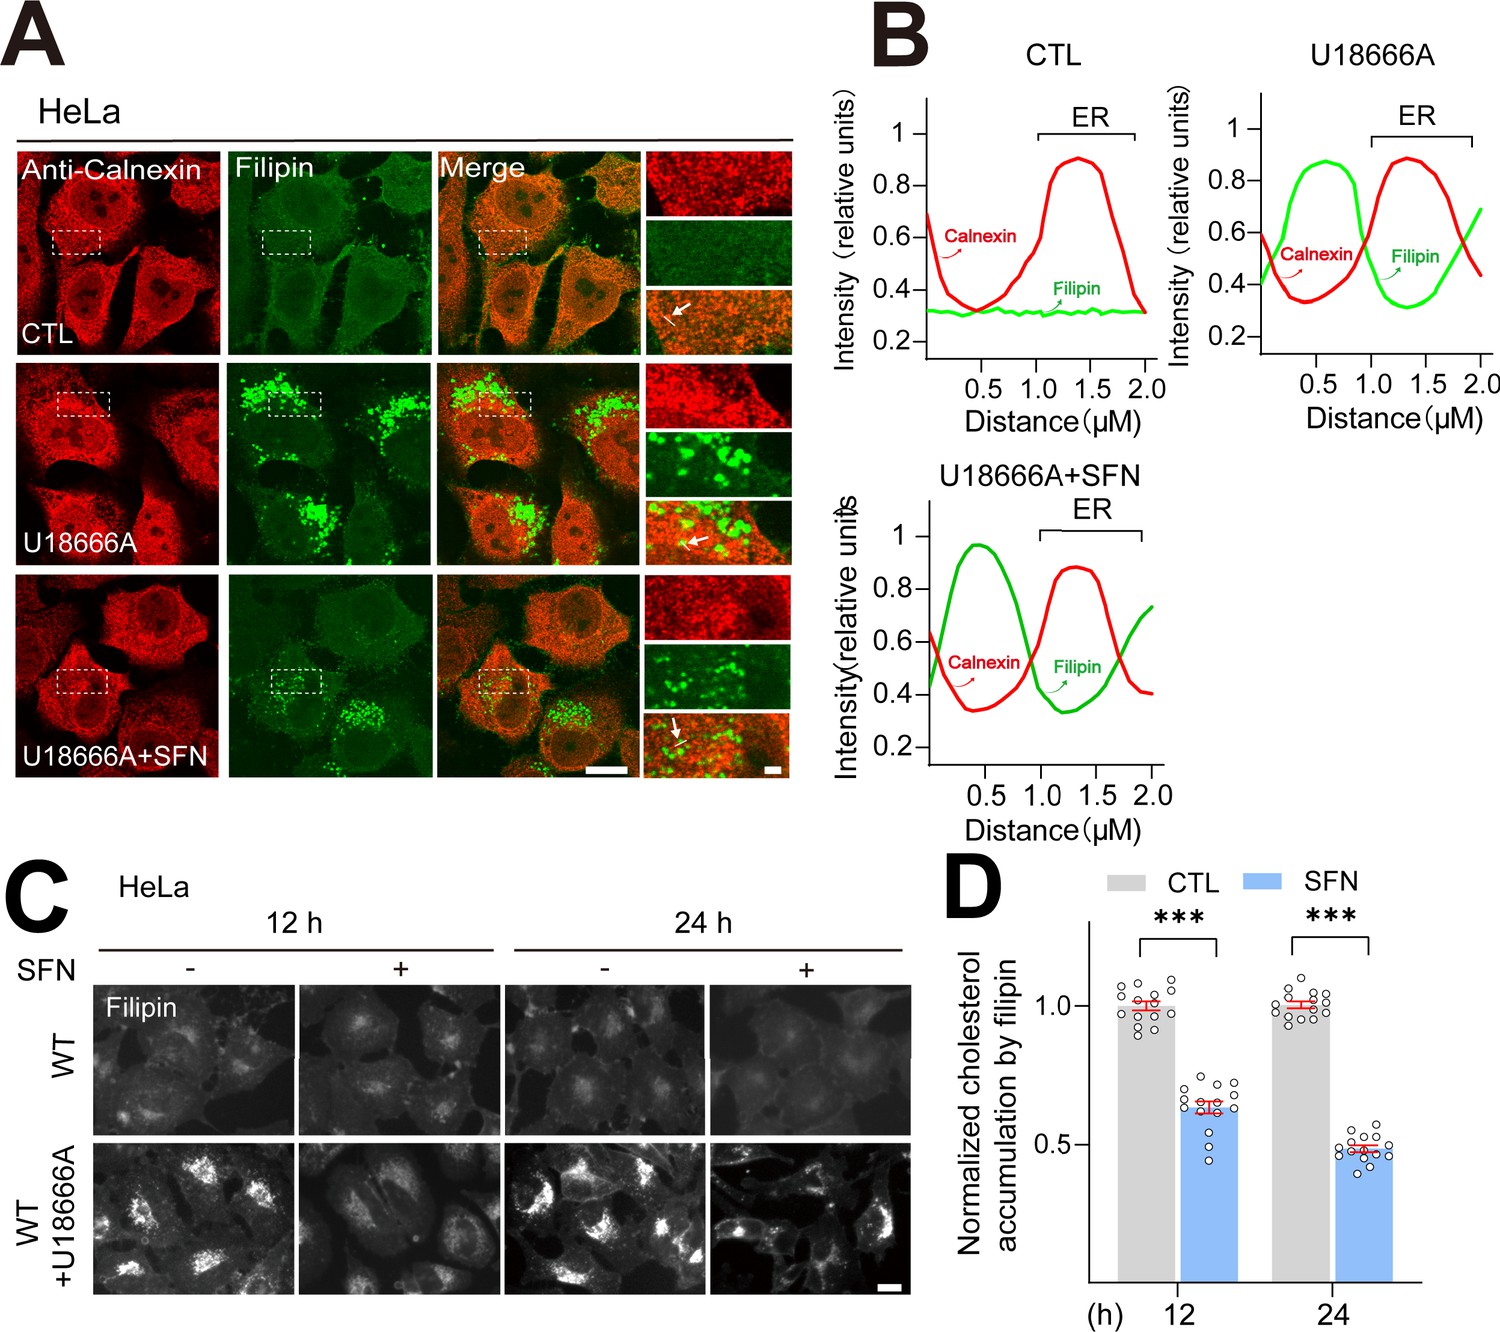
Filipin signal is not colocalized with ER marker calnexin in HeLa NPC1 cells.
(A) HeLa cells were exposed to U18666A (2.5 μM) in the absence or the presence of sulforaphane (SFN) (15 μM) for 24 h. Each panel shows fluorescence images taken by confocal microscopes. The red signal is calnexin (ER marker), and the green signal is filipin. (B) The graph shows the fluorescence intensity of a line scan (white line on the blown-up image) through the double-labeled object indicated by the white arrow. (C) SFN reduces cholesterol accumulation in HeLa NPC1 cells. HeLa cells were cotreated with U18666A (2.5 µM) and SFN (15 µM) for 12–24 h and stained with filipin. Scale bar, 20 µm. (D) Quantification of cholesterol levels shown in (C). N = 15 randomly selected cells from n = 3 experiments. Data are presented as mean ± s.e.m.; ***p<0.001.
Figure 1—figure supplement 3
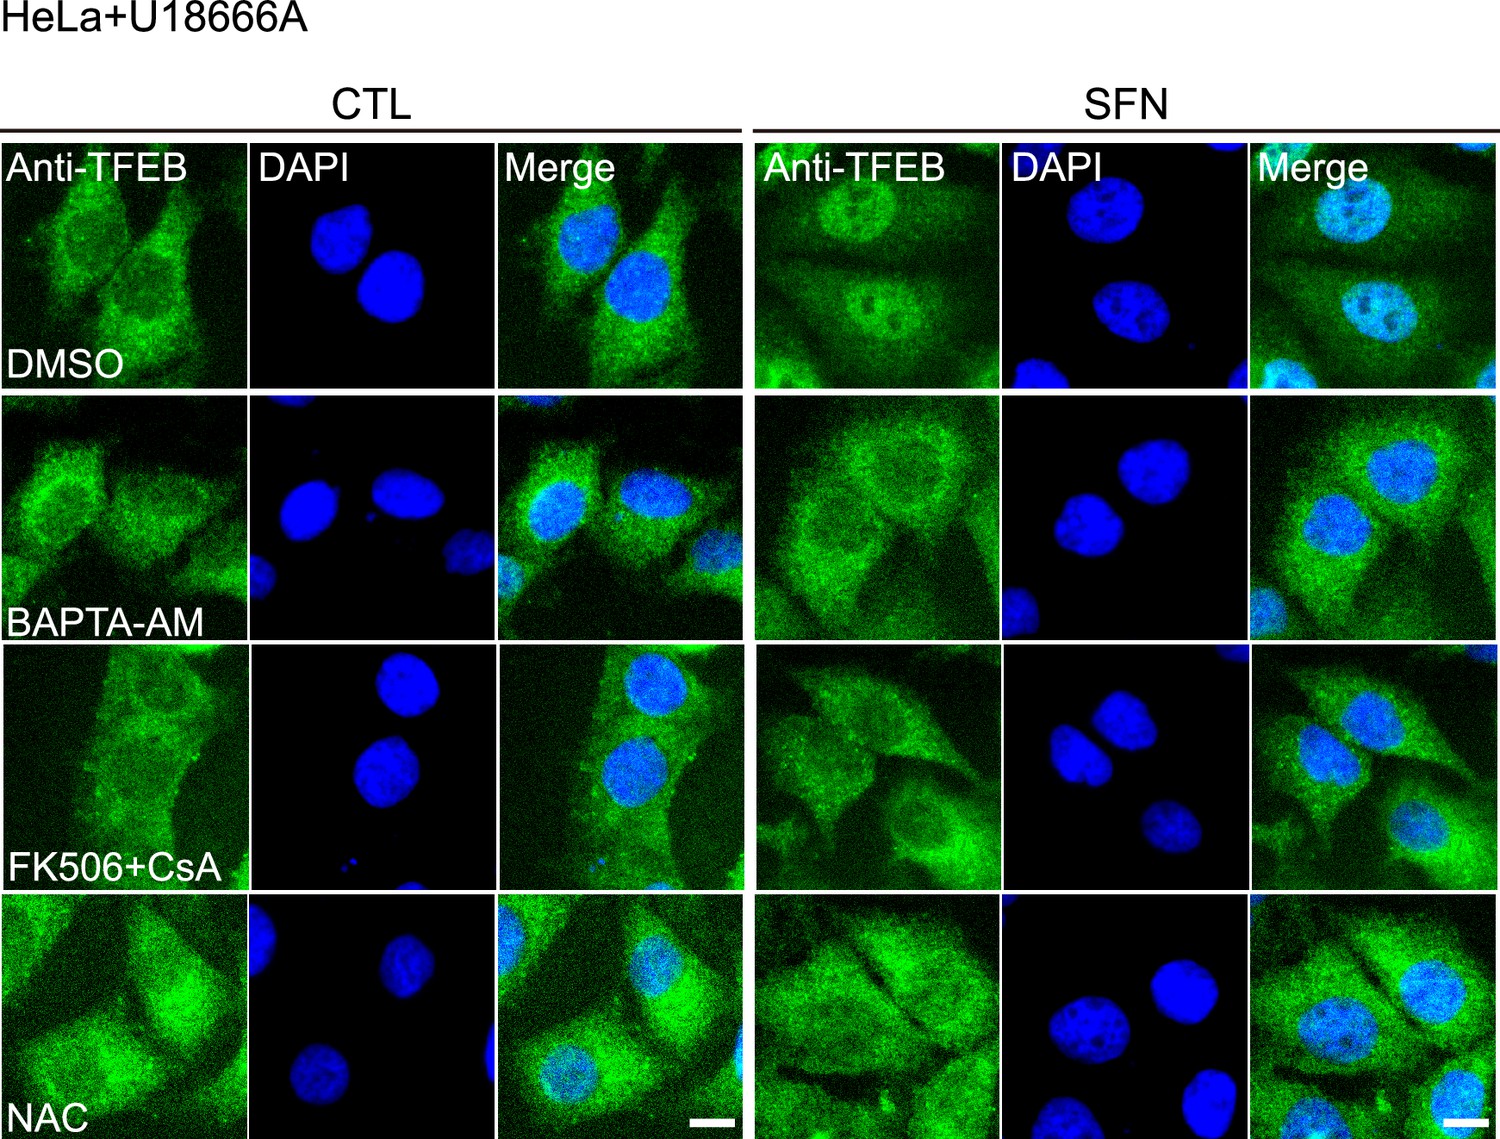
Sulforaphane (SFN)-induced TFEB nuclear translocation via a ROS-Ca2+-calcineurin pathway in HeLa NPC1 cells.
The effect of FK506 (5 µM) + CsA (10 µM), BAPTA-AM (10 µM), or NAC (5 mM) pretreatment on SFN (15 µM, 4 h)-mediated TFEB nuclear translocation in HeLa NPC1 cells. Scale bar: 10 µm.
Figure 1—figure supplement 4
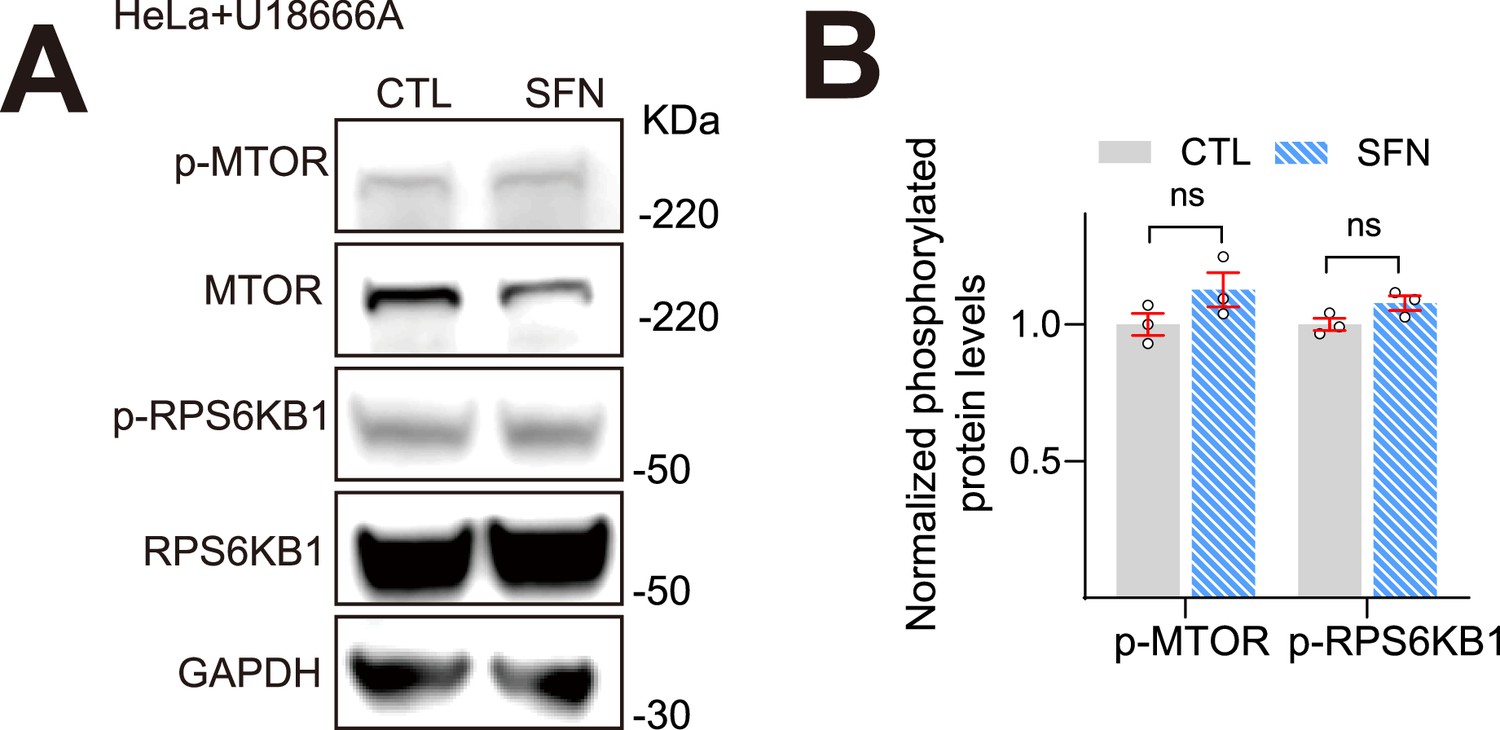
Western blot analysis of the phosphorylation status of MTOR and RPS6KB1 by sulforaphane (SFN).
(A) HeLa cells were co-treated with U18666A (2.5 μM) and SFN (15 μM) for 24 h. Then MTOR and RPS6KB1 activity was detected via ratios of p-MTOR vs. total MTOR and p-RPS6KB1 vs. total RPS6KB1 by western blotting. (B) Quantification of the results shown in (A). From n = 3 independent experiments. Data are presented as mean ± s.e.m.
-
Figure 1—figure supplement 4—source data 1
Original western blots for Figure 1—figure supplement 4A, indicating the relevant bands and treatments.
- https://cdn.elifesciences.org/articles/103137/elife-103137-fig1-figsupp4-data1-v1.zip
-
Figure 1—figure supplement 4—source data 2
Original files for western blot analysis displayed in Figure 1—figure supplement 4A.
- https://cdn.elifesciences.org/articles/103137/elife-103137-fig1-figsupp4-data2-v1.zip
Figure 1—figure supplement 5

Western blot analysis of NPC1 expression in human NPC1 patient fibroblasts.
Human NPC1-patient fibroblasts were treated with SFN (15 μM) for 24 h, then the expression levels of NPC1 protein were detected by western blotting.
-
Figure 1—figure supplement 5—source data 1
Original western blots for Figure 1—figure supplement 5, indicating the relevant bands and treatments.
- https://cdn.elifesciences.org/articles/103137/elife-103137-fig1-figsupp5-data1-v1.zip
-
Figure 1—figure supplement 5—source data 2
Original files for western blot analysis displayed in Figure 1—figure supplement 5.
- https://cdn.elifesciences.org/articles/103137/elife-103137-fig1-figsupp5-data2-v1.zip
Figure 1—figure supplement 6
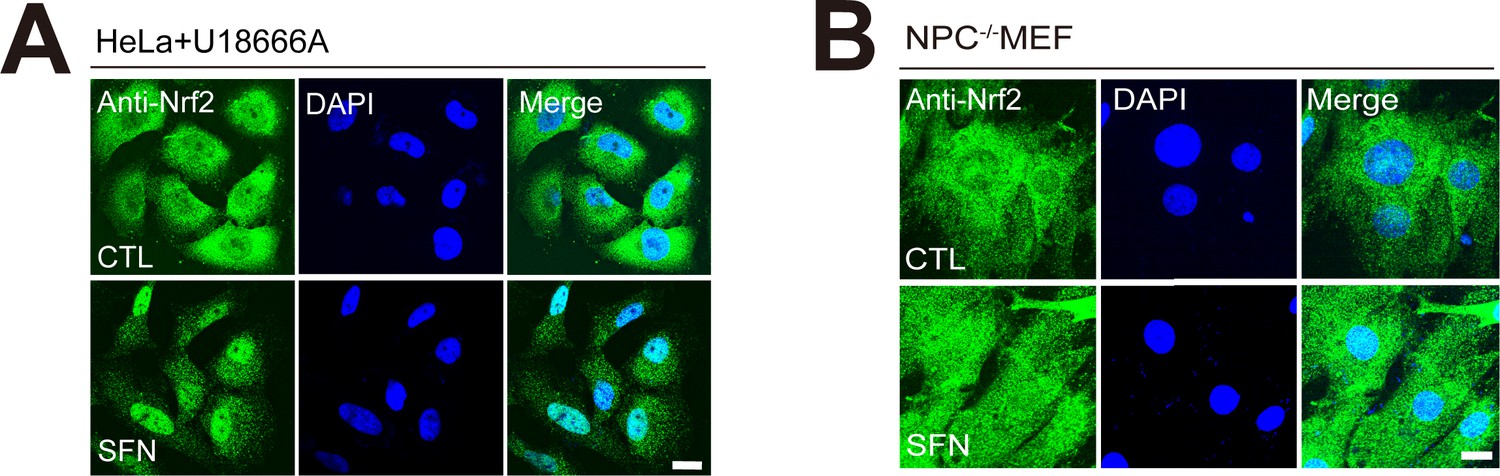
Sulforaphane (SFN) induced Nrf2 nuclear translocation in NPC cells.
SFN (15 μM, 4 h) induced Nrf2 translocation from cytosol to nuclei in (A) HeLa NPC1 and (B) Npc1-/-MEF cells. Nuclei were counterstained with DAPI (blue). Scale bar: 10 μm.
Figure 2
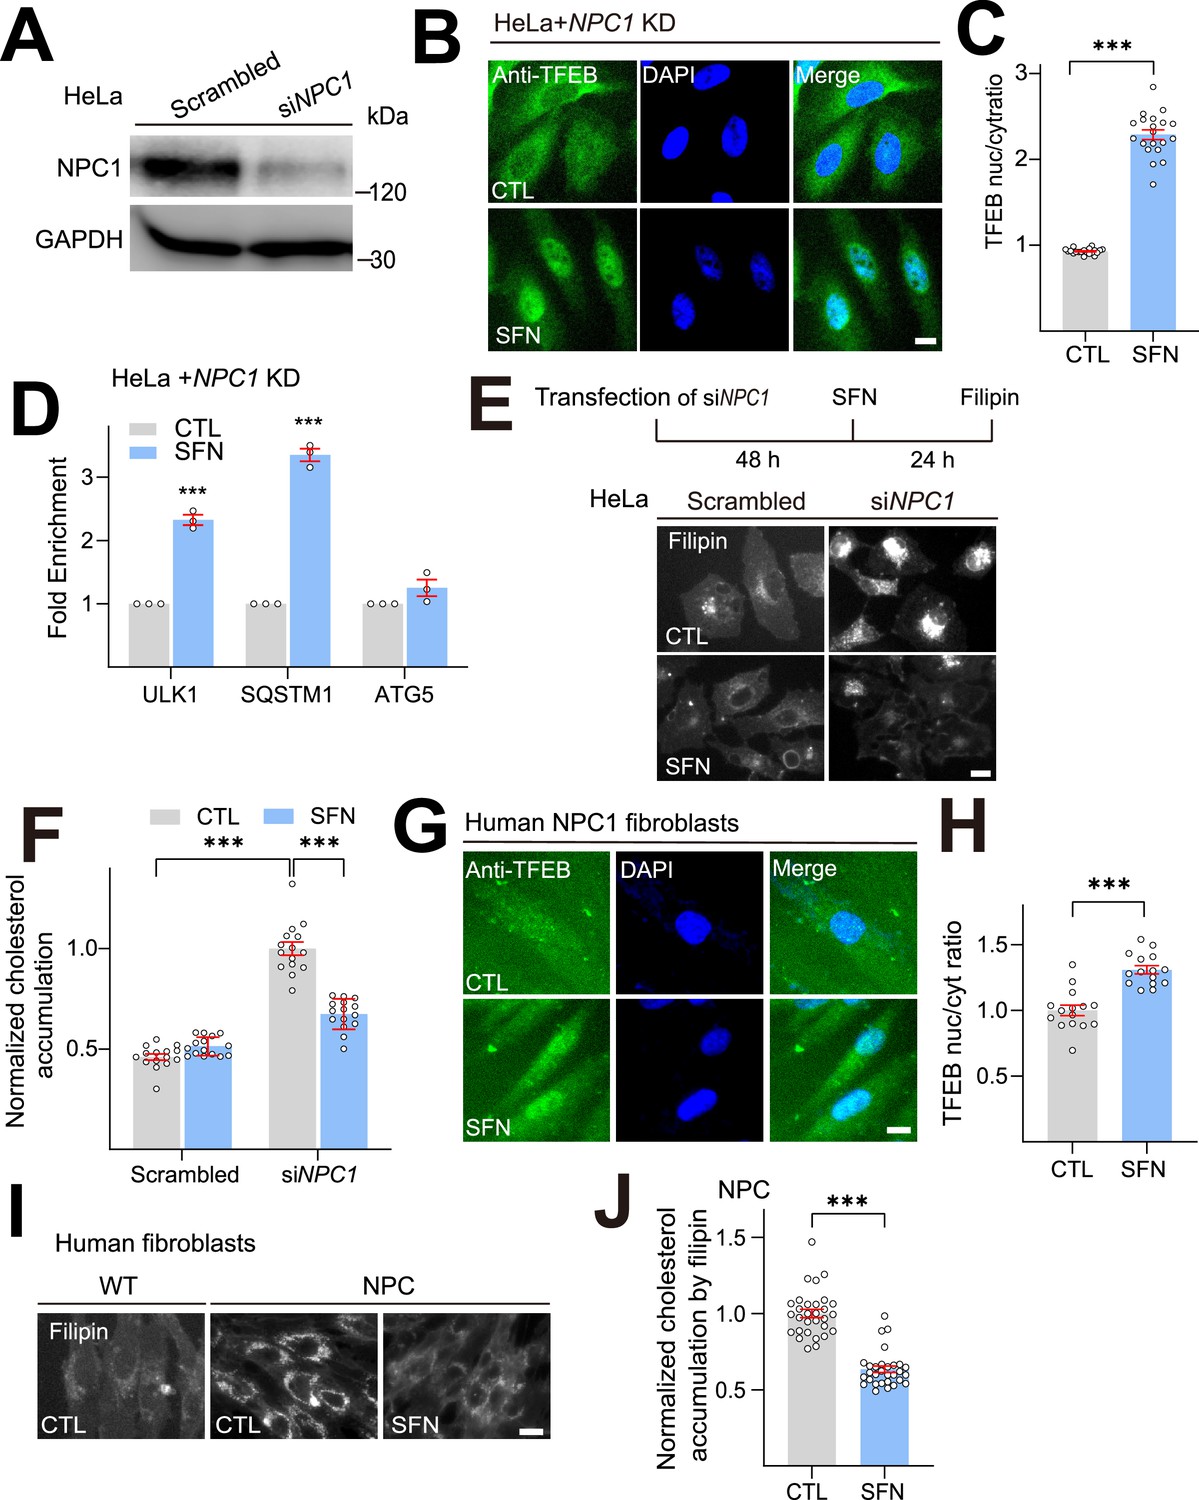
Sulforaphane (SFN) promotes cholesterol clearance in various human NPC1 cell models.
(A) Western blot analysis of the KD efficiency of a specific NPC1-targeting siRNA in HeLa cells (n = 3 independent repeats). (B) SFN-induced TFEB nuclear translocation in NPC1 KD HeLa cells. Detection of TFEB immunoreactivity in HeLa cells transiently transfected with siNPC1 for 48 h, followed by SFN (15 μM) treatment for 24 h. Scale bar, 20 μm. (C) Average ratios of nuclear vs. cytosolic TFEB immunoreactivity shown in (B). N = 20 randomly selected cells from three independent repeats. (D) In NPC1 KD HeLa cells, SFN (15 μM, 24 h) upregulated expression of TFEB target genes (n = 3 independent repeats). (E) SFN promoted cholesterol clearance in NPC1 KD HeLa cells. HeLa cells were transiently transfected by siNPC1 for 48 h, followed by SFN (15 μM) treatment for 24 h. Scale bar, 20 μm. (F) Quantification of cholesterol accumulation in NPC1 KD HeLa cells shown in (E). N = 15 randomly selected cells from three independent repeats. (G) SFN (15 μM, 24 h)-induced TFEB nuclear translocation in human NPC1 fibroblasts. Nuclei were counterstained with DAPI (blue). Scale bar, 20 μm. (H) Quantification of nuclear vs. cytosolic TFEB ratio as shown in (G). N = 20 randomly selected cells from at least three independent experiments. (I) SFN promoted cholesterol clearance in human NPC1-patient fibroblasts. Human NPC1 fibroblasts were treated with SFN (15 µM, 24 h) and filipin staining was carried out. Scale bar, 20 µm. (J) Quantification of cholesterol accumulation as shown in (I). N = 30 randomly selected cells from three independent repeats. For all the panels, average data are presented as mean ± s.e.m.; ***p<0.001.
-
Figure 2—source data 1
Original western blots for Figure 2A, indicating the relevant bands and treatments.
- https://cdn.elifesciences.org/articles/103137/elife-103137-fig2-data1-v1.zip
-
Figure 2—source data 2
Original files for western blot analysis displayed in Figure 2A.
- https://cdn.elifesciences.org/articles/103137/elife-103137-fig2-data2-v1.zip
Figure 3
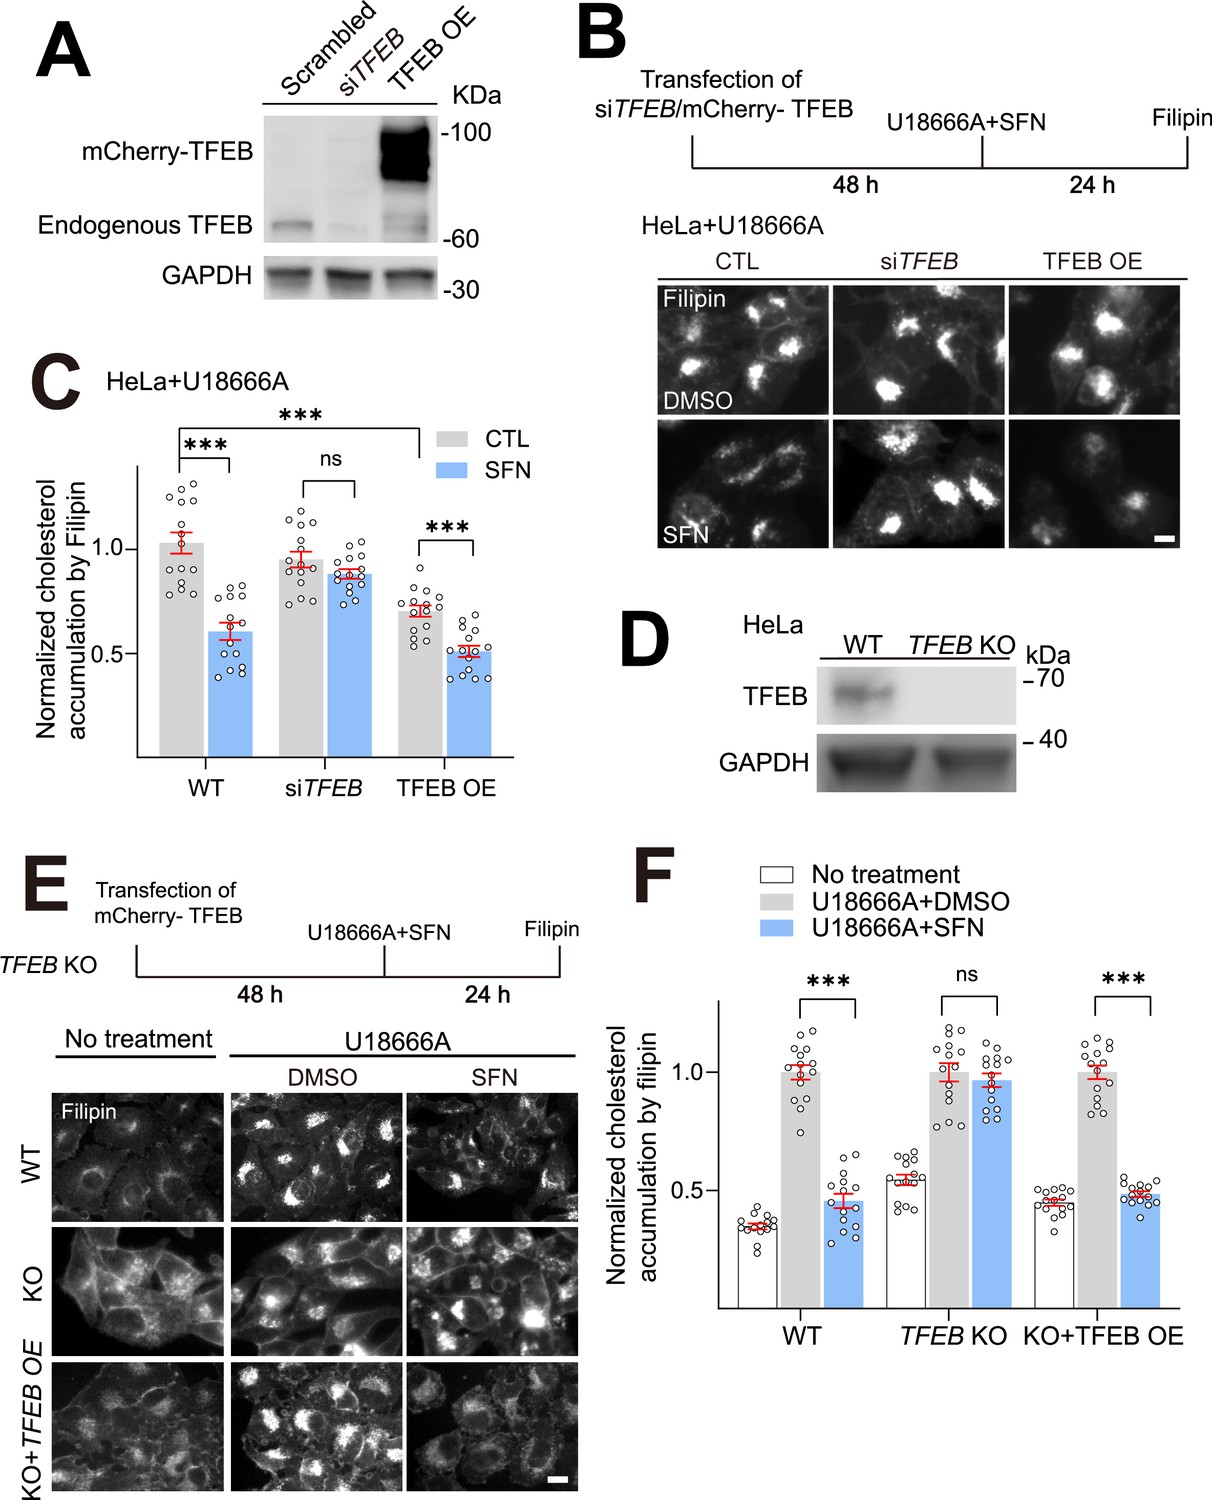
TFEB is required for sulforaphane (SFN)-promoted cholesterol clearance.
(A) Western blot analysis of the efficiency of siTFEB KD and mCherry-TFEB OE in HeLa cells. (B) HeLa cells were transfected with siTFEB or mCherry-TFEB for 48 h, followed by cotreatment with U18666A (2.5 μM) and SFN (15 μM) for 24 h and cholesterol accumulation was analyzed by Filipin assay. Scale bar, 20 μm. (C) Quantification of cholesterol levels as shown in (B). N = 15 randomly selected cells from three independent repeats. (D) Western blot analysis of the efficiency of TFEB KO in HeLa cells. (E) HeLa, HeLa TFEB KO, and HeLa TFEB KO cells transient expressing mCherry-TFEB (TFEB OE, 48 h) were cotreatment with U18666A (2.5 μM) and SFN (15 μM) for 24 h, and cholesterol levels were analyzed by filipin assay. Scale bar, 20 μm. (F) Quantification analysis of cholesterol accumulation as shown in (E). N = 15 randomly selected cells from at least three independent experiments. Average data are presented as mean ± s.e.m.; ***p<0.001.
-
Figure 3—source data 1
Original western blots for Figure 3A, indicating the relevant bands and treatments.
- https://cdn.elifesciences.org/articles/103137/elife-103137-fig3-data1-v1.zip
-
Figure 3—source data 2
Original files for western blot analysis displayed in Figure 3A.
- https://cdn.elifesciences.org/articles/103137/elife-103137-fig3-data2-v1.zip
-
Figure 3—source data 3
Original western blots for Figure 3D, indicating the relevant bands and treatments.
- https://cdn.elifesciences.org/articles/103137/elife-103137-fig3-data3-v1.zip
-
Figure 3—source data 4
Original files for western blot analysis displayed in Figure 3D.
- https://cdn.elifesciences.org/articles/103137/elife-103137-fig3-data4-v1.zip
Figure 4 with 4 supplements
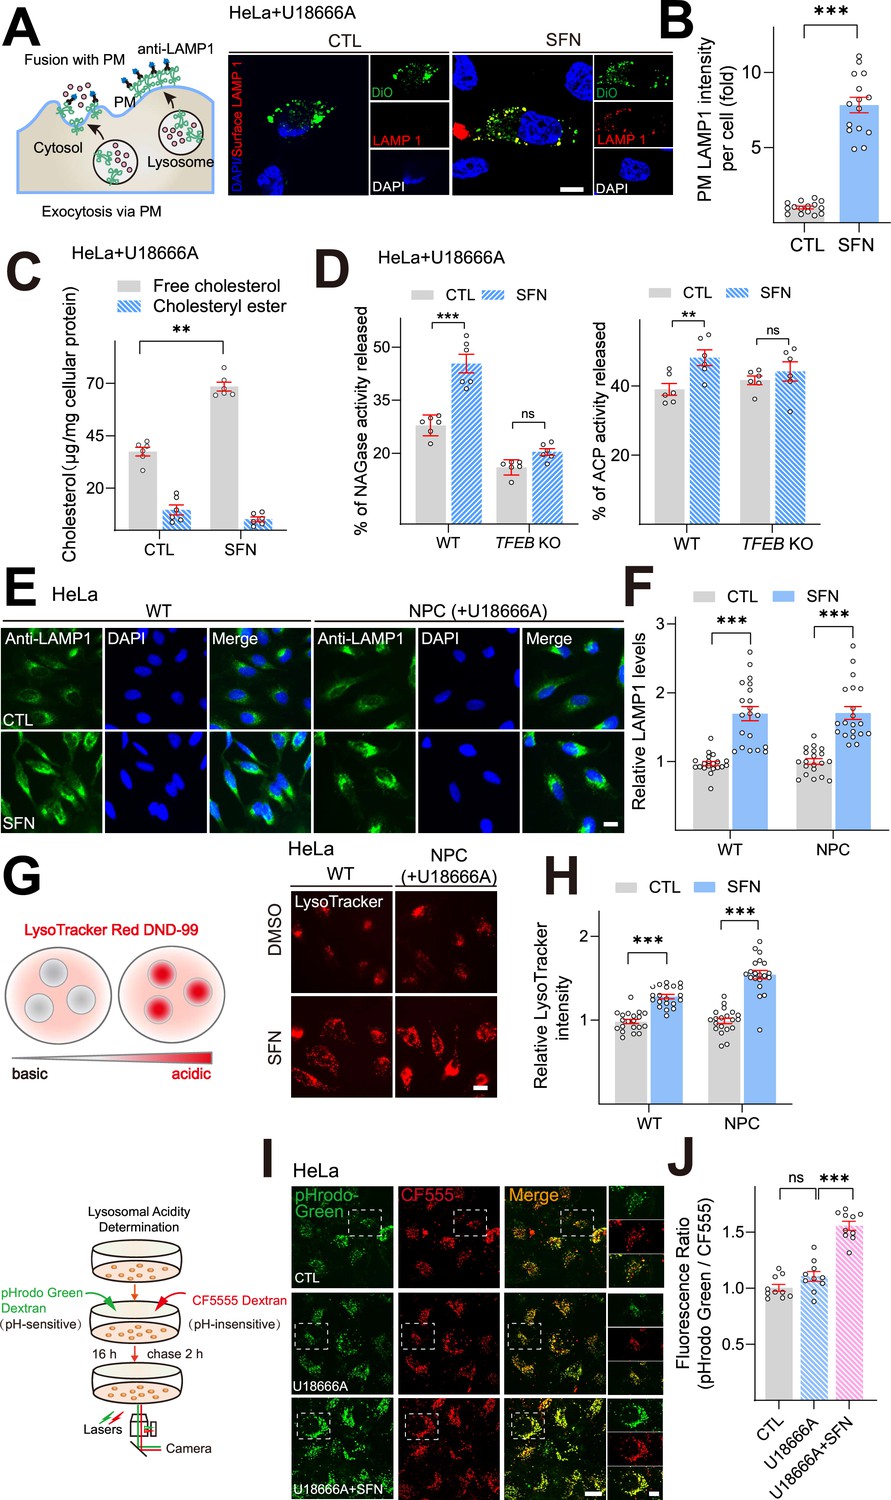
Sulforaphane (SFN) promotes lysosomal exocytosis and biogenesis in NPC1 cell models.
(A) Confocal microscopy images showing the exposure of LAMP1 on the plasma membrane (PM) in nonpermeabilized HeLa NPC1 cells treated with SFN (15 μM) for 24 h using an antibody against LAMP1 luminal portion. Nuclei were counterstained with DAPI (blue). Scale bar, 20 μm. (B) Quantitative analysis of LAMP1 levels on the PM in HeLa NPC1 cells shown in (A). Bars represent the fold increase of LAMP1 fluorescence on PM in SFN-treated cells. N = 15 randomly selected cells from three independent repeats. (C) SFN increased the release of free cholesterol into the medium. HeLa cells were cotreated with U18666A (2.5 μM) and SFN (15 μM) for 24 h, and then examined for cholesterol. The levels of cholesterol in the medium or cell lysates were measured by cholesterol assay in a reaction mixture with (measuring total cholesterol content) or without (measuring free cholesterol content) cholesterol esterase enzyme (n = 6 independent repeats). (D) SFN increased the release of lysosomal enzyme NAGases and ACP in HeLa NPC1 cells. HeLa cells were cotreated with U18666A (2.5 μM) and SFN for 24 h, and the activities of NAGases and ACP were analyzed in the medium and cell lysates (n = 6 independent repeats). (E) LAMP1 staining in HeLa cells upon U18666A treatment (2.5 μM) in the presence and absence of SFN (15 μM). Nuclei were counterstained with DAPI (blue). Scale bar, 20 μm. (F) Quantification analysis of LAMP1 immunofluorescence shown in (E). N = 20 randomly selected cells from at least three independent experiments. (G) Effects of SFN on lysosome acidity. HeLa cells were treated with 2.5 μM U18666A (24 h) in the presence and absence of 15 μM SFN (12 h) and lysosomal pH was analyzed by LysoTracker Red DND-99 (50 nM). Scale bar, 20 μm. (H) Quantification of LysoTracker intensity shown in (G). N = 20 randomly selected cells from at least three independent experiments. (I) Effects of SFN on lysosomal acidity using a ratiometric pH dye. HeLa cells were treated with U18666A (2.5 μM) in the presence and absence of SFN (15 μM), lysosomal pH was determined using a ratiometric pH dye combination (pHrodo Green dextran and CF555 dextran). Scale bar, 20 μm or 2 μm (for zoom-in images). (J) Quantification analysis of lysosomal pH shown in (I). Randomly selected cells from at least three independent experiments. For all the panels, data are presented as mean ± s.e.m.; **p<0.01, ***p<0.001.
Figure 4—figure supplement 1
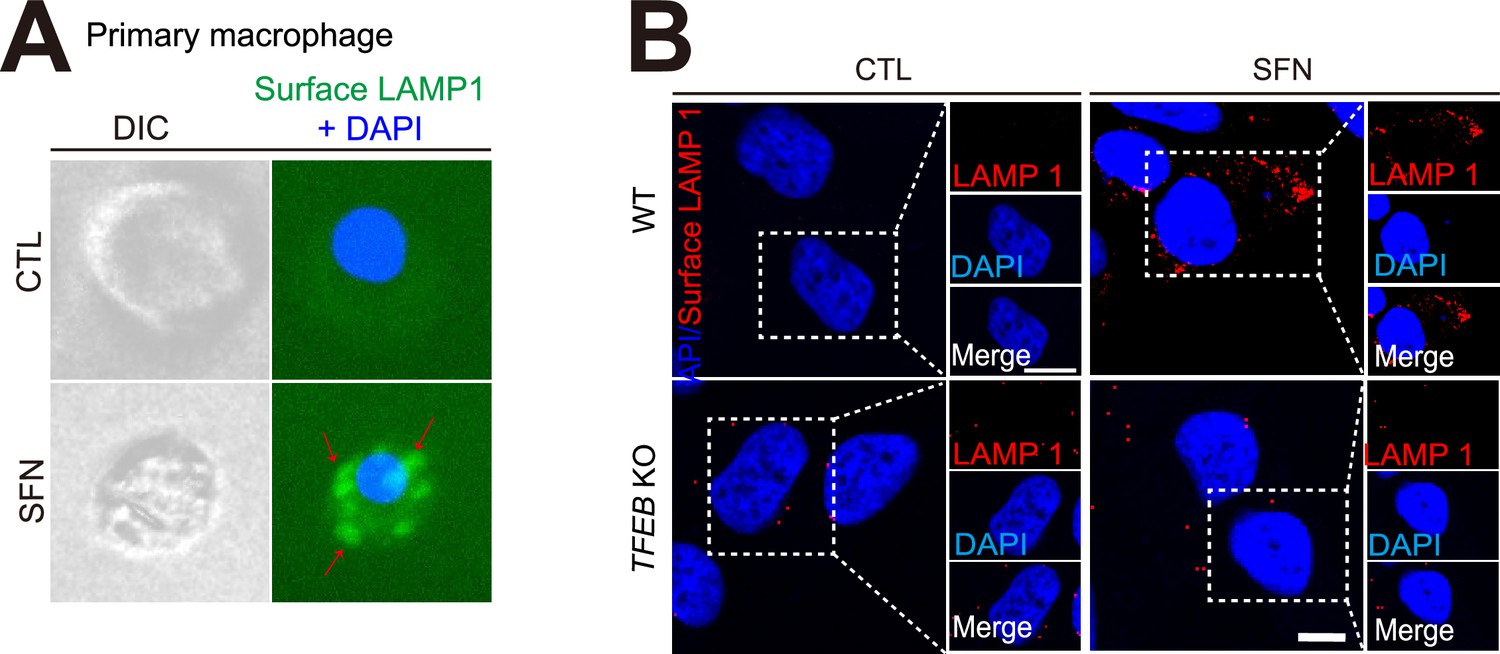
Sulforaphane (SFN) induces lysosomal exocytosis in a TFEB-dependent manner.
(A) Confocal microscopy images showing the increased signal of LAMP1 on the plasma membrane (PM) in nonpermeabilized primary macrophage cells with SFN (15 μM, 12 h). Nuclei were counterstained with DAPI (blue). Scale bar, 10 μm. (B) Surface LAMP1 staining in WT and TFEB KO HeLa cells with SFN (15 μM, 12 h). Scale bar, 10 μm.
Figure 4—figure supplement 2
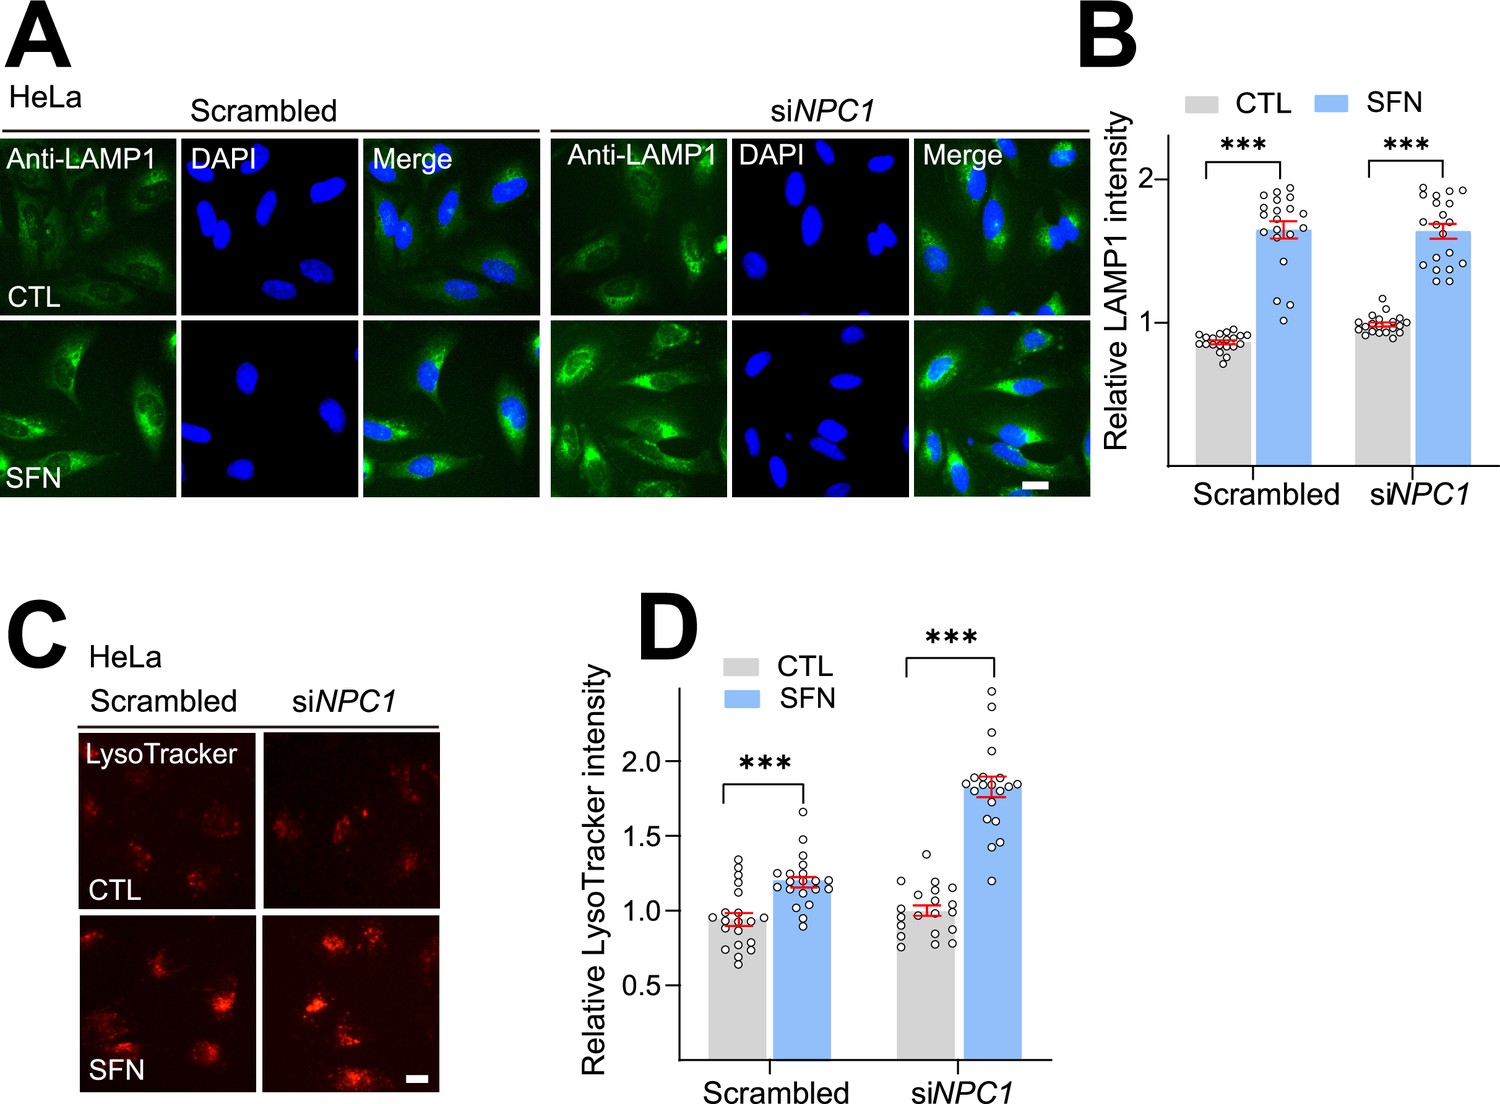
SFN promotes lysosomal biogenesis in NPC1 KD HeLa cells.
(A) LAMP1 staining of NPC1 KD HeLa cells upon SFN (15 μM, 12 h) treatment. Nuclei were counterstained with DAPI (blue). Scale bar, 20 μm. (B) Quantification analysis of LAMP1 immunofluorescence shown in (A). N = 20 randomly selected cells from n = 3 experiments. (C) LysoTracker staining of NPC1 KD HeLa cells with SFN (15 μM, 12 h) treatment. Scale bar, 20 μm. (D) Quantification of LysoTracker intensity shown in (C). N = 20 randomly selected cells from n = 3 experiments. For all the panels, data are presented as mean ± s.e.m.; ***p<0.001, ANOVA.
Figure 4—figure supplement 3
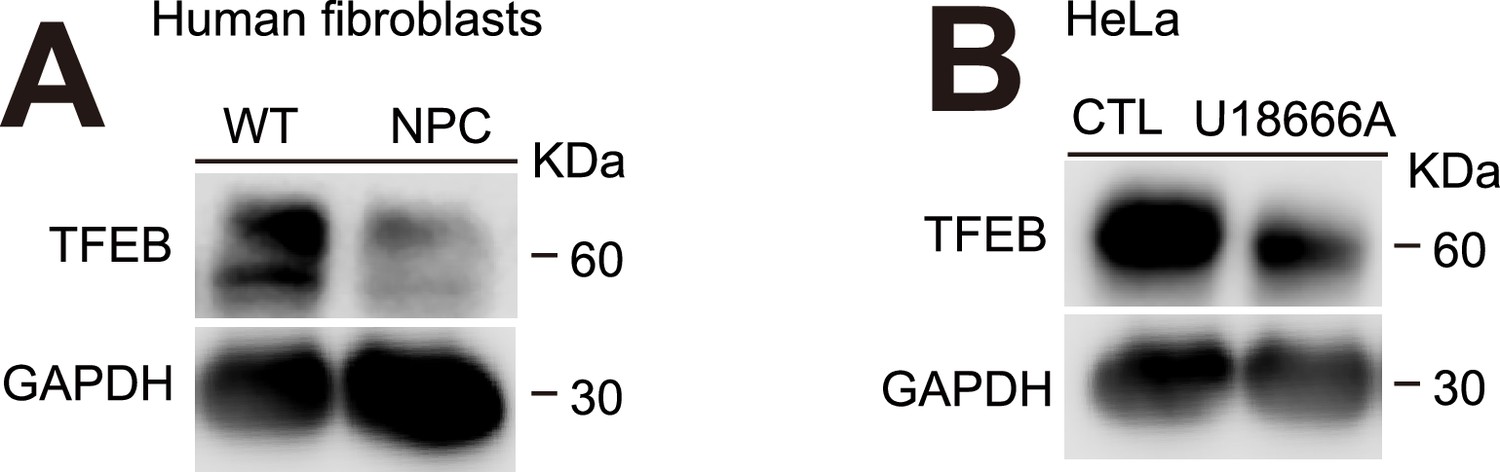
TFEB expression is downregulated in NPC1 cells.
Western blotting analysis of TFEB protein levels in (A) NPC1-patient fibroblasts and (B) HeLa NPC1 cells.
-
Figure 4—figure supplement 3—source data 1
Original western blots for Figure 4—figure supplement 3, indicating the relevant bands and treatments.
- https://cdn.elifesciences.org/articles/103137/elife-103137-fig4-figsupp3-data1-v1.zip
-
Figure 4—figure supplement 3—source data 2
Original files for western blot analysis displayed in Figure 4—figure supplement 3.
- https://cdn.elifesciences.org/articles/103137/elife-103137-fig4-figsupp3-data2-v1.zip
Figure 4—figure supplement 4

The cytotoxic effects of sulforaphane (SFN) on various cell lines.
The cell viability of SFN (15 μM, 24 h)-treated HeLa NPC1, human NPC1-patient fibroblasts, and Npc1−/− MEF cells was measured by MTT assay.
Figure 5
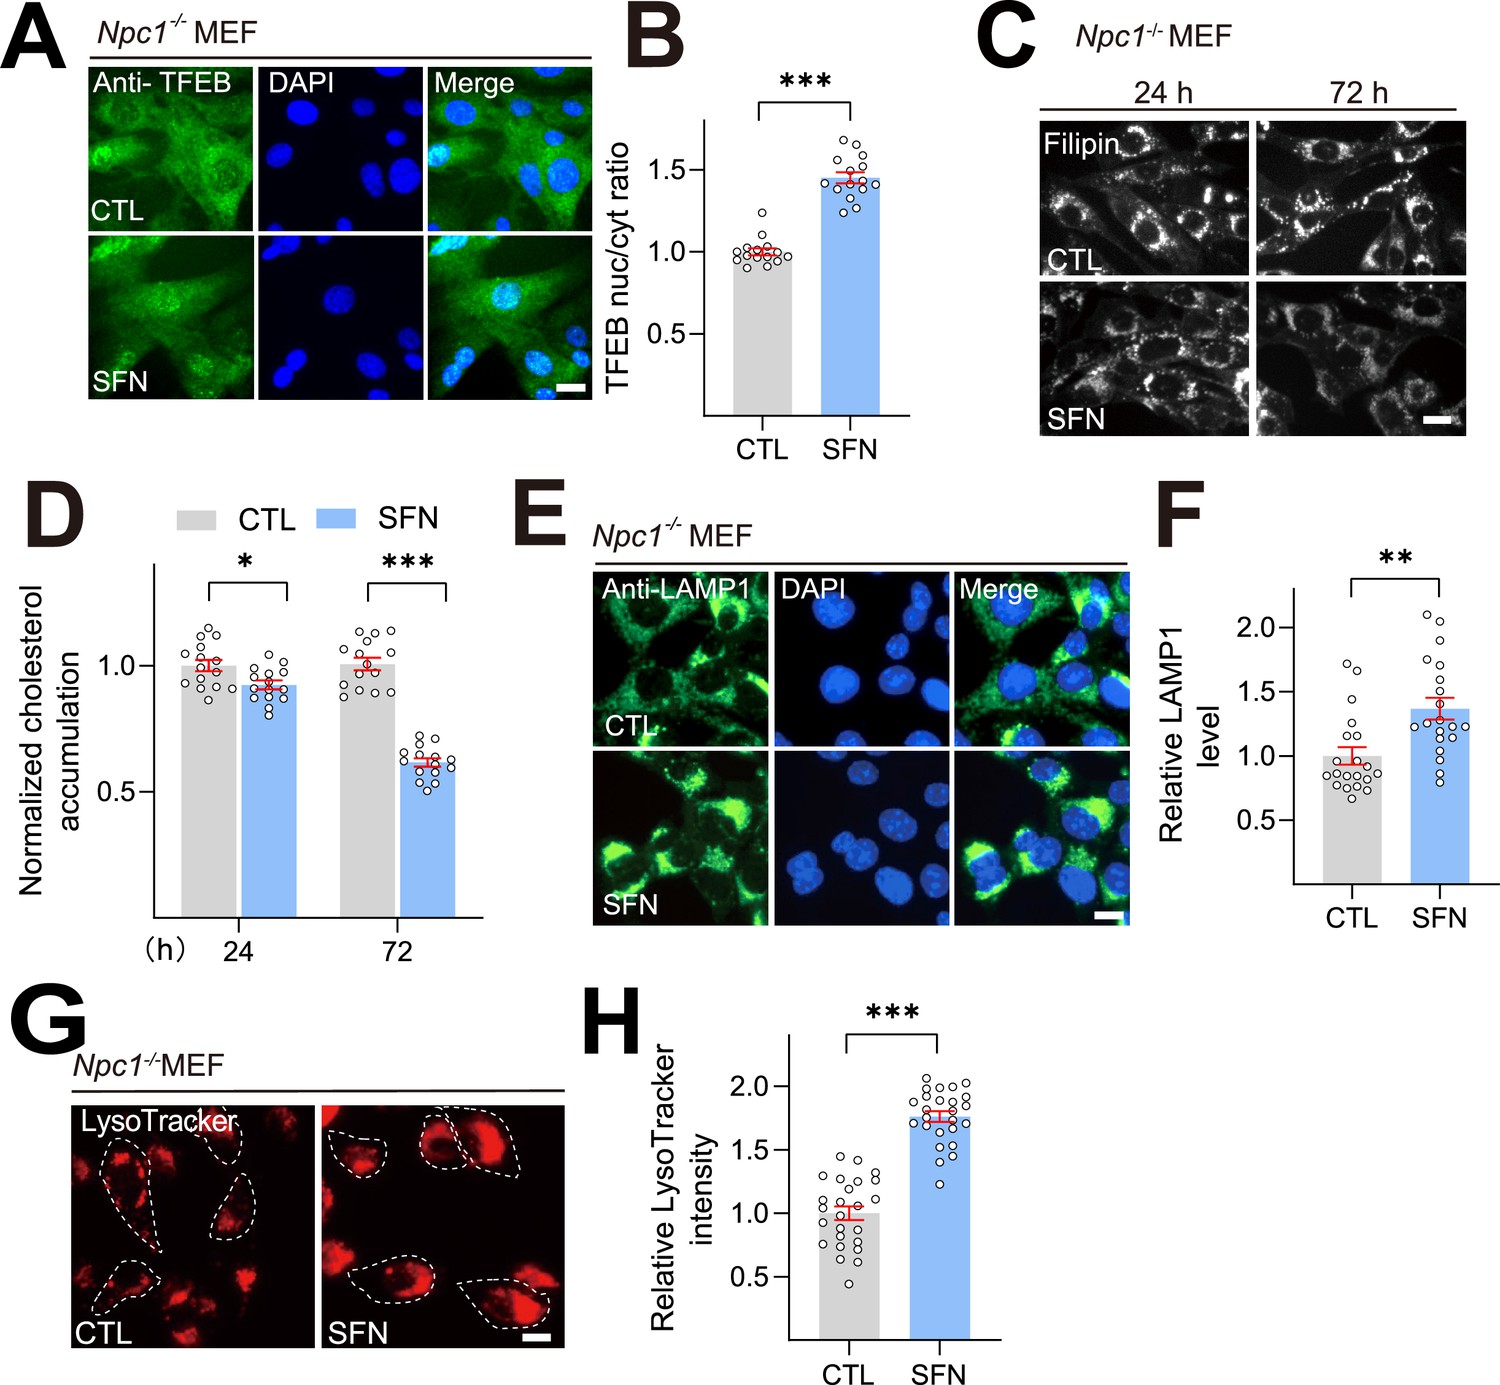
Sulforaphane (SFN) ameliorates cholesterol accumulation in Npc1-/- mouse embryonic fibroblast (MEF) cells.
(A) SFN (15 μM) treatment induced TFEB nuclear translocation in Npc1 MEF cells. Nuclei were counterstained with DAPI (blue). Scale bar, 20 μm. (B) Average ratios of nuclear vs. cytosolic TFEB immunoreactivity shown in (A). N = 20 from three independent repeats. (C) SFN (15 μM, 24–72 h) reduced cholesterol accumulation in Npc1 MEF cells by filipin assay. Scale bar, 20 μm. (D) Quantification analysis of cholesterol accumulation levels shown in (C). N = 15 randomly selected cells from at least three independent experiments. (E) Effects of SFN (15 μM, 12 h) on the intensity of LAMP1 in Npc1 MEF cells. Scale bar, 20 μm. (F) Quantification of LAMP1 intensity shown in (E). N = 20 randomly selected cells from at least three independent experiments. (G) Effects of SFN (15 μM, 12 h) on lysosome acidity in MEF cells. Scale bar, 20 μm. (H) Quantification analysis of LysoTracker intensity shown in (G). N = 20 randomly selected cells from at least three independent experiments. For all the panels, data are presented as mean ± s.e.m.; *p<0.05, **p<0.01, ***p<0.001.
Figure 6
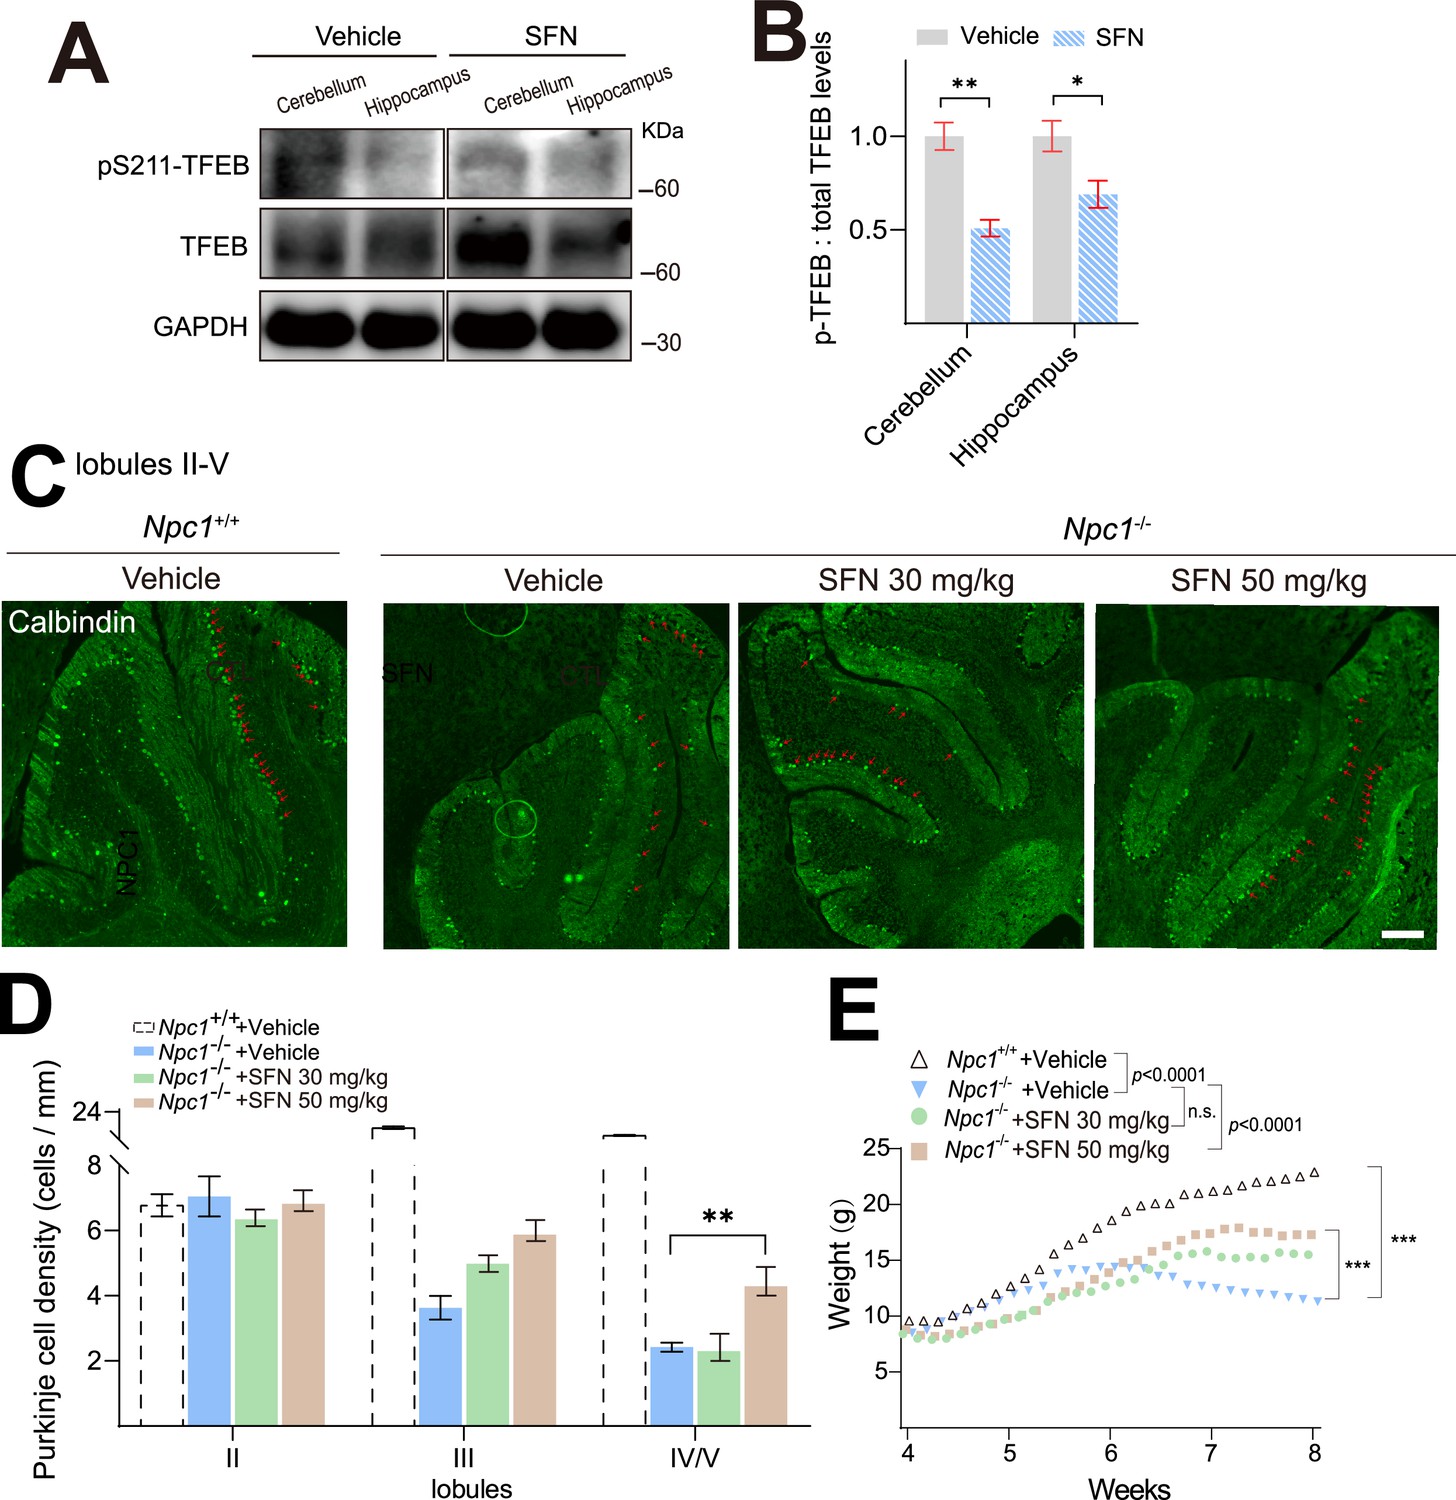
Sulforaphane (SFN) rescues the loss of Purkinje cells and body weight in NPC in vivo model mice.
(A) SFN promoted TFEB dephosphorylation in mice brain. 4-week-old BALB/cJ mice were intraperitoneally (i.p.) injected with SFN (50 mg/kg) or vehicle for 12 h, and brain tissues including cerebellum and hippocampus were collected and subjected to detect pS211-TFEB and total TFEB levels by western blotting. (B) Quantification of the ratios of p-TFEB vs. total TFEB as shown in (A). (C) Cerebella from vehicle and SFN-treated NPC mice were analyzed at 8 weeks of age for calbindin by immunohistochemistry. SFN and vehicle were intraperitoneally injected daily in 4-week-old NPC mice for 4 weeks. Scale bar = 200 μm (n = 6 for each group). (D) Quantification of the number of Purkinje cells as indicated in the anterior lobules (II–V) as shown in (C). (E) Body weight was registered during the treatment. For all the panels, data are presented as mean ± s.e.m.; **p<0.01, ***p<0.001.
-
Figure 6—source data 1
Original western blots for Figure 6A, indicating the relevant bands and treatments.
- https://cdn.elifesciences.org/articles/103137/elife-103137-fig6-data1-v1.zip
-
Figure 6—source data 2
Original files for western blot analysis displayed in Figure 6A.
- https://cdn.elifesciences.org/articles/103137/elife-103137-fig6-data2-v1.zip
Figure 7
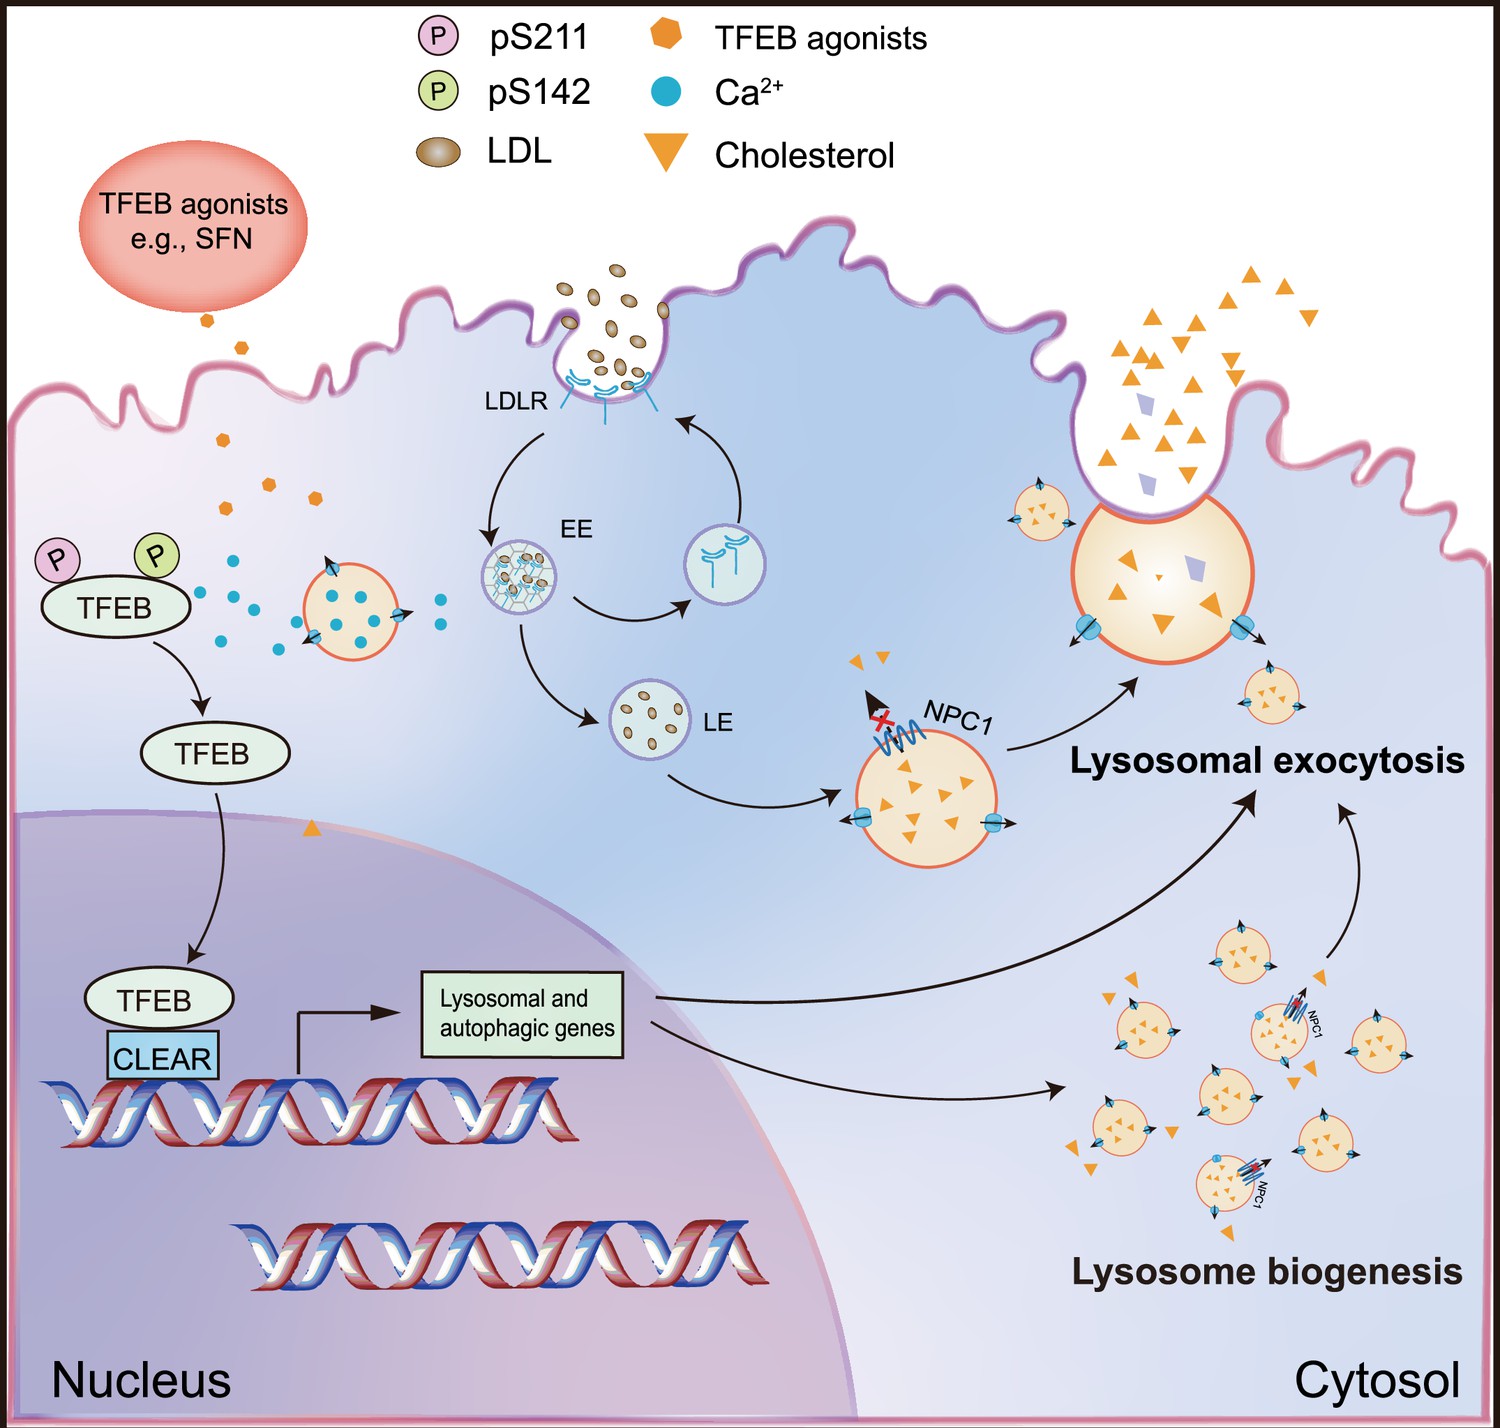
A working scheme to illustrate that small-molecule TFEB agonist promotes cholesterol clearance in the NPC model via TFEB-upregulated lysosomal exocytosis and biogenesis.
Pharmacological or genetic activation/overexpression of TFEB dramatically ameliorates cholesterol accumulation in NPC1 cells. Small-molecule, BBB-permeable TFEB agonist sulforaphane (SFN) induces TFEB nuclear translocation by dephosphorylation of TFEB at S142 and S211 residues, promoting lysosomal biogenesis and exocytosis, resulting in mitigating lysosomal cholesterol levels.
Author response image 1

The effect of NPC1 deficiency on CF555 endocytosis.
HeLa cells were transiently transfected with LAMP1-GFP plasmid for 24 h. Cells were then treated with apilimod (100 nM) for 2 h to enlarge the lysosomes, and followed by co- treatment of U18666A (2.5 μM, 24 h) and CF555 (12 h). (A) Each panel shows fluorescence images taken by confocal microscopes. (B) Each panel shows the fluorescence intensity of a line scan (white line) through the double labeled object indicated by the white arrow. Scale bar, 20 μm or 2 μm (for zoom-in images).
Additional files
-
MDAR checklist
- https://cdn.elifesciences.org/articles/103137/elife-103137-mdarchecklist1-v1.docx
-
Source data 1
All original prism graphs in the main figures.
- https://cdn.elifesciences.org/articles/103137/elife-103137-data1-v1.zip
-
Source data 2
All original prism graphs in the figure supplements.
- https://cdn.elifesciences.org/articles/103137/elife-103137-data2-v1.zip
Download links
A two-part list of links to download the article, or parts of the article, in various formats.
Downloads (link to download the article as PDF)
Open citations (links to open the citations from this article in various online reference manager services)
Cite this article (links to download the citations from this article in formats compatible with various reference manager tools)
Small-molecule activation of TFEB alleviates Niemann–Pick disease type C via promoting lysosomal exocytosis and biogenesis
eLife 13:RP103137.
https://doi.org/10.7554/eLife.103137.3


