Variation in albumin glycation rates in birds suggests resistance to relative hyperglycaemia rather than conformity to the pace of life syndrome hypothesis
- University of Strasbourg, CNRS, Institut Pluridisciplinaire Hubert Curien, France
- National Proteomics Infrastructure, ProFi, France
- Parc Zoologique et Botanique de Mulhouse, France
- Lyon University 1, UMR CNRS 5558, Laboratoire de Biométrie et Biologie Evolutive, France
- Swiss Ornithological Institute, Switzerland
- CEFE, Montpellier University, CNRS, EPHE, IRD, France
- Center of Biological Studies of Chizé (CEBC), UMR 7372 CNRS - La Rochelle University, France
- Ecology in the Anthropocene, Associated Unit CSIC‑UEX, Faculty of Sciences, University of Extremadura, Spain
Figures
Figure 1
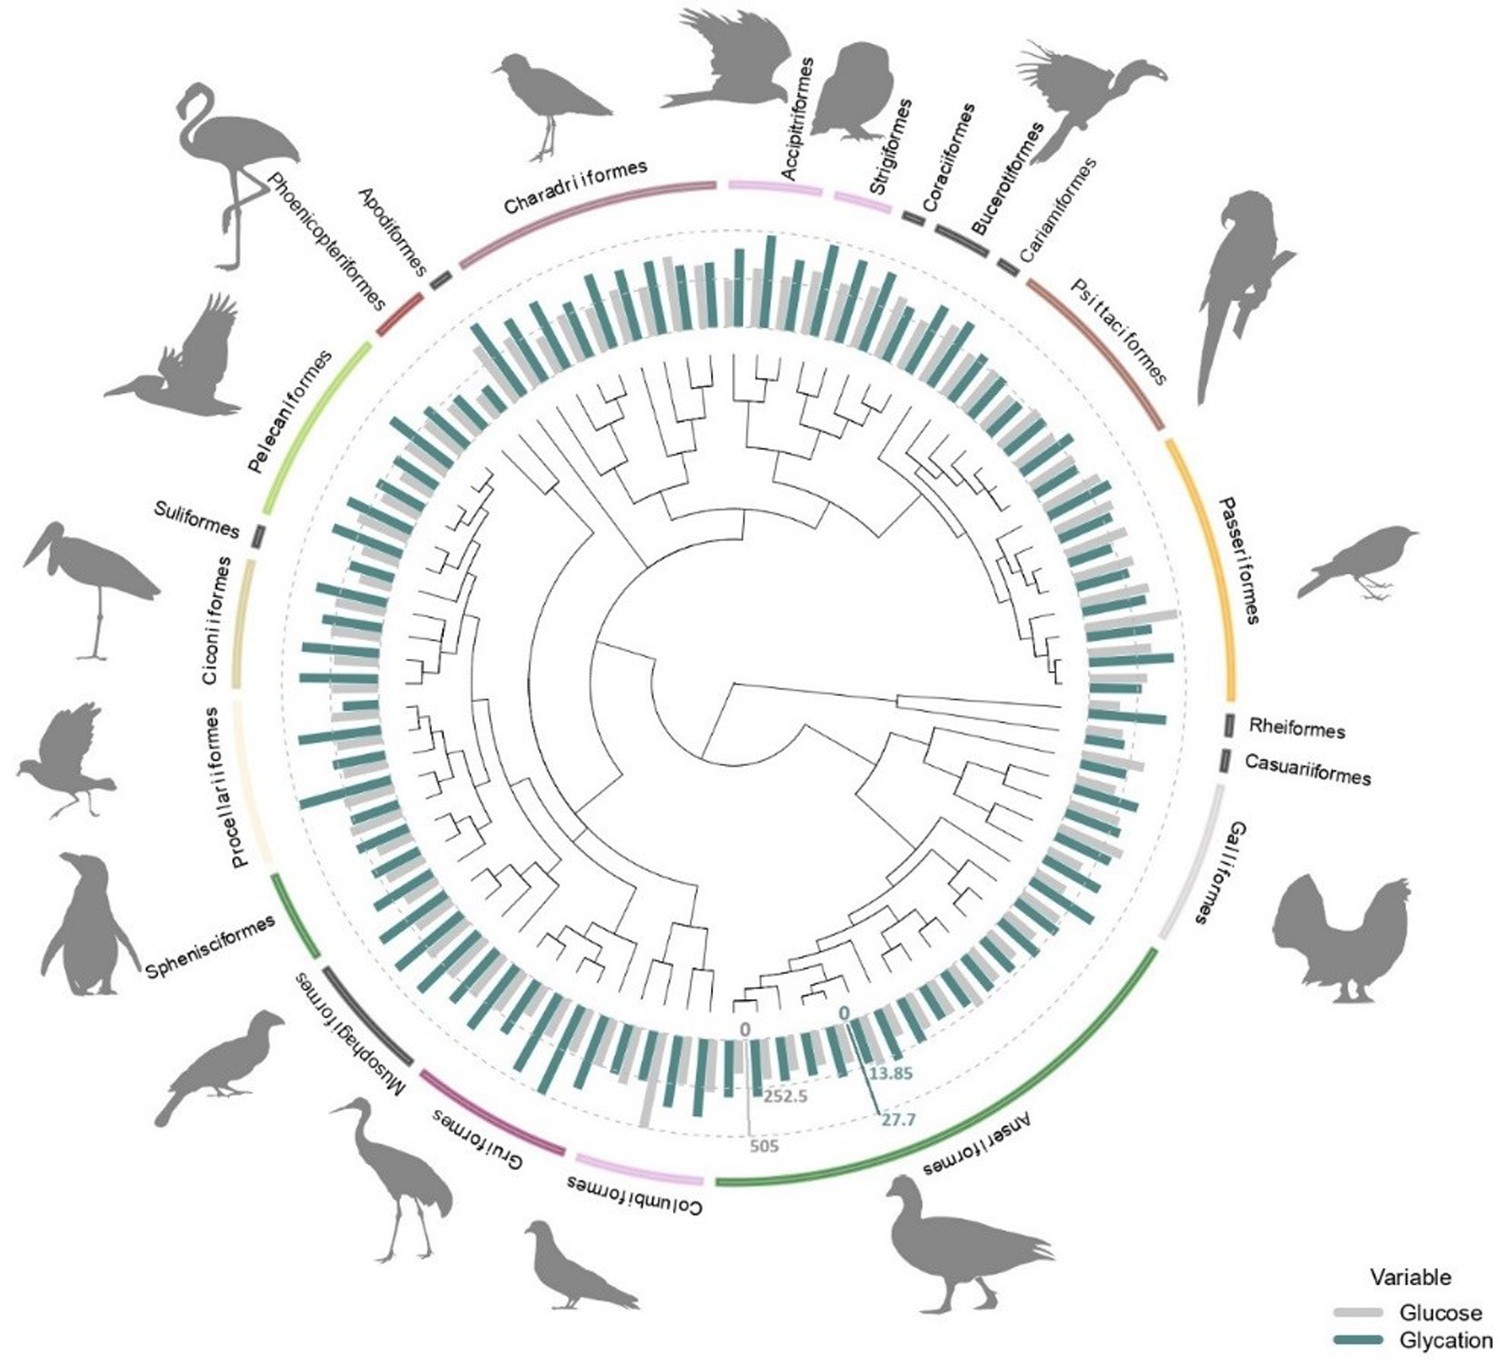
Average plasma glucose values in mg/dL (in grey) and average albumin glycation rate as a percentage of total albumin (in blue) from all the species used in this study (some of them with glucose values coming from ZIMs database; see ‘Materials and methods’) with the orders they belong to.
Glucose and glycation values are standardized in order to be compared, with the dotted lines representing half the maximum and maximum values for each variable (as indicated by the axes in their corresponding colours), from inside out. Tree from a consensus on 10,000 trees obtained from ‘Hackett All species’ on Birdtree.org, including 88 species from 22 orders (see ‘Materials and methods).
Figure 2
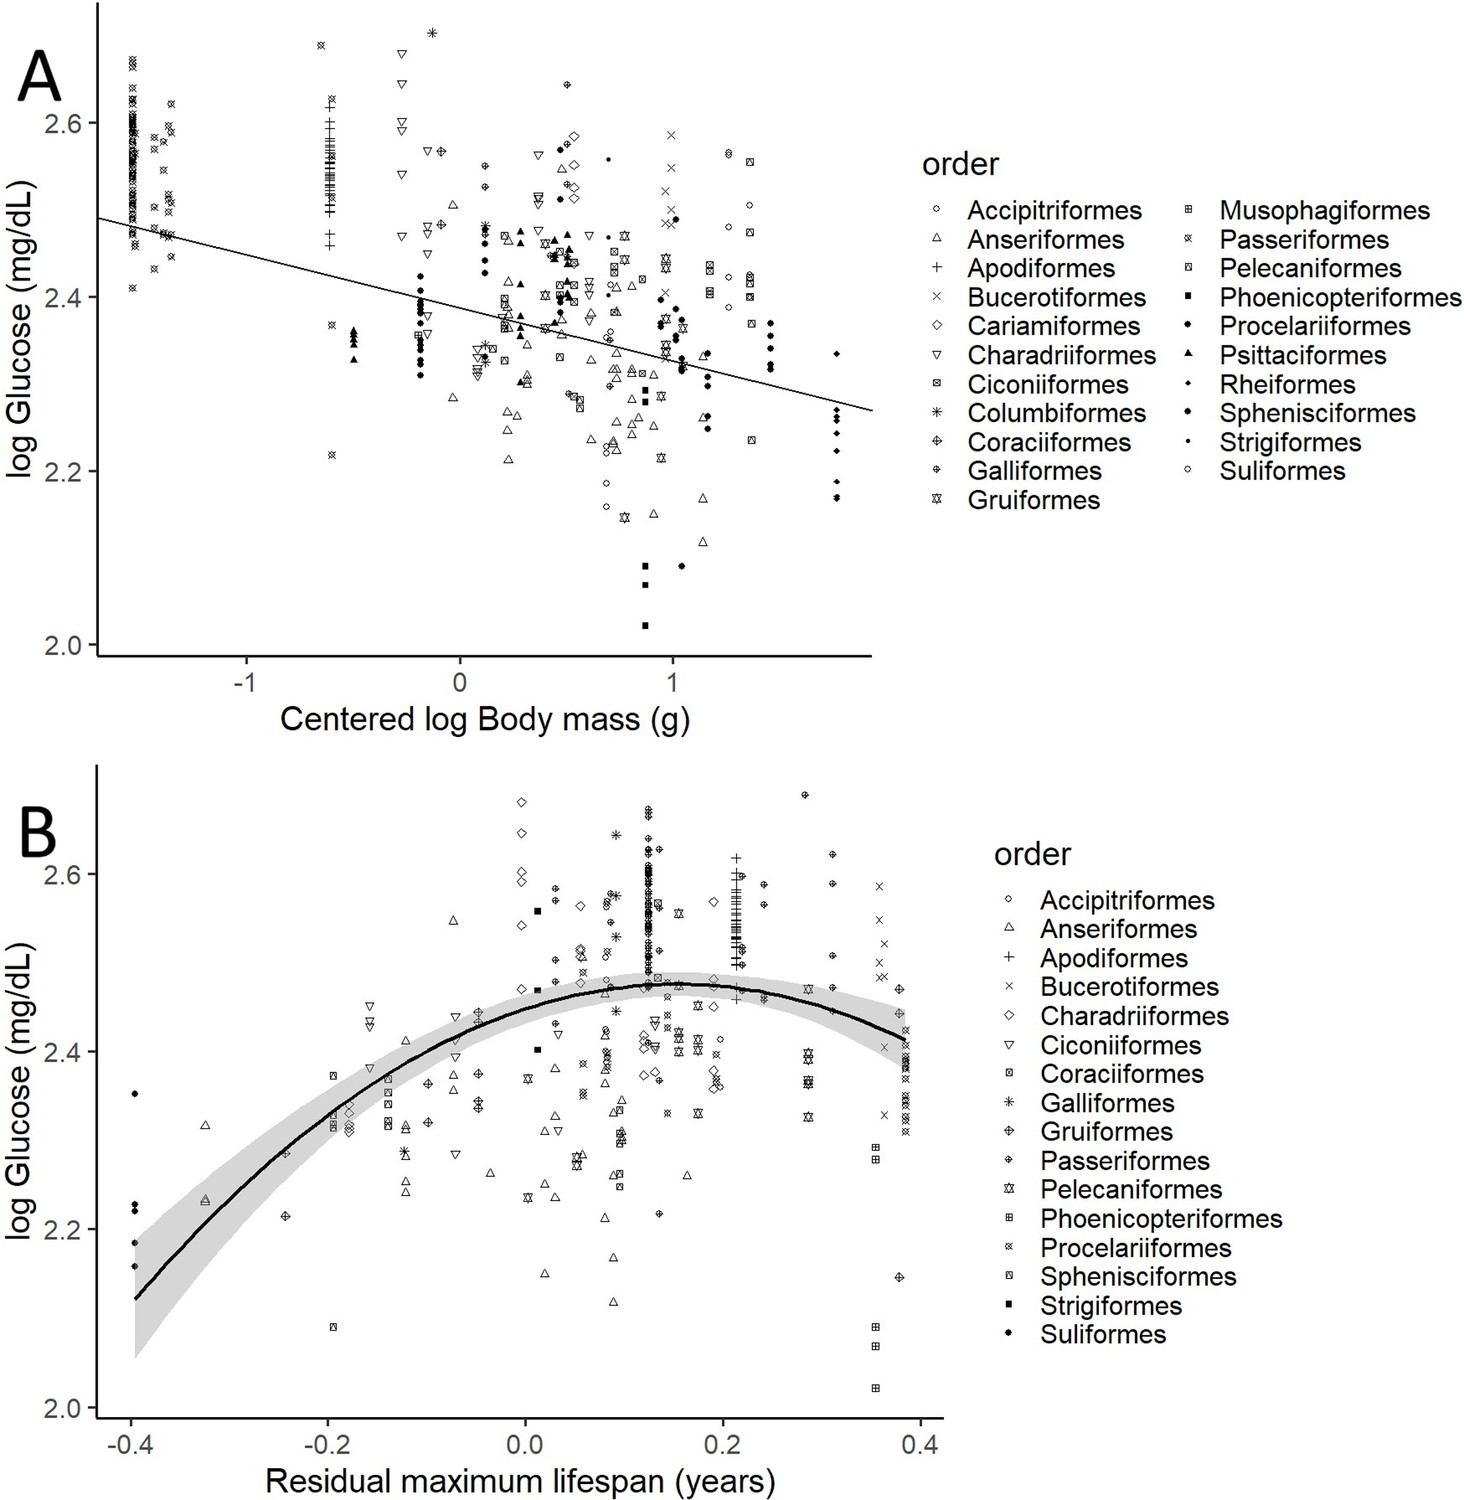
Plasma glucose levels (in mg/dL) variation as a function of (A) species mean-centred body mass and (B) residual maximum lifespan.
Both glucose and body mass are log transformed. Maximum lifespan (in years) is given as the residues of a phylogenetically controlled generalized least-squares model (pGLS) model with body mass (in grams), both log10 transformed, so the effects of body mass on longevity are factored out (see Appendix 1). Different bird orders, are indicated by symbols, as specified on the legends at the right side of the graphs. (A) uses the values and estimates from the glucose model without life history traits (n = 389 individuals from 75 species), while (B) uses only the data points employed on the complete model (n = 326 individuals of 58 species).
Figure 3
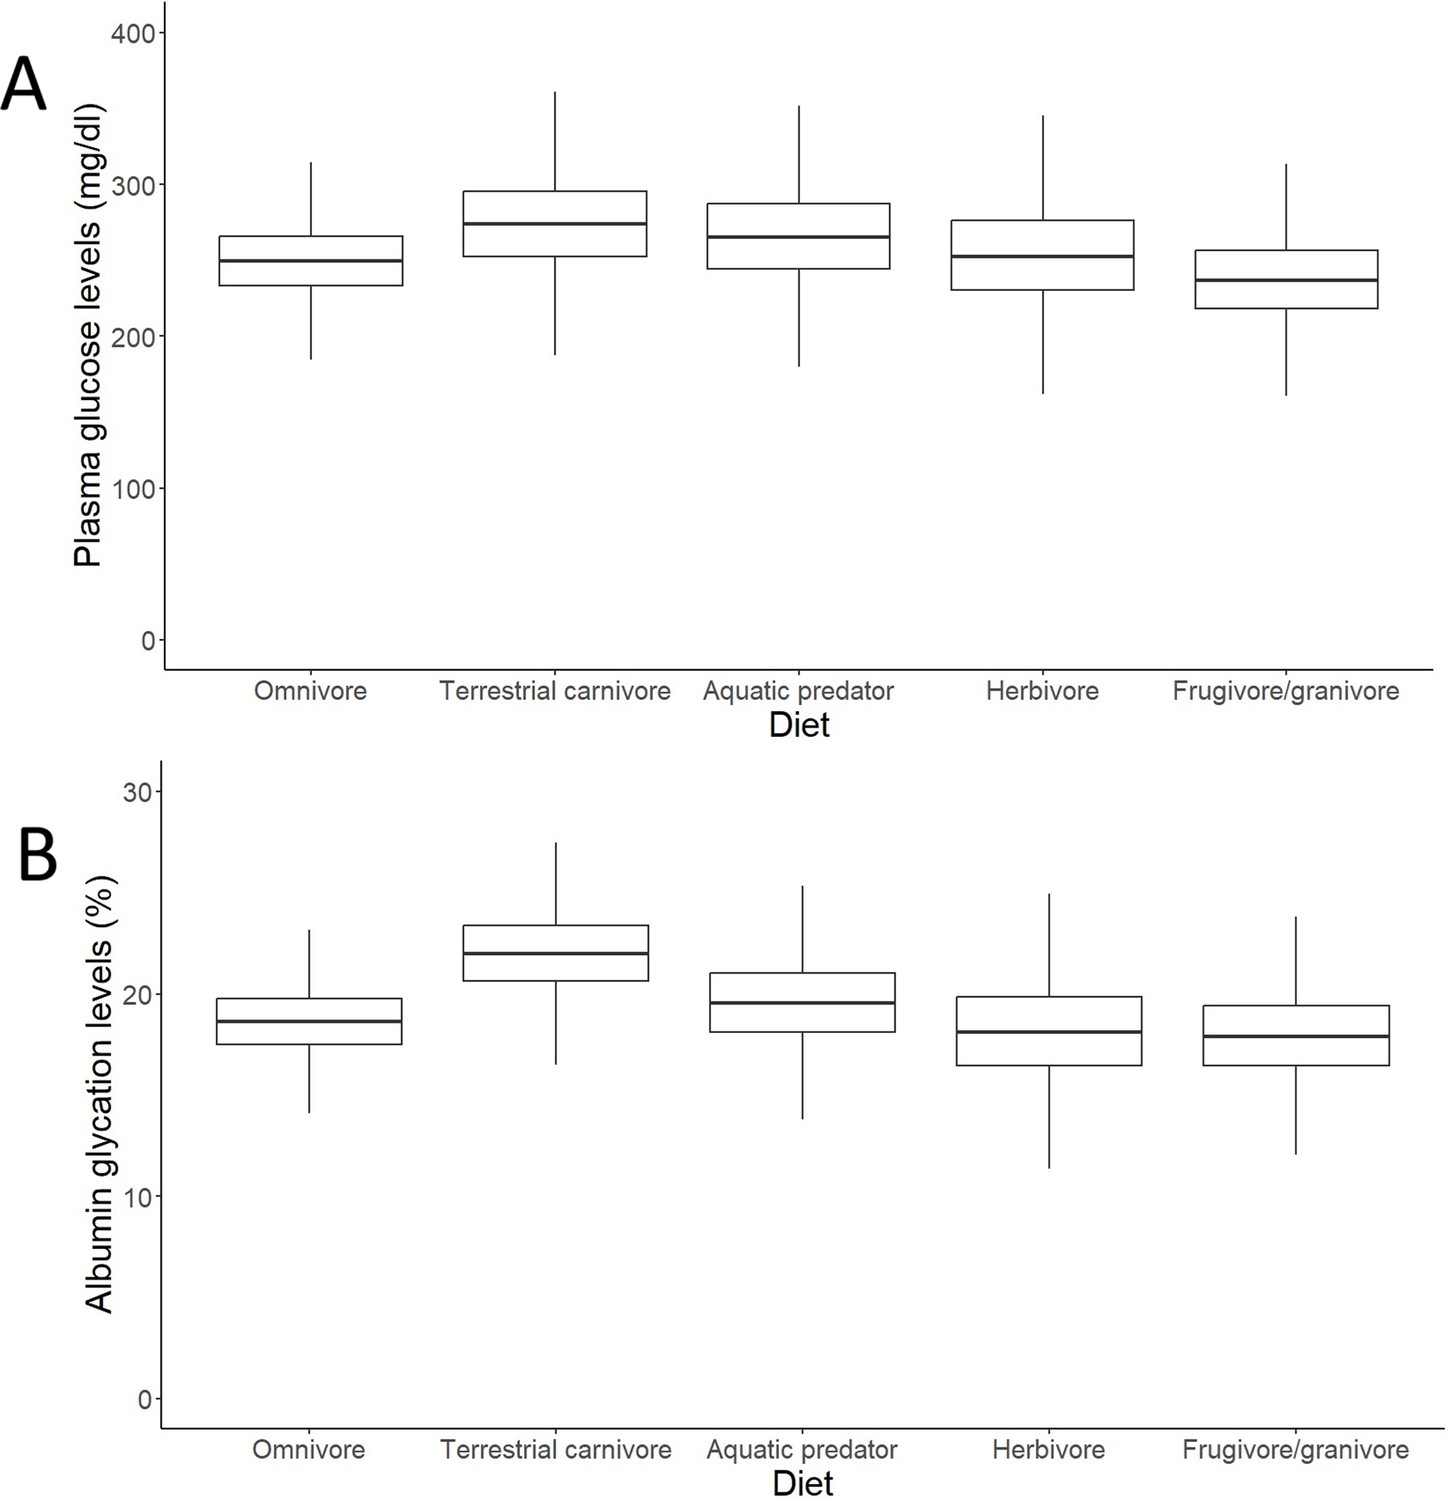
Outcomes of the models (estimates with interquartile ranges from the posterior distributions and whiskers representing credible intervals) on individual data on effects of diet on (A) plasma glucose levels and (B) albumin glycation in birds.
Glucose levels are given in mg/dL, while glycation levels are a percentage of total plasma albumin which is found to be glycated. Terrestrial carnivores showed significantly higher glycation levels than omnivores (estimate = 21.62 %, CI95[18, 25.95], pMCMC = 0.049). Models without life history traits, including more individuals, are represented, but the models with life history traits do not show differences in their qualitative predictions (i.e. higher albumin glycation in terrestrial carnivores than in omnivores; see Supplementary file 1).
Figure 4
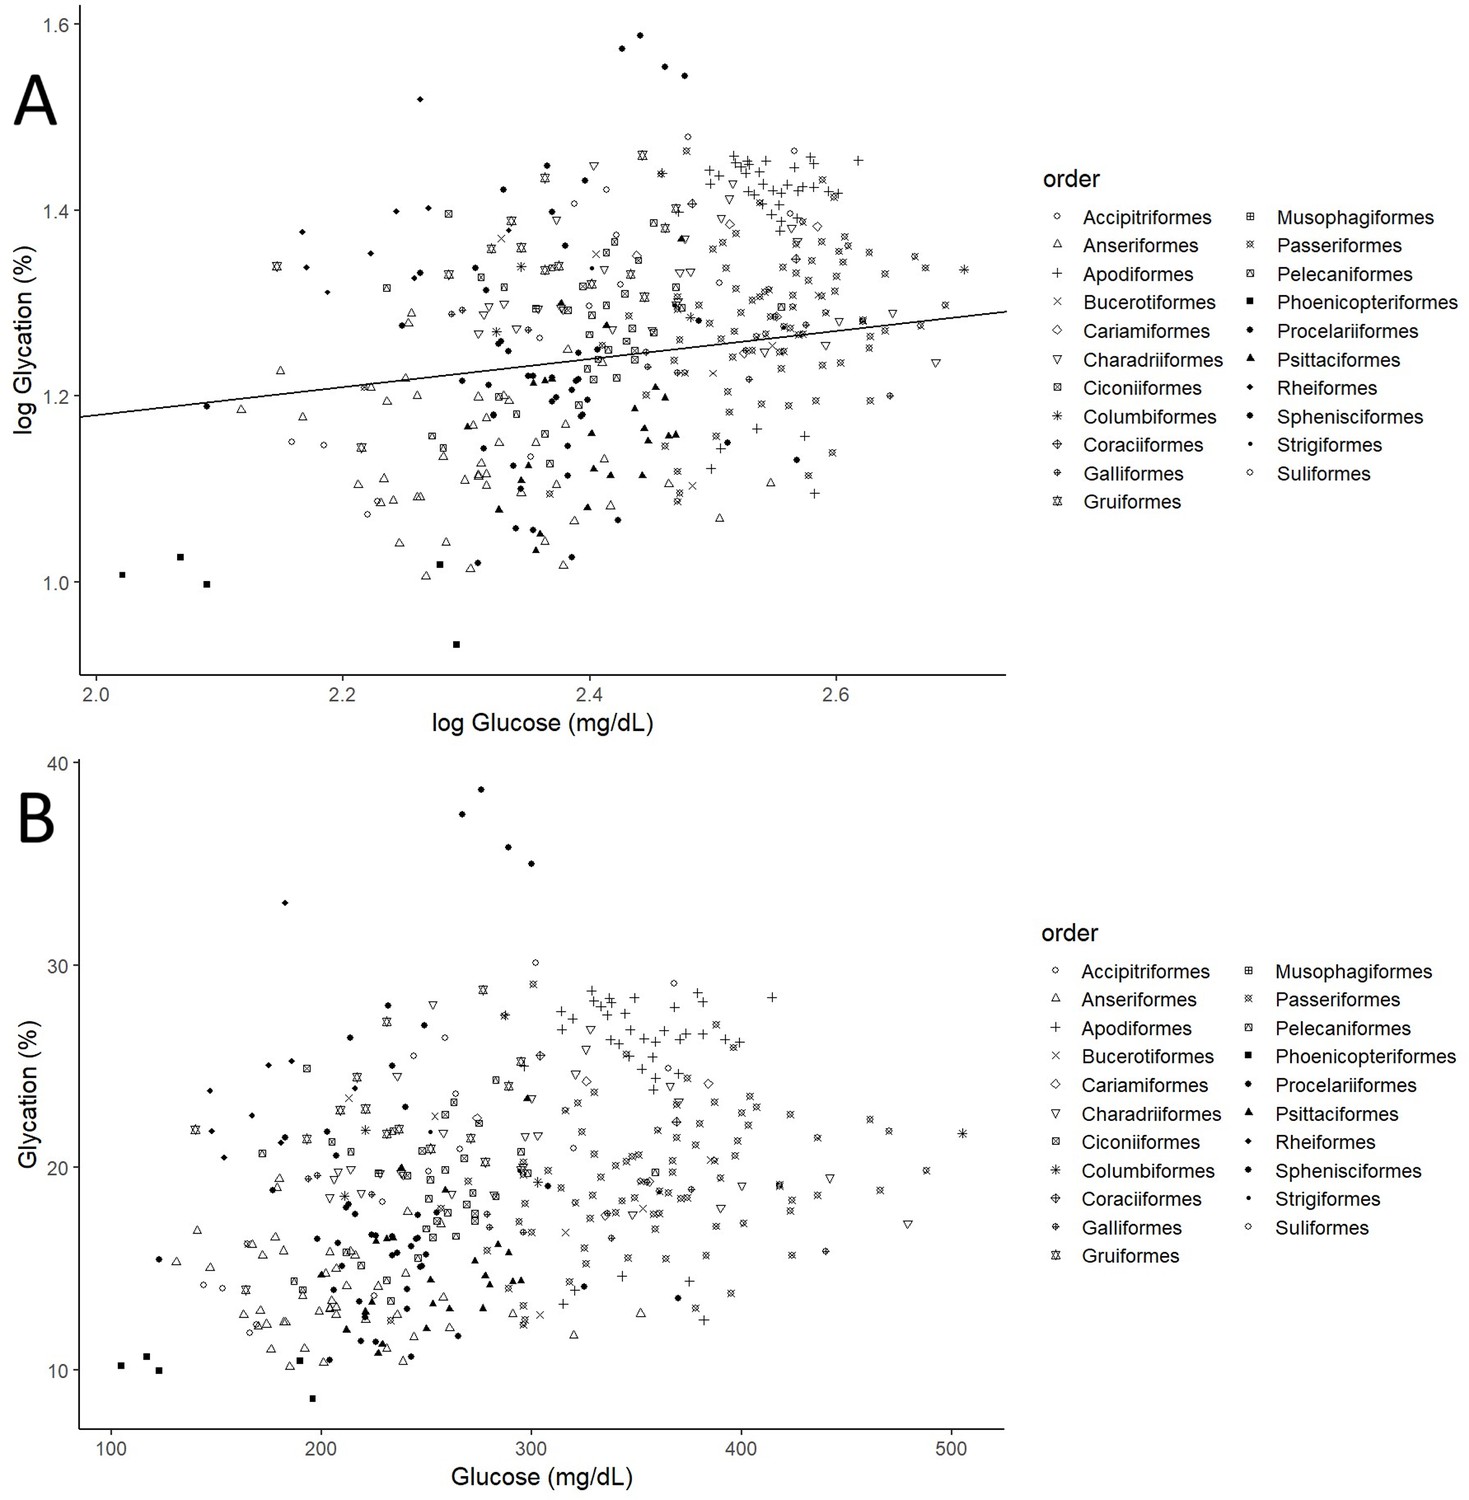
Individual albumin glycation rates (as a percentage of total albumin) variation as a function of individual plasma glucose values (mg/dL).
(A) Both variables log10 transformed, as in the model, including the line representing the predicted relationship. (B) Both variables in a linear form, to more explicitly illustrate the phenomenon referred to as higher albumin glycation resistance in birds with higher plasma glucose levels, inferred from the faster increase in glucose than albumin glycation, that is, the negative curvature of the relationship. Different bird orders are indicated by symbols, as specified on the legends at the right side of the graphs. The values and estimates used are from the glycation model without life history traits (n = 379 individuals from 75 species).
Tables
Table 1
Final glucose model with diet, body mass, life history traits, and sample provenance (wild versus captive; see Appendix 1) as explanatory variables, including the significant quadratic effect of maximum lifespan.
Posterior means, CI95 and pMCMC from a phylogenetic MCMC GLMM model including n = 326 individuals of 58 species.Both glucose and body mass are log10 transformed and life history traits are residuals from a phylogenetically controlled generalized least-squares model (pGLS) model of log10 body mass and log10 of the trait in question (see Appendix 1). Body mass was also centred to better explain the intercept, as 0 body mass would make no biological sense. The intercept corresponds to the omnivore diet, being used as the reference as it is considered the most diverse and ‘neutral’ group for this purpose. Significant predictors are indicated in bold.
| Estimates | Lower 95% CI | Upper 95% CI | Sampling effort | pMCMC | |
|---|---|---|---|---|---|
| Intercept (omnivore) | 2.387 | 2.268 | 2.5 | 59,900 | <0.001 |
| Diet: carnivore terrestrial | 0.02 | –0.056 | 0.099 | 59,900 | 0.592 |
| Diet: aquatic predator | 0.034 | –0.047 | 0.112 | 59,900 | 0.393 |
| Diet: herbivore | –0.053 | –0.177 | 0.07 | 59,900 | 0.393 |
| Diet: frugivore/granivore | –0.055 | –0.239 | 0.135 | 59,900 | 0.558 |
| Centred Log10 body mass | –0.061 | –0.106 | –0.015 | 59,900 | 0.009 |
| Maximum lifespan | 0.107 | –0.035 | 0.253 | 59,900 | 0.142 |
| Maximum lifespan2 | –0.616 | –1.166 | –0.095 | 59,900 | 0.026 |
| Clutch mass | –0.095 | –0.265 | 0.069 | 59,900 | 0.258 |
| Developmental time | 0.011 | –0.185 | 0.212 | 59,900 | 0.916 |
| Provenance: captive | 0.034 | –0.039 | 0.106 | 59,900 | 0.346 |
Table 2
Final glycation model with diet, body mass, glucose, and life history traits as explanatory variables.
Posterior means, CI95, and pMCMC from a phylogenetic MCMC GLMM model including n = 316 individuals of 58 species.Glycation, glucose, and body mass are log10 transformed and life history traits are residuals from a linear model of log10 body mass and log10 of the trait in question (see Appendix 1). Body mass and glucose were also centred to better explain the intercept. The intercept corresponds to the omnivore diet, being used as the reference as it is considered the most diverse and ‘neutral’ group for this purpose. Significant predictors are indicated in bold, and the credible intervals are considered for making pairwise comparisons between the groups.
| Estimates | Lower 95% CI | Upper 95% CI | Sampling effort | pMCMC | |
|---|---|---|---|---|---|
| Intercept | 1.232 | 1.112 | 1.351 | 59,900 | <0.001 |
| Diet: carnivore terrestrial | 0.101 | 0.017 | 0.187 | 59,900 | 0.021 |
| Diet: aquatic predator | 0.027 | –0.062 | 0.118 | 59,900 | 0.549 |
| Diet: herbivore | –0.019 | –0.161 | 0.119 | 59,936 | 0.781 |
| Diet: frugivore/granivore | 0.095 | –0.098 | 0.292 | 59,900 | 0.329 |
| Centred log10 body mass | 0.004 | –0.043 | 0.05 | 58,765 | 0.876 |
| Log10 glucose | 0.137 | 0.012 | 0.255 | 59,900 | 0.027 |
| Maximum lifespan | 0.037 | –0.122 | 0.195 | 59,043 | 0.648 |
| Clutch mass | 0.151 | –0.03 | 0.346 | 59,900 | 0.114 |
| Developmental time | 0.04 | –0.188 | 0.266 | 59,303 | 0.725 |
Appendix 1—table 1
Main set of models performed with the number of species and individuals included in them.
A total of 10 MCMCglmm models were performed, having either plasma glucose or albumin glycation levels as response variable and a different number of species and total datapoints depending on if the life history (LH) traits were included (i.e. maximum lifespan, clutch mass, and developmental time) or only diet and body mass (also glucose in the glycation models). The models considering age and 201 sex did not include life history traits nor diet.
| Models performed and N for each | Species averages | Intraspecific variation | Age and sex | |||||||
|---|---|---|---|---|---|---|---|---|---|---|
| Glucose | Glycation | Glucose | Glycation | Glucose | Glycation | |||||
| Non- LH | LH | Non- LH | LH | Non- LH | LH | Non- LH | LH |  |  | |
| Number of species | 88 | 66 | 88 | 66 | 75 | 58 | 75 | 58 | 49 | 49 |
| Number of individuals |  |  |  |  | 379 | 316 | 379 | 316 | 239 | 239 |
Appendix 1—table 2
List of species used in the models testing the relationship between the number of albumin’s exposed lysines and its glycation rates.
On the left, the list of considered species and on the right, the list of species used as references for the number of exposed lysines. The ones in bold are those that coincide.
| Species in our dataset | Original species |
|---|---|
| Anas platyrhynchos | Anas platyrhynchos |
| Anser anser | Anser brachyrhynchus* |
| Anser indicus | Anser cygnoides* |
| Aptenodytes patagonicus | Aptenodytes patagonicus |
| Tachimarptos melba | Apus apus |
| Aythya baeri | Aythya fuligula |
| Balearica regulorum | Balearica regulorum |
| Bubo bubo | Bubo bubo |
| Cariama cristata | Cariama cristata |
| Cygnus atratus | Cygnus atratus |
| Eudyptes chrysolophus | Eudyptes chrysolophus |
| Limosa limosa | Limosa lapponica |
| Numida meleagris | Numida meleagris |
| Leucocarbo verrucosus | Phalacrocorax carbo |
| Phoenicopterus ruber | Phoenicopterus ruber |
| Pygoscelis papua | Pygoscelis papua |
| Rhea pennata | Rhea pennata |
| Taeniopygia guttata | Taeniopygia guttata |
| Tauraco erythrolophus | Tauraco erythrolophus |
| Turdus merula | Turdus rufiventris |
-
*
For these species, as they both belong to the same genus, an average was calculated for both the number of exposed lysines and the glycation levels, considering them in the analyses as one. This way, Aser anser and Anser indicus were substituted by an Anser sp. average glycation value, and Anser brachyrhynchus and Anser cygnoides by an average number of lysine exposed. The actual values were very similar in both cases, so this average is likely to reflect realistic values.
Additional files
-
MDAR checklist
- https://cdn.elifesciences.org/articles/103205/elife-103205-mdarchecklist1-v1.pdf
-
Supplementary file 1
Detailed models' outcomes.
- https://cdn.elifesciences.org/articles/103205/elife-103205-supp1-v1.pdf
-
Supplementary file 2
Additional figures.
- https://cdn.elifesciences.org/articles/103205/elife-103205-supp2-v1.pdf
-
Supplementary file 3
Provenance of the samples.
- https://cdn.elifesciences.org/articles/103205/elife-103205-supp3-v1.xlsx
-
Supplementary file 4
References for the data values used as quoted in the dataset (Supplementary file 5).
- https://cdn.elifesciences.org/articles/103205/elife-103205-supp4-v1.pdf
-
Supplementary file 5
Dataset.
- https://cdn.elifesciences.org/articles/103205/elife-103205-supp5-v1.xlsx
-
Supplementary file 6
Code.
- https://cdn.elifesciences.org/articles/103205/elife-103205-supp6-v1.r
Download links
A two-part list of links to download the article, or parts of the article, in various formats.
Downloads (link to download the article as PDF)
Open citations (links to open the citations from this article in various online reference manager services)
Cite this article (links to download the citations from this article in formats compatible with various reference manager tools)
Variation in albumin glycation rates in birds suggests resistance to relative hyperglycaemia rather than conformity to the pace of life syndrome hypothesis
eLife 13:RP103205.
https://doi.org/10.7554/eLife.103205.4


