Selective attention and sensitivity to auditory disturbances in a virtually real classroom
- The Gonda Brain Research Center, Bar Ilan University, Israel
- Aix Marseille Univ, Inserm, INS, Inst Neurosci Syst, France
- Department of Psychiatry and Behavioral Sciences, University of California, Davis, United States
- MIND Institute, University of California, Davis, United States
Figures
Figure 1

Accuracy on comprehension questions.
Shown separately for the attention deficit (hyperactivity) disorder (AD(H)D) and Control groups, in the Quiet and Events conditions. Bar graphs represent average accuracy levels across participants and error bars represent the SEM. No significant differences were found between groups in either condition (n.s).
Figure 2 with 1 supplement
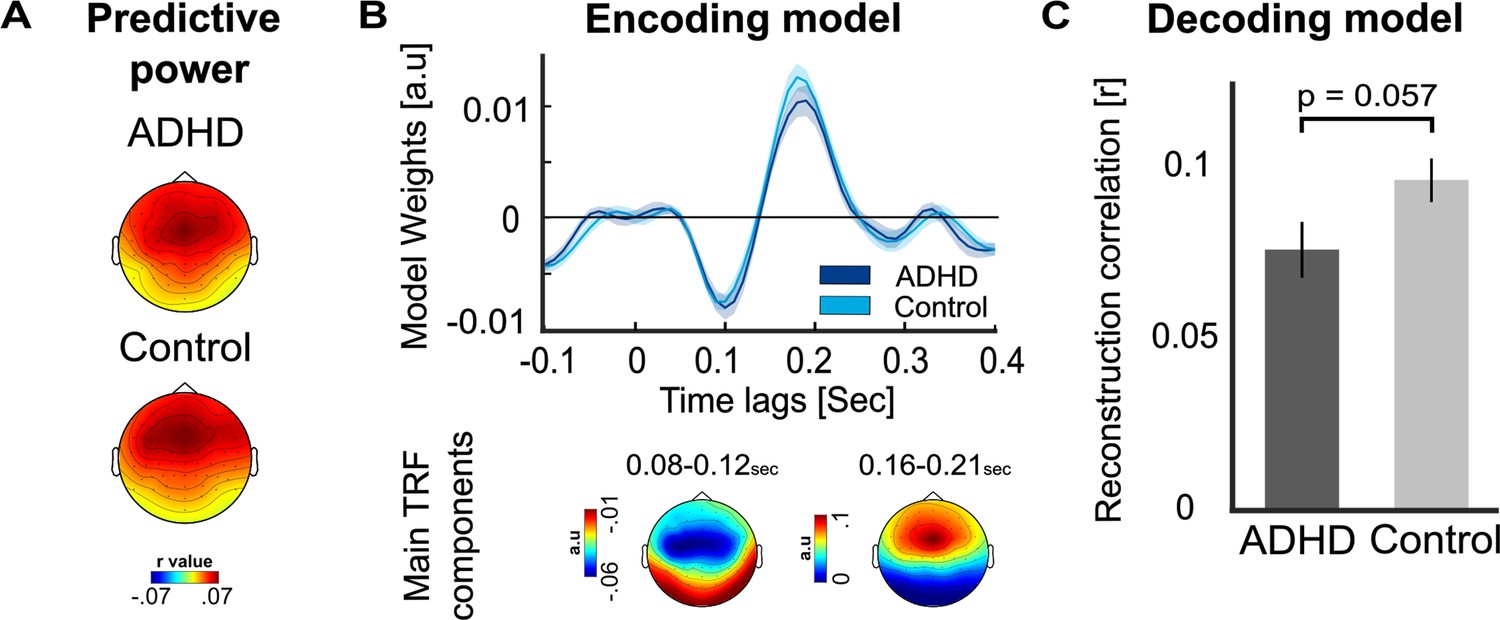
Speech tracking of the teacher in the presence of sound-events.
(A) Topographical distribution of the predictive power values, estimated using the multivariate encoding model, in the ADHD and Control groups. No significant differences were observed between groups. (B) Temporal response functions (TRFs) estimated for each group in the Events condition, based on the average of electrodes FC1, FC2, and FCz, which exhibited the strongest activity for the two main components. Shaded areas represent the SEM. Below the TRFs, topographies of the main component are presented. (C) Bar graphs showing the average reconstruction correlation of the decoding model (Pearson’s r) in each group. The ADHD group showed slightly lower reconstruction correlations for the teacher’s speech, though the effect did not reach statistical significance (p = 0.057). Error bars represent the SEM.
Figure 2—figure supplement 1

Comparison between univariate and multivariate temporal response function (TRF) model.
In the main manuscript, we report the TRF estimated to capture the response to the teacher’s speech using a multivariate model, that takes into account both the acoustic envelope of the speech as well as the sound-events. Here, we compared TRF estimation using this multivariate encoding model versus a univariate encoding model comprised only the speech-envelope as a single regressor. (A) Grand-average TRFs (across both groups) reflecting the neural tracking response of the teacher’s speech, estimated for the Events condition using both a univariate and multivariate model, as well as for the Quiet condition (univariate model). Shading represent the standard error of the mean (SEM). The estimated TRFs to the speech were qualitatively similar using both approaches, and were also similar to those estimated in the Quiet condition, which did not contain additional event-sound, lending additional credibility to the approach. (B) Grand-average TRF estimated for the regressor representing the audio of the event-sounds, in the multivariate model of the Events condition. Shaded areas represent the SEM. This analysis is akin to calculating the event-related potential (ERP) to event-sounds (given the linear nature of the model), and the resulting TRF is qualitatively similar to the ERPs reported in Figure 6. (C) Topographical distribution (top) and bar graph (bottom) depicting the predictive power values (Pearson’s r) in the Events condition for the univariate and multivariate encoding models. When comparing the predictive power of the univariate and multivariate models, both models yielded significant predictive power relative to null-permutations, however the multivariate model was able to explain a larger degree of the variance in the neural response [t(48) = 10.354, p < 0.0001, Cohen’s d = 1.268, Bayes Factor (BF10) = +100 (Extreme evidence for H1)]. These results indicate that including a regressor that captures the time-course of the sound-events in addition to a regressor capturing the speech stimulus allowed the model to more faithfully capture the neural representation of the entire virtual reality (VR) classroom soundscape (Crosse et al., 2021). Therefore, this approach is preferable when analyzing neural response to stimuli embedded in realistically noisy contexts. That said, the spatio-temporal TRF itself can be reliably extracted for the speech stimulus using both a univariate and a multivariate model.***p < 0.0001.
Figure 3
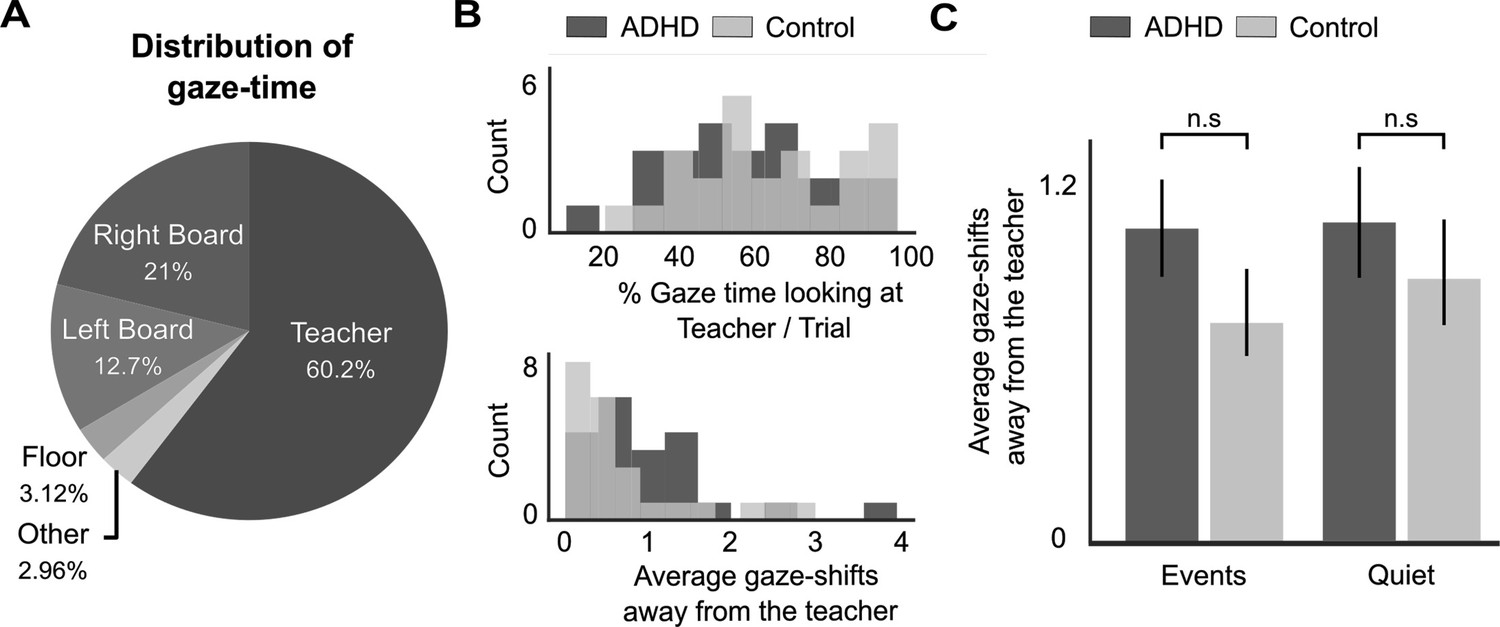
Eye-gaze results.
(A) Pie chart representing the average amount of time that participants spent looking at different areas within the virtual reality (VR) classroom. (B) Distribution of the proportion of gaze-time toward the teacher (top) and number of gaze-shifts performed away from the teacher (bottom), for all participants in the attention deficit (hyperactivity) disorder (AD(H)D) and Control groups. (C) Bar graph represents the average number of gaze-shifts performed away from the teacher, shown separately for the AD(H)D and Control groups, and for the Quiet and Events conditions. No significant differences were found in any comparison (n.s).
Figure 4
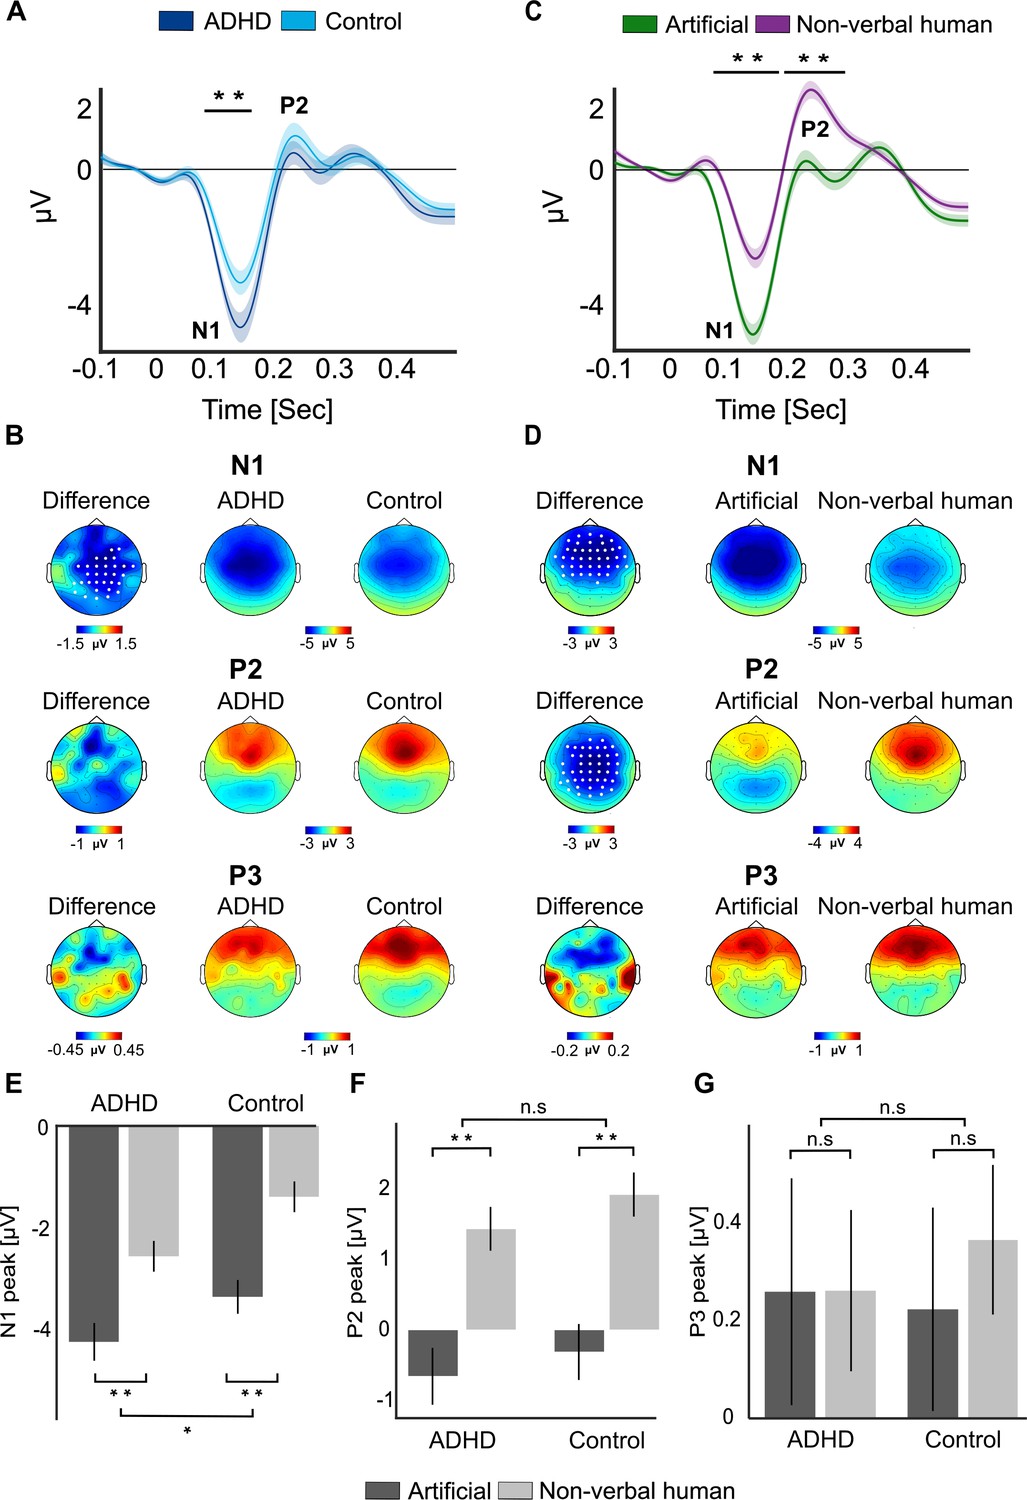
Event-related potentials (ERPs) in response to sound-events.
(A) Grand-average ERP to sound-events, shown separately for the attention deficit (hyperactivity) disorder (AD(H)D) versus Control groups. ERPs are averaged across the cluster of electrodes where significant differences were found (see panel B). The black horizontal line indicates the time-window where significant differences between groups were found (75–155 ms). Shaded areas around the waveforms represent the SEM. (B) Scalp topographies of the N1 and P2 responses in the AD(H)D and Control groups, and the difference between them. Electrodes where significant differences between groups were found are marked in white (p < 0.05, cluster corrected). (C) Grand-average ERP to Artificial and Non-verbal human event-sound. ERPs are averaged across the cluster of electrodes where significant differences were found (see panel D). The black horizontal lines indicate the time-windows where significant differences between ERP to the two types of sound-events were found (67–178 and 187–291 ms). Shaded areas around waveforms represent the SEM. (D) Scalp topographies of the N1 and P2 responses to Artificial and Non-verbal human sounds and the difference between them. Electrode where significant differences were found are marked in white (p < 0.05, cluster corrected). (E, F, G) Box plots depicting the average N1, P2 and P3 responses, separately for each group (AD(H)D vs. Control) and Event-type (Artificial vs. Non-verbal human). **p < 0.001; *p < 0.05.
Figure 5

Event-related changes in skin conductance (SC).
Time-course of event-related changes in phasic SC following the sound-events, shown separately for each group (A) and for the two sound-events types (B). Shaded areas around waveforms represent the SEM. Horizontal line represents the time-windows where significant differences were found. (C) Average levels of event-related changes in phasic SC (peak between 2 and 3 s) shown for each group and for Artificial vs. Non-verbal human sound-events. Error bars represent the SEM. **p < 0.01.
Figure 6
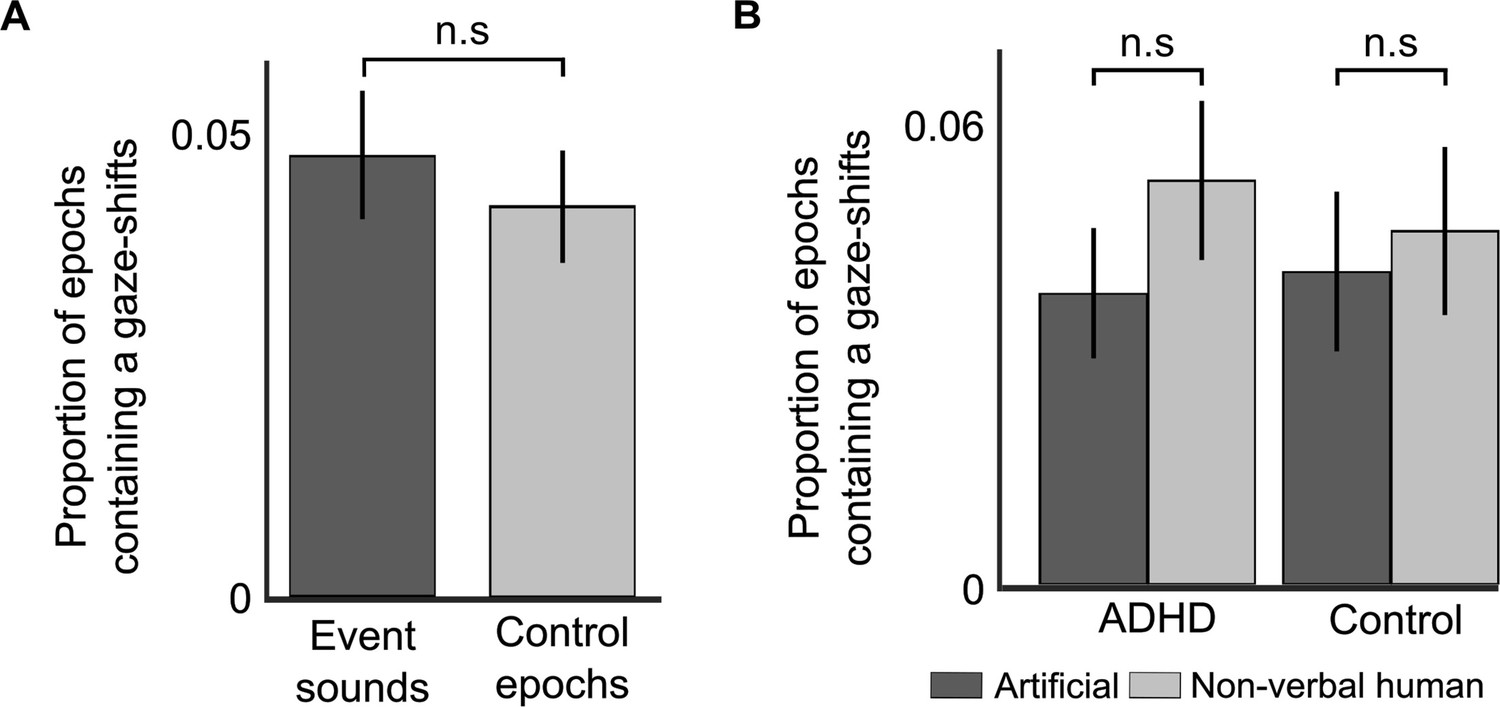
Event-related gaze-shifts.
Attention deficit (hyperactivity) disorder (AD(H)D). (A) Bar graph showing the number of gaze-shifts performed in 2-s epochs following event-sounds versus control epochs, averaged across groups and sound types. No significant differences were found, suggesting that event-sounds were not more likely to elicit overt gaze-shifts. (B) Bar graph showing the number of gaze-shifts performed in 2-s epochs following each type of sound-event, separately for each group. No significant differences were found in any comparison. Error bars represent the SEM in all bar graphs.
Figure 7
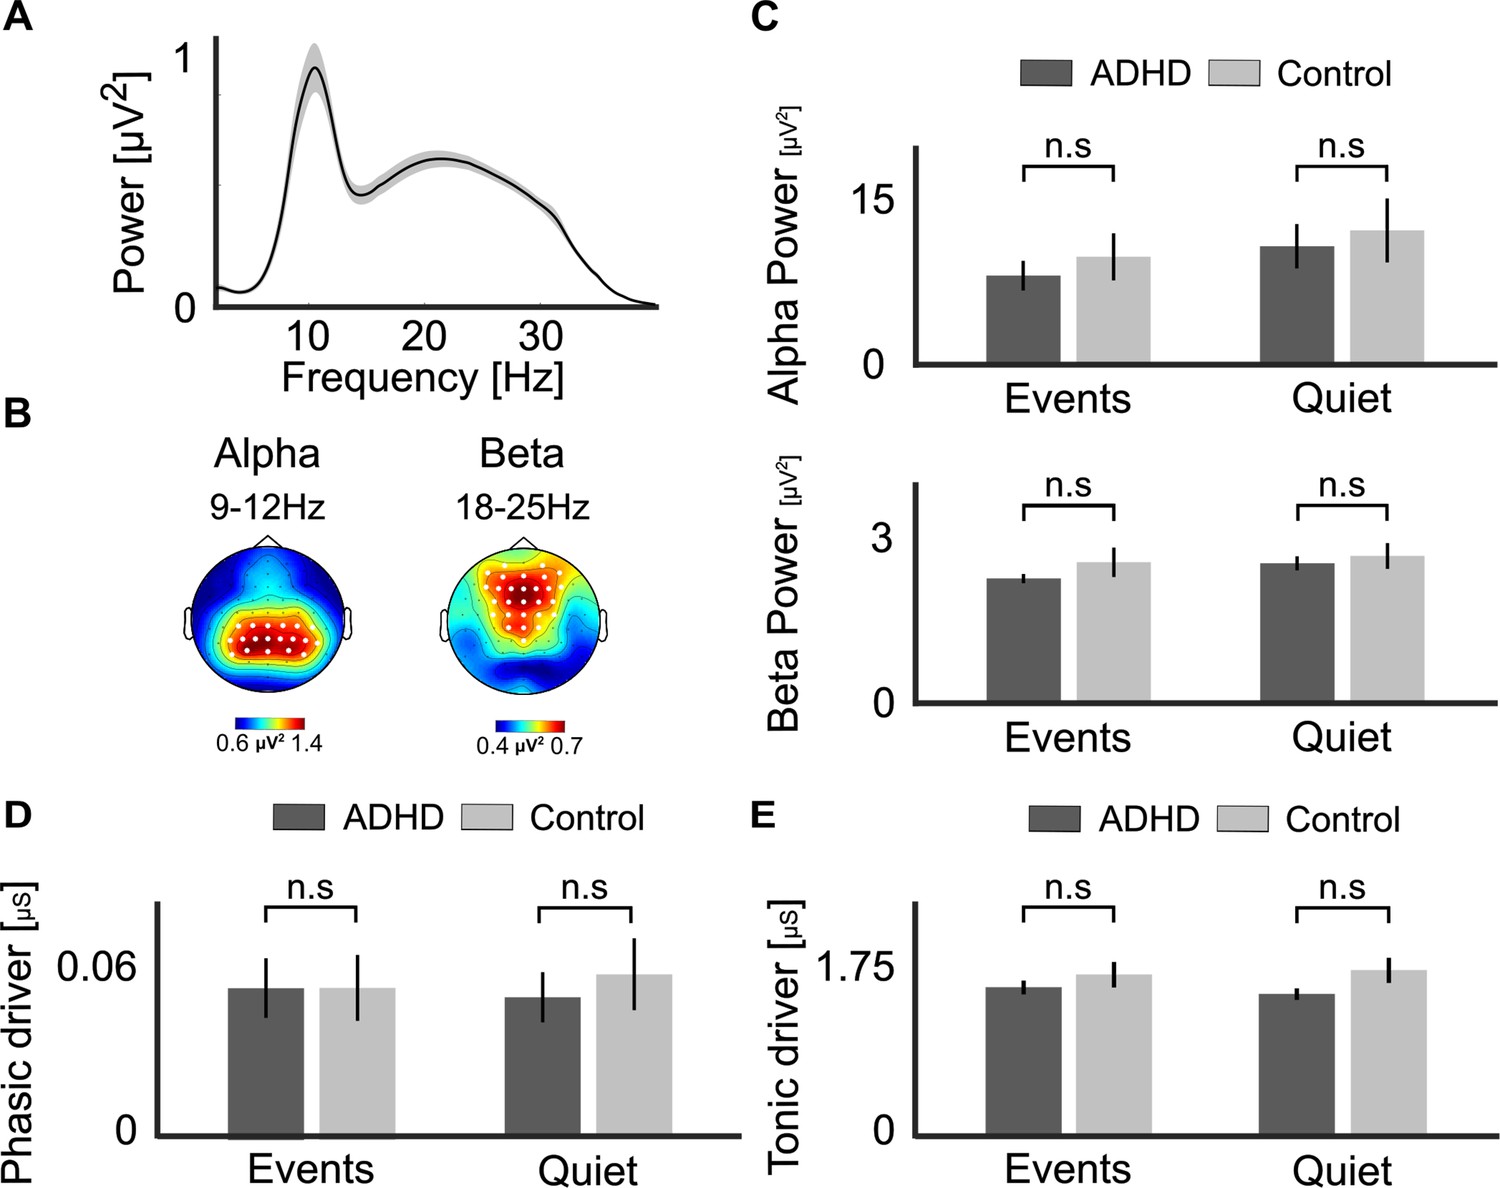
Spectral electroencephalography (EEG) and skin conductance analysis.
(A) Grand-average power spectral density (PSD) of the periodic portion of the EEG signal (after applying the FOOOF algorithm), shows two clear peaks corresponding to the alpha (8–12 Hz) and beta (15–25 Hz) bands. Shaded areas around waveforms represent the SEM. (B) Topographical distribution of the average alpha- and beta-power peaks, with the clusters of electrodes used to detect personal peaks in each frequency band marked by white circles. (C) Average alpha- and beta-power in Group (attention deficit (hyperactivity) disorder [AD(H)D] vs. Control) and condition (Quiet and Events). (D) Phasic and (E) tonic skin conductance levels in the same groups and conditions. No significant between-group difference was found in any comparison (n.s.). Bar graphs represent the mean values, and error bars represent the SEM.
Figure 8
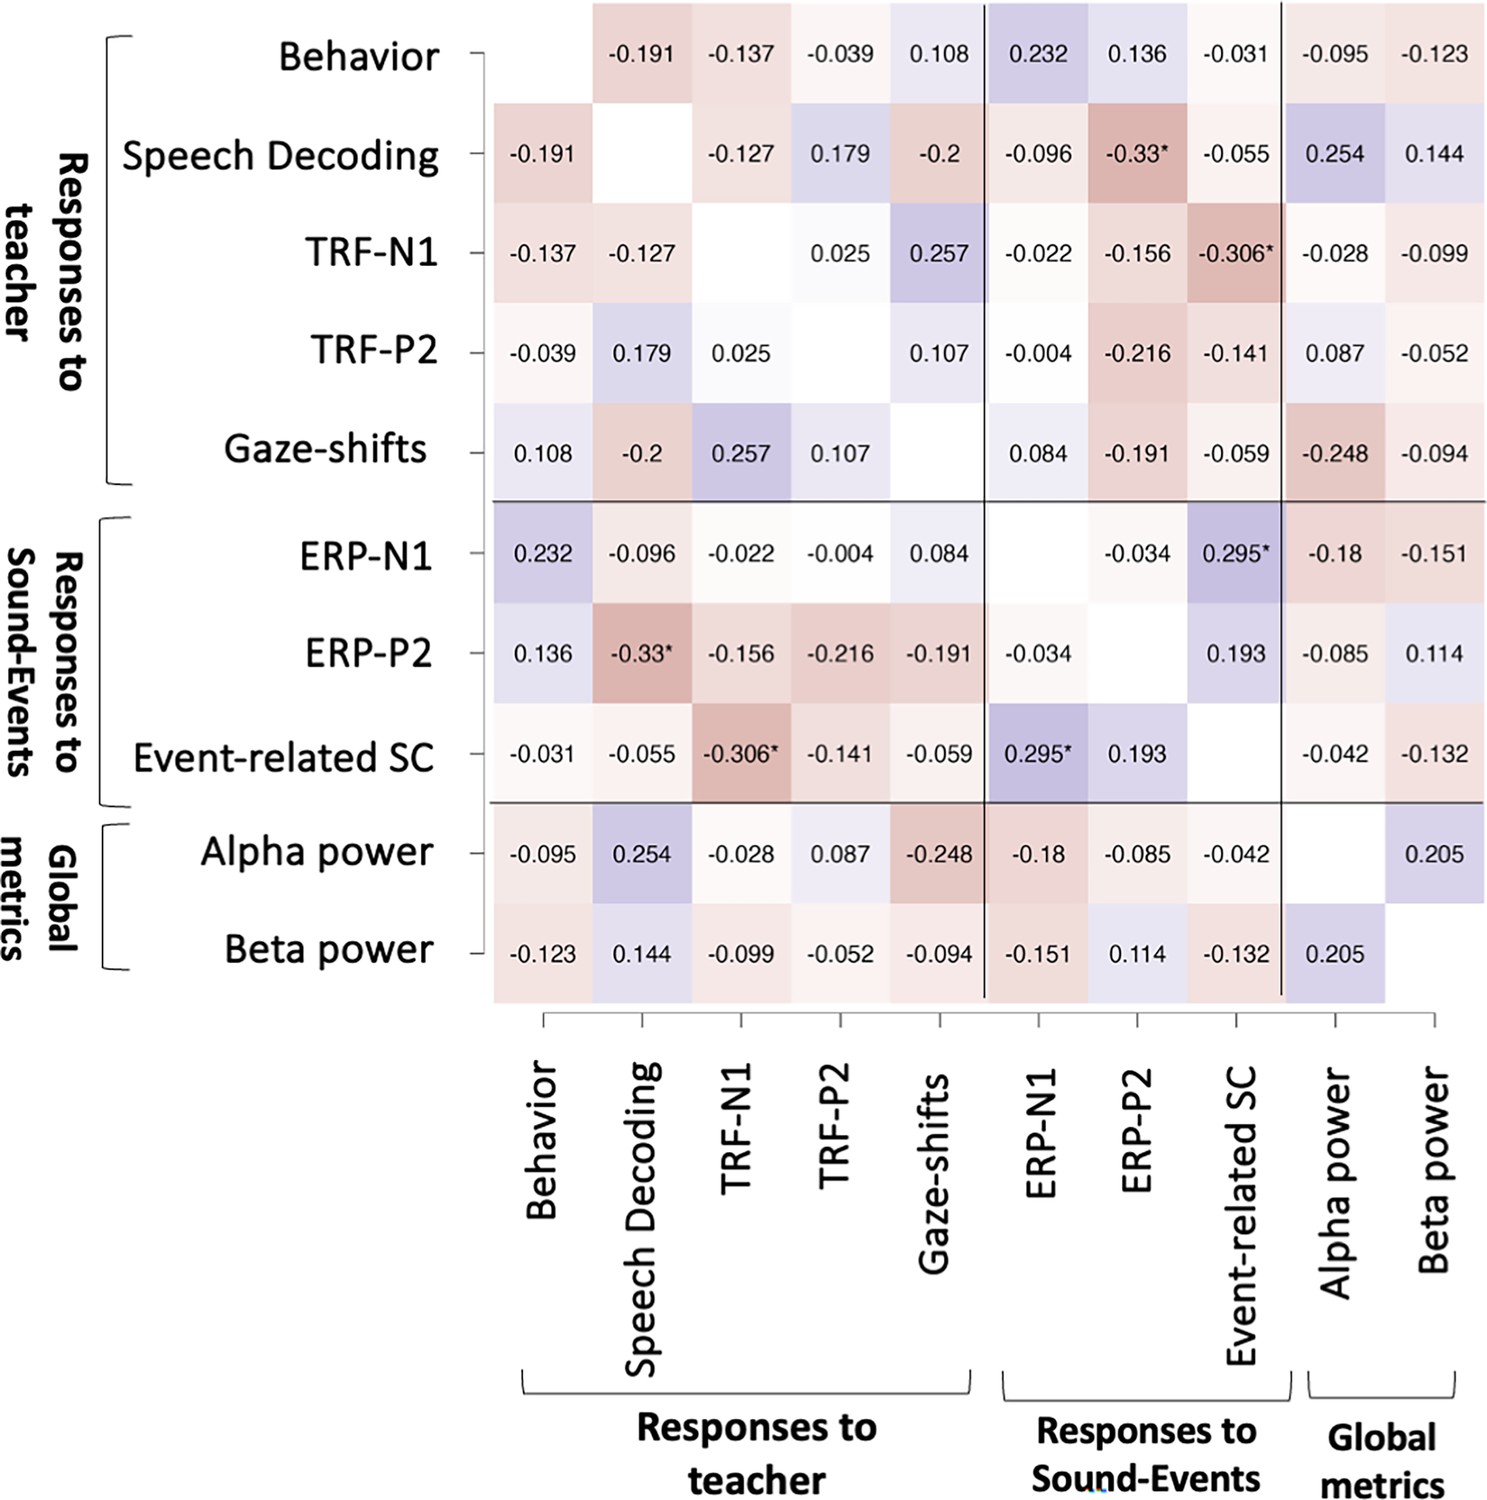
Correlation matrix.
Heatmap of the pairwise Spearman’s correlation coefficient between the different neurophysiological measures included in the multivariate analysis. Red-shading indicates negative correlation values and blue-shading indicate positive values. Asterisks* indicate correlation values that pass a non-corrected threshold for statistical significance, however none survived fdr-correction for multiple comparisons.
Figure 9
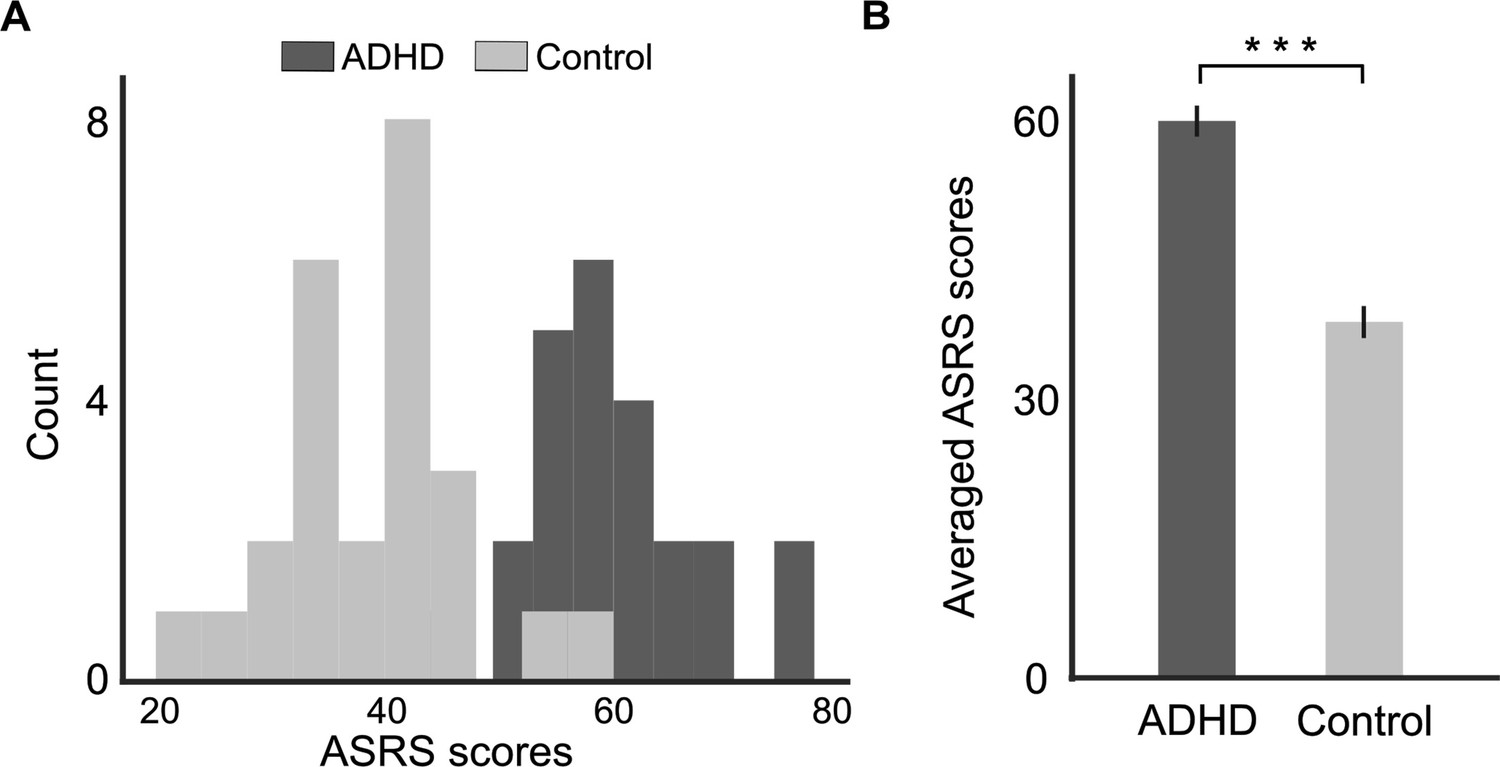
Histogram (A) and bar graph (B) showing the distribution of ASRS scores in the attention deficit (hyperactivity) disorder (AD(H)D) and Control groups.
Error bars represent standard error of the mean (SEM). This confirms group allocation, within the tested sample.***p < 0.001.
Figure 10
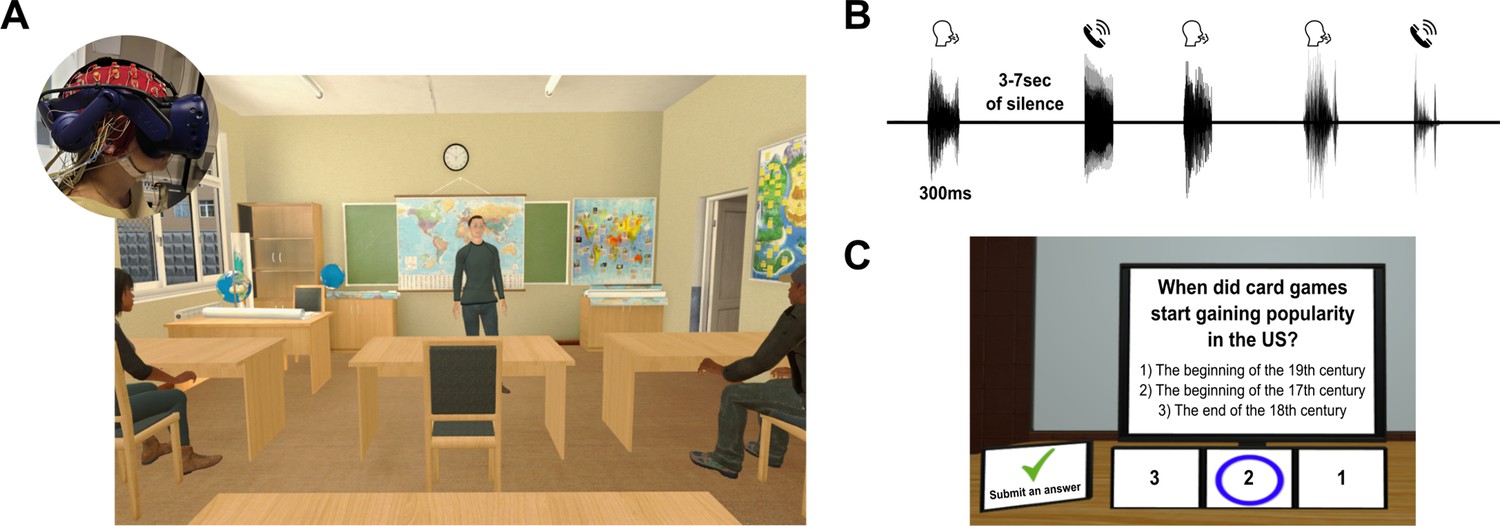
Virtual reality classroom setup.
(A) Illustration of the virtual classroom used in the study.Inset: a participant wearing the virtual reality (VR) headset over the electroencephalography (EEG) cap. (B) Example of the sequence of sound-events presented in Event-trials, which were emitted from a spatial location to the right or left of the participant. Event-trials contained five events, of both types (Artificial and Human non-verbal sounds), randomized across trials and separated by 3–7 s. (C) Example of a multiple-choice comprehension question presented after each trial (English translation).
Author response image 1
Author response image 2
Author response image 3

Author response image 4
Tables
Table 1
Result of the dominance analysis of a multivariate logistic regression, describing the contribution of each measure for predicting whether an individual was in the ADHD or control group.
Table 2
Result of the dominance analysis of a multivariate linear regression, describing the contribution of each measure for predicting individual ASRS scores.
| Factor | ΔR2 | ΔAIC |
|---|---|---|
| ERP-N1 | 0.087 | –3.58 |
| Gaze-shifts | 0.065 | –2.23 |
| Alpha-power | 0.038 | –0.49 |
| ERP-P2 | 0.033 | –0.22 |
| Behavior | 0.028 | –0.14 |
| Speech Decoding | 0.021 | +0.58 |
| TRF-N1 | 0.006 | +1.58 |
| Event-related SC | 0.001 | +1.91 |
| TRF-P2 | 0.008 | +1.18 |
| Beta-power | 0 | +1.97 |
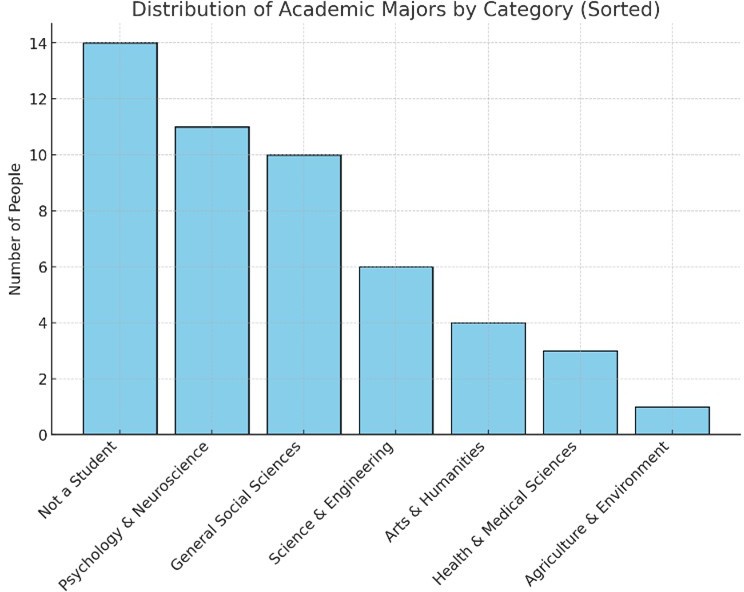
Author response table 1
| Academic major | Count |
|---|---|
| Not a student | 14 |
| Neuroscience | 7 |
| Middle Esstern Studies | 2 |
| Criminology | 2 |
| Psychology and Economics | 1 |
| Business Administration | 1 |
| Veterinary Medicine | 1 |
| Computer Engineering | 1 |
| Arabic and Middle Eastern Studies | 1 |
| Computer Science | 1 |
| Psychology and Special Education | 1 |
| Agriculture | 1 |
| Communication and Political Science | 1 |
| Materials Engineering | 1 |
| Medicine | 1 |
| Criminology and Special Education | 1 |
| Music | 1 |
| Arabic | 1 |
| Nursing | 1 |
| Education | 1 |
| Psychology | 1 |
| Electrical Engineering | 1 |
| Psychology and History | 1 |
| Information Systerns | 1 |
| Sociology and Anthropology | 1 |
| Jewish Art | 1 |
| Law | 1 |
| Life Sciences | 1 |
Additional files
Download links
A two-part list of links to download the article, or parts of the article, in various formats.
Downloads (link to download the article as PDF)
Open citations (links to open the citations from this article in various online reference manager services)
Cite this article (links to download the citations from this article in formats compatible with various reference manager tools)
Selective attention and sensitivity to auditory disturbances in a virtually real classroom
eLife 13:RP103235.
https://doi.org/10.7554/eLife.103235.3


