Maf-family bZIP transcription factor NRL interacts with RNA-binding proteins and R-loops in retinal photoreceptors
- Neurobiology, Neurodegeneration and Repair Laboratory, National Eye Institute, National Institutes of Health, United States
- Department of Ophthalmology, Byers Eye Institute, Stanford University, United States
- In silichrom Ltd, United Kingdom
Figures
Figure 1 with 1 supplement
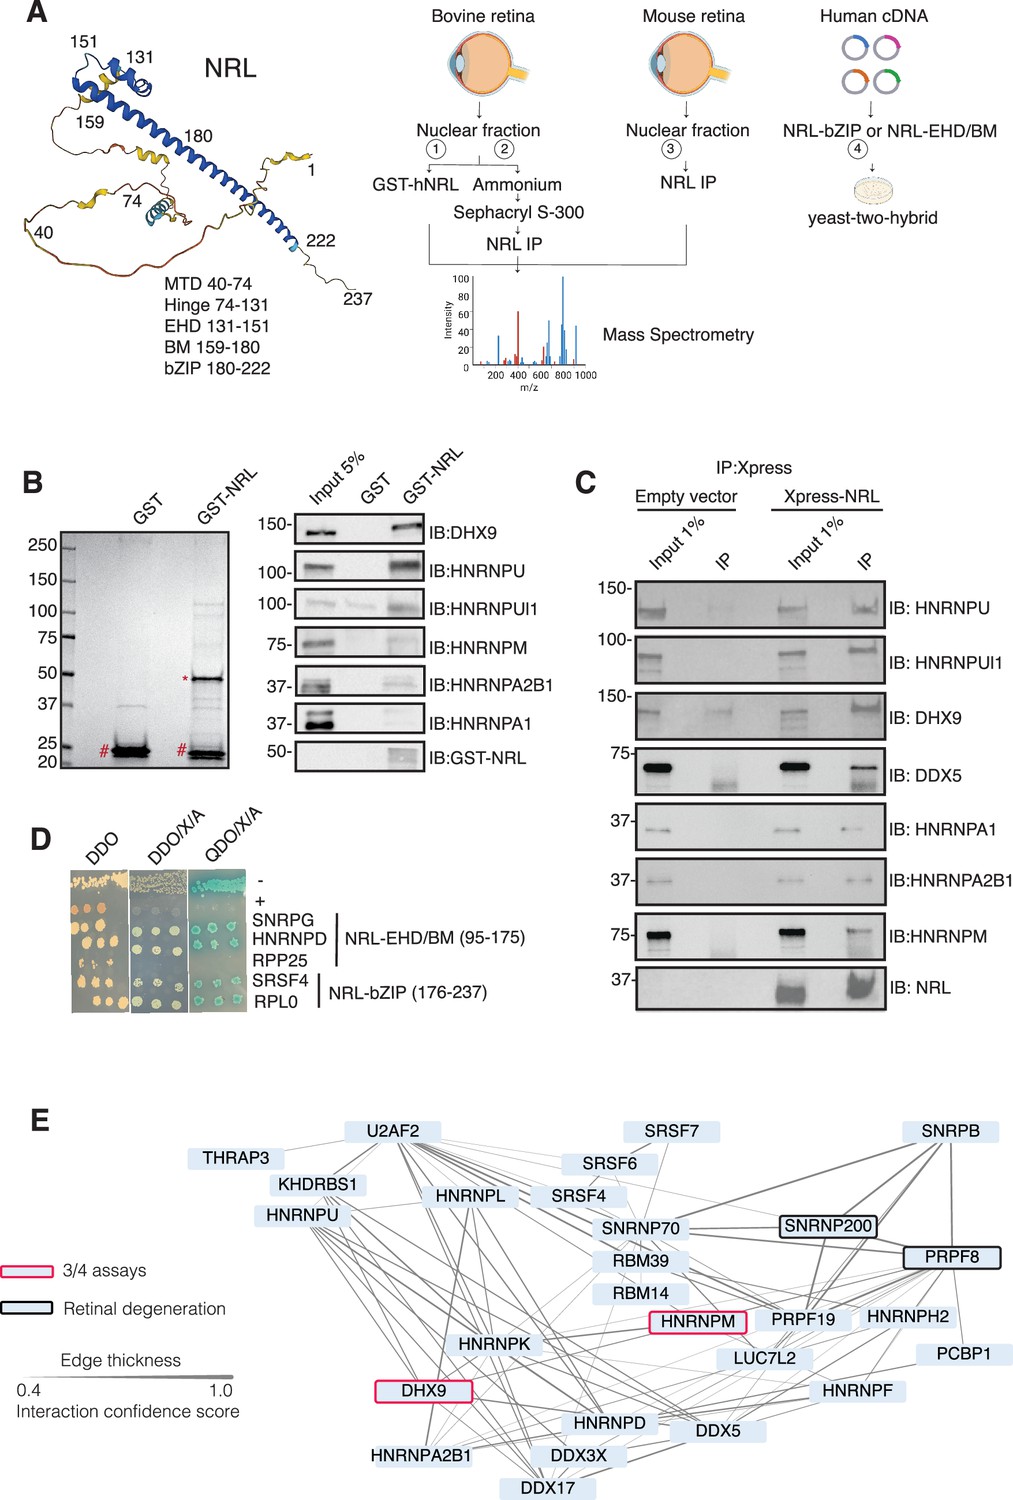
Neural retina leucine (NRL) interacts with RNA-binding proteins (RBPs).
(A) Summary of experimental strategies used to identify NRL interactors. An AlphaFold-predicted model of human NRL is shown, with protein domains highlighted. MTD = minimal transactivation domain, EHD = extended homology domain, BM = basic domain, bZIP = basic leucine zipper. Four different assays were performed to identify NRL interactors. Affinity purifications with Glutathione and NRL antibodies were performed from bovine and mouse retinal lysates and subjected to mass spectrometry. Yeast-two-hybrid experiments from human retina cDNA using NRL bZIP and EHD/BM domains were also performed. Eye, plasmid and yeast depictions were obtained from BioRender. (B) Coomassie staining showing proteins from bovine retina purified with human NRL fused to GST (GST-NRL; *). Purified GST (#) was used as control. Experiments were performed three times with different retinal lysates. Western blot of RBPs identified by LS/MS harboring >10 times enrichment in at least one GST-NRL replicate compared to controls is shown to the right. (C) Western blot showing detection of different RBPs co-immunoprecipitating with NRL in HEK293 cells overexpressing Xpress-tagged NRL. Empty vector containing Xpress tag was used as control. (D) Yeast colonies from yeast-two-hybrid screens showing positive interaction between RBPs and NRL extended homology domain (EHD) and basic leucine zipper (bZIP) domain. Colonies were plated against controls on SD/-Leu/-Trp (Double Dropout; DDO), SD/-Trp/-Leu/X-alpha-gal/Aureobasidin-A (DDO/X/A) and SD/-Trp/-Leu/-Ade/-His/X-alpha-gal/Aureobasidin-A (QDO/X/A) plates. P53 and Lamin were used as positive and negative controls, respectively. (E) Protein–protein interaction (PPI) network showing RBP experimental interactions from String. Proteins represent a subnetwork of NRL-interacting RBPs found in two out of four assays summarized in A. The edge thickness represents the confidence score with a cutoff of 0.4. Proteins identified in three out of four assays are highlighted with a red border. Proteins with known causative mutations for inherited retinal degeneration are shown with a black border.
© 2025, BioRender Inc. Panel A created using BioRender, and is published under a Creative Commons Attribution License. Further reproductions must adhere to the terms of this license.
Figure 1—figure supplement 1

Neural retina leucine–RNA-binding protein (NRL–RBP) interactors are enriched in R-loop proteins.
(A) Western blot of GST-NRL affinity-purified RBPs from bovine retina. Benzonase was added to retinal lysates during GST-NRL incubations. (B) Protein–protein interaction (PPI) network showing RBP experimental interactions from String. The edge thickness represents the confidence score with a cutoff of 0.4. Name of proteins identified in 2/4 assays are shown. Proteins identified in three out of four assays are highlighted in red. (C) Venn diagram showing intersection of R-loop proteomes common to four studies (Li et al., 2020; Mosler et al., 2021; Wang et al., 2018; Padmanabhan et al., 2012) and NRL–RBP candidate interactors identified in 2/4 assays.
-
Figure 1—figure supplement 1—source data 1
PDF file containing original western blots for Figure 1B, C, Figure 1—figure supplement 1A indicating the relevant bands.
- https://cdn.elifesciences.org/articles/103259/elife-103259-fig1-figsupp1-data1-v1.zip
-
Figure 1—figure supplement 1—source data 2
Original files for western blots displayed in Figure 1B, C, Figure 1—figure supplement 1A.
- https://cdn.elifesciences.org/articles/103259/elife-103259-fig1-figsupp1-data2-v1.zip
Figure 2 with 1 supplement
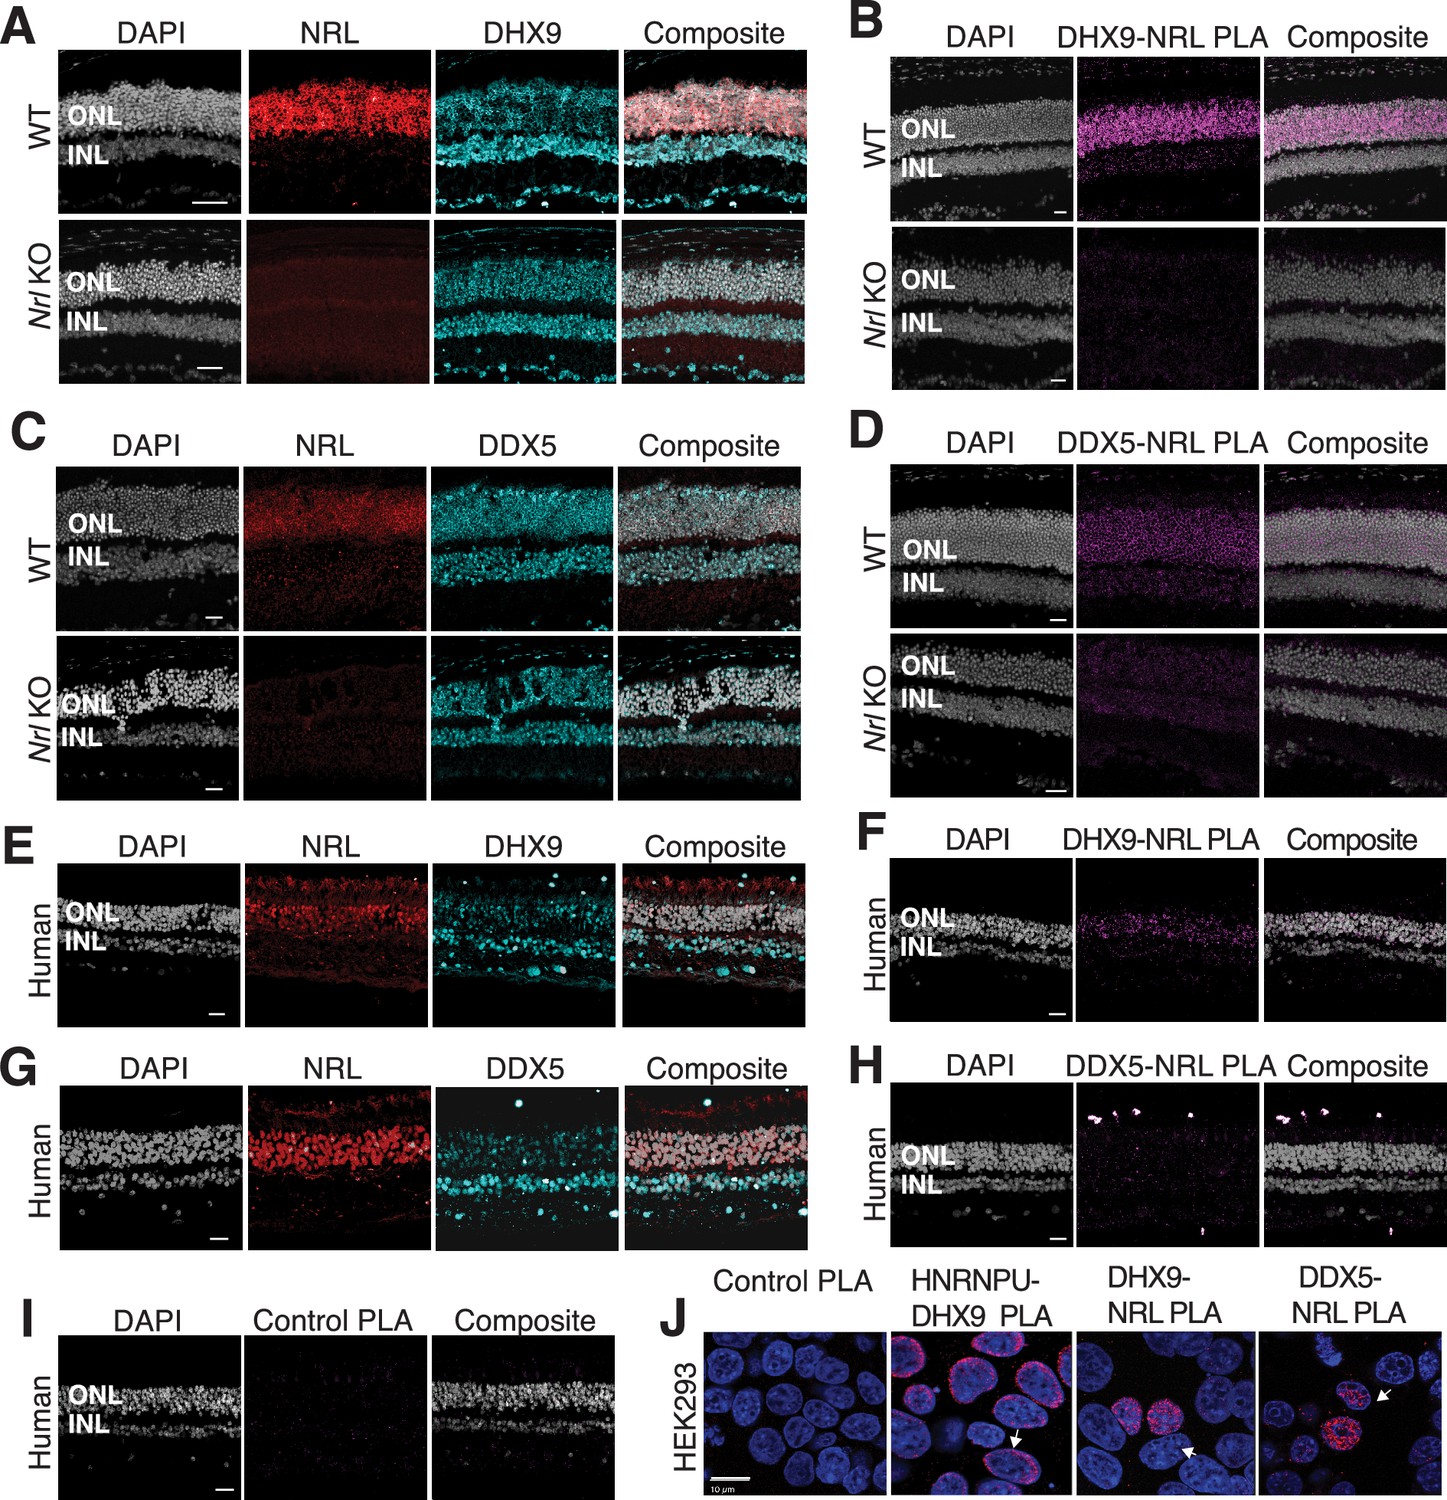
DHX9 and DDX5 are expressed in retinal photoreceptors and interact with neural retina leucine (NRL) within the nuclear compartment.
(A) DHX9 (blue) and NRL (red) expression in adult mouse wild-type (WT) and Nrl Knockout (KO) retina. (B) Proximity ligation assay (PLA) signal (magenta) using anti-DHX9 and NRL antibodies in adult mouse WT and Nrl KO retina. (C) DDX5 (blue) and NRL (red) expression in adult mouse WT and Nrl KO retina. (D) PLA signal (magenta) using anti-DDX5 and NRL antibodies in adult mouse WT and Nrl KO retina. (E) DHX9 (blue) and NRL (red) expression in adult human retina. (F) PLA signal (magenta) using anti-DHX9 and NRL antibodies in the adult human retina. (G) DDX5 (blue) and NRL (red) expression in adult human retina. (H) PLA signal (magenta) using anti-DDX5 and NRL antibodies in the adult human retina. (I) PLA signal (magenta) using no primary antibody in the adult human retina. (J) PLA signal in HEK293 cells overexpressing human Xpress–NRL. DHX9 interaction with its known protein partner HNRNPU is shown in the nuclear periphery (arrow). Xpress–NRL interaction with DDX5 and DHX9 in euchromatin is shown in red (arrows). Nuclei were counterstained with DAPI (gray in human and mouse retina; blue in HEK293 cells). Scale bar = 20 μM. ONL = outer nuclear layer; INL = inner nuclear layer.
Figure 2—figure supplement 1

Subcellular localization of DHX9 and DDX5 in adult mouse retina (P28).
(A) DHX9 and DDX5 localization to the euchromatin region (nuclear periphery in murine rods) is shown in red. Zoom-in insets show proteins distributed in puncta (arrows). Nuclei are stained with DAPI. Scale bar is 10 μM. (B) Proximity ligation assay (PLA) signal (magenta) using anti-DHX9 and goat IgG antibodies in the adult human retina. Scale bar = 20 μM. ONL = outer nuclear layer; INL = inner nuclear layer.
Figure 3 with 1 supplement
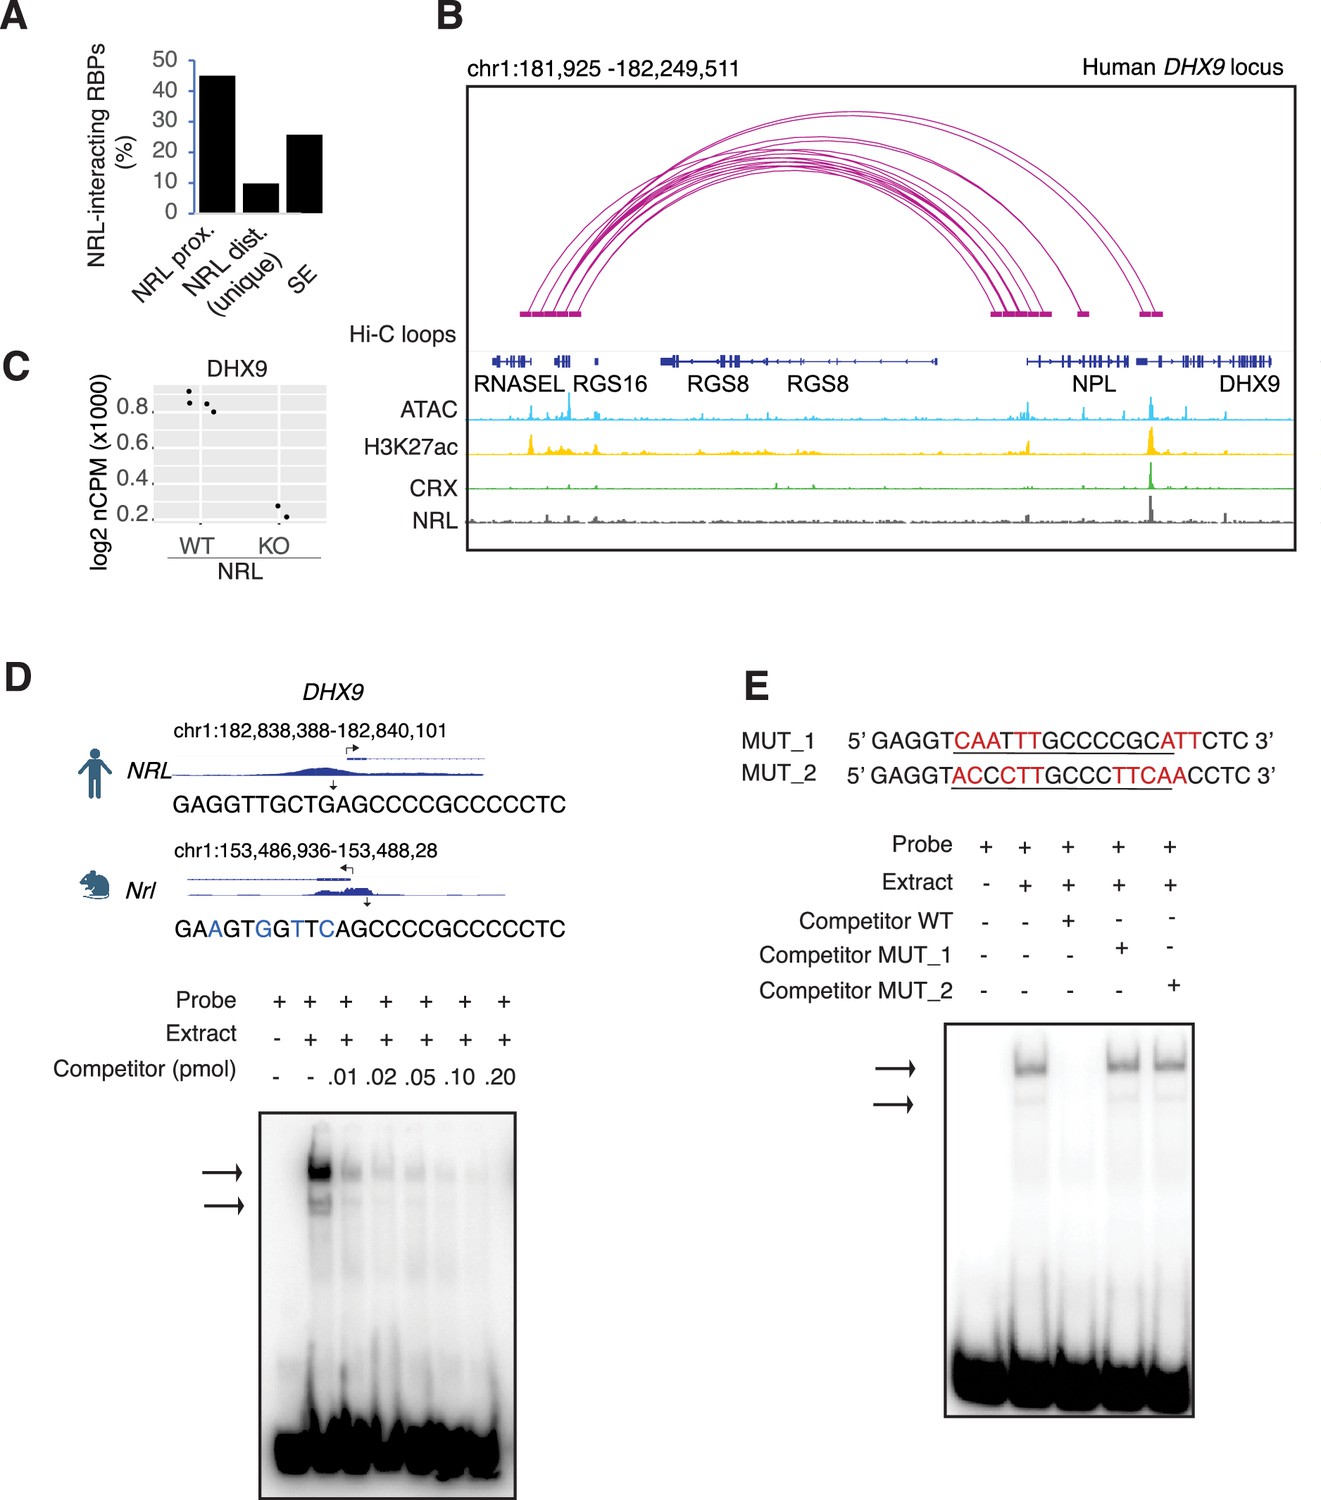
Neural retina leucine (NRL) genetically interacts with RNA-binding proteins (RBPs).
(A) Bar graph showing the fraction of NRL-interacting RBPs that harbor NRL proximal (±1 kb gene body) or distal (>1 kb gene body) ChIP-Seq peaks and/or super enhancers (SEs) in the human retina (data from Marchal et al., 2022). (B) Genomic view of the human DHX9 locus showing Hi-C loops, ATAC-Seq, H3K27ac, CRX-ChIP-Seq, and NRL-ChIP-Seq tracks (obtained from Marchal et al., 2022). (C) Expression levels of Dhx9 in wild-type and Nrl knockout flow-sorted photoreceptors (obtained from Kim et al., 2016). (D) Electrophoretic mobility shift assay (EMSA) autoradiography using a probe containing an NRL motif identified at NRL-ChIP-Seq peak on the human DHX9 promoter. Chip-Seq or CUT&RUN profiles for human and mouse NRL at the DHX9 promoter (obtained from Marchal et al., 2022 and Liang et al., 2022, respectively) are shown. The location of the NRL motif is shown with arrows. The sequence of the 32P-labeled probe containing human NRL motif (underlined) and its homologous sequence in mouse is shown on the top panel (blue letters indicate nucleotide differences). The blot depicts the formation of specific bands (arrows) after incubation with bovine nuclear retina extracts. Competition assays were performed using unlabeled probes at increasing concentrations (pmol) as shown. (E) EMSA autoradiography showing competition assays with 0.2 pmol WT and mutant DHX9 probes, MUT_1 and MUT_2 (sequences are shown in top panel; nucleotide changes are shown in red).
Figure 3—figure supplement 1

Neural retina leucine (NRL) occupancy on super enhancers at genes encoding NRL-interacting RNA-binding proteins (RBPs).
(A) Genomic view of the human DDX5, HNRNPU, DDX3X, and THRAP loci showing Hi-C loops, RNA-Seq, ATAC-Seq, H3K27ac ChIP-Seq, CRX-ChIP-Seq, NRL-ChIP-Seq, and super-enhancer tracks (obtained from Marchal et al., 2022). (B) Genome browser view showing Cut&Run peaks for NRL at mouse Dhx9 promoter.
Figure 4 with 1 supplement
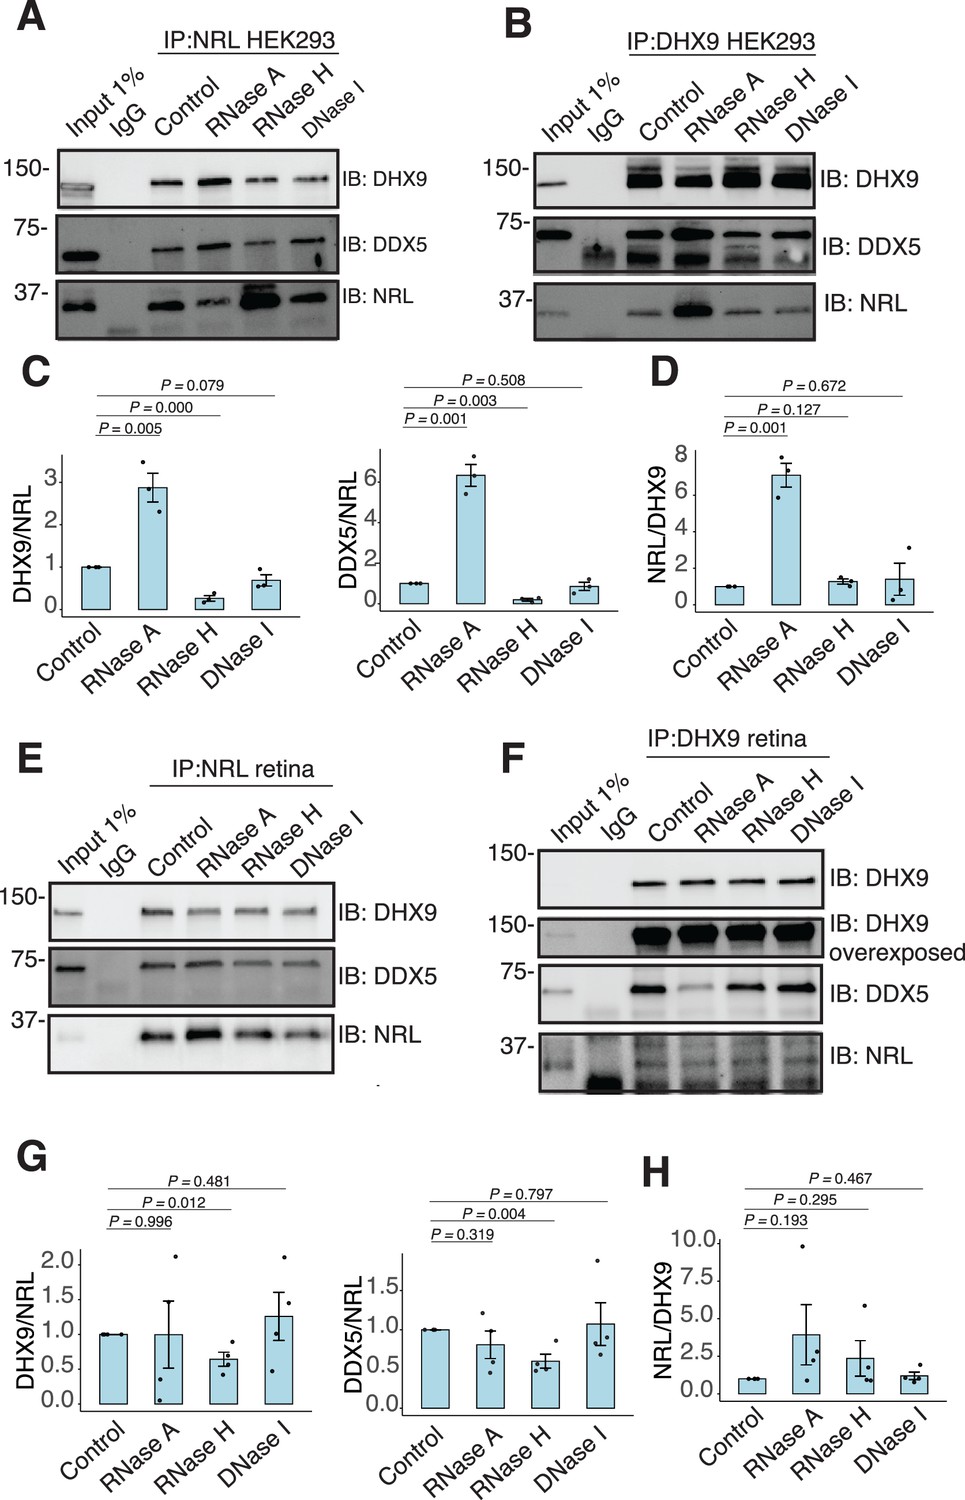
RNA:DNA hybrids regulate the interaction between neural retina leucine (NRL) and DDX5/DHX9.
(A, B) Co-immunoprecipitation (co-IP) of DDX5 and DHX9 from HEK293 cells overexpressing NRL. Lysates were treated for 30 min with different nucleases (as shown) before incubations with respective antibodies. Immunoprecipitation (IP) of NRL (A) or DHX9 (B) and immunoblot (IB) staining for NRL, DHX9, and DDX5 is shown. (C, D) Quantification of signal intensities normalized to affinity-purified NRL and DHX9 (shown in A and B, respectively) (n = 3). Data are presented as the mean ± SEM. An unpaired two-tailed t-test was performed to compare the means of samples against controls. (E, F) Co-IP of DDX5 and DHX9 from nuclear fractions of bovine retinas. Lysates were treated for 30 min with different nucleases (as shown) before incubations with respective antibodies. IP of NRL (E) or DHX9 (F) and immunoblot (IB) staining for NRL, DHX9, and DDX5 is shown. (G, H) Quantification of signal intensities normalized to affinity-purified NRL and DHX9 (shown in E and F, respectively) (n = 4). Data are presented as the mean ± SEM. Unpaired two-tailed t-test was performed to compare means of samples against controls.
-
Figure 4—source data 1
PDF file containing original western blots for Figure 4A, B, E, F, indicating the relevant bands and treatments.
- https://cdn.elifesciences.org/articles/103259/elife-103259-fig4-data1-v1.zip
-
Figure 4—source data 2
Original files for western blots displayed in Figure 4A, B, E, F.
- https://cdn.elifesciences.org/articles/103259/elife-103259-fig4-data2-v1.zip
Figure 4—figure supplement 1

DHX9 interacts with DDX5 in HEK293 and bovine retina.
Co-immunoprecipitation (co-IP) of DDX5 with DHX9 antibody in HEK293 cells overexpressing neural retina leucine (NRL) (A) and in bovine retina (B). Lysates were treated for 30 min with different nucleases (as shown) before incubations with DHX9 antibody (n = 3 for HEK cells; n = 4 for bovine retina). Quantification of signal intensities were normalized to precipitated DHX9. Data are presented as the mean ± SEM. Unpaired two-tailed t-test was performed to compare means of samples against controls.
Figure 5 with 1 supplement
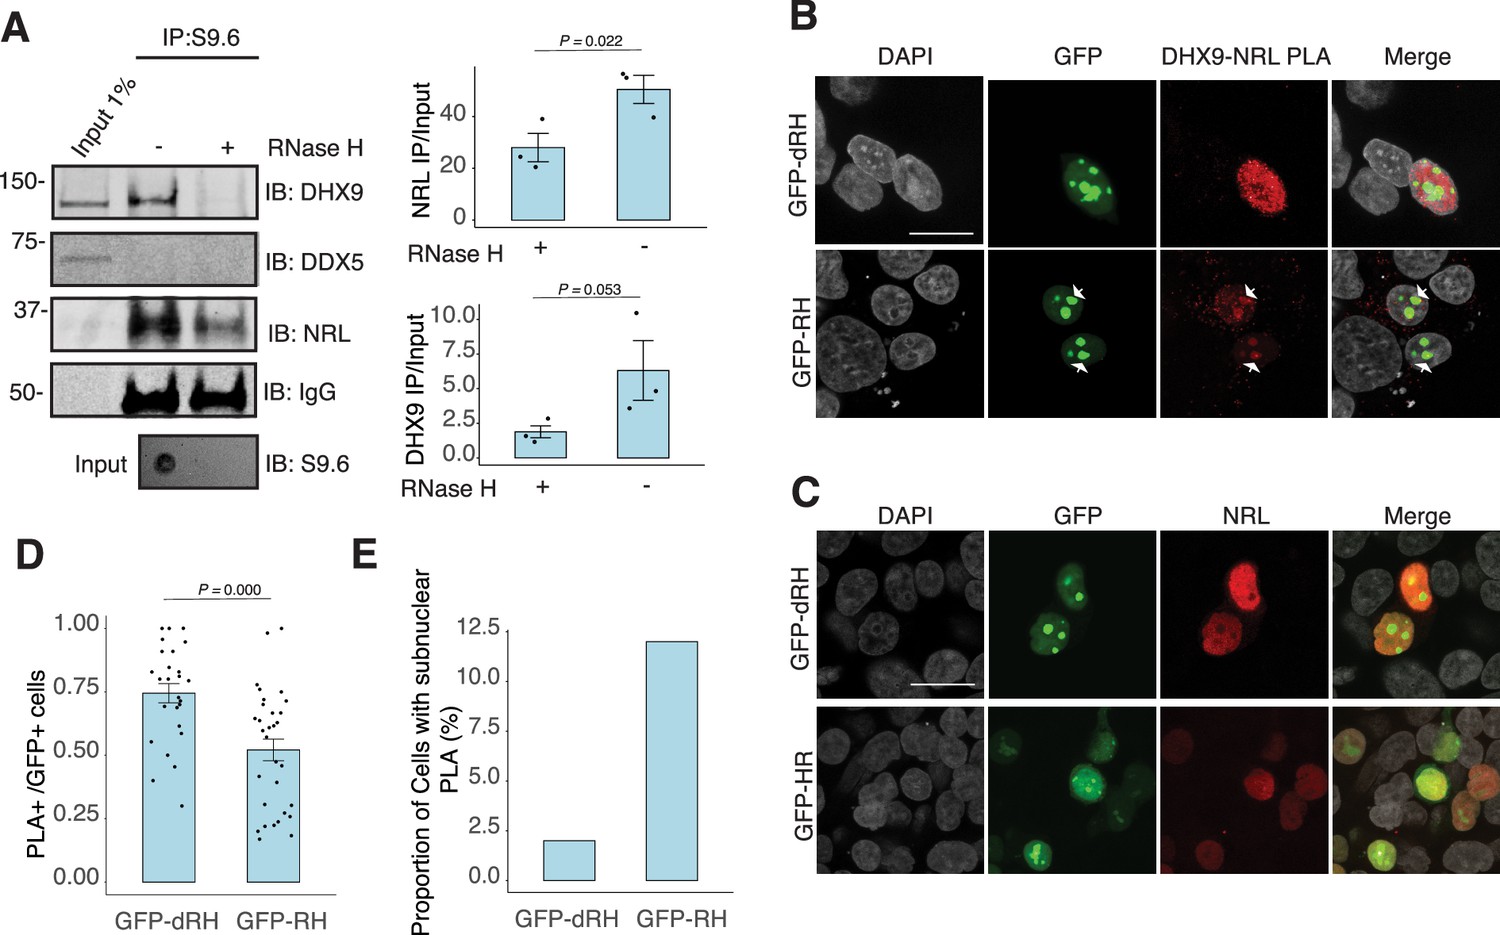
Nuclear R-loops regulate the interaction between neural retina leucine (NRL) and DHX9.
(A) Western blot of DNA:RNA hybrid immunoprecipitation (DRIP) from adult mouse retina showing immunoblot (IB) staining for DHX9, NRL, and DDX5. Retinal genomic DNA (gDNA) was digested with MseI, DdeI, Alul, MboI, incubated with RNase III with/without RNase H and immunoprecipitated with S9.6 antibody/protein G beads. Retinal nuclear lysates were incubated with antibody/bead complexes. Quantification of signal intensities of immunoprecipitated DHX9 and NRL compared to input (n = 3). Data are presented as the mean ± SEM. Unpaired one-tailed t-test was performed to compare means of samples against controls. (B) Confocal image of HEK293 cells transfected with NRL and wild-type (WT) human RNase H1 or D201N catalytic dead mutant EGFP fusions (GFP-HR and GFP-dHR, respectively). Proximity ligation assay (PLA) signals using antibodies for NRL and DHX9 are shown in red. Some cells displayed nucleolar-like accumulation of PLA signal (arrows). (C) Confocal image of HEK293 cells transfected with NRL and GFP-dRH or GFP-RH and stained with antibodies against NRL (red). Nuclei are stained with DAPI (gray). Scale bar is 20 μM. (D) Quantification of cells with positive PLA signals from B. Each dot represents a ratio of number of GFP+ cells with nuclear PLA signals per image. Data are presented as the mean ± SEM. Unpaired two-tailed t-test was performed to compare means of samples against controls. (E). Bar graph showing percentage of EGFP+ cells harboring NRL–DHX9 PLA signals in subnuclear compartments from B. Cells were counted in four independent assays (n = 83 and 85 cells for GFP-dHR and GFP-RH, respectively).
-
Figure 5—source data 1
PDF file containing original western blots for Figure 5A, indicating the relevant bands.
- https://cdn.elifesciences.org/articles/103259/elife-103259-fig5-data1-v1.zip
-
Figure 5—source data 2
Original files for western blots displayed in Figure 5A.
- https://cdn.elifesciences.org/articles/103259/elife-103259-fig5-data2-v1.zip
Figure 5—figure supplement 1

Expression of DHX9 in RNase H1-overexpressing HEK293 cells.
Confocal images of cells transfected with neural retina leucine (NRL) and wild-type (WT) human RNase H1 or D201N catalytic dead mutant EGFP fusions (GFP-HR and GFP-dHR, respectively). Cells were stained with antibodies against DHX9 (red). Nuclei were stained with DAPI (gray). Scale bar is 20 μM.
Figure 6 with 2 supplements
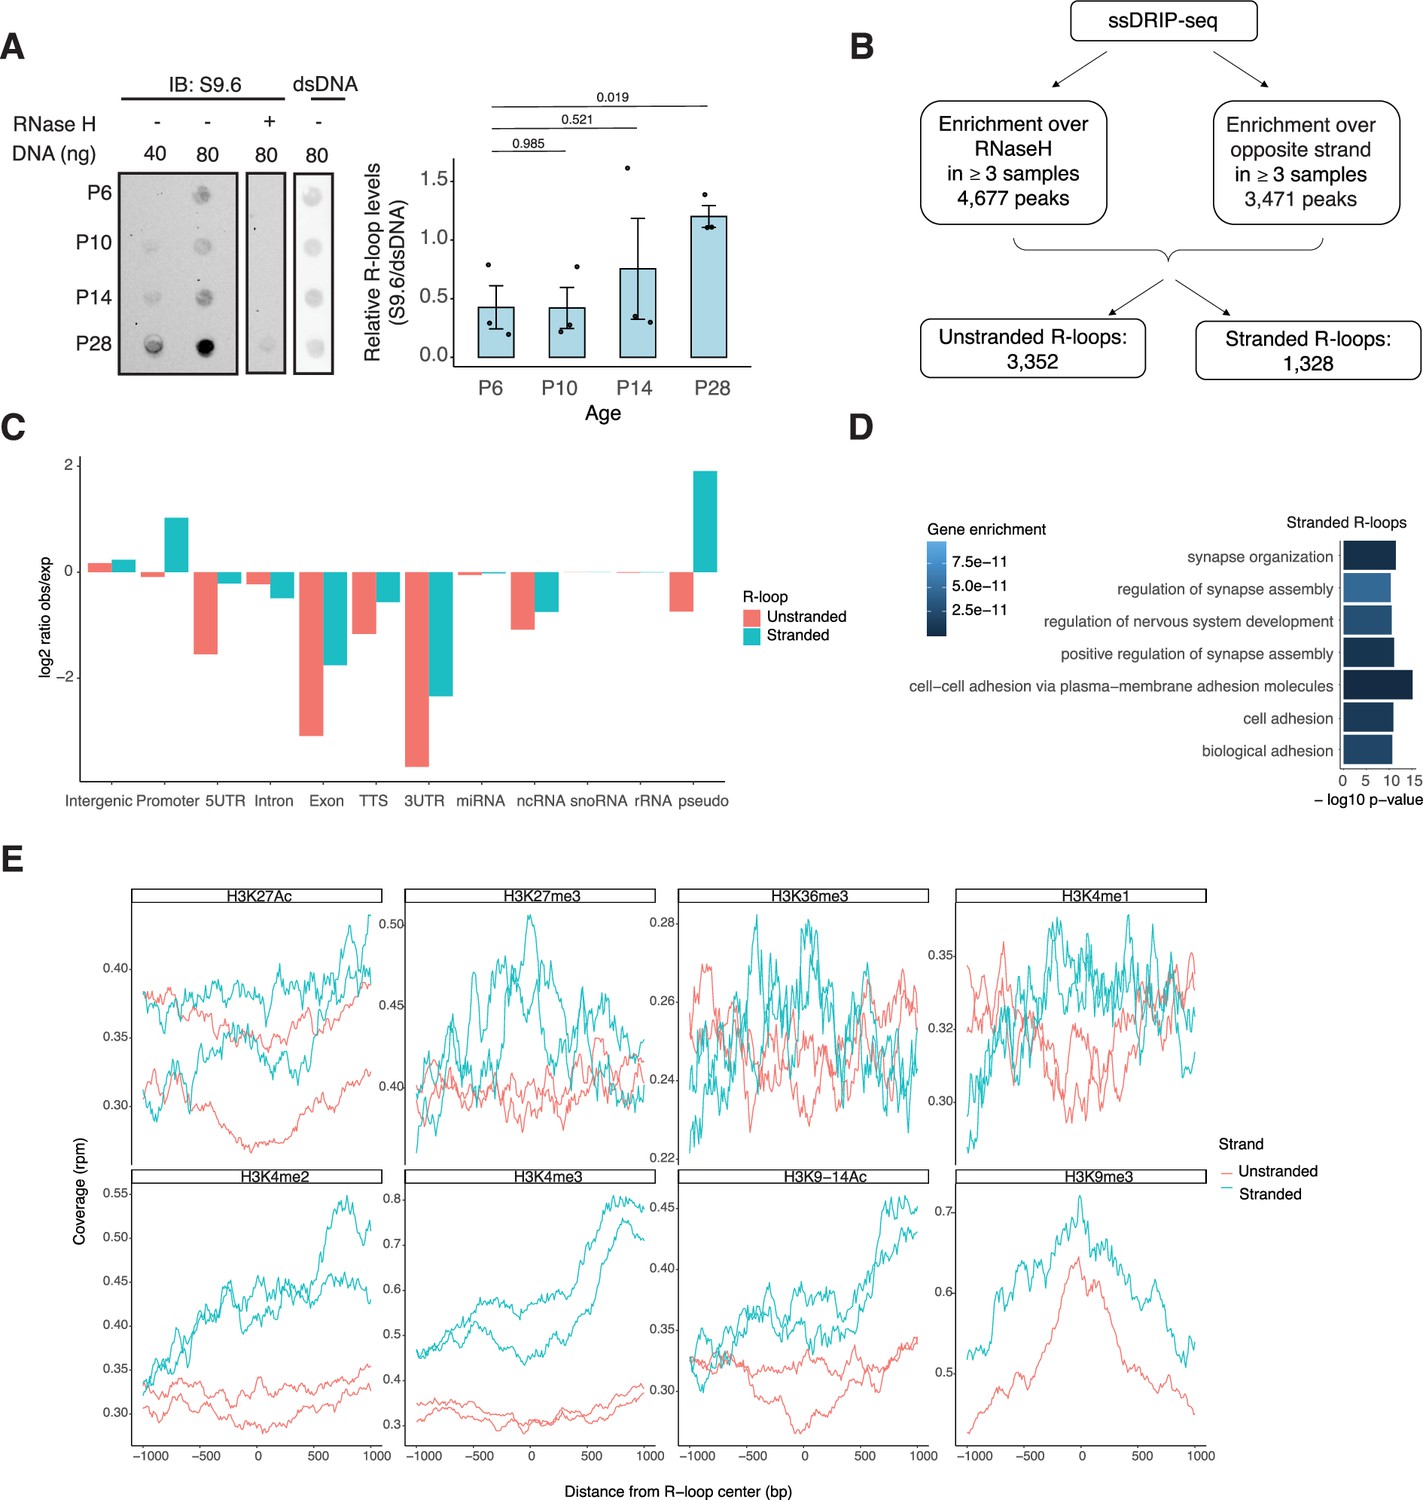
R-loops are dynamic in the mouse retina and associate with distinct epigenetic signatures.
(A) Dot blot of DNA:RNA hybrids from retinal gDNA. Retinas were dissected from mice at different developmental stages as shown. Genomic DNA (gDNA) was treated with RNaseIII with and without RNase H overnight. R-loops were detected using S9.6 antibody (n = 3). Data are presented as the mean ± SEM. Unpaired two-tailed t-test was performed to compare means of samples against controls. (B) R-loop peaks from ssDRIP-Seq were identified using RNase H-treated samples as controls. R-loops found in at least three samples with a q-value <0.001 in the narrow call or in the broad call were merged. Stranded R-loops were filtered using the opposite strand as reference. (C) Observed versus expected ratio of unstranded and stranded R-loops at different genomic regions. (D) Biological process enrichment of genes associated with stranded R-loops. (E) Metaplot of H3K27ac, H3K27me3, H3K36me3, H3K4me1, H3K4me2, H3K4me3, H3K9-14ac, and H3K9me3 signals centered on stranded and unstranded R-loop peaks.
-
Figure 6—source data 1
PDF file containing original dot blots for Figure 6A, indicating the relevant treatments.
- https://cdn.elifesciences.org/articles/103259/elife-103259-fig6-data1-v1.zip
-
Figure 6—source data 2
Original files for dot blots displayed in Figure 6A.
- https://cdn.elifesciences.org/articles/103259/elife-103259-fig6-data2-v1.zip
Figure 6—figure supplement 1

R-loops are increased in neural retina leucine (NRL) KO retina.
Dot blot of DNA:RNA hybrids from adult wild-type and Nrl KO retina. Genomic DNA (gDNA) from retina was treated with RNase III with and without RNase H overnight. R-loops were detected using S9.6 antibody. Bar graph shows quantification of R-loop levels in wild-type compared to Nrl KO retina (n = 3). Data are presented as the mean ± SEM. Unpaired two-tailed t-test was performed to compare means of samples against controls.
-
Figure 6—figure supplement 1—source data 1
PDF file containing original dot blots for Figure 6—figure supplement 1, indicating the relevant treatments.
- https://cdn.elifesciences.org/articles/103259/elife-103259-fig6-figsupp1-data1-v1.zip
-
Figure 6—figure supplement 1—source data 2
Original files for dot blots in Figure 6—figure supplement 1.
- https://cdn.elifesciences.org/articles/103259/elife-103259-fig6-figsupp1-data2-v1.zip
Figure 6—figure supplement 2
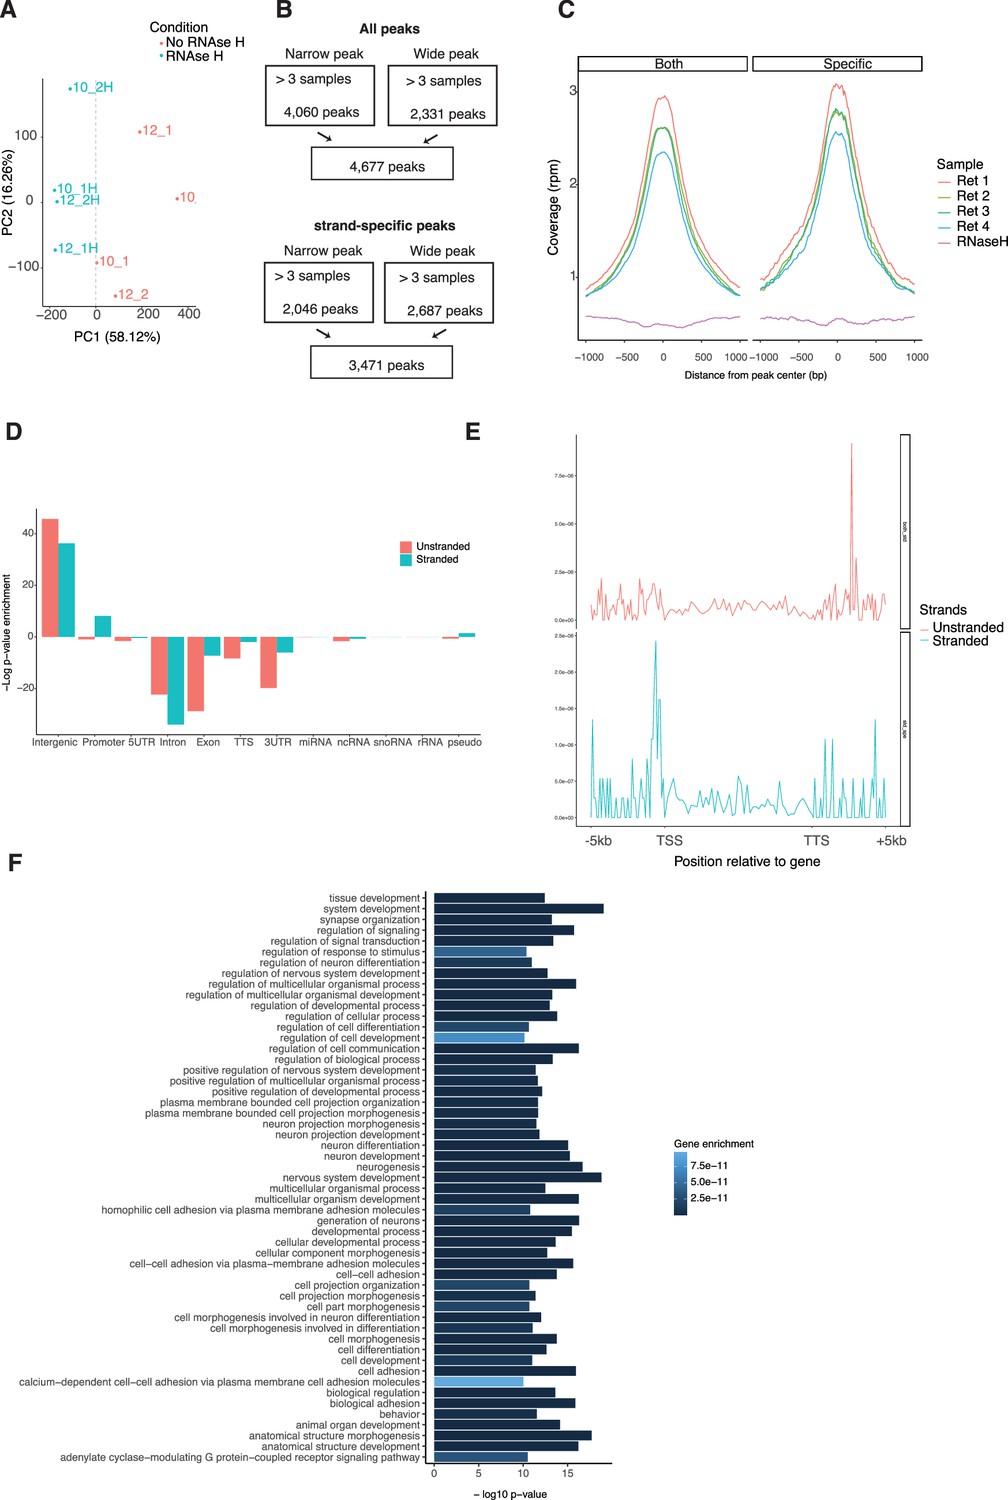
Signatures of R-loop formation in the retina.
(A) Principal components analysis on scaled DRIP-Seq coverage (500 bp windows). PC1 (x axis) and PC2 (y axis) are plotted. Color represents samples treated (blue) or not (red) with RNase H. The gray dotted line shows the PC1 value separating treated versus non-treated samples. (B) R-loop peaks from ssDRIP-Seq identified with narrow or broad peak parameters using RNase H-treated sample (upper flow chart) or the opposite strand (lower flow chart) for enrichment. (C) Metaplot showing coverage per ssDRIP sample on stranded and unstranded R-loop peaks. (D) Metaplot of ssDRIP-Seq signals for stranded or unstranded R-loops centered on gene bodies ±5 kb. (E) Enrichment of unstranded and stranded R-loops at different genomic regions. (F) Biological process enrichment of genes associated with stranded R-loops.
Figure 7 with 2 supplements

Neural retina leucine (NRL) is associated with different types of R-loops.
(A) Metaplot of BRD4 (SRR4252658), CTCF (SRR4252685), NRL (Cut&Run), and RNA pol II (SRR4252922) signals centered on stranded and unstranded R-loop peaks. (B) Proportion of genes with and without stranded and unstranded R-loops and harboring NRL Cut&Run and Chip-Seq peaks. Genes were divided into three groups (low, mid, and high) based on their expression levels. (C) Genome view of Tex14 and Mplkip mouse genes displaying ssDRIP-Seq signal in four retinas. Signals are shown for the positive (orange) and negative (blue) strands separately. RNase H-treated samples are pooled and shown for each strand. Peak calls for NRL and unstranded and stranded R-loops are shown in blue. (D) Gene density probability plot showing the distribution of R-loops over expressed genes of different lengths. Genes were divided into three groups according to their expression levels.
Figure 7—figure supplement 1
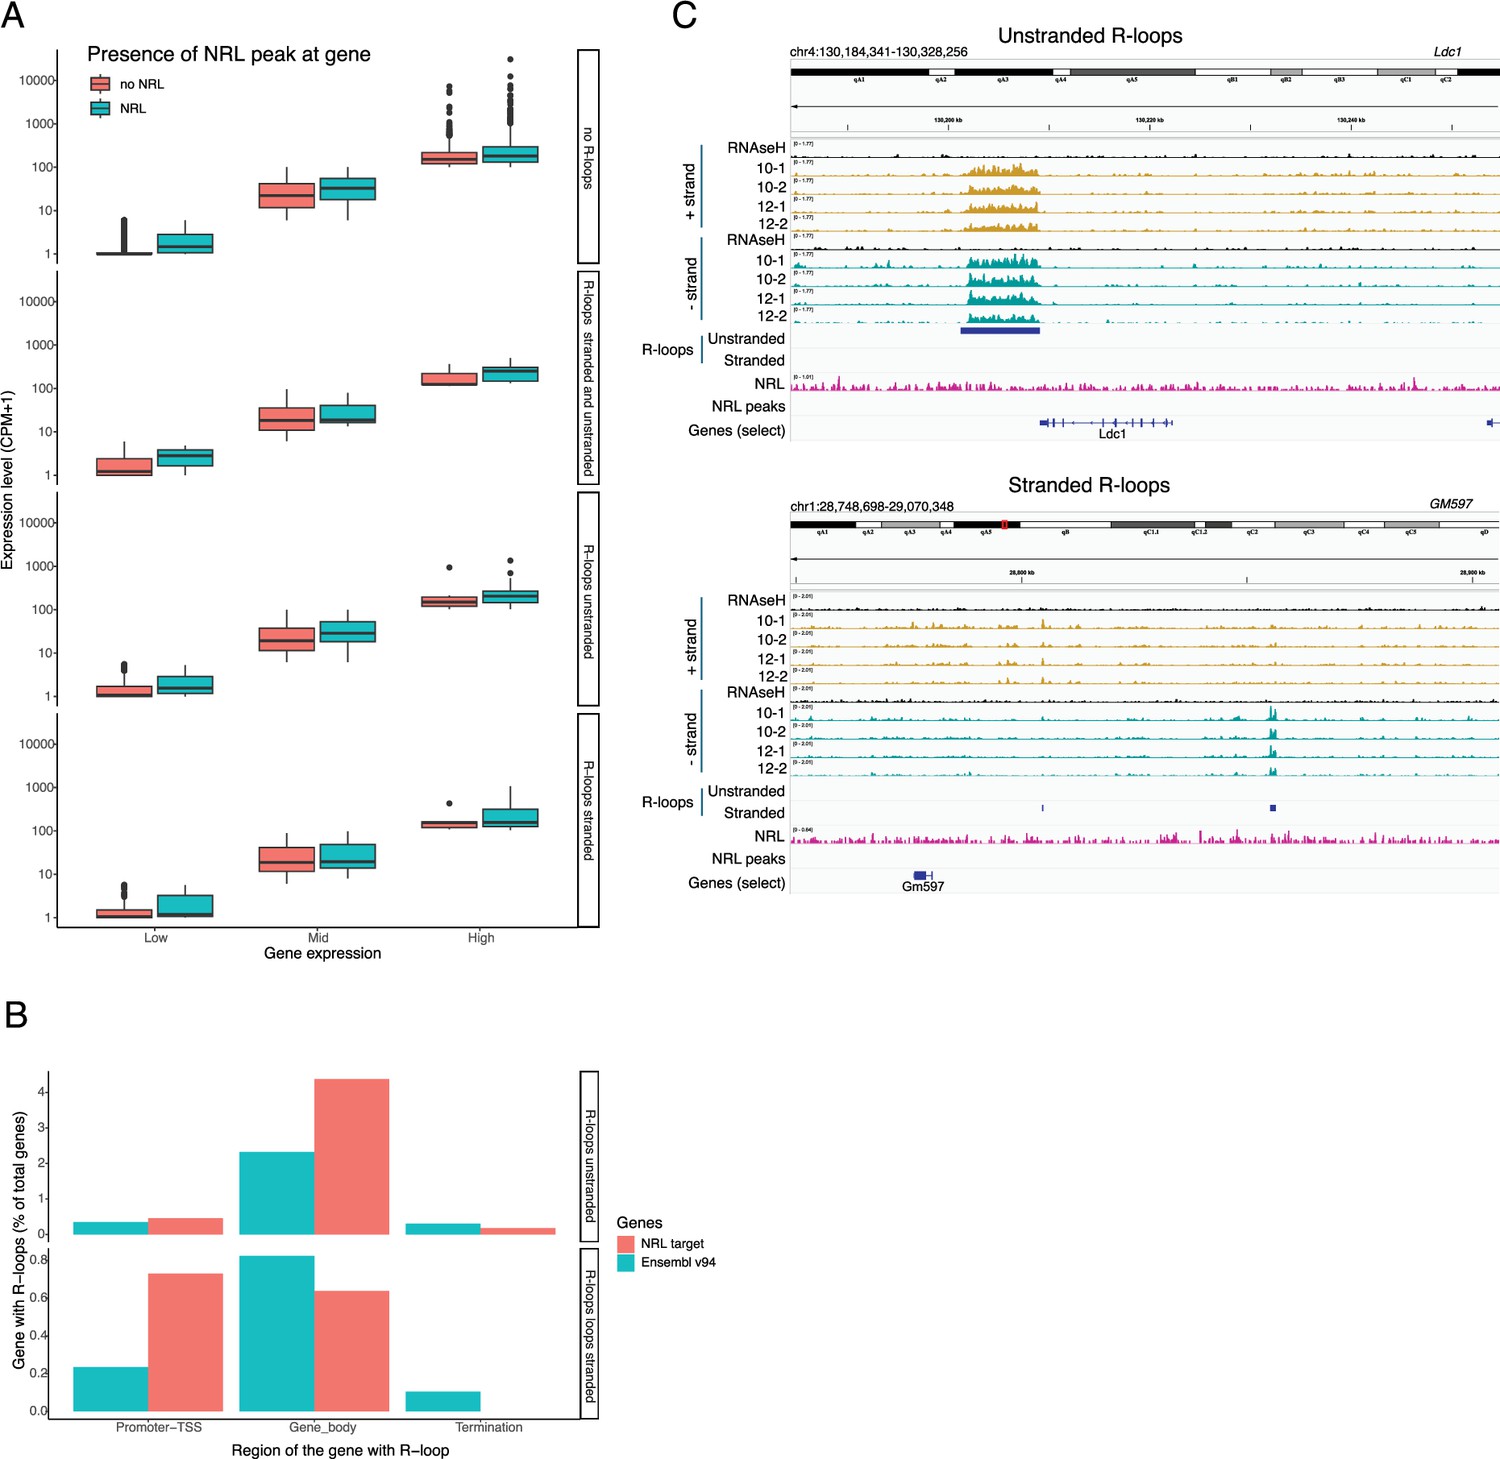
Distribution of neural retina leucine (NRL) peaks over genes.
(A) Boxplot showing the expression level of low, mid, and highly expressed genes with or without NRL binding. (B) Bargraph showing R-loops over different gene regions at all genes (Ensemble v94) and genes regulated by NRL (obtained from Liang et al., 2022). (C) Genome view of Ldc1 mouse gene and an intergenic region displaying ssDRIP-Seq signal in four retinas. Signals are shown for the positive (orange) and negative (blue) strands separately. RNase H-treated samples are pooled and shown for each strand (black). Peak calls for NRL and unstranded and stranded R-loops are shown in blue.
Figure 7—figure supplement 2
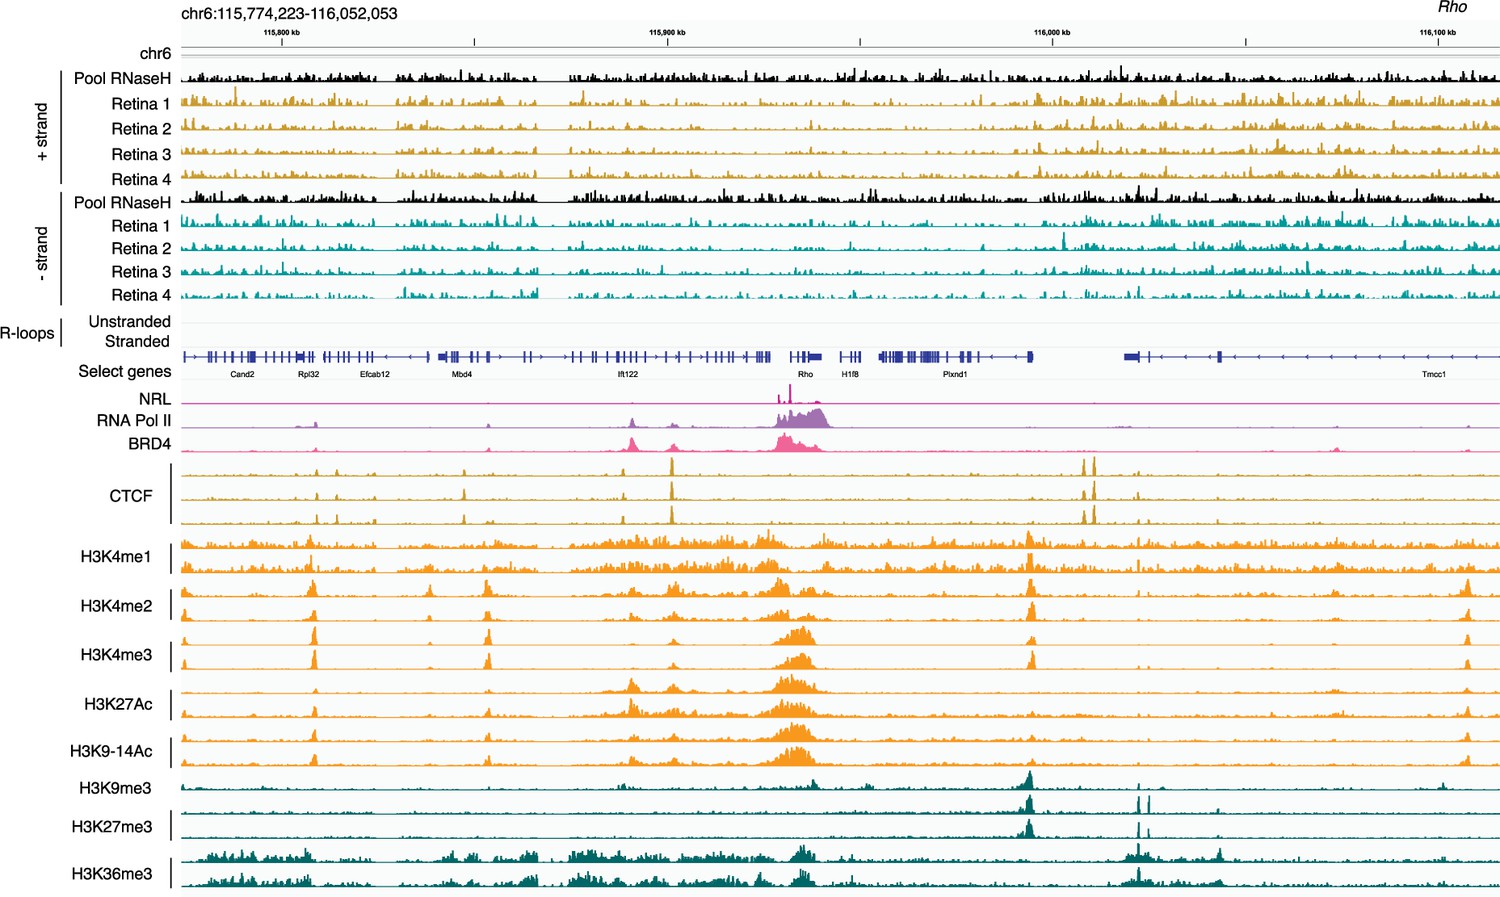
Absence of R-loops over the Rho gene.
Genome view of Rho mouse gene and neighboring loci displaying ssDRIP-Seq signal in four retinas. Signals are shown for the positive (orange) and negative (blue) strands separately. RNase H-treated samples are pooled and shown for each strand (black). Peak calls for neural retina leucine (NRL) and unstranded and stranded R-loops are not present. Signals for NRL, RNA pol II, BRD4, CTCF, and various histone modifications are shown.
Figure 8
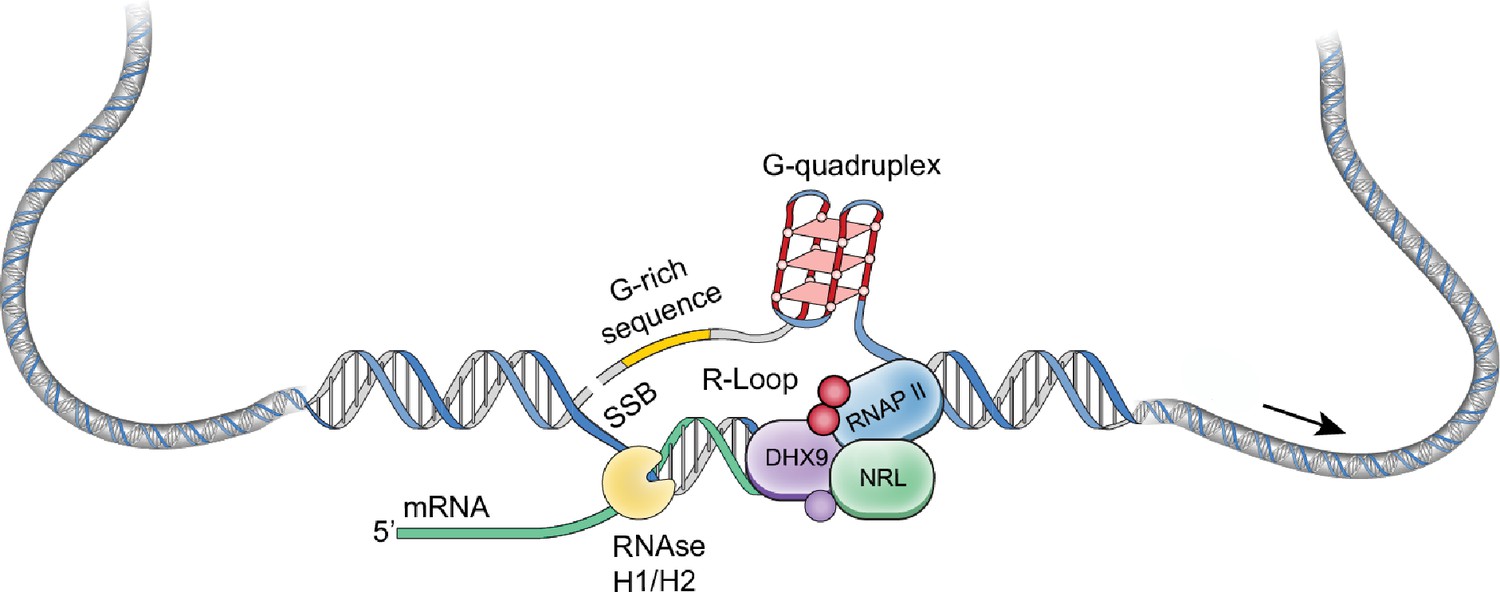
A putative model of R-loop regulation in retinal rod photoreceptors.
We hypothesize that neural retina leucine (NRL) guides R-loop resolvases such as DHX9 at photoreceptor genes to critically regulate gene expression. SSB, single strand break.
Additional files
-
Supplementary file 1
Neural retina leucine (NRL)-interacting retinal proteins identified by liquid chromatography with tandem mass spectrometry (LC–MS–MS) after purification with NRL-GST.
Peptide spectrum match (PSM) values are shown for each protein. The listed proteins were enriched in three independent experiments.
- https://cdn.elifesciences.org/articles/103259/elife-103259-supp1-v1.xlsx
-
Supplementary file 2
Neural retina leucine (NRL)-interacting retinal proteins identified by liquid chromatography with tandem mass spectrometry (LC–MS–MS) from bovine retinal fractions and mouse retina.
RNA-binding proteins (RBPs), all mouse proteins, and all bovine proteins are shown in different tabs.
- https://cdn.elifesciences.org/articles/103259/elife-103259-supp2-v1.xlsx
-
Supplementary file 3
R-loop-interacting proteins from this study and published datasets.
- https://cdn.elifesciences.org/articles/103259/elife-103259-supp3-v1.xlsx
-
Supplementary file 4
Genes from the RetNet database harboring R-loops.
Genes with neural retina leucine (NRL) peaks are depicted as yes (Y).
- https://cdn.elifesciences.org/articles/103259/elife-103259-supp4-v1.xlsx
-
Supplementary file 5
Neural retina leucine (NRL)-regulated genes at different mouse postnatal (P) time points.
- https://cdn.elifesciences.org/articles/103259/elife-103259-supp5-v1.xlsx
-
MDAR checklist
- https://cdn.elifesciences.org/articles/103259/elife-103259-mdarchecklist1-v1.pdf
Download links
A two-part list of links to download the article, or parts of the article, in various formats.
Downloads (link to download the article as PDF)
Open citations (links to open the citations from this article in various online reference manager services)
Cite this article (links to download the citations from this article in formats compatible with various reference manager tools)
Maf-family bZIP transcription factor NRL interacts with RNA-binding proteins and R-loops in retinal photoreceptors
eLife 13:RP103259.
https://doi.org/10.7554/eLife.103259.3


