Dopamine activity encodes the changing valence of the same stimulus in conditioned taste aversion paradigms
- Division of Endocrinology, Diabetes and Metabolism, Department of Medicine, University of Illinois at Chicago, United States
- Department of Psychology, University of Illinois at Chicago, United States
- Graduate Program in Neuroscience, University of Illinois at Chicago, United States
Figures
Figure 1 with 1 supplement
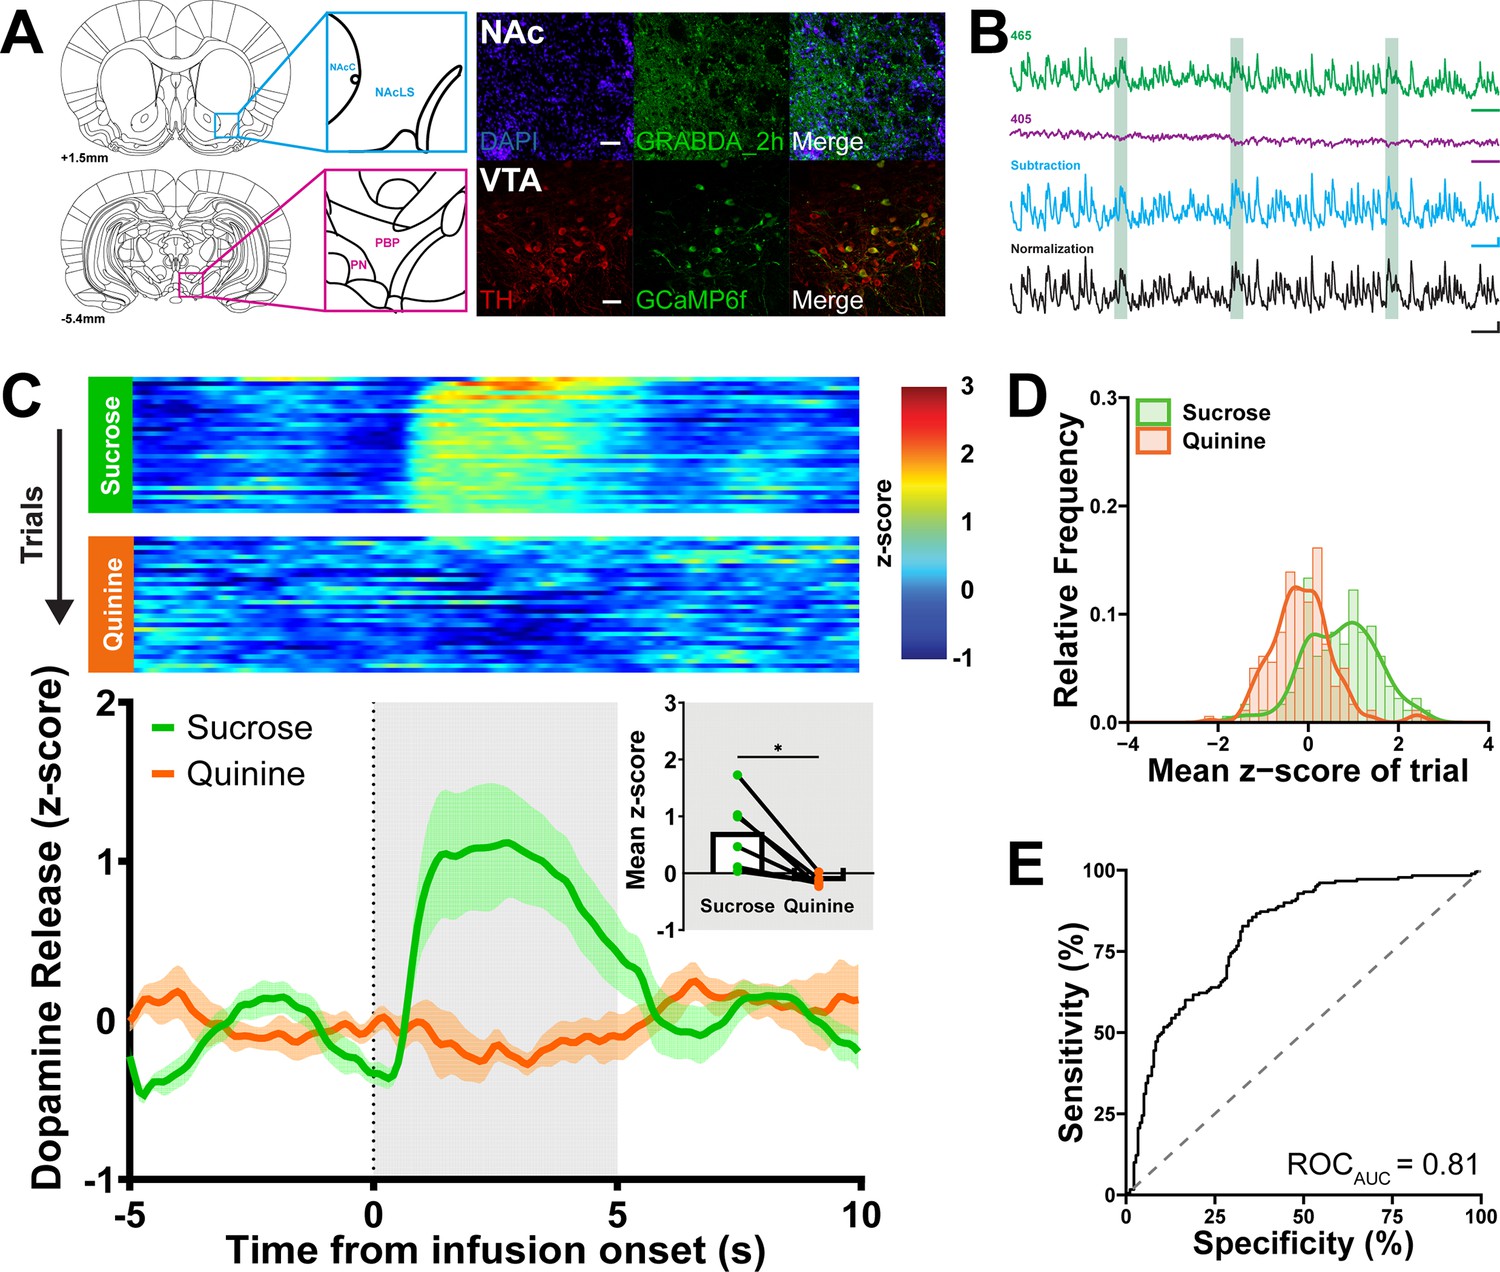
In vivo fiber photometry in the mesolimbic dopamine system captures phasic dopamine responses to primary taste stimuli.
(A) Representative images of GRABDA_2h and Cre-dependent GCamp6f expression in the NAc and VTA, respectively. Top row: Dopamine release recordings from the lateral subregion of the NAc shell are confirmed via viral expression of dopamine-sensor, GRABDA2h (green), probed against DAPI (blue) to visualize sensor location targeted to the lateral shell of the NAc (NAcLS), which borders the NAc core (NAcC). Bottom row: Dopamine cellular activity was recorded in TH Cre+ rats in the VTA (paranigral nucleus [PN], the parabrachial pigmented area [PBP]). TH+ (red) colocalized with intracellular calcium-sensor, GCaMP6f (green) to demonstrate isolation of the VTADA population. (B) Real-time dopamine release in the NAc across processing steps from a representative rat receiving 5 s 0.3 M sucrose intraoral infusions (light green bars). Fluorescence excited by the 465 nm (Ca2+- and GRABDA2h-dependent, green) and 405 nm light-emitting diode (LED) (Ca2+-independent, purple) was captured. 465 and 405 nm traces were scaled and subtracted to remove motion artifacts and photobleaching (blue). Fluorescence was then normalized to the whole recording session and represented as a z-score (black). (C) Top: Heat maps show the average NAc dopamine release on each trial (row) throughout the 30-trial session (trial 1 at the top). On each trial, 200 µl of 0.3 M sucrose (top panel) or 0.001 M quinine (bottom panel) was delivered over 5 s. Bottom: Average dopamine release averaged across all trials aligned to the onset of intraoral delivery. Dotted line represents onset of infusion and gray shading reflects infusion duration and time window for statistical analysis. Inset: z-score averaged first across the infusion period and then across trials and rats. Individual points represent data from each rat and lines connect sucrose (green) and quinine (orange) data for each rat. (D) Relative frequency histogram of dopamine responses (mean z-score) to sucrose and quinine from every trial reported. (E) Receiver operating characteristic (ROC) of (D) determined a discriminable difference between dopamine responses. Scale bars in (B): 10 s (465 and 405), 5 ΔF/F/10 s (subtraction), 1 z-score/10 s (normalized). Mean ± SEM are represented as solid lines and shading (C); *p < 0.05, paired t-test.
-
Figure 1—source data 1
Quantified dopamine responses to intraoral sucrose and quinine.
- https://cdn.elifesciences.org/articles/103260/elife-103260-fig1-data1-v1.xlsx
Figure 1—figure supplement 1
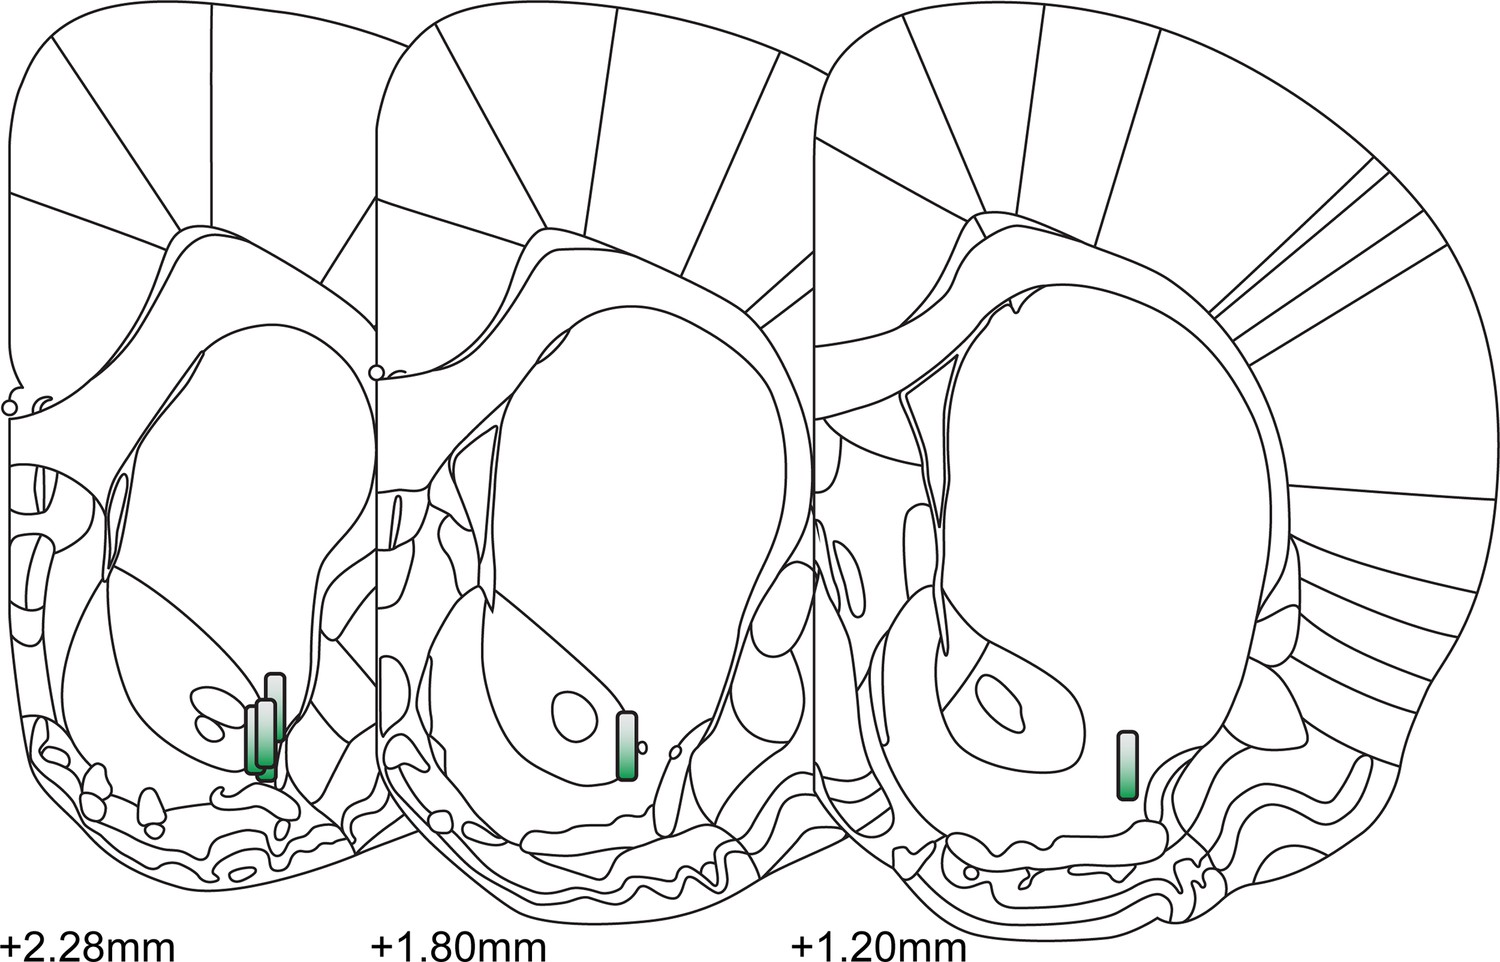
NAc lateral shell recording placements from primary taste experiment.
The fiber optic implant locations in the NAc lateral shell were verified via post-experimental histological reconstruction. Measurement values denote anterior–posterior coronal plane in relation to Bregma. Reconstructed images do not represent the specific hemisphere where fiber optics were implanted.
Figure 2
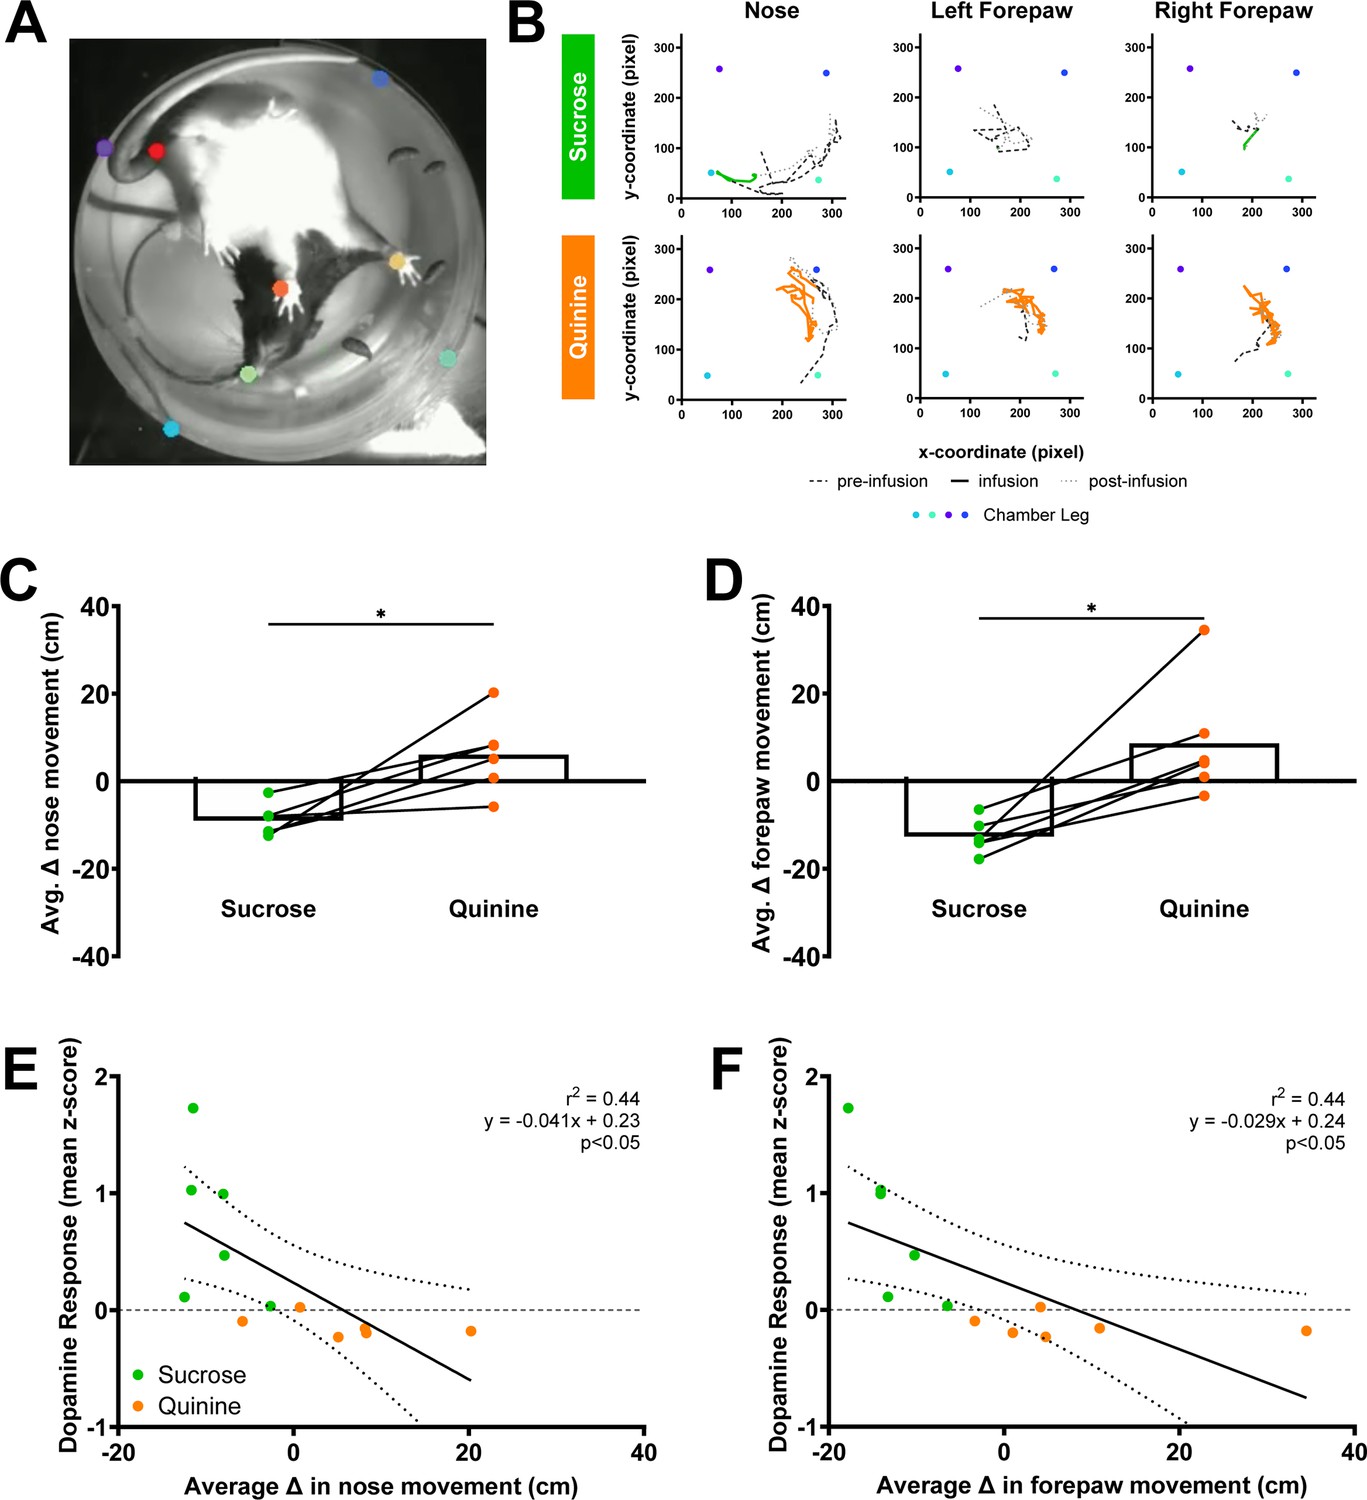
Aversive taste stimuli are linked to increased movement of nose and forepaws.
(A) Representative image of nose, forepaws, tail base, and chamber legs tracking of a rat in a cylindrical chamber from a below chamber perspective. Positional coordinates of selected features were obtained using a model created via DeepLabCut, an open-source deep-learning pose estimation program. Custom MATLAB scripts were used to analyze movement from the positional data. (B) Representative movement of nose and forepaws tracked by a DeepLabCut model during 5 s pre-infusion, sucrose or quinine infusion, and post-infusion periods. (C, D) Behavioral reactivity was measured as the average change in nose movement or forepaw movement from baseline to infusion period. Intraoral infusion of quinine produces a greater behavioral reactivity. (E, F) Relationship between average change in behavioral reactivity and mean z-score of NAc dopamine during infusion averaged by session. Data in (C, D) are represented as means; *p < 0.05, paired t-test. Lines in (E, F) denote the linear relationship between parameters with dotted lines as 95% confidence intervals. p-value of linear regressions indicates slope’s deviation from zero.
-
Figure 2—source data 1
Normalized nose and forepaw movements to intraoral sucrose and quinine and associated dopamine responses.
- https://cdn.elifesciences.org/articles/103260/elife-103260-fig2-data1-v1.xlsx
Figure 3 with 1 supplement
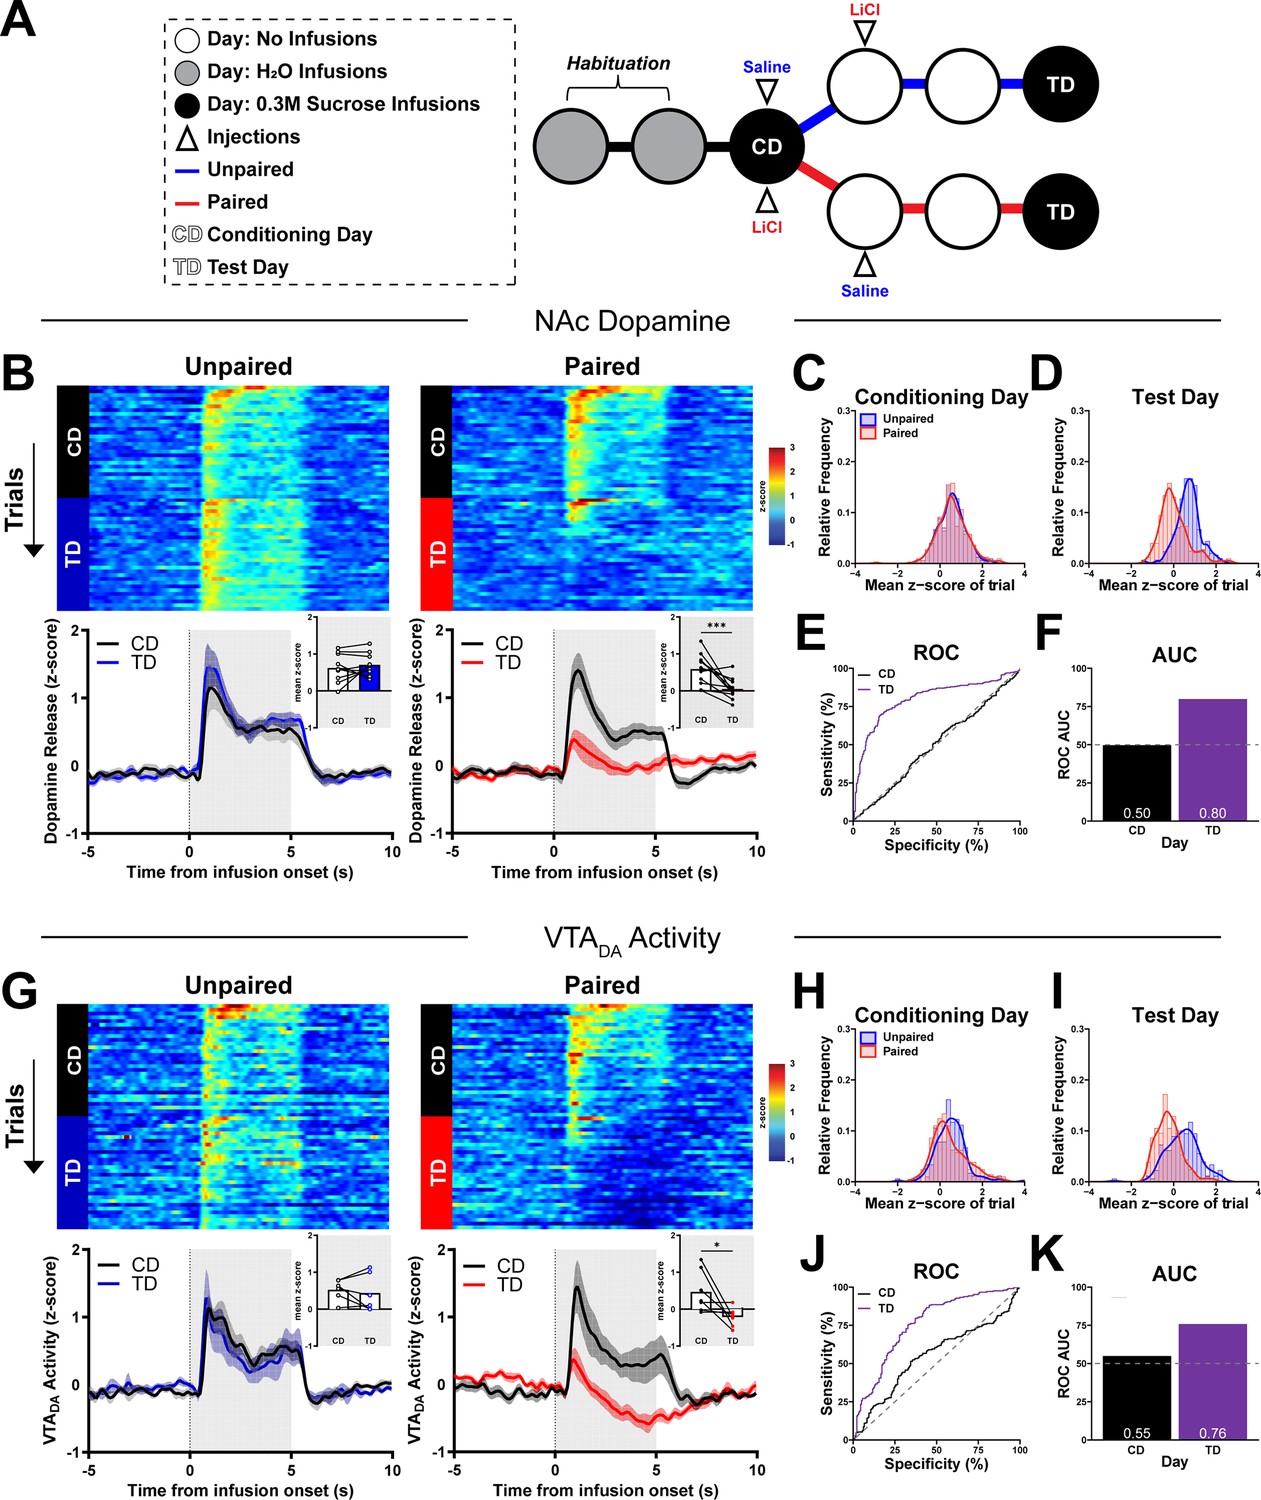
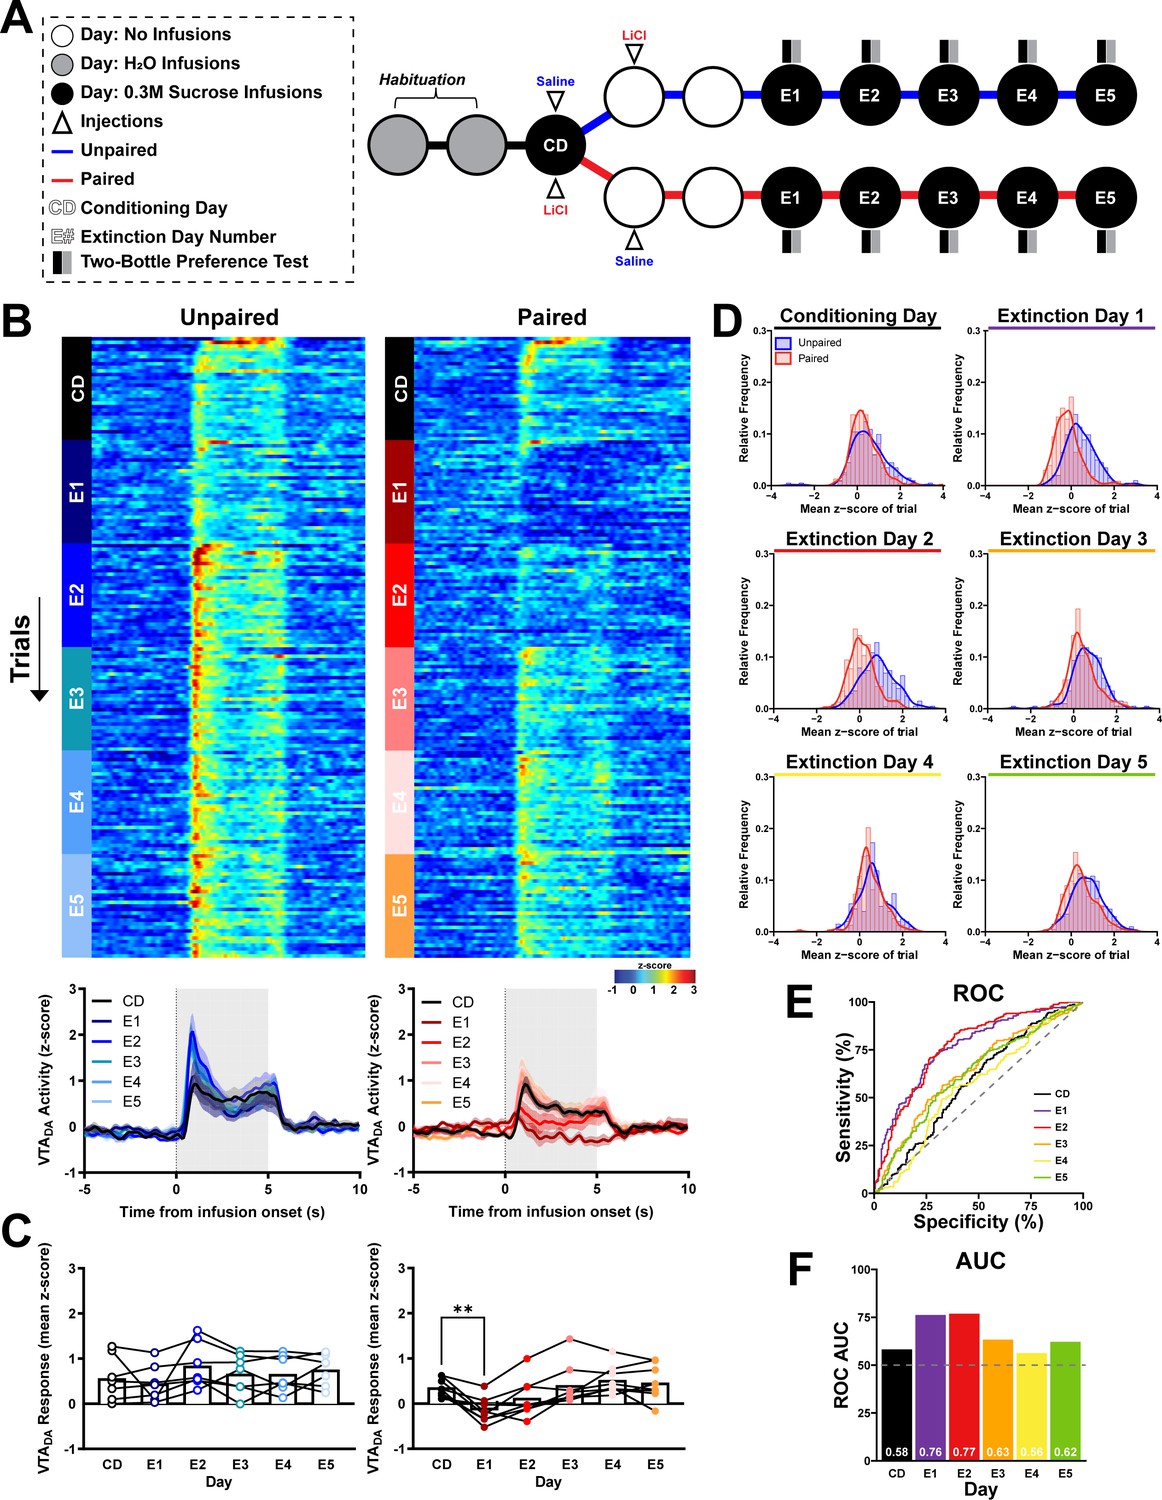
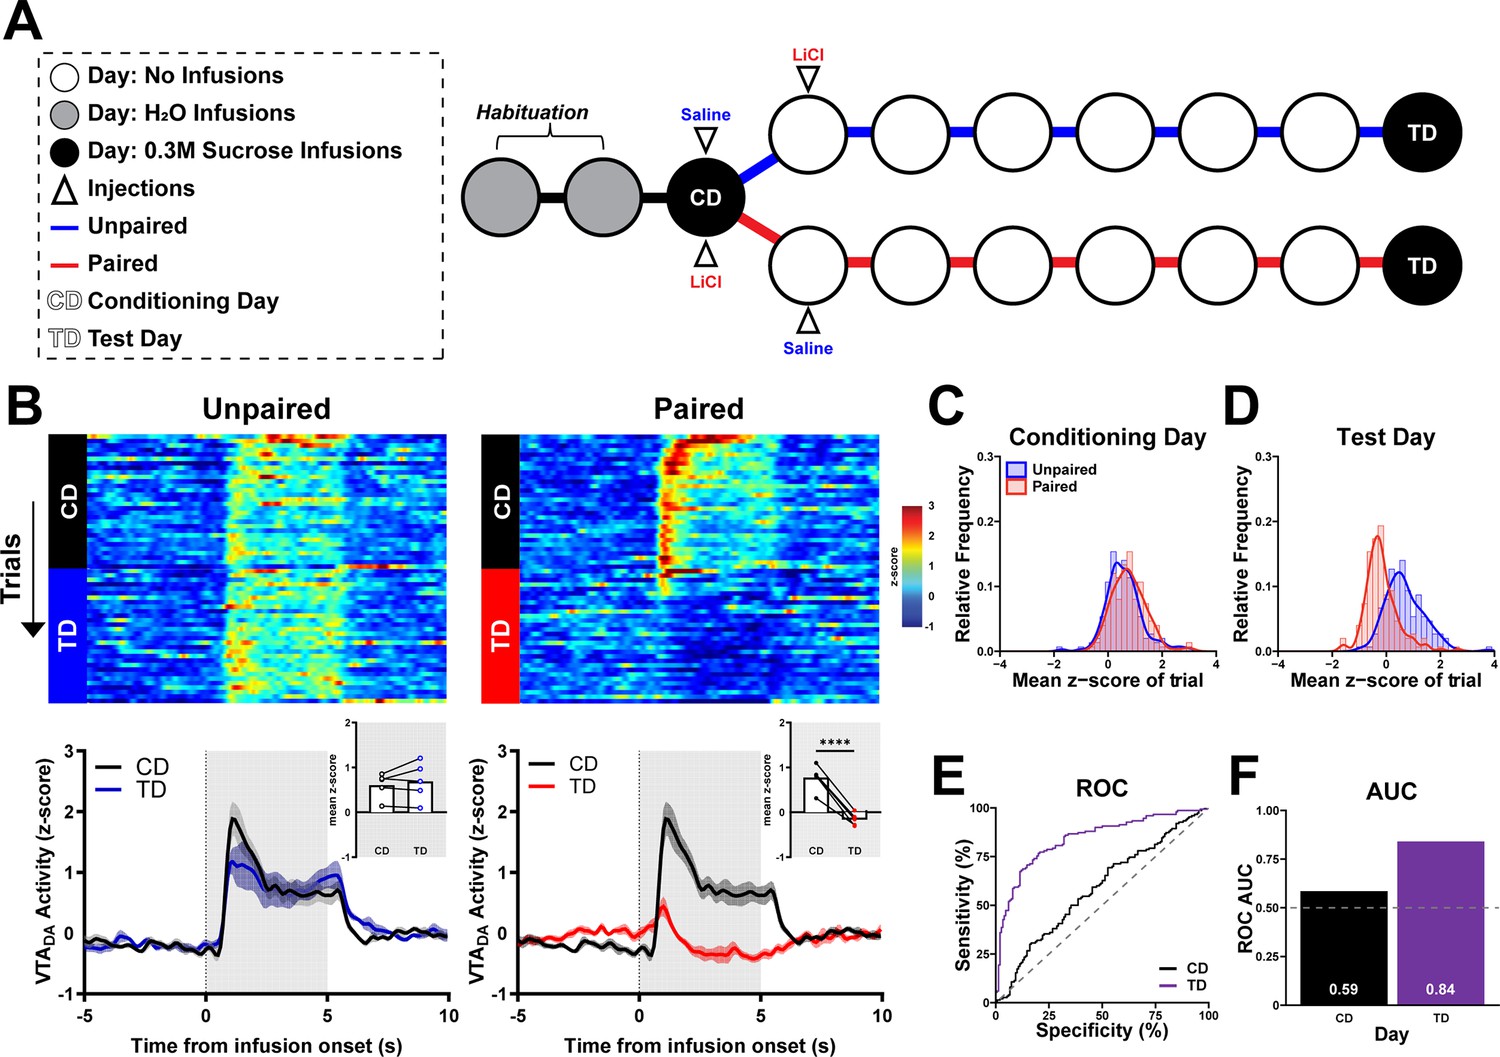
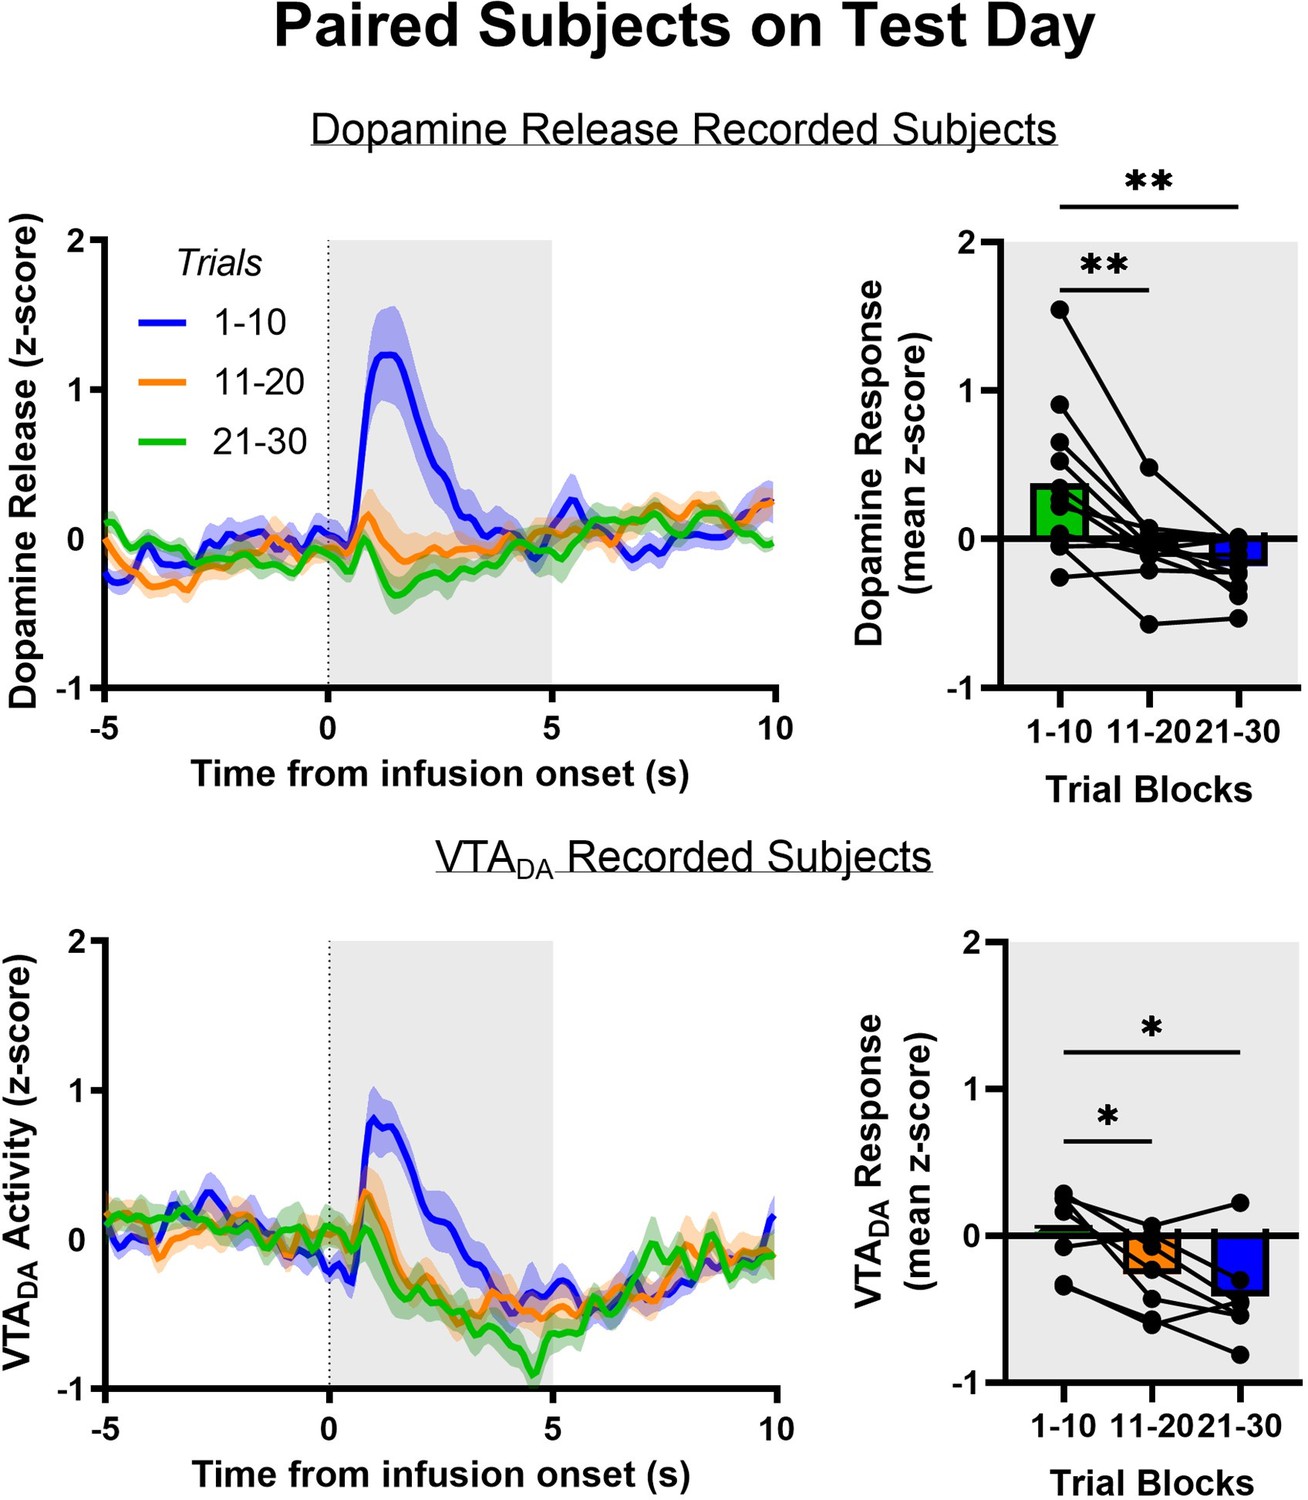
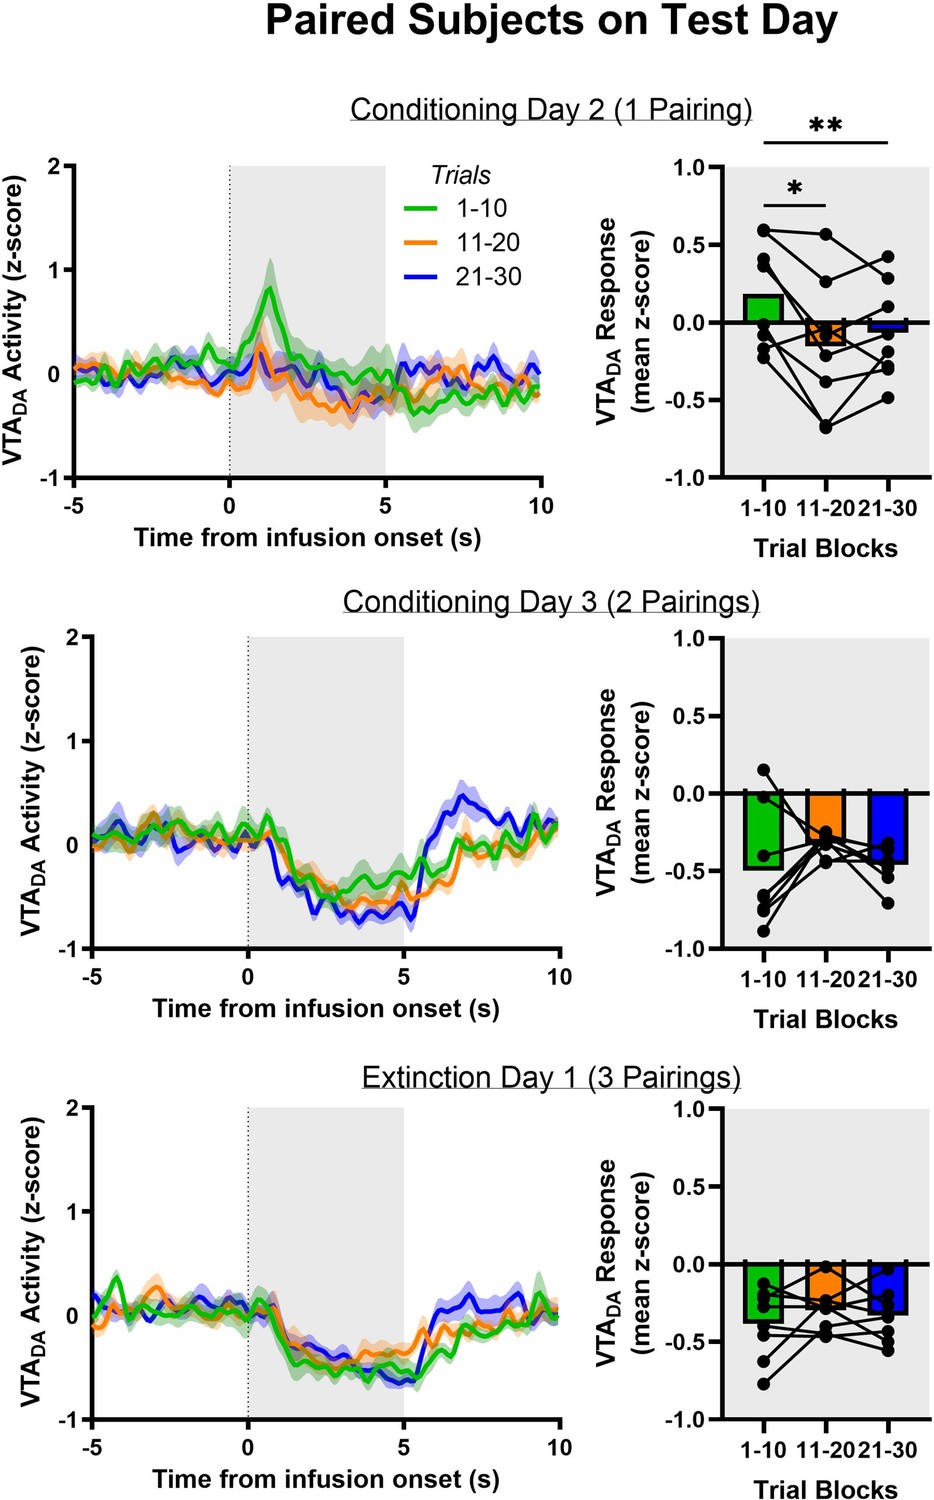
Pairing of lithium chloride (LiCl)-induced malaise to sucrose suppresses phasic dopamine responses to intraoral sucrose delivery.
(A) Schematic of Single-pairing conditioned taste aversion (CTA) timeline. Subjects were first habituated to 30 brief intraoral infusions (200 µl/trial) of water at varying intertrial intervals (35–55 s) daily for 2 days. On Conditioning Day (CD), rats received intraoral infusions of 0.3 M sucrose and were then injected i.p. with saline (Unpaired) or 0.15 M LiCl (Paired). Rats received the counterbalanced injection in the home cage the next day and were untreated the following day. On Test Day (TD), rats received intraoral infusions (parameters identical to CD). (B) NAc dopamine across trials and sessions before and after intraoral sucrose delivery onset. Top: Heat maps show average NAc dopamine release on each trial (row) throughout the 30-trial session (trial 1 at the top) during both CD and TD. Bottom: Average dopamine release averaged across all trials aligned to the onset of intraoral delivery of sucrose on CD and TD. Inset: z-score averaged first across the infusion period and then across trials and rats. Individual points represent data from each rat, and lines connect CD and TD data for each rat. (C, D) Relative frequency histogram of dopamine release responses to sucrose on CD and TD for every trial reported as mean z-score for both Unpaired and Paired subjects. (E) Receiver operating characteristic (ROC) of relative frequency distributions of mean z-score acquired from each trial of on CD and TD between treatment groups. (F) Plotted area under the curve (AUCROC) values of E. (G–K) Recordings of VTADA activity from Unpaired and Paired rats reported with same conventions as B–F. Data in B and G are represented as mean ± SEM; *p < 0.05, ***p < 0.005, paired t-test.
-
Figure 3—source data 1
Quantified NAc dopamine and VTADA activity responses to intraoral sucrose before and after CTA formation.
- https://cdn.elifesciences.org/articles/103260/elife-103260-fig3-data1-v1.xlsx
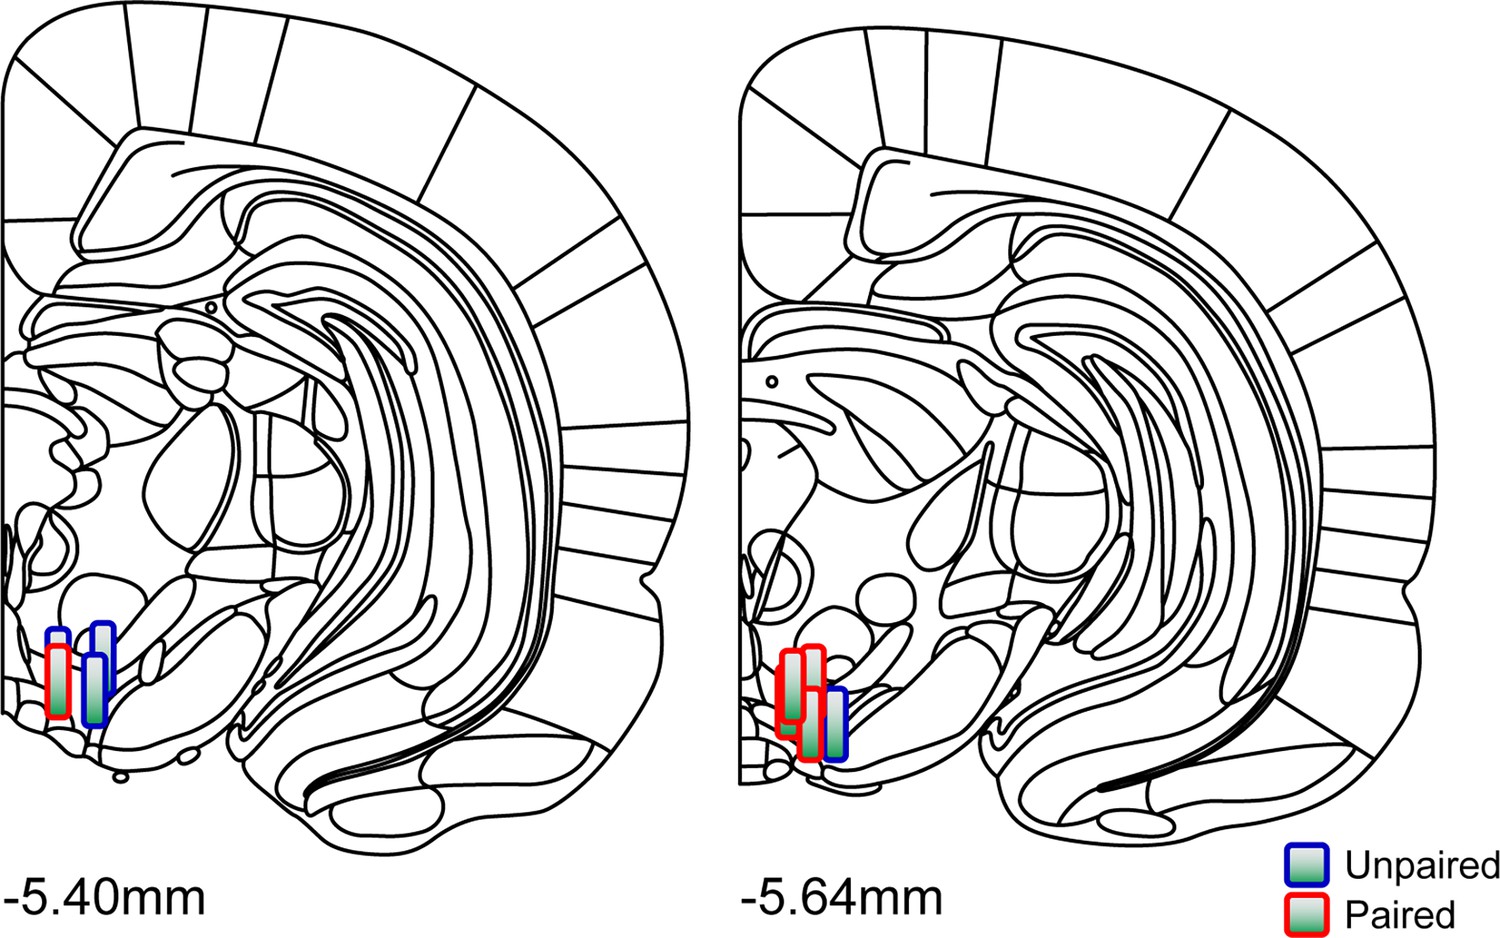
Figure 3—figure supplement 1
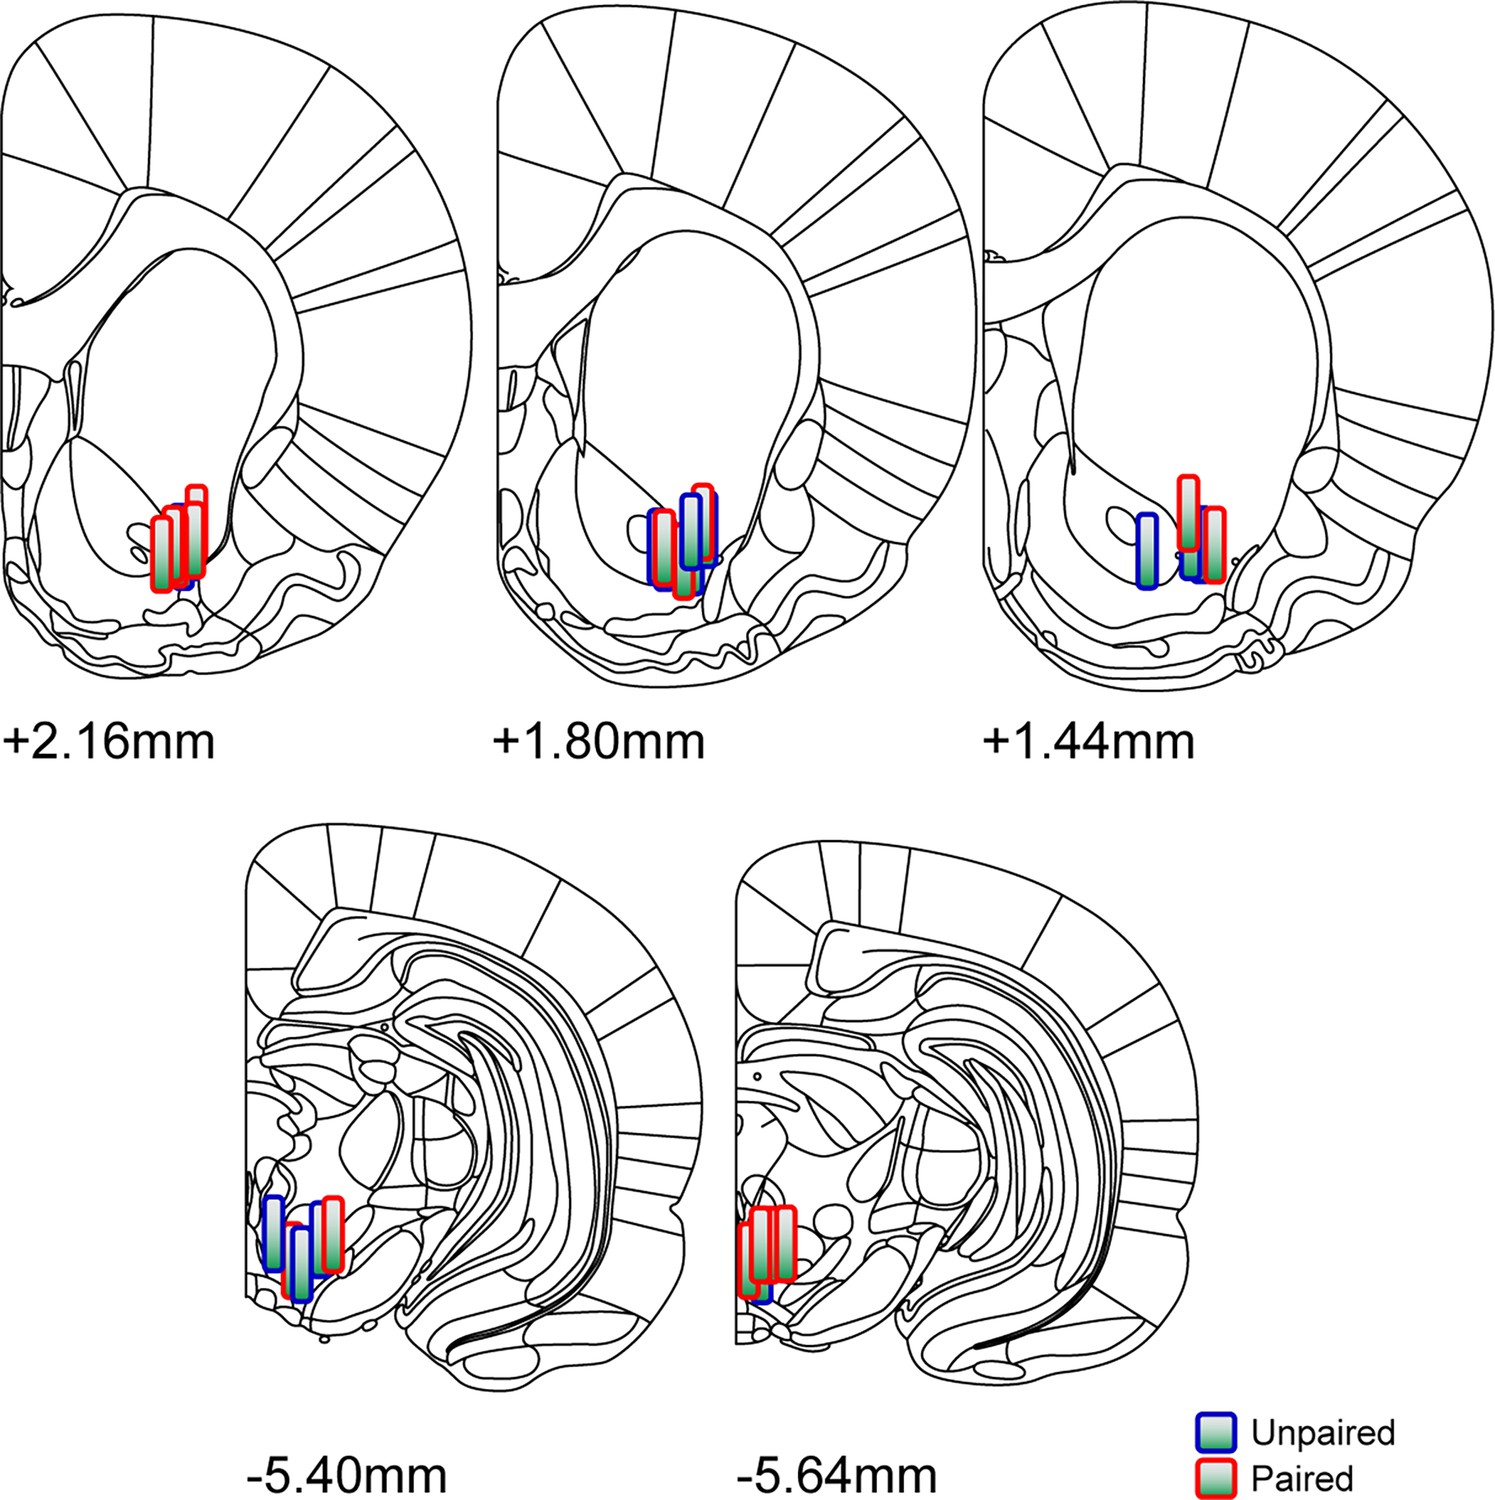
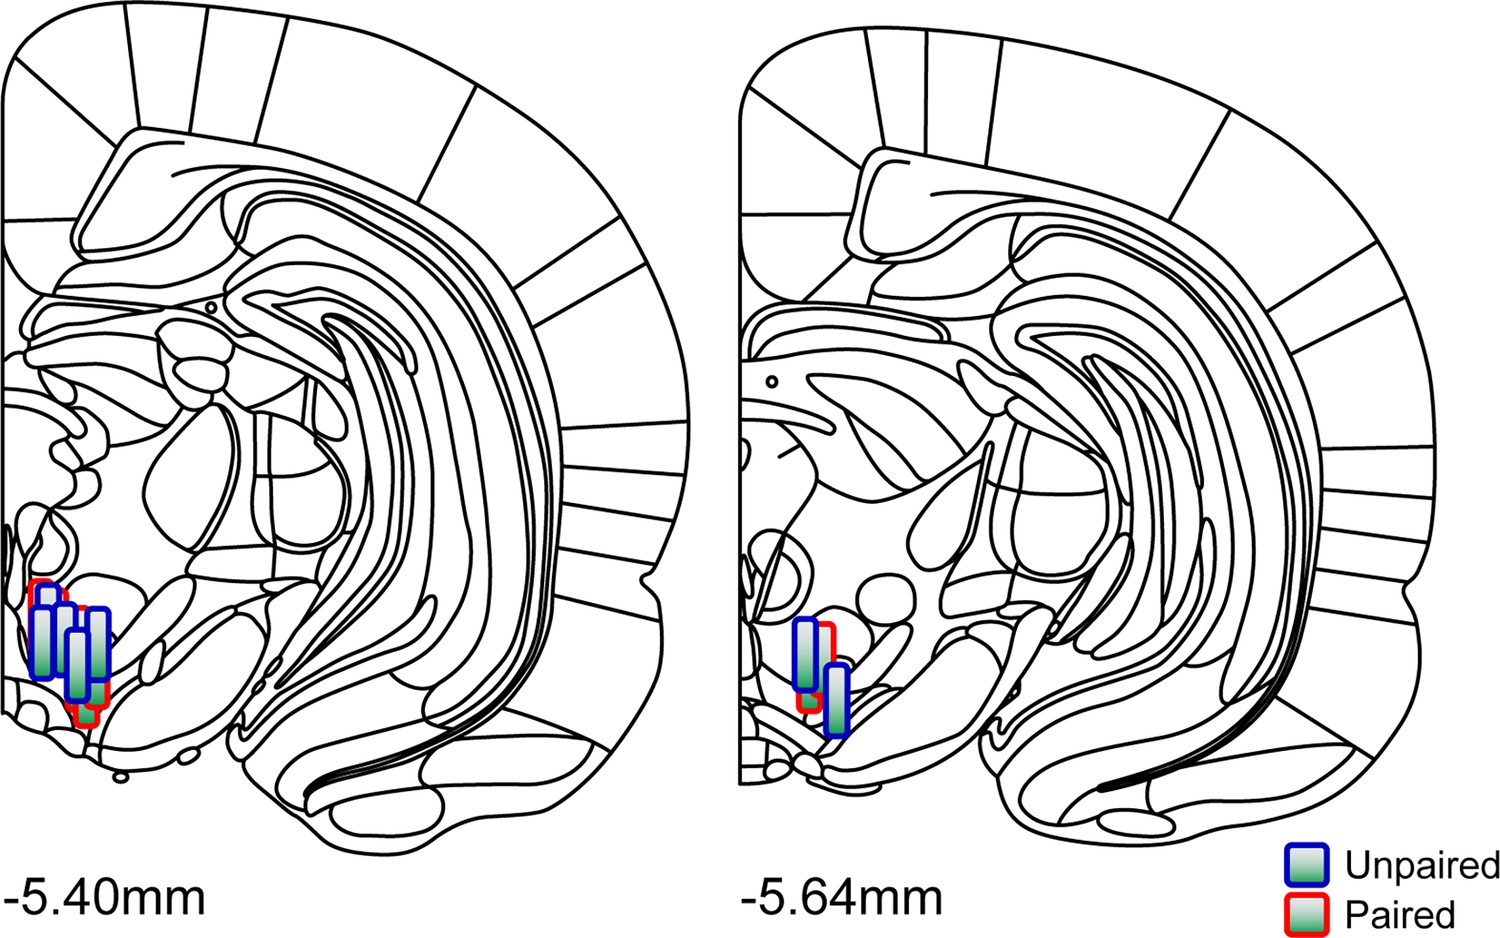
NAc lateral shell and VTA recording placements from Single-pairing conditioned taste aversion (CTA) experiment.
The fiber optic implant locations in the NAc lateral shell and VTA were verified via post-experimental histological reconstruction. Measurement values denote anterior–posterior coronal plane in relation to Bregma. Treatment group is indicated by outline color: Unpaired (blue outline) and Paired (red outline). Reconstructed images do not represent the specific hemisphere where fiber optics were implanted.
Figure 4
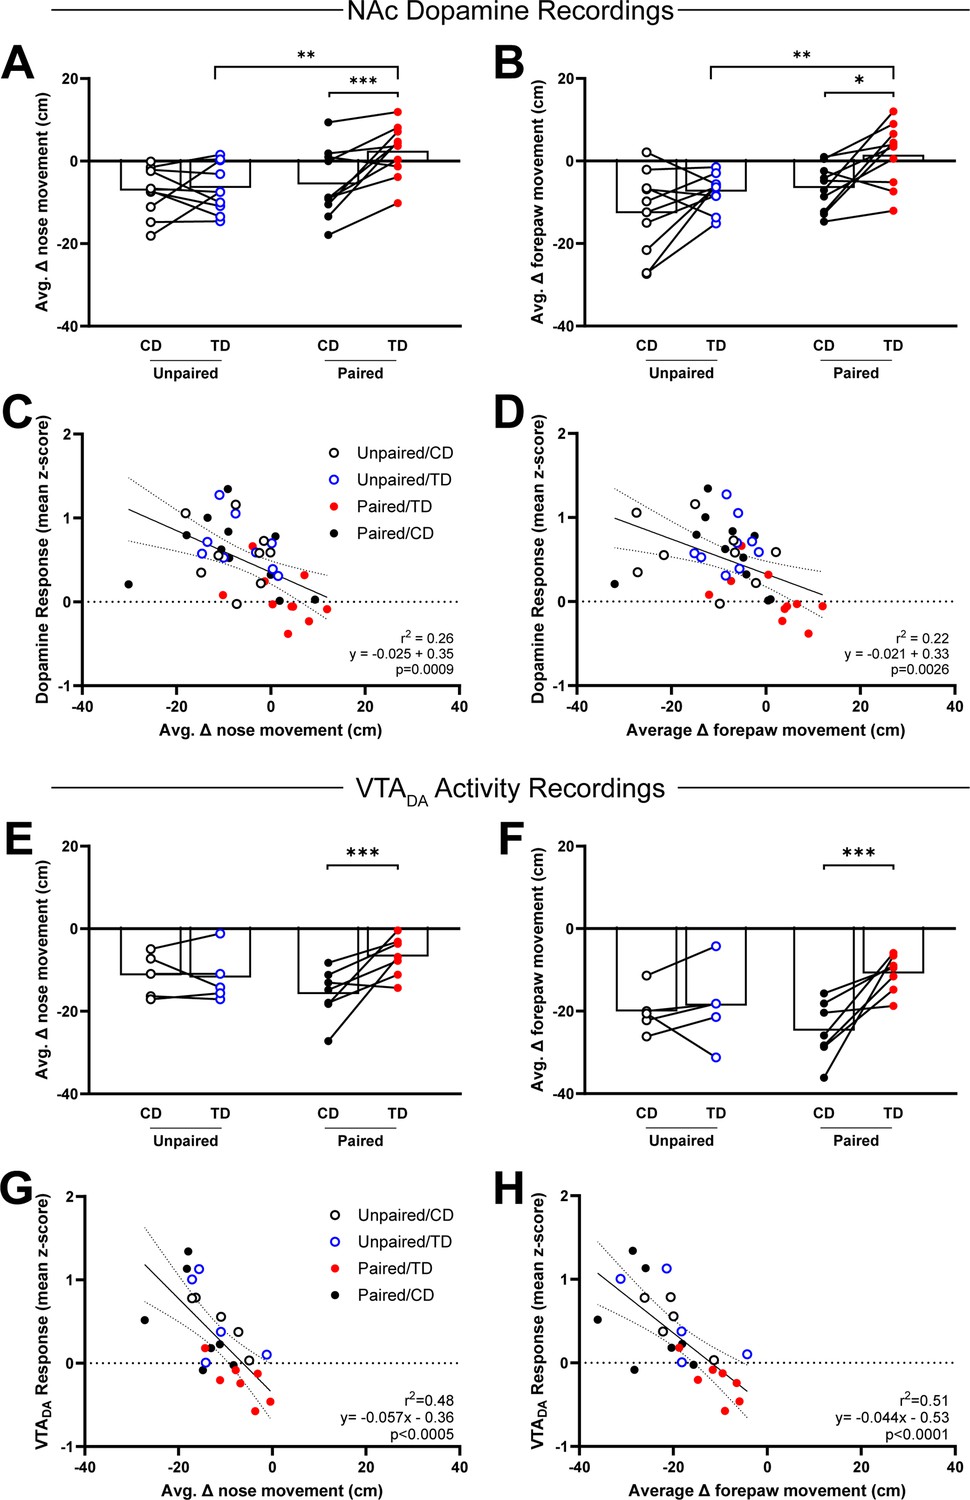
Suppressed dopamine responses correlate with enhanced behavioral reactivity to intraoral sucrose delivery after conditioned taste aversion (CTA) formation.
(A, B) Behavioral reactivity was quantified as the change in movement from baseline to infusion period. In Unpaired subjects, the average behavioral reactivity of nose (left) or forepaw (right) movement did not change from Conditioning Day (CD) to Test Day (TD). In Paired subjects, behavioral reactivity increased from CD to TD. (C) Relationship between behavioral reactivity of nose movement and mean z-score of NAc dopamine during infusion averaged by session. (D) Relationship between average change in behavioral reactivity of forepaw movement and mean z-score of VTADA activity responses during infusion averaged by session. Data in A, B, E, and G are represented as means; *p < 0.05, **p < 0.01; ***p < 0.005, two-way RM ANOVA with Uncorrected Fisher’s LSD post hoc. Line in C, D, F, and H denotes the linear relationship between parameters with dotted lines as 95% confidence intervals. p-value of linear regressions indicate slope’s deviation from zero.
-
Figure 4—source data 1
Normalized nose and paw movements to intraoral sucrose before and after CTA formation and associate dopamine responses.
- https://cdn.elifesciences.org/articles/103260/elife-103260-fig4-data1-v1.xlsx
Figure 5 with 1 supplement
Sucrose exposure under extinction conditions ameliorates conditioned taste aversion (CTA)’s suppression of phasic dopamine responses to intraoral sucrose.
(A) Schematic of the CTA paradigm consisting of a ingle-pairing of lithium chloride (LiCl) or saline pairing to sucrose followed by five consecutive sessions intraoral sucrose not subject to additional US (malaise) exposure. CTA training as in Figure 3 was conducted followed by five Extinction sessions (E1–E5), in which rats received intraoral infusions (parameters identical to Test Day [TD]) without any additional injections. (B) VTADA across trials and sessions before and after intraoral sucrose delivery onset. Top: Heat maps show average VTADA activity on each trial (row) throughout the 30 trials (trial 1 at the top) during the Conditioning Day (CD) and E1–E5 sessions. Bottom: Average VTADA activity averaged across all trials and aligned to the onset of intraoral delivery of sucrose. (C) z-score averaged first across the infusion period and then across trials and rats. Individual points represent data from each rat and lines connect CD and E1–E5 data for each rat. (D) Relative frequency histogram of VTADA responses to sucrose on all test days for every trial reported as mean z-score for both Unpaired and Paired subjects. (E) Receiver operating characteristic (ROC) of relative frequency distributions of mean z-score acquired from each trial of on all test sessions between treatment groups. (F) Plotted area under the curve (AUCROC) values of (E). Data in (B) are represented as mean ± SEM; **p < 0.01, one-way RM ANOVA with Dunnett’s multiple comparisons test post hoc.
-
Figure 5—source data 1
Quantified VTADA activity responses to intraoral sucrose across CTA extinction.
- https://cdn.elifesciences.org/articles/103260/elife-103260-fig5-data1-v1.xlsx
Figure 5—figure supplement 1
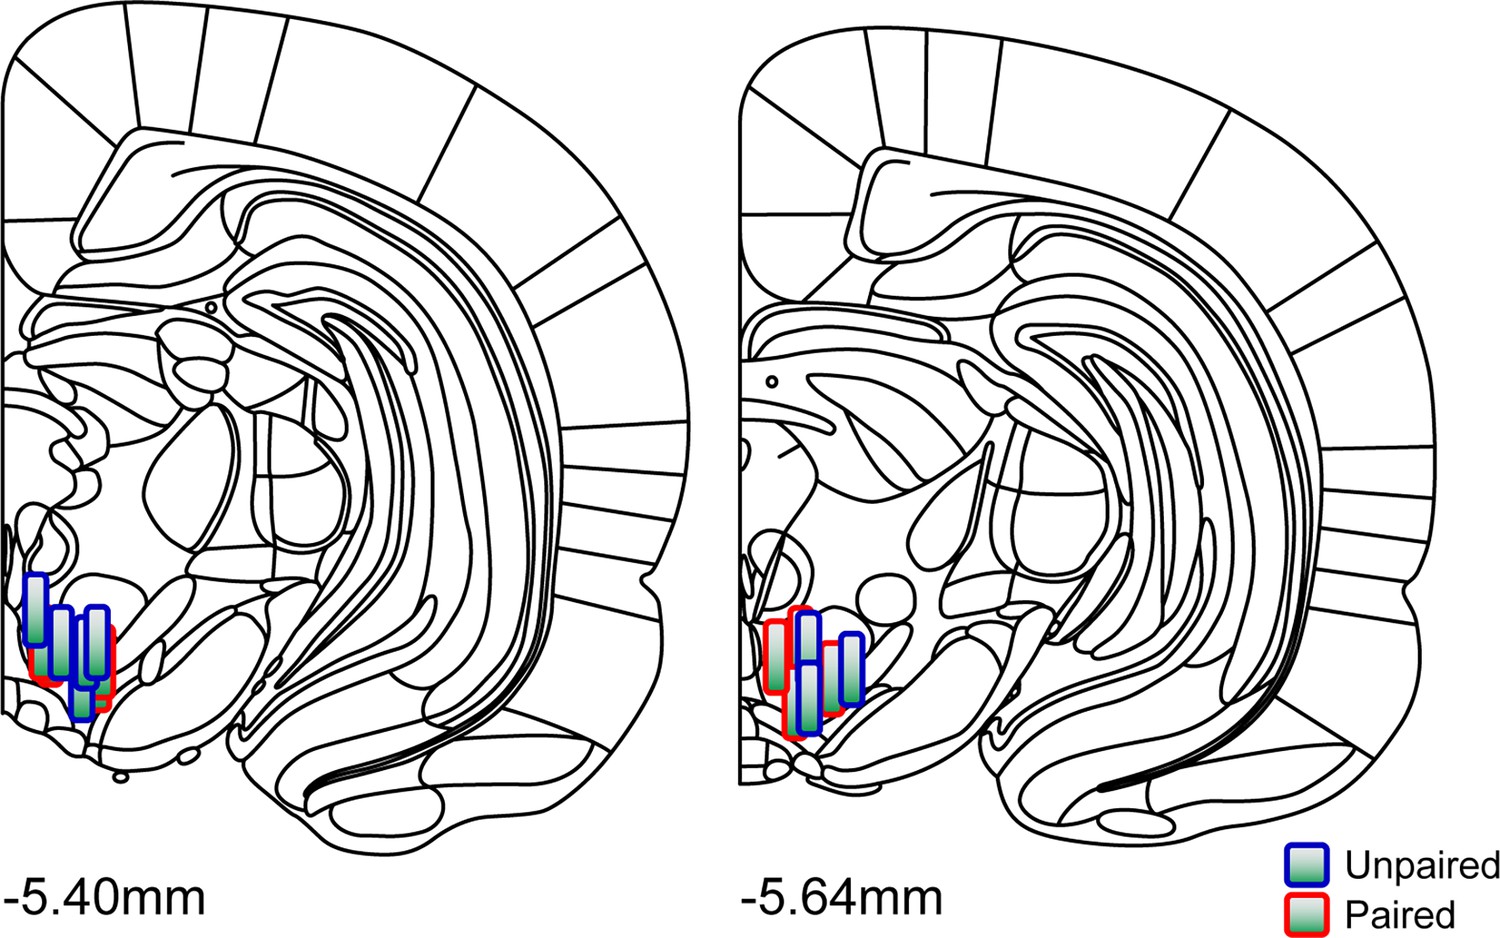
VTA recording placements from Delayed-test conditioned taste aversion (CTA) experiment.
The fiber optic implant locations in the VTA were verified via post-experimental histological reconstruction. Measurement values denote anterior–posterior coronal plane in relation to Bregma. Treatment group is indicated by outline color: Unpaired (blue outline) and Paired (red outline). Reconstructed images do not represent the specific hemisphere where fiber optics were implanted.
Figure 6
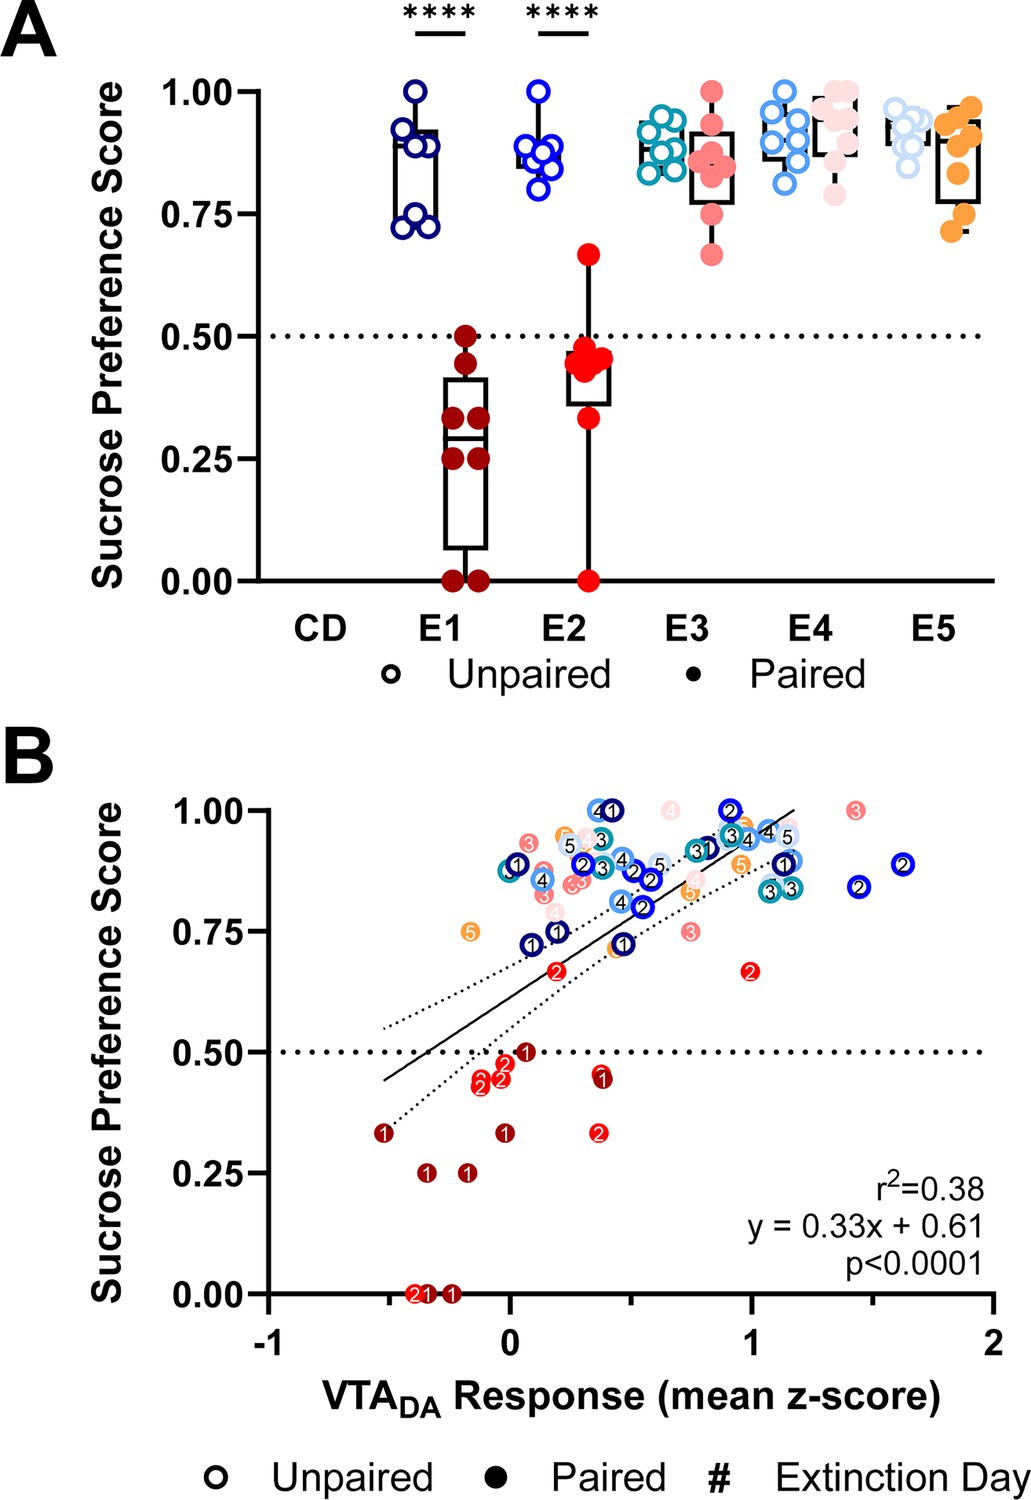
Suppressed dopamine responses to sucrose predict conditioned taste avoidance.
(A) Each Extinction session was followed by a 2-hour Two-Bottle Preference test with access to both sucrose and water. Sucrose preference scores were calculated as the percent of sucrose solution consumed from the sum of sucrose and water consumed. Paired (red, closed circles) rats showed decreased sucrose preference on E1 and E2 relative to Unpaired rats (blue, open circles). (B) Average VTADA responses during intraoral sucrose delivery were positively correlated to sucrose preference scores calculated from the Two-Bottle Preference test. Data in (A) are represented as means; ****p < 0.001, two-way RM ANOVA with Šidák multiple comparisons test post hoc. Line in (B) denotes the linear relationship between parameters with dotted lines as 95% confidence intervals. p-value of linear regression indicates slope’s deviation from zero.
-
Figure 6—source data 1
Sucrose preference scores and average VTADA activity responses to sucrose across CTA extinction.
- https://cdn.elifesciences.org/articles/103260/elife-103260-fig6-data1-v1.xlsx
Figure 7 with 1 supplement
Delayed testing after sucrose pairing to lithium chloride (LiCl)-induced malaise suppresses dopamine response to sucrose.
(A) Schematic of the Delayed-test conditioned taste aversion (CTA) paradigm. CTA training as in Figure 3 was conducted. To match the timeline of Single-pairing CTA with Extinction, rats had five additional untreated days followed by Test Day (TD), which corresponded to the delay from Conditioning Day (CD) to E5. On TD, rats received intraoral infusions (parameters identical to E1). (B) VTADA across trials and sessions before and after intraoral sucrose delivery onset. Top: Heat maps show average VTADA activity on each trial (row) throughout the 30-trial session (trial 1 at the top) during CD and TD sessions. Bottom: Average VTADA activity averaged across all trials aligned to the onset of intraoral delivery of sucrose. Inset: z-score averaged first across the infusion period and then across trials and rats. Individual points represent data from each rat and lines connect CD TD data for each rat. (C, D) Relative frequency histogram of dopamine release responses to sucrose on CD and TD for every trial reported as mean z-score for both Unpaired and Paired subjects. (E) Receiver operating characteristic (ROC) of relative frequency distributions of mean z-score acquired from each trial of on CD and TD between treatment groups. (F) Plotted area under the curve (AUCROC) values of (E). Data in (B) are represented as mean ± SEM; ****p < 0.001, paired t-test.
-
Figure 7—source data 1
Quantified VTADA activity to intraoral sucrose across the Delayed-test CTA paradigm.
- https://cdn.elifesciences.org/articles/103260/elife-103260-fig7-data1-v1.xlsx
Figure 7—figure supplement 1
VTA recording placements from Single-pairing conditioned taste aversion (CTA) with Extinction experiment.
The fiber optic implant locations in the VTA were verified via post-experimental histological reconstruction. Measurement values denote anterior–posterior coronal plane in relation to Bregma. Treatment group is indicated by outline color: Unpaired (blue outline) and Paired (red outline). Reconstructed images do not represent the specific hemisphere where fiber optics were implanted.
Figure 8 with 1 supplement
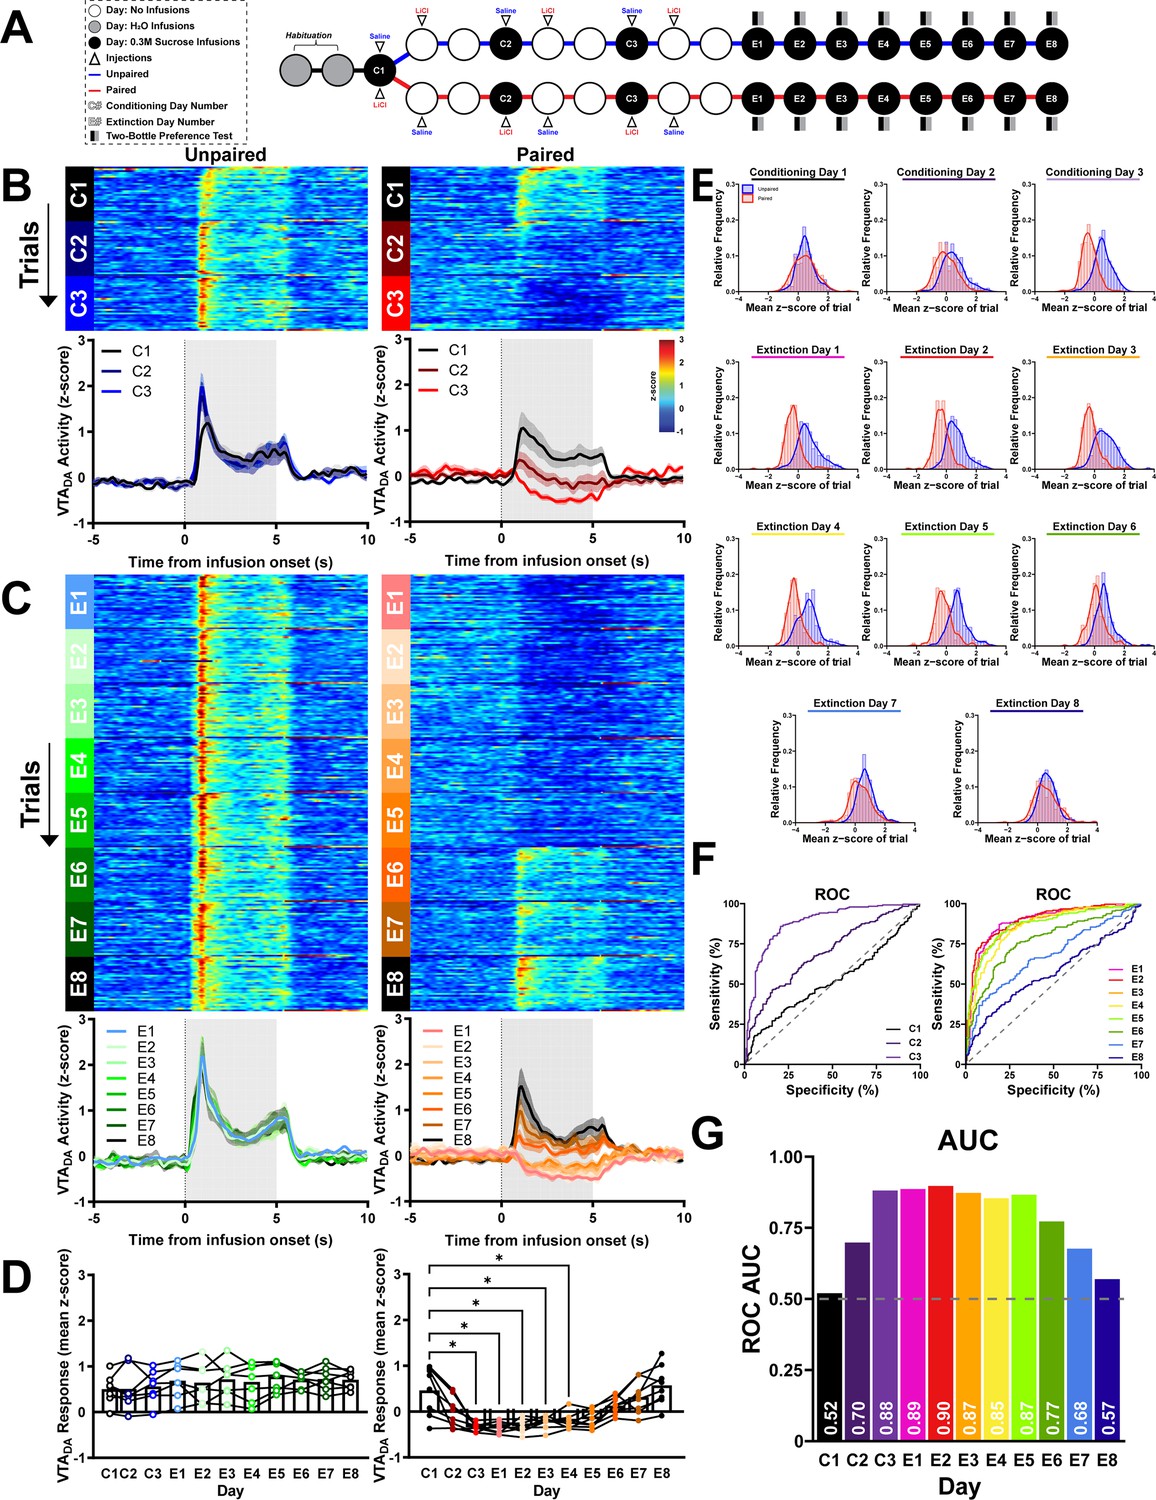
Phasic dopamine responses to intraoral sucrose scale to the strength of the conditioned taste aversion (CTA).
(A) Schematic of the Repeated-pairing CTA paradigm. The 3-day CTA conditioning process (as in Figure 3) was repeated three times (C1–C3). Following conditioning, subjects received eight daily Extinction sessions (E1–E8) with intraoral infusions of sucrose followed by no US (malaise) exposure. After the behavioral sessions, rats had access to sucrose and water consumption for 2 hr (Two-Bottle Preference test). (B) VTADA across trials and sessions before and after intraoral sucrose delivery onset. Top: Heat maps show average VTADA activity on each trial (row) throughout the 30 trial sessions (trial 1 at the top) during the three conditioning sessions (C1–C3). Bottom: Associated average traces of VTADA activity averaged across all trials and aligned to the onset of intraoral delivery of sucrose. (C) Conventions as in (B) but for all eight non-reinforced sucrose sessions (E1–E8). (D) z-score averaged first across the infusion period and then across trials and rats for all conditioning and subsequent test sessions. Individual points represent data from each rat and lines connect C1–C3 and E1–E8 data for each rat. (E) Relative frequency histogram of VTADA responses to sucrose on all test days for every trial reported as mean z-score for both Unpaired and Paired subjects. (F) Receiver operating characteristic (ROC) of relative frequency distributions of mean z-score acquired from each trial of on all conditioning (left) and extinction (right) days between treatment groups. (G) Plotted area under the curve (AUCROC) values of (F). Data in (B) and (D) are represented as mean ± SEM;; *p < 0.05, one-way RM ANOVA with Dunnett’s multiple comparisons test post hoc.
-
Figure 8—source data 1
Quantified VTADA activity to intraoral sucrose across repeated pairings.
- https://cdn.elifesciences.org/articles/103260/elife-103260-fig8-data1-v1.xlsx
-
Figure 8—source data 2
Quantified VTADA activity to intraoral sucrose across repeated extinction sessions.
- https://cdn.elifesciences.org/articles/103260/elife-103260-fig8-data2-v1.zip
-
Figure 8—source data 3
Quantified averaged VTADA activity to intraoral sucrose across repeated parings and extinction sessions.
- https://cdn.elifesciences.org/articles/103260/elife-103260-fig8-data3-v1.xlsx
-
Figure 8—source data 4
Data for ROC analyses across conditioning and extinction sessions.
- https://cdn.elifesciences.org/articles/103260/elife-103260-fig8-data4-v1.xlsx
Figure 8—figure supplement 1
VTA recording placements from Repeated-pairing conditioned taste aversion (CTA) with Extinction experiment.
The fiber optic implant locations in the VTA were verified via post-experimental histological reconstruction. Measurement values denote anterior–posterior coronal plane in relation to Bregma. Treatment group is indicated by outline color: Unpaired (blue outline) and Paired (red outline). Reconstructed images do not represent the specific hemisphere where fiber optics were implanted.
Figure 9

Intraoral sucrose-driven dopamine responses are negatively correlated to behavioral reactivity and predict sucrose preference.
(A) Head movement to intraoral sucrose averaged across trials. Top: Unpaired rats showed comparable average change in head movement behavioral reactivity across testing sessions. Bottom: Paired subjects showed an increase in average head movement responses to intraoral sucrose from C1 to C2–E3. (B) Relationship between average head movement behavioral reactivity and VTADA responses (in mean z-score) during infusion averaged by session. (C) After each E1–E8 session, rats were administered the Two-Bottle Preference test. Paired (red, closed circles) rats showed decreased sucrose preference on E1–E5 relative to Unpaired rats (blue, open circles). (D) Average VTADA responses during intraoral sucrose delivery were positively correlated to sucrose preference scores calculated from the Two-Bottle Preference test. Data in (A) are represented as means; *p < 0.05, **p < 0.01, one-way RM ANOVA with Dunnett’s multiple comparisons test post hoc. Data in (C) are represented as means; *p < 0.05, **p < 0.01, ***p < 0.005, ****p < 0.001, two-way RM ANOVA with Šidák multiple comparisons test post hoc. Line in (B, D) denotes the linear relationship between parameters with dotted lines as 95% confidence intervals. p-value of linear regression indicates slope’s deviation from zero.
-
Figure 9—source data 1
Normalized head movement to intraoral infusions across repeated pairings and extinction sessions and associated VTADA responses and sucrose preference scores.
- https://cdn.elifesciences.org/articles/103260/elife-103260-fig9-data1-v1.xlsx
Author response image 1
Author response image 2

Author response image 3
Author response image 4
Tables
Author response table 1
| Fig. | Statistic | Combined Conditions | Unpaired | Paired |
|---|---|---|---|---|
| 4C | R^(2) | 0.26 | 0.10 | 0.29 |
| P value | 0.0009 (****) | 0.2058 | 0.0123 (*) | |
| Best Fit Equation | Y=-0.025^(**)X+0.35 | Y=-0.017**X+0.51 | Y=-0.024^(***)X+0.26 | |
| 4D | R^(2) | 0.22 | 0.013 | 0.31 |
| P value | 0.0026 (***) | 0.65 | 0.0093 (**) | |
| Best Fit Equation | Y=-0.021^(**)X+0.33 | Y=- 0.0047^(**)X+0.58 | Y=-0.025^(**)X+0.23 | |
| 4G | R^(2) | 0.48 | 0.53 | 0.55 |
| P value | 0.0002(****) | 0.016^(**) | 0.0025 (***) | |
| Best Fit Equation | Y=-0.057^(**)X-0.36 | Y=-0.053^(**)X-0.097 | Y=-0.057^(***)X-0.52 | |
| 4H | R^(2) | 0.51 | 0.53 | 0.54 |
| P value | <0.0001 (****) | 0.017 (*) | {: 0.0026^(******) | |
| Best Fit Equation | Y=-0.044^(**)X-0.53 | Y=-0.040***X-0.25 | Y=-0.044^(***)X-0.65 | |
| 6B | R^(2) | 0.38 | 0.048 | 0.46 |
| P value | <0.0001 (****) | 0.21 | <0.0001 (****) | |
| Best Fit Equation | Y=0.33^(***)X+0.61 | Y=0.037**X+0.86 | Y=0.46^(**)X+0.53 | |
| 9B | R^(2) | 0.43 | 8.4e-005 | 0.33 |
| P value | <0.0001 (****) | 0.95 | <0.0001 (****) | |
| Best Fit Equation | Y=- 0.045^(***)X+0.0036 | Y=0.00063^(**)X+0.7 1 | Y=-0.033^(***)X-0.11 | |
| 9C | R^(2) | 0.59 | 0.15 | 0.36 |
| P value | < 0.0001 **** ^("a ") | 0.0034 (***) | < 0.0001 (****) | |
| Best Fit Equation | Y=0.48**X+0.53 | Y=0.088^(**)X+0.86 | Y=0.44^(**)X+0.48 |
Additional files
Download links
A two-part list of links to download the article, or parts of the article, in various formats.
Downloads (link to download the article as PDF)
Open citations (links to open the citations from this article in various online reference manager services)
Cite this article (links to download the citations from this article in formats compatible with various reference manager tools)
Dopamine activity encodes the changing valence of the same stimulus in conditioned taste aversion paradigms
eLife 13:RP103260.
https://doi.org/10.7554/eLife.103260.2


