An antisense oligonucleotide-based strategy to ameliorate cognitive dysfunction in the 22q11.2 Deletion Syndrome
- Mortimer B. Zuckerman Mind Brain and Behavior Institute, Columbia University, United States
- Stavros Niarchos Foundation Center for Precision Psychiatry and Mental Health, Columbia University, United States
- Department of Genetics and Development, Columbia University Irving Medical Center, United States
- Ionis Pharmaceuticals, Inc, United States
- The Virtual Center for Velo-Cardio-Facial-Syndrome, Inc, United States
- Department of Psychiatry, Vagelos College of Physicians & Surgeons, Columbia University, United States
- Department of Physiology and Cellular Biophysics, College of Physicians and Surgeons, Columbia University, United States
- Department of Neuroscience, Columbia University, United States
Figures
Figure 1 with 4 supplements
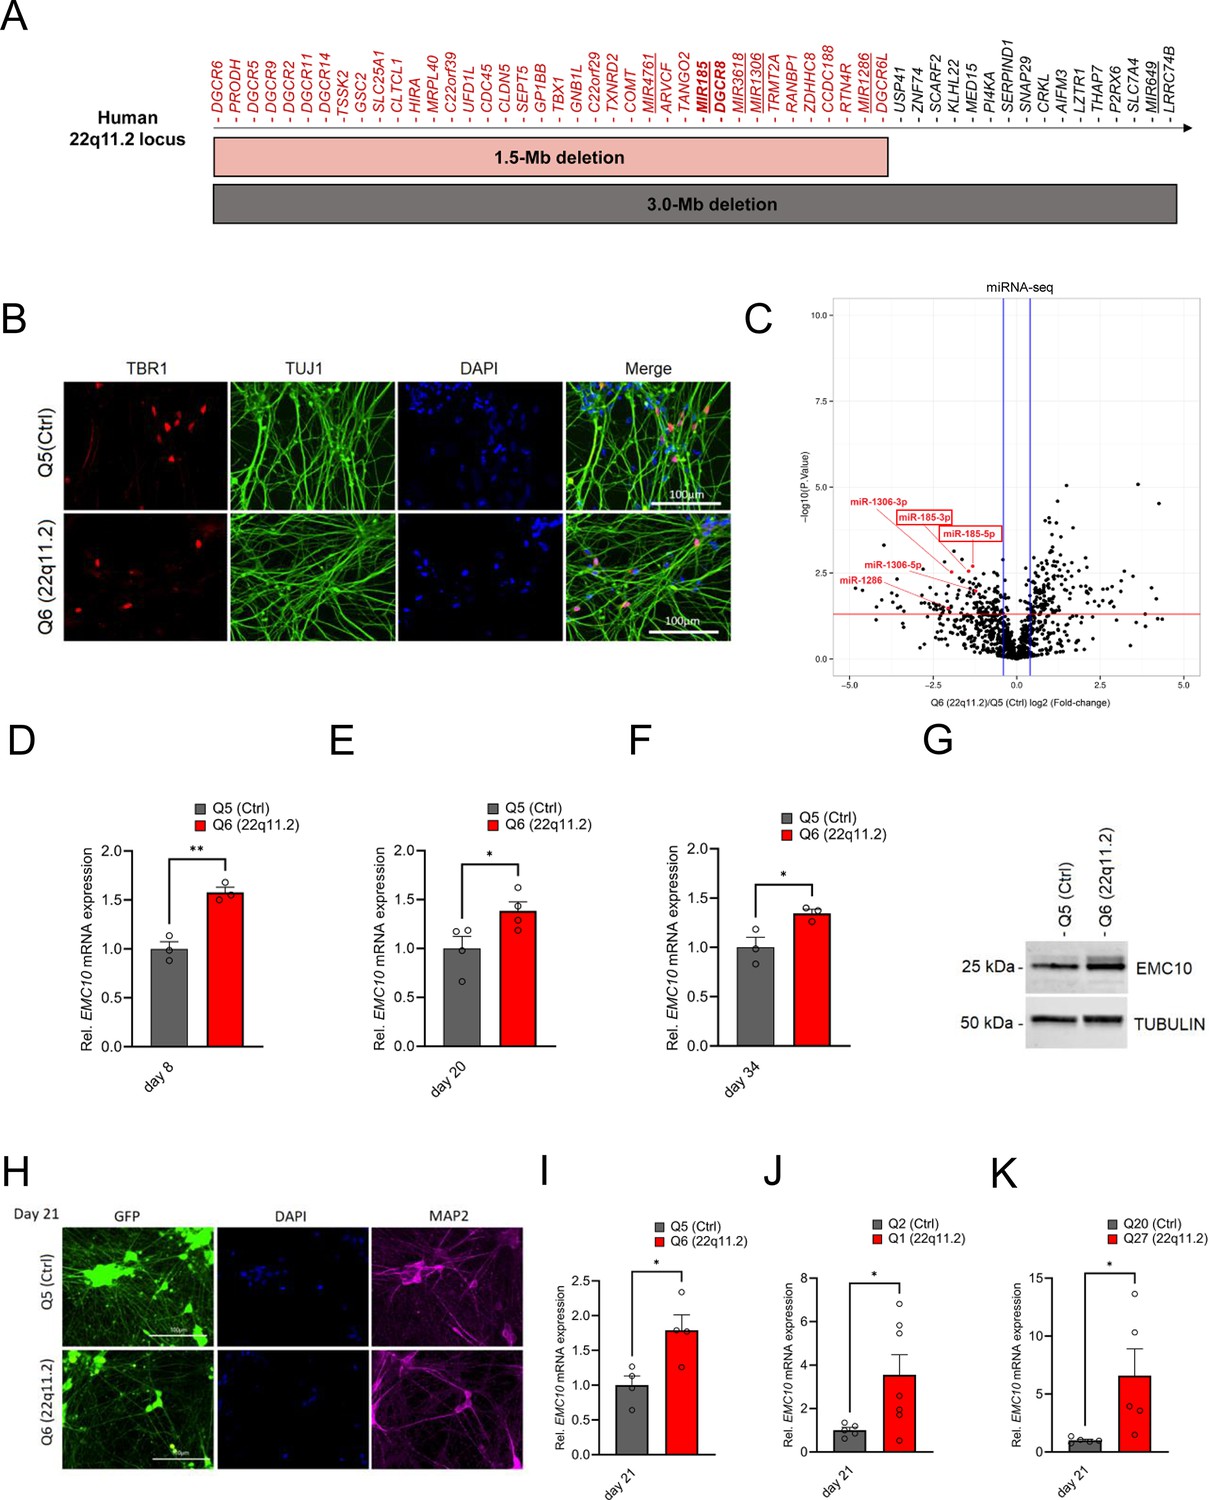
EMC10 is robustly upregulated in hiPSC-derived neurons from 22q11.2 deletion carriers.
(A) Schematic diagram depicting the human chromosome 22q11.2 region. Bright grey and red horizontal bars indicate the two most common hemizygous genomic deletions found in the 22q11.2 Deletion Syndrome. The location of the coding genes and non-coding RNAs (miRNAs, underlined) are shown for chromosome 22q11.2. The microprocessor DGCR8 (DiGeorge Syndrome Critical Region Gene 8) and MIR185 are shown in bold. (B) Cortical marker TBR1 and pan-neuronal marker TUJ1 expression in cortical neurons as detected by immunocytochemistry at day 13 of differentiation. TBR1 (red), TUJ1 (green) and DAPI (blue) expression are shown. Scale bar: 100 μm. (C) Volcano plot showing differentially expressed human mature miRNAs (DEmiRs) in cortical neurons at day 8 of differentiation. Significant DEmiRs (p-value <5%) are shown above red line; Q5 (Ctrl) n=3, Q6 (22q11.2) n=3. 153/133 miRNAs were significantly up- and downregulated in Q6 (22q11.2) hiPSC-derived cortical neurons, respectively. 22q11.2 deletion region residing miRNAs miR-185, miR-1286 and miR-1306 are highlighted. (D–F) Consistent upregulation of EMC10 mRNA in Q6 (22q11.2) line derived cortical neurons as assayed by qRT-PCR at (D) day 8 (p=0.031; Q5: n=3, Q6: n=3), (E) day 20 (p=0.0478; Q5: n=4, Q6: n=4) and (F) day 34 (p=0.0358; Q5: n=3, Q6: n=3) of differentiation. (G) Western blot analysis showing upregulated EMC10 protein levels in Q6 (22q11.2) line derived cortical neurons at day 8 of differentiation. Tubulin was probed as a loading control. (H) Immunofluorescence images of NGN2 generated cells. Representative images of NGN2-iNs at DIV21 from Q5 (Ctrl) and Q6 (22q11.2) hiPSC lines identified via EGFP fluorescence and immunostained for neuronal dendrite marker MAP2 and the nuclear marker DAPI. Scale bar = 100 µm. (I–K) qRT-PCR assay of EMC10 mRNA expression level in NGN2-iNs at DIV21. (I) Upregulation of EMC10 mRNA in Q6 (22q11.2) line derived neurons compared to the healthy control line Q5 (p=0.0222). Q5 (Ctrl) n=4, Q6 (22q11.2) n=4. (J) Upregulation of EMC10 mRNA in Q1 (22q11.2) patient line compared to healthy control line Q2 (p0.0441). Q2 (Ctrl) n=5 and Q1 (22q11.2) n=7. (K) Upregulation of EMC10 mRNA in QR27 (22q11.2) patient line compared to healthy control line QR20 (p=0.0414). QR20 (Ctrl) n=5 and QR27 (22q11.2) n=5. Data are presented as mean ± SEM, unpaired two-tailed t-test, *p<0.05, **p<0.01.
-
Figure 1—source data 1
PDF file containing original western blots for Figure 1G, indicating the relevant bands.
- https://cdn.elifesciences.org/articles/103328/elife-103328-fig1-data1-v1.pdf
-
Figure 1—source data 2
Original files for western blot analysis shown in Figure 1G.
- https://cdn.elifesciences.org/articles/103328/elife-103328-fig1-data2-v1.zip
Figure 1—figure supplement 1
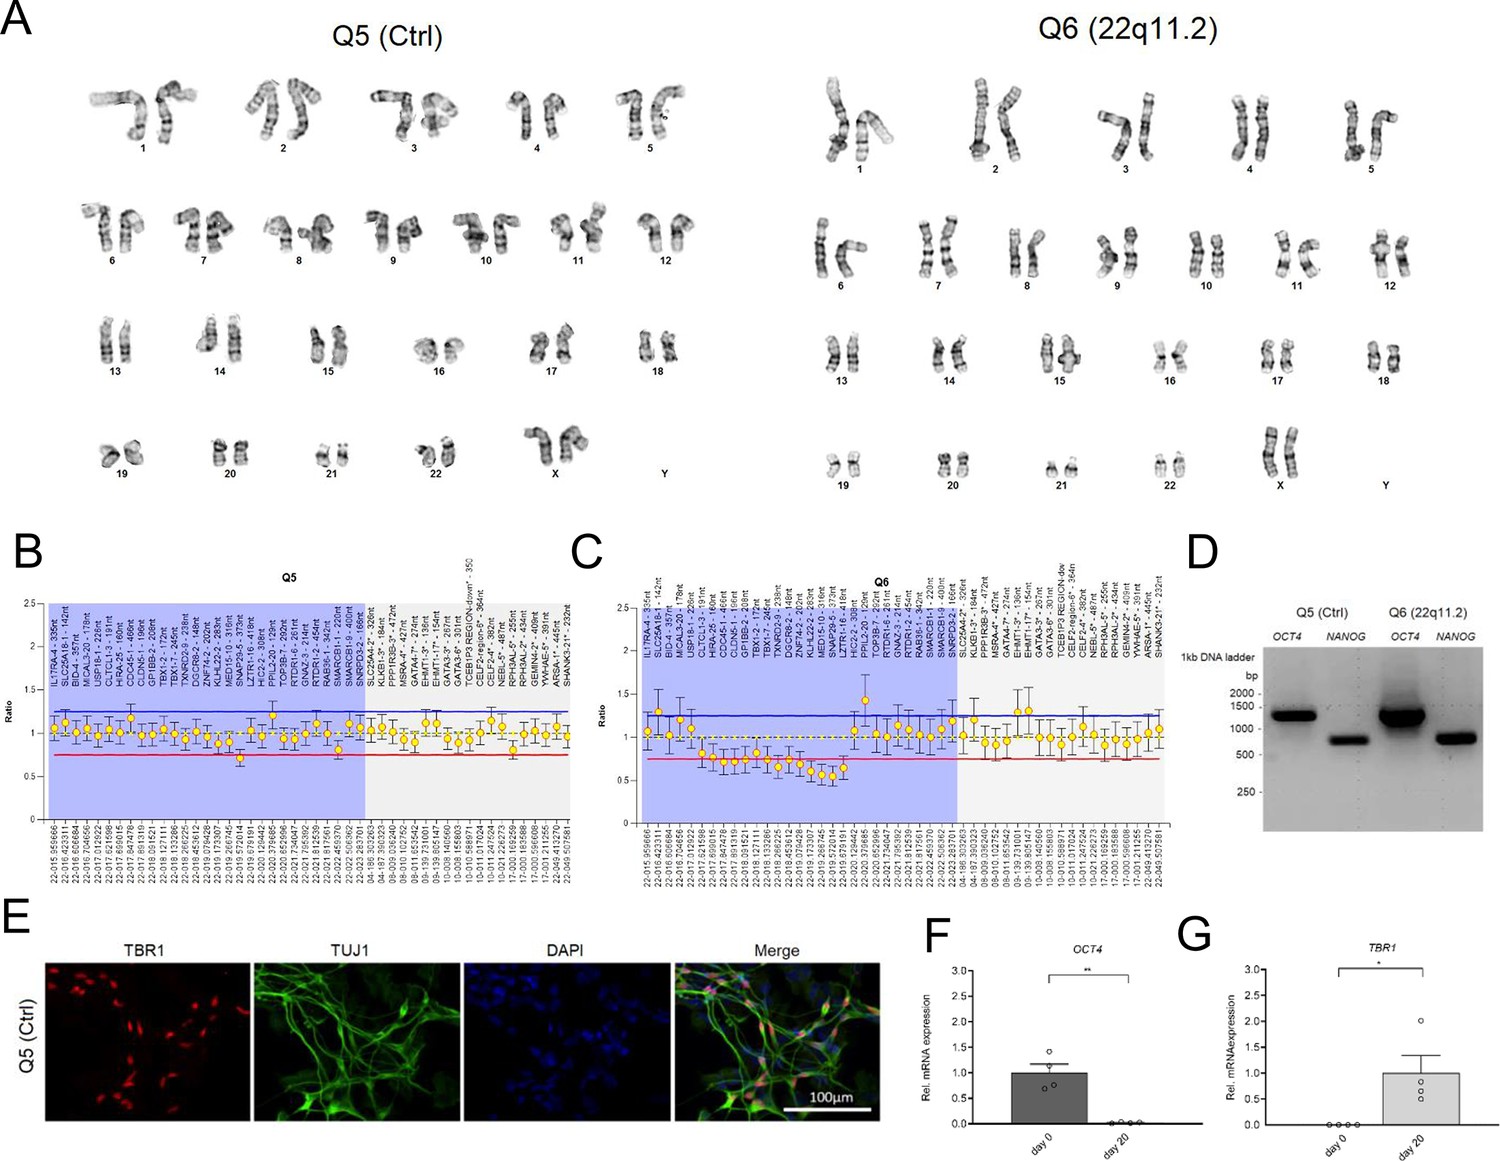
Validation and characterization of hiPSCs and hiPSC-derived neurons.
(A) Characterization of Q5 (Ctrl) and Q6 (22q11.2) hiPS cells demonstrate normal karyotype distribution in both lines. (B–D) Characterization of the Q5 and Q6 hiPSC lines. Multiplex Ligation-dependent Probe Amplification (MLPA) assay of gene copies within and around 22q11.2 locus for Q5 (Ctrl) (B) and Q6 (22q11.2) (C) line shows that copy number of genes in the 22q11.2 locus (highlighted in light blue) are reduced by half in the Q6 (22q11.2) hiPSC line. (D) qRT-PCR assays of embryonic stem cell marker OCT4/POU5F1 and NANOG shows that they are highly expressed in both hiPSC lines (Q5 Ctrl and Q6 22q11.2). (E) TBR1 and TUJ1 expression of cortical neurons by immunocytochemistry at day 20 of differentiation indicates the efficiency of hiPSC differentiation into cortical neurons. TBR1 (red), TUJ1 (green) and DAPI (blue). Scale bar: 100 μm. (F–G) Time-course qRT-PCR analysis at day 0 and day 20 of differentiation of human pluripotency marker (F) OCT4/POU5F1 (p=0.0012) and (G) TBR1 (p=0.0273), a preplate, subplate and cortical Layer VI neuron marker in Q5 (Ctrl) line. Day 0: n=4, Day 20 n=4. Data are presented as mean ± SEM, unpaired two-tailed t-test, *p<0.05, **p<0.01.
-
Figure 1—figure supplement 1—source data 1
PDF file containing original gel for Figure 1—figure supplement 1G.
- https://cdn.elifesciences.org/articles/103328/elife-103328-fig1-figsupp1-data1-v1.pdf
-
Figure 1—figure supplement 1—source data 2
Original file for hiPSC validation shown in Figure 1—figure supplement 1G.
- https://cdn.elifesciences.org/articles/103328/elife-103328-fig1-figsupp1-data2-v1.zip
Figure 1—figure supplement 2
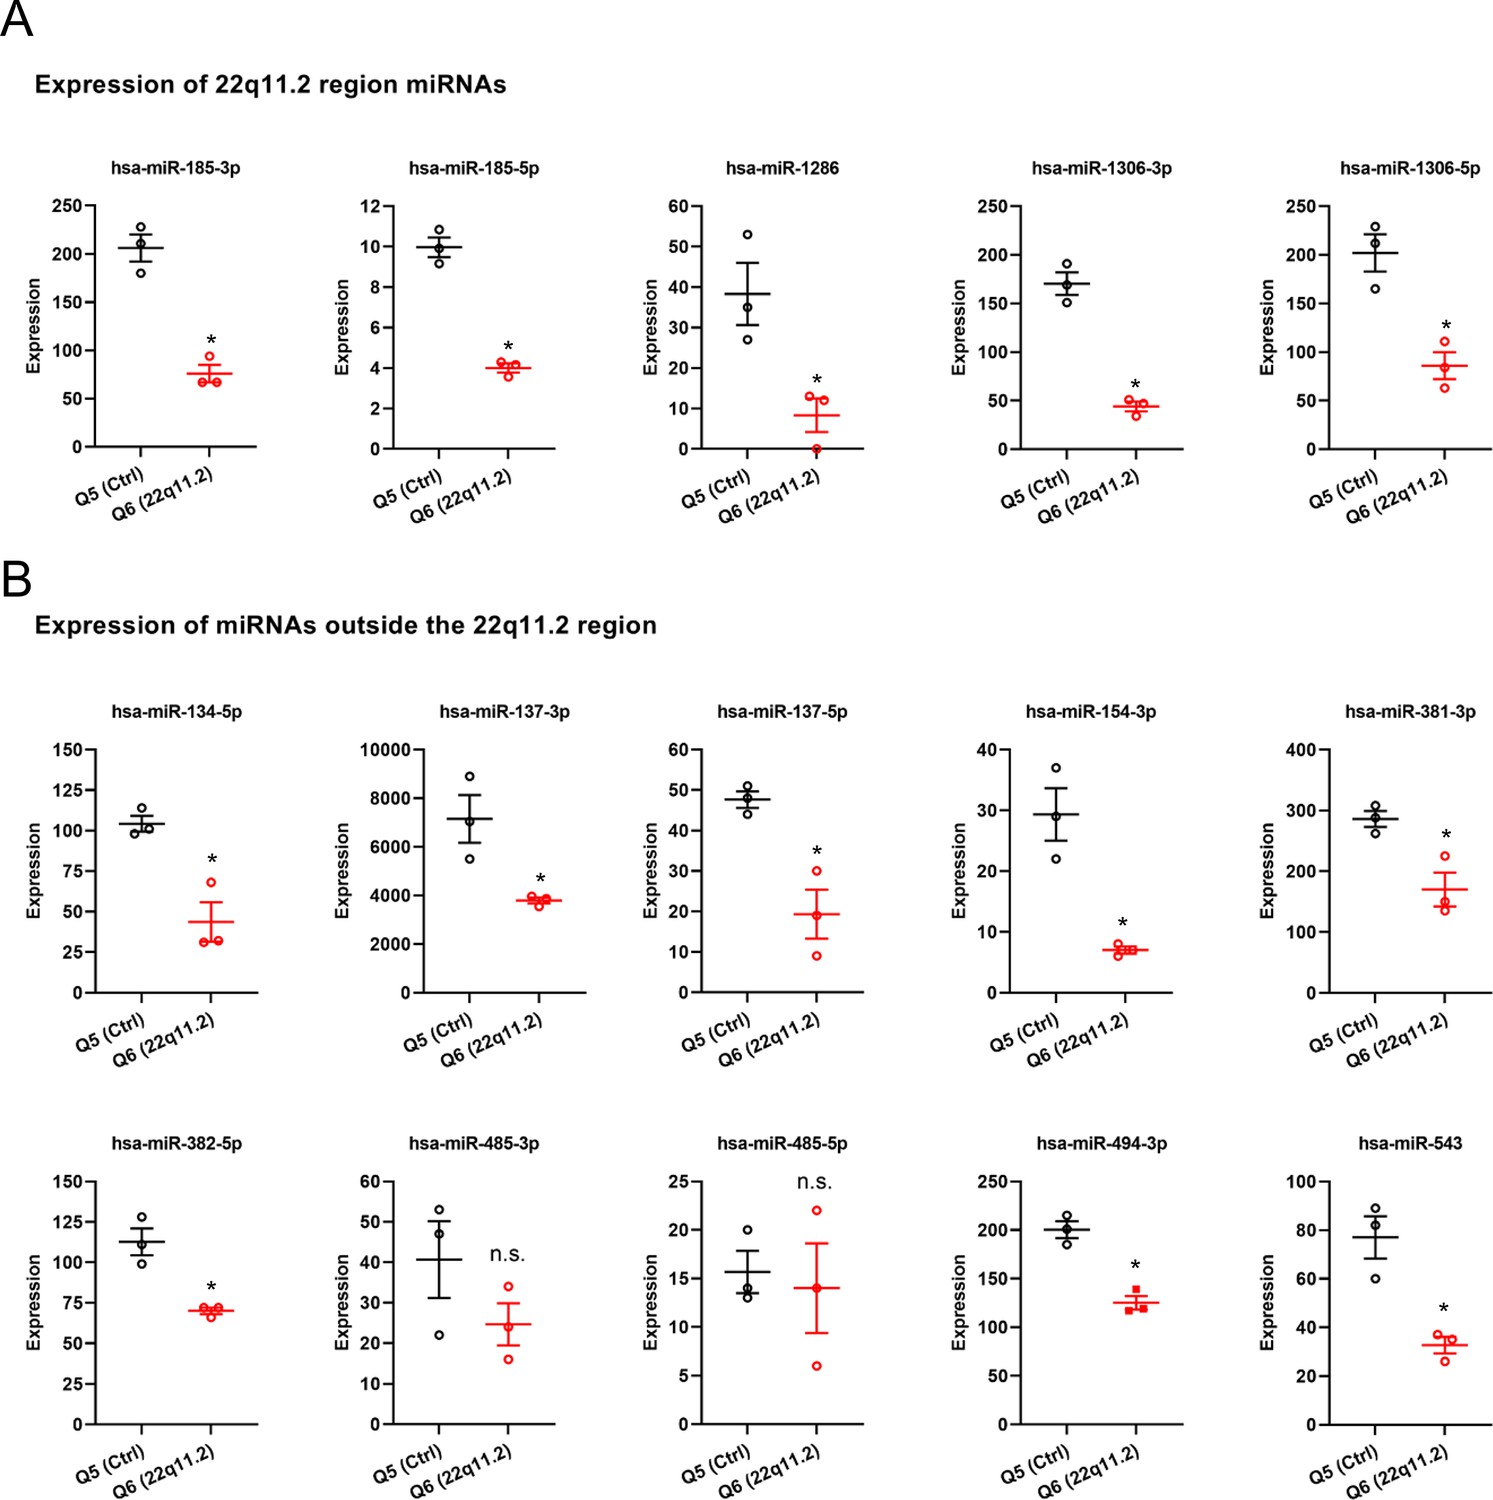
Expression profile of selected human mature miRNAs in Q5 (Ctrl) and Q6 (22q11.2) cortical neurons at day 8 of differentiation.
(A) 22q11.2 region residing miRNAs and (B) selected miRNAs residing outside the 22q11.2 region (Q5 n=3, Q6 n=3). Data are presented as mean ± SEM; *p<0.05, Students t-test.
Figure 1—figure supplement 3
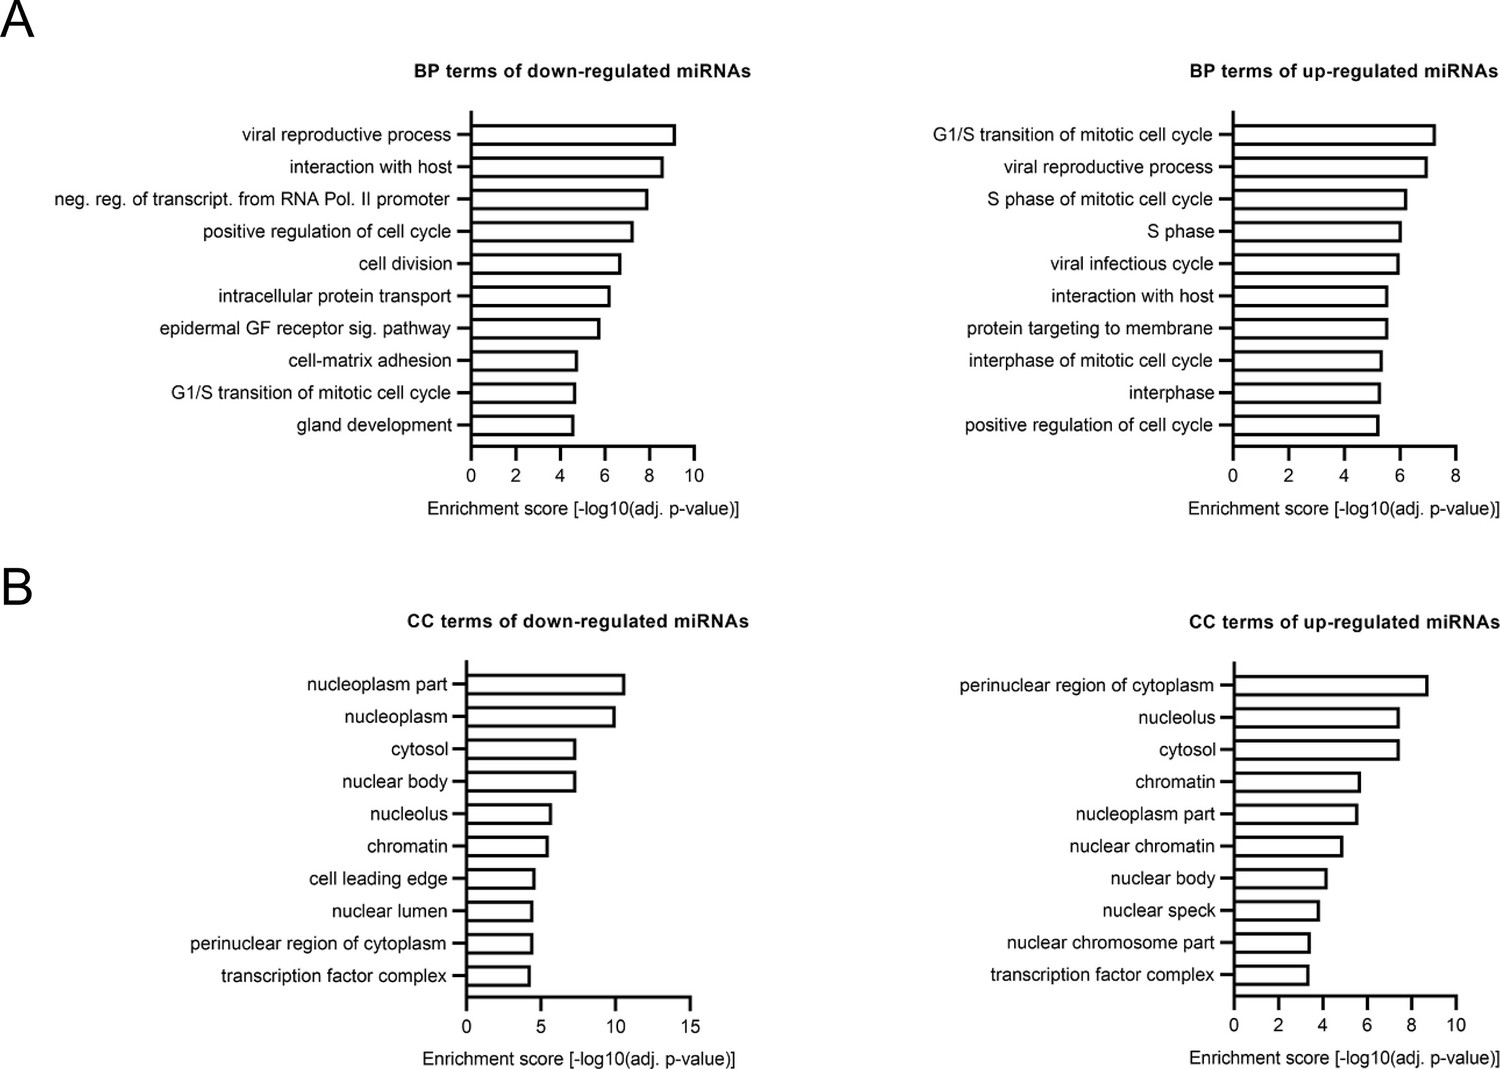
GO-term analysis of altered miRNA expression in hiPSC-derived cortical neurons with 22q11.2 deletion.
(A–B) Gene Ontology (GO) term enrichment analysis of up- and downregulated DEmiRs highlighted cell cycle and cell division relevant terms. (A) Biological process. (B) Cellular component.
Figure 1—figure supplement 4
Altered gene expression in hiPSC-derived cortical neurons from 22q11.2 deletion carriers.
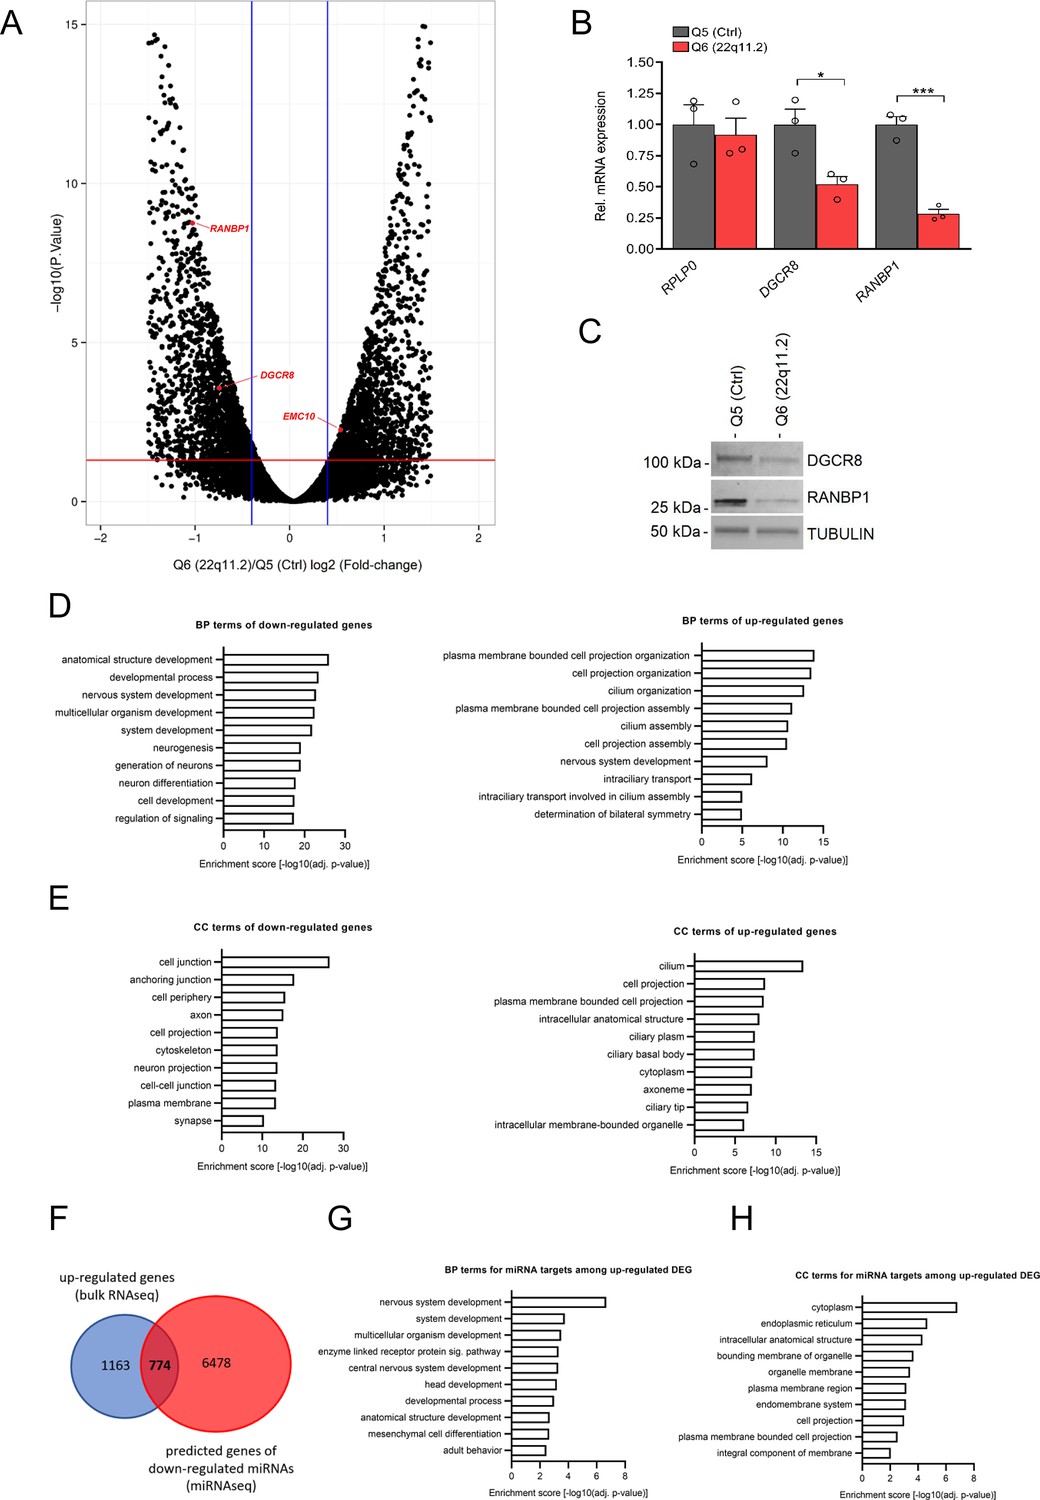
(A) Volcano plot showing differential gene expression in cortical neurons at day 8 of differentiation. Significantly differentially expressed genes (FDR <5%) are shown above red line; Q5 (Ctrl) n=3, Q6 (22q11.2) n=3. 1937/2094 genes were significantly up- and downregulated in Q6 (22q11.2) hiPSC-derived cortical neurons, respectively. 22q11.2 deletion region residing genes RANBP1 and DGCR8 as well as EMC10 are highlighted. (B) qRT-PCR analysis confirming reduction of DGCR8 (p=0.0261) and RANBP1 (p=0.0006) mRNAs but not for the housekeeping control RPLP0 (p=0.7155) gene at day 8 of differentiation in Q6 (22q11.2) compared to Q5(Ctrl) lines derived cortical neurons (Q5: n=3, Q6: n=3). (C) Western blot analysis showing reduced amount of DGCR8 and RANBP1 protein in Q6 (22q11.2) line derived cortical neurons at day 8 of differentiation. Tubulin was probed as a loading control. (D–E) Gene Ontology (GO) term enrichment analysis of up- and downregulated DEGs reveals several neuronal related components. (D) Biological process. (E) Cellular component. (F) Intersection of predicted miRNA targets and gene expression analysis. Venn diagram highlighting upregulated DEGs (from bulk RNAseq) that are predicted targets of downregulated miRNAs (774). (G–H) Gene Ontology (GO) term enrichment analysis of predicted targets reveals several neuronal related components for the upregulated genes. (G) Biological process. (H) Cellular component.
-
Figure 1—figure supplement 4—source data 1
PDF file containing original western blots for Figure 1—figure supplement 4C, indicating the relevant bands.
- https://cdn.elifesciences.org/articles/103328/elife-103328-fig1-figsupp4-data1-v1.pdf
-
Figure 1—figure supplement 4—source data 2
Original files for western blot analysis shown in Figure 1—figure supplement 4C.
- https://cdn.elifesciences.org/articles/103328/elife-103328-fig1-figsupp4-data2-v1.zip
Figure 2 with 1 supplement
Altered miRNA expression in hiPSC-derived cortical neurons from 22q11.2 deletion carriers.
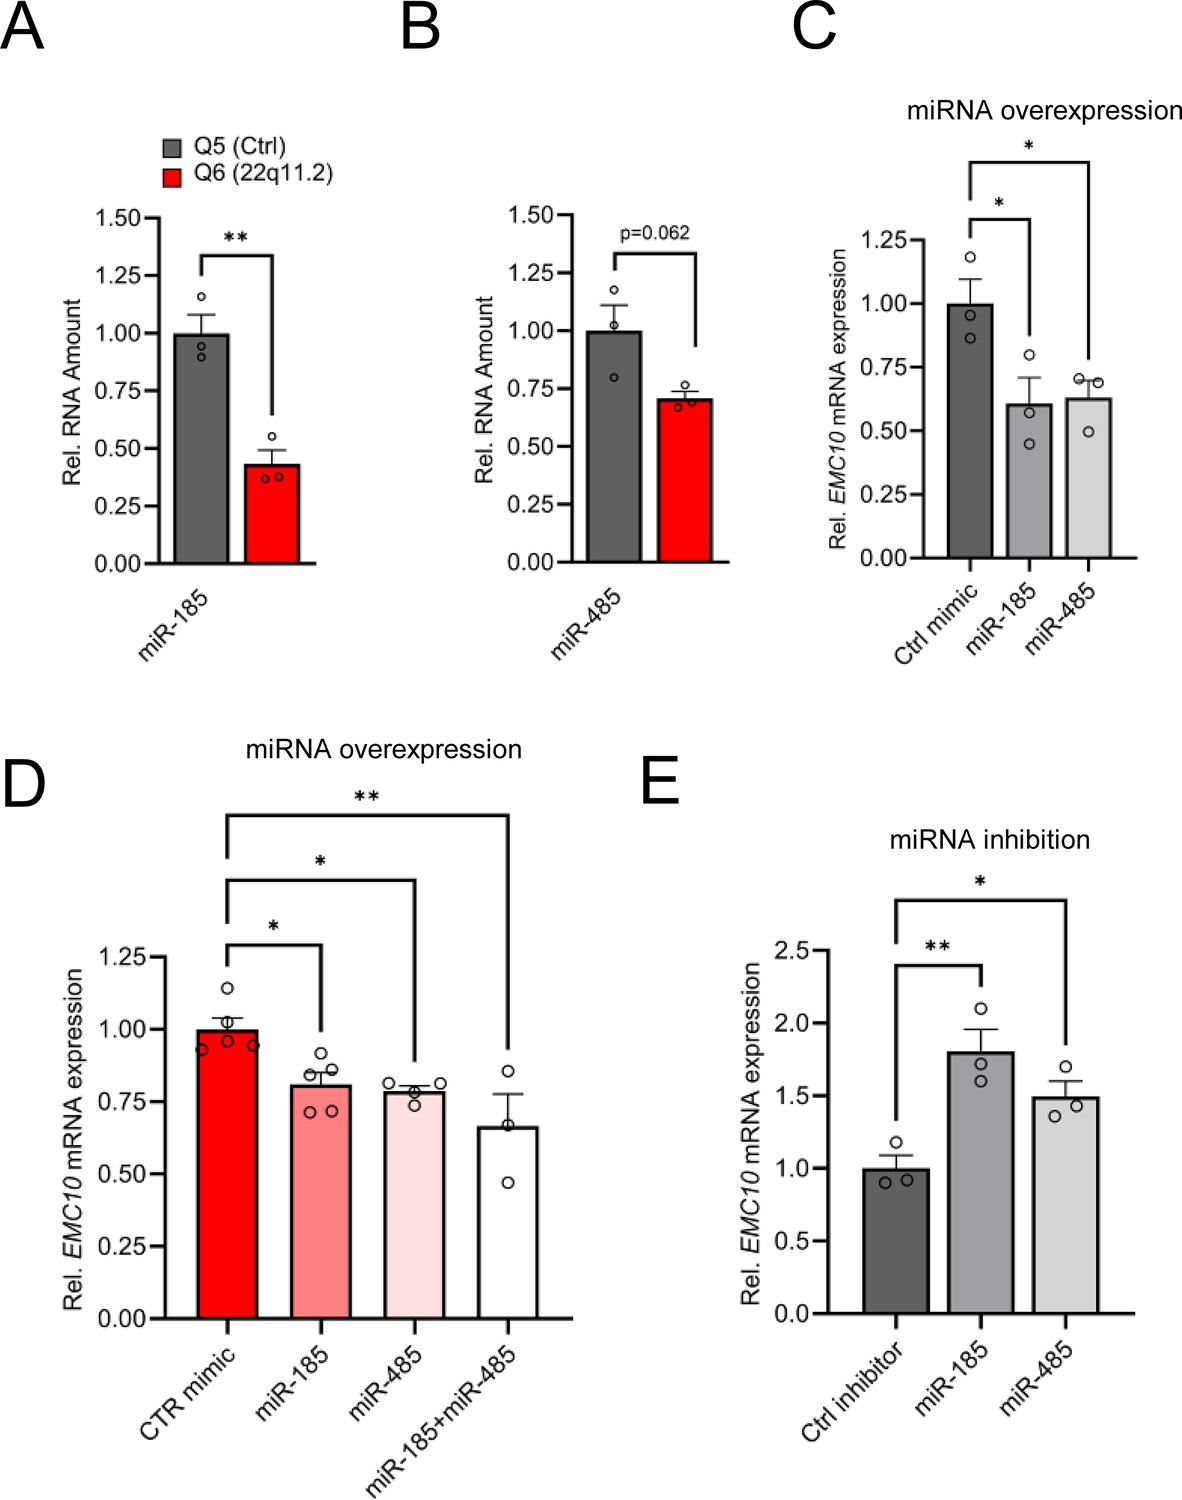
(A) Precursor miRNA expression level of miR-185 (p=0.0038), predicted to target EMC10, are downregulated in Q6 (22q11.2) cortical neurons as assayed by qRT-PCR (Q5: n=3, Q6: n=3). (B) Precursor miRNA expression level of miR-485 (p=0.0622), predicted to target EMC10, are downregulated in Q6 (22q11.2) cortical neurons as assayed by qRT-PCR (Q5: n=3, Q6: n=3). (C–E) miR-185 and miR-485 modulate EMC10 in human iPSC-derived cortical neurons. (C) qRT-PCR quantification shows reduced expression levels of EMC10 mRNA in Q5 (Ctrl) line derived cortical neurons at day 10 of differentiation transfected with miR-185 [one-way ANOVA, F (2, 6)=6.079, p=0.0361; post hoc Bonferroni, p=0.0366] or miR-485 [post hoc Bonferroni, p=0.0464] mimics at day 8 of differentiation. Expression levels in miR-185 or miR-485 mimic-treated neurons were normalized to expression levels under scramble mimic controls treatment (n=3, each treatment). (D) qRT-PCR quantification shows reduced expression levels of EMC10 mRNA in Q6 line-derived cortical neurons transfected with miR-185 [one-way ANOVA, F (3, 13)=7.167, p=0.0044; post hoc Tukey, p=0.0345] or miR-485 [post hoc Tukey, p=0.0251] or a combination of both miRNA mimics [post hoc Tukey, p=0.0020]. Expression levels in miR-185, miR-485 or the combination of both mimic-treated neurons were normalized to expression levels under scramble mimic controls treatment. Ctrl mimic n=5, miR-185 mimic n=5, miR-485 mimic n=4 and miR-185 +miR-485 mimics n=3. (E) qRT-PCR quantification shows increased expression levels of EMC10 mRNA in Q5 line derived cortical neurons transfected with miRNA inhibitors miR-185 [one-way ANOVA, F (2, 6)=11.94, p=0.0081; post hoc Bonferroni, p=0.0057]or miR-485 [post hoc Bonferroni, p=0.0491] at day 8 of differentiation. Expression levels in miR-185 or miR-485 inhibitor-treated neurons were normalized to expression levels under scramble miRNA inhibitor controls treatment (n=3, each treatment). Data are presented as mean ± SEM, unpaired two-tailed t-test or one-way ANOVA as indicated, *p<0.05, **p<0.01.
Figure 2—figure supplement 1
Predicted miRNA targets.
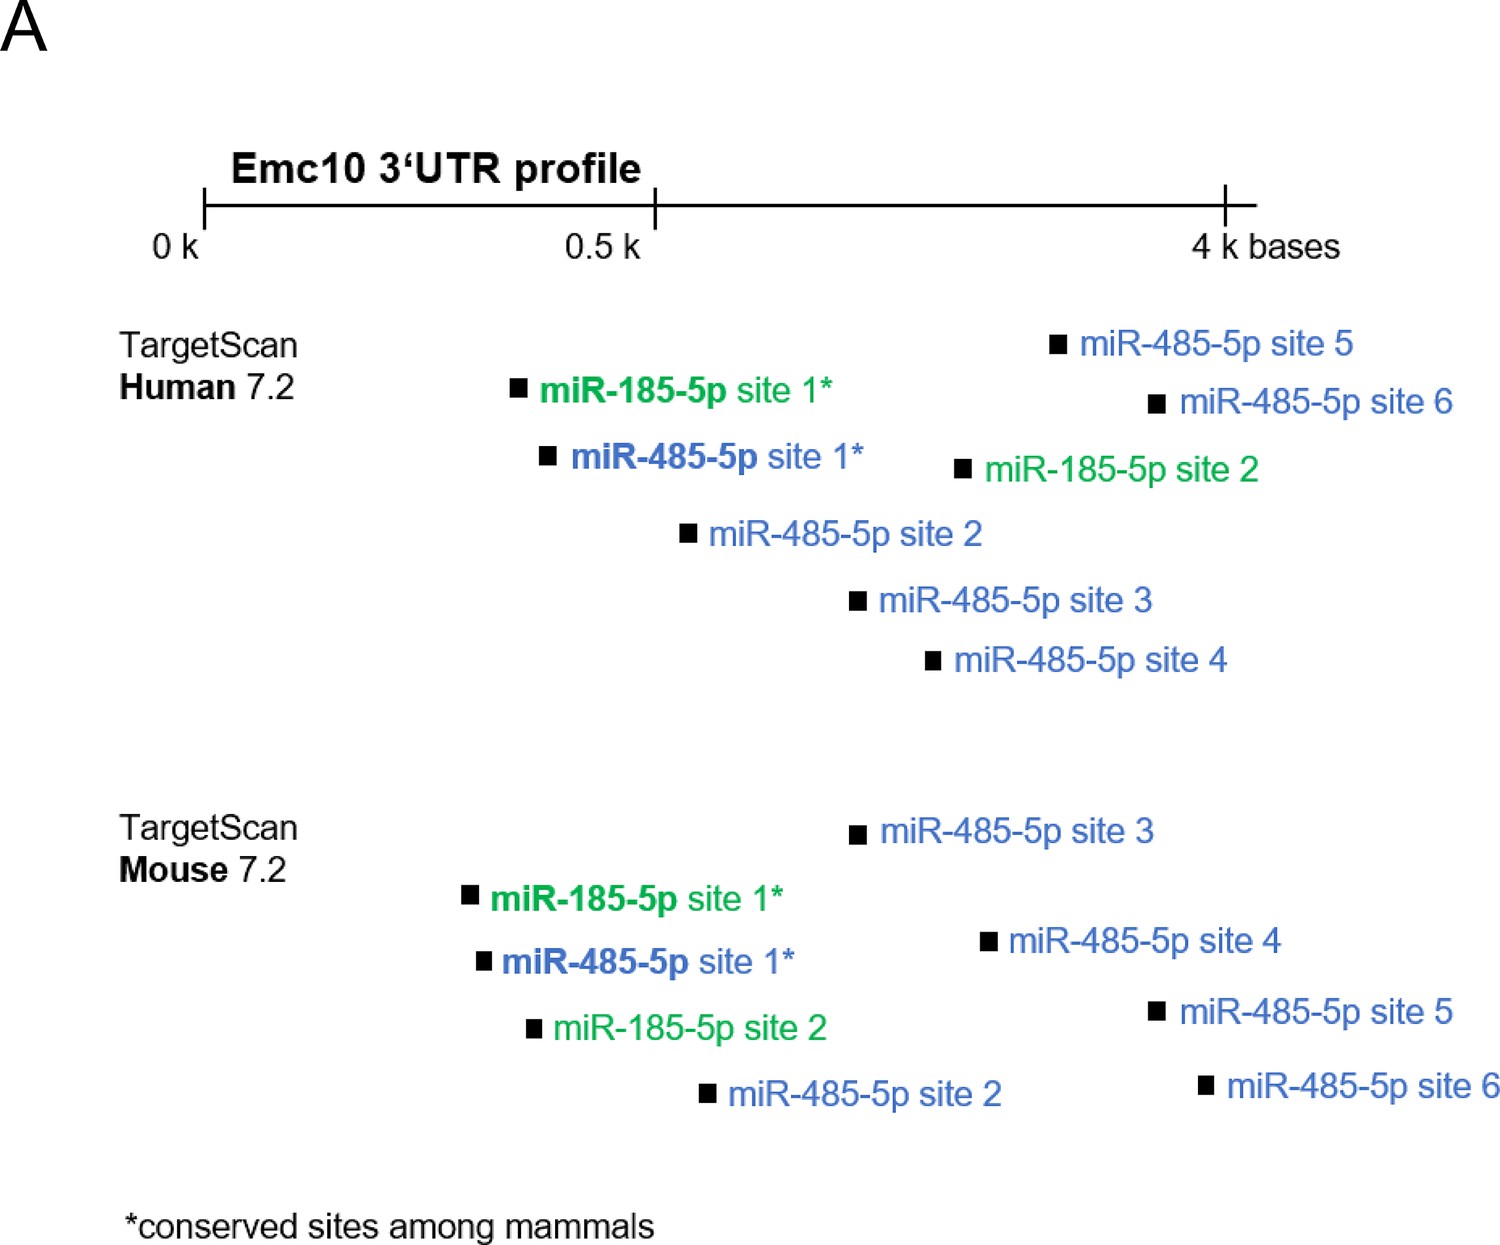
(A) Schematic of human and mouse Emc10 3’UTR showing miR-185 (green) and miR-485 (blue) binding sites predicted by TargetScan. Conserved target sites in mammals are marked with an asterisk. Specific binding site positions in Emc10 3’UTR are indicated in brackets. Human EMC10 3’UTR: miR-185–5 p site 1* (467-474), site 2 (2807–2813), miR-485–5 p site 1* (473-479), site 2 (585-591), site 3 (1530–1536), site 4 (1996–2002), site 5 (3516–3522), site 6 (4158–4164). Mouse Emc10 3’UTR: miR-185–5 p site 1* (400-407), site 2 (454-460), miR-485–5 p site 1* (406-412), site 2 (513-519), site 3 (796-802), site 4 (2842–2848), site 5 (4013–4020), site 6 (4576–4582).
Figure 3 with 3 supplements
Reduction of EMC10 levels restores defects in neurite outgrowth and calcium signaling in neurons from 22q11.2 deletion carriers.
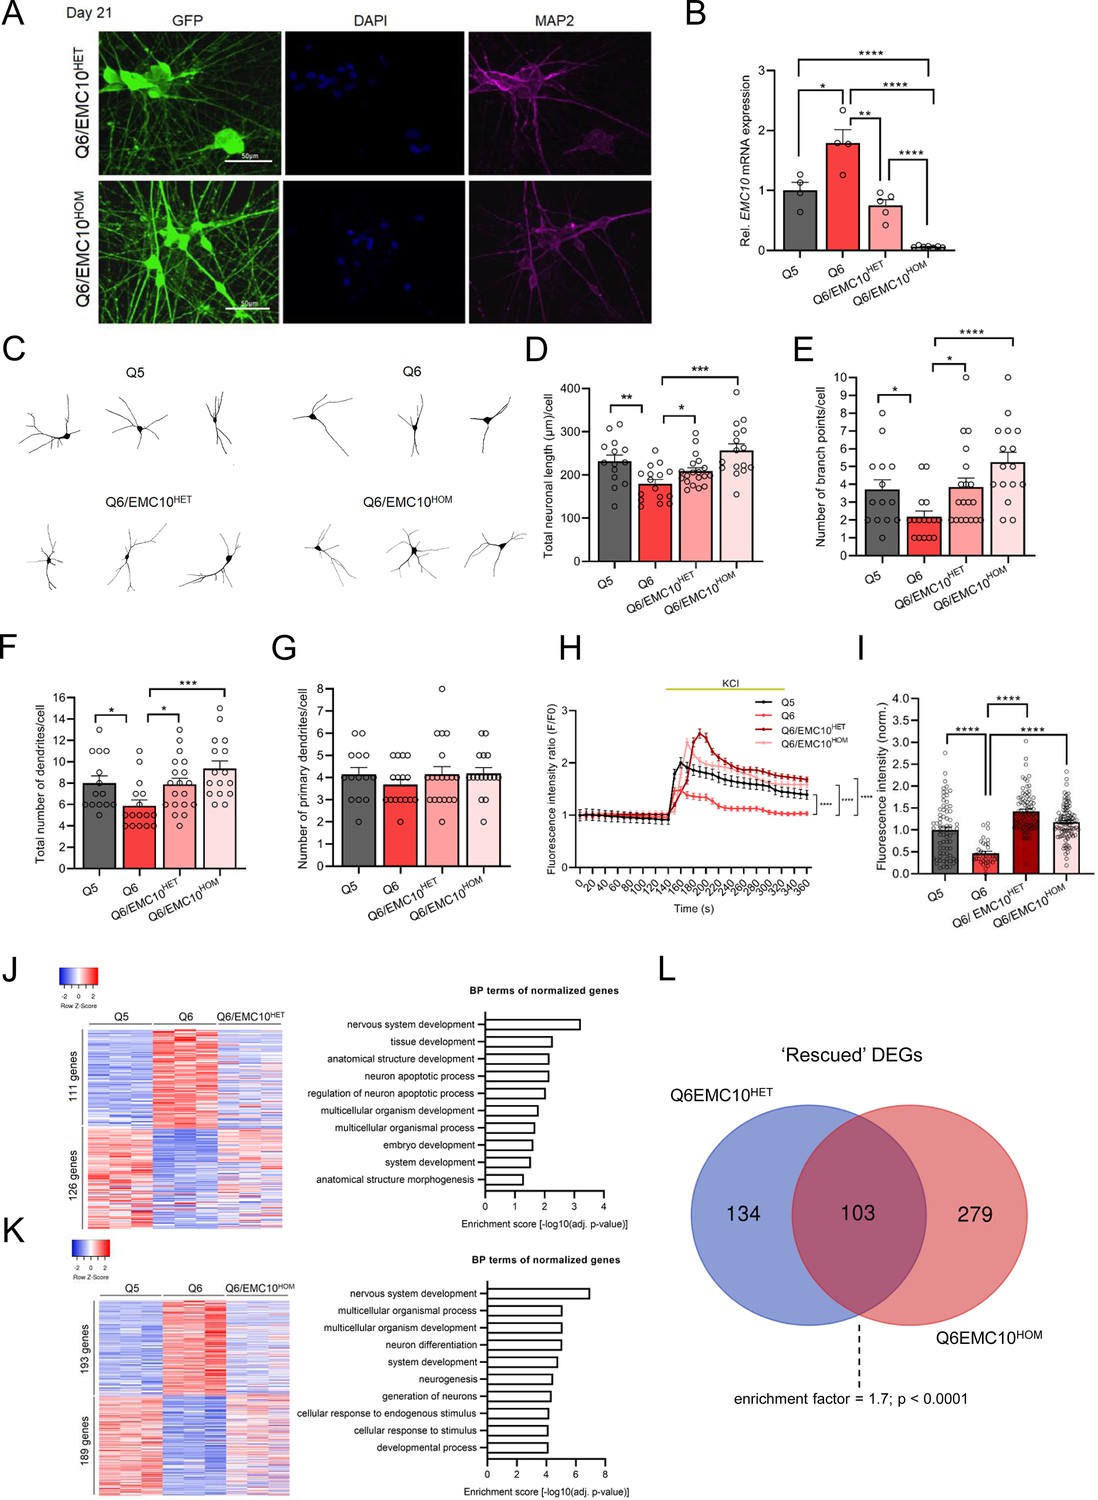
(A) Representative images of NGN2-iNs at DIV21 from Q6/EMC10HET and Q6/EMC10HOM hiPSC lines identified via EGFP fluorescence and immunostained for neuronal dendrite marker MAP2 and the nuclear marker DAPI. Scale bar = 50 µm. (B) qRT-PCR assay of EMC10 mRNA expression level in NGN2-iNs at DIV21. EMC10 expression is normalized to near WT levels level in Q6/EMC10HET line (p=0.166) and abolished in Q6/EMC10HOM line (p<0.0001). Q5 (Ctrl) n=4, Q6 (22q11.2/SCZ) n=4, Q6/EMC10HET n=5 and Q6/EMC10HOM n=7. (C–G) Neuronal morphology analysis in Q5, Q6 (22q11.2), Q6/EMC10HET and Q6/EMC10HOM neurons. (C) Representative images of traced neurons. (D) Total neuronal length is reduced in Q6 line (p=0.0044) and restored in Q6/ EMC10HET (p=0.0253) and Q6/EMC10HOM line (p=0.0001). (E) Reduction in number of branch points/cell in Q6 (p=0.0195) is restored in the Q6/EMC10HET (p=0.0134) and Q6/EMC10HOM lines (p<0.0001). (F) Reduction in the total number of dendrites/cells in Q6 (p=0.0202) is reversed in the Q6/EMC10HET (p=0.0166) and Q6/EMC10HOM lines (p=0.0005) (G) The number of primary dendrites per cell is unchanged. Q5 (Ctrl) n=14, Q6 (22q11.2) n=16, Q6/EMC10HET n=19 and Q6/EMC10HOM n=16 neuronal cells. (H–I) Defects in cytoplasmic calcium signaling in Q6 (22q11.2) neurons are reversed in Q6/EMC10HET and Q6/EMC10HOM lines. (H) Changes in Fluo4-AM fluorescence signal intensity in response to 75 mM KCl in Q5 (Ctrl), Q6 (22q11.2). Q6/EMC10HET and Q6/EMC10HOM hiPSC-derived neurons at DIV38. Q5 vs. Q6 (KS D=0.5405, p<0.0001), Q6 vs. Q6 EMC10HET (KS D=0.5556, p<0.0001) and Q6 vs. Q6 EMC10HOM (KS D=0.5676, p<0.0001). (I) Quantification of KCl-induced Fluo4 intensity peak amplitude (∆F) demonstrates a reduction in Q6 line (p<0.0001) that is reversed in Q6/EMC10HET (p<0.0001) and Q6/EMC10HOM lines (p<0.0001). Q5 (Ctrl) n=70, Q6 (22q11.2/SCZ) n=37, Q6/EMC10HET n=82, Q6/EMC10HOM n=97 neuronal cells. (J) Heatmap (left) showing the expression of differentially regulated 237 genes in Q5 (Ctrl) and Q6 (22q11.2) that are normalized in the Q6/EMC10HET NGN2-iNs at DIV21 (n=3 per genotype). Gene Ontology (GO) biological process (BP) terms (right) associated with the up- and downregulated genes normalized in the Q6/EMC10HET NGN2-iNs. (K) Heatmap (left) showing the expression of differentially regulated 382 genes in Q5 (Ctrl) and Q6 (22q11.2) that are normalized in the Q6/EMC10HOM NGN2-iNs at DIV21 (n=3 per genotype). Gene Ontology (GO) biological process (BP) terms (right) associated with the up- and downregulated genes normalized in the Q6/EMC10HOM NGN2-iNs. (L) Intersection of rescued up- and downregulated DEGs in the Q6/ EMC10HET and Q6/EMC10HOM lines: Venn diagram highlighting the 103 rescued DEGs (enrichment factor = 1.7; p<0.0001, based on a hypergeometric test). Data are presented as mean ± SEM, unpaired two-tailed t-test or Kolmogorov–Smirnov test as indicated, *p<0.05, **p<0.01, ***p<0.001, ****p<0.0001.
Figure 3—figure supplement 1
Characterization of hiPSC lines carrying an EMC10 LoF mutation.
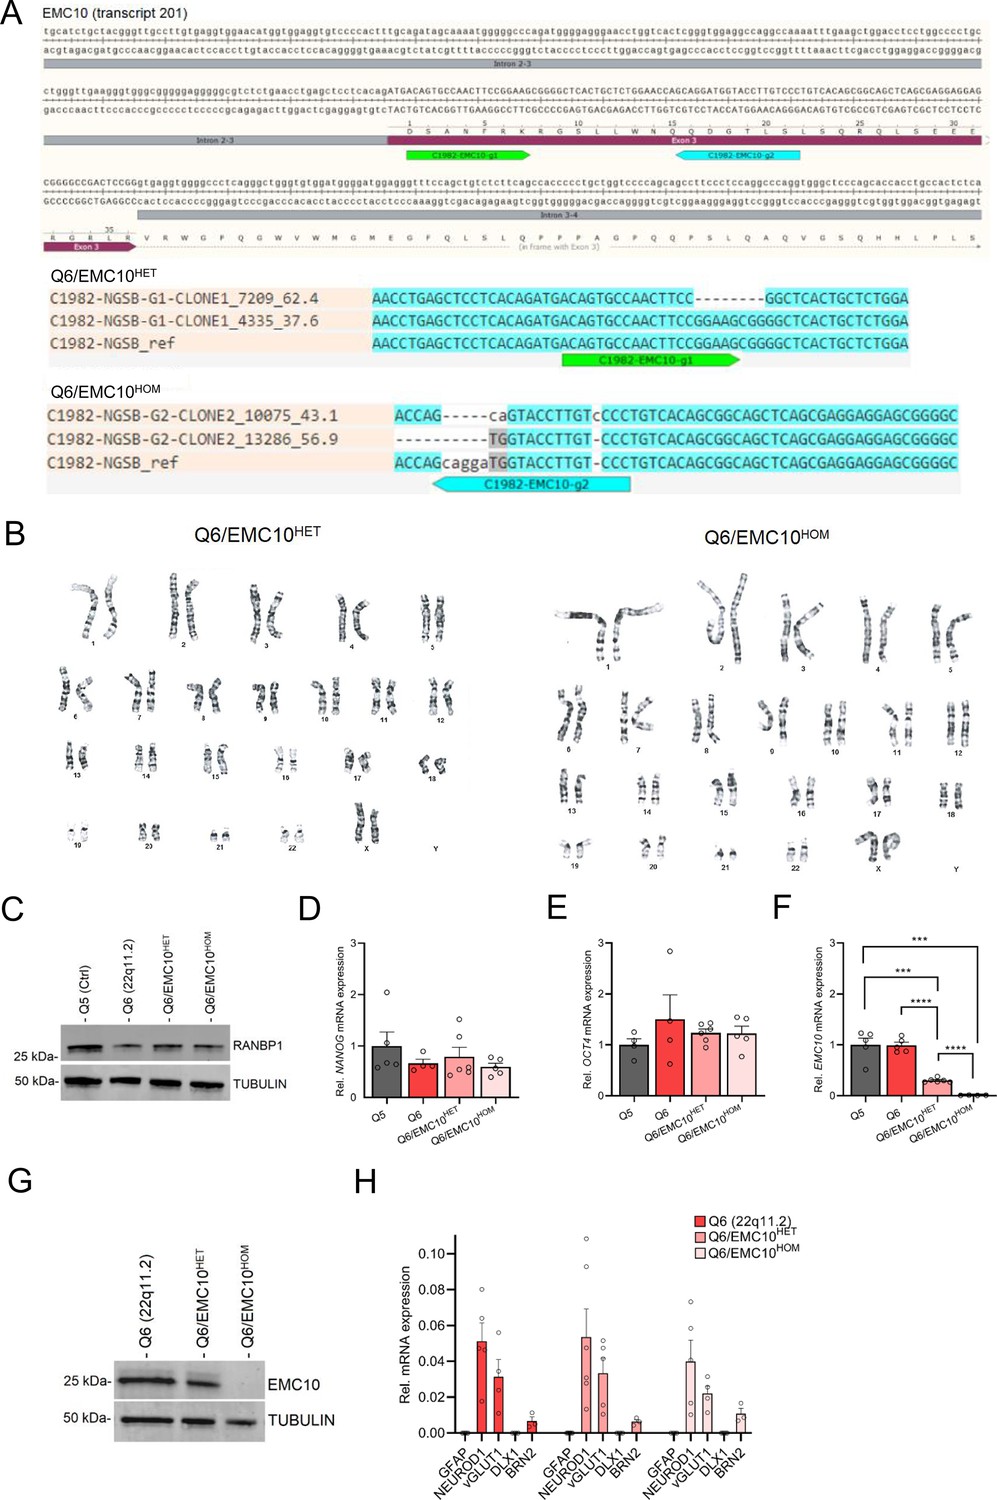
(A) CRISPR/Cas9 genome editing in Q6 (22q11.2) hiPSCs to obtain EMC10 LoF mutation lines. Two 20 bp guided RNAs (gRNAs) were designed to specifically target the EMC10 exon 3 region (transcript 201, ENNST00000334976.11), to generate a frameshift mutation as indicated by the green (EMC10-g1) and blue (EMC10-g2) arrow in the gRNA profiles at EMC10 locus (A, upper panel). Upper panel (A): gRNA design and profile at the targeted EMC10 locus that leads to frameshift mutations. Lower panel (A): Genotyping of positive clones for Q6/EMC10HET and Q6/EMC10HOM lines confirms frameshift mutation. (B) Characterization of Q6/EMC10HET and Q6/EMC10HOM hiPS cells demonstrate normal karyotype distribution (C–G) Western blot assay and qRT-PCR assays in hiPSC lines. (C) Western blot analysis confirmed reduction of RANBP1 protein levels in Q6, Q6/EMC10HET and Q6/EMC10HOM lines. Embryonic stem cell marker (D) NANOG and (E) OCT4/POU5F1 are highly expressed in all four hiPSC lines assayed. (F) qRT-PCR assay in hiPSC lines. EMC10 expression is reduced or abolished in Q6/EMC10HET line (p=0.0002) and Q6/EMC10HOM line (p=0.0003), respectively, when compared to Q5 (Ctrl) line. Note that EMC10 is not upregulated in Q6 hiPSCs. Q5 (Ctrl) n=5, Q6 (22q11.2) n=5, Q6/EMC10HET n=6 and Q6/EMC10HOM n=4. (G) Western blot analysis showing reduction (Q6/EMC10HET) or elimination (Q6/EMC10HOM) of EMC10 protein levels in the EMC10 LoF mutant hiPSC lines. Tubulin was probed as a loading control. (H) qRT-PCR assay of neuronal differentiation (NEUROD1), excitatory (vGLUT1) and cortical projection (BRN2) markers demonstrating similar mRNA expression pattern in Q6 (22q11.2) and derivative Q6/EMC10HET and Q6/EMC10HET NGN2-iNs at DIV21, whereas the glia marker GFAP and the inhibitory marker DLX1 were not detected. Q6 (22q11.2) n=3–5, Q6/EMC10HET n=3–6, Q6/EMC10HOM n=3–5. Data are presented as mean ± SEM, unpaired two-tailed t-test, *p<0.05, **p<0.01, ***p<0.001, ****p<0.0001.
-
Figure 3—figure supplement 1—source data 1
PDF file containing original western blots for Figure 3—figure supplement 1C and G, indicating the relevant bands.
- https://cdn.elifesciences.org/articles/103328/elife-103328-fig3-figsupp1-data1-v1.pdf
-
Figure 3—figure supplement 1—source data 2
Original files for western blot analysis shown in Figure 3—figure supplement 1C and G.
- https://cdn.elifesciences.org/articles/103328/elife-103328-fig3-figsupp1-data2-v1.zip
Figure 3—figure supplement 2
Defects in cytoplasmic calcium signaling in Q6 (22q11.2) neurons.
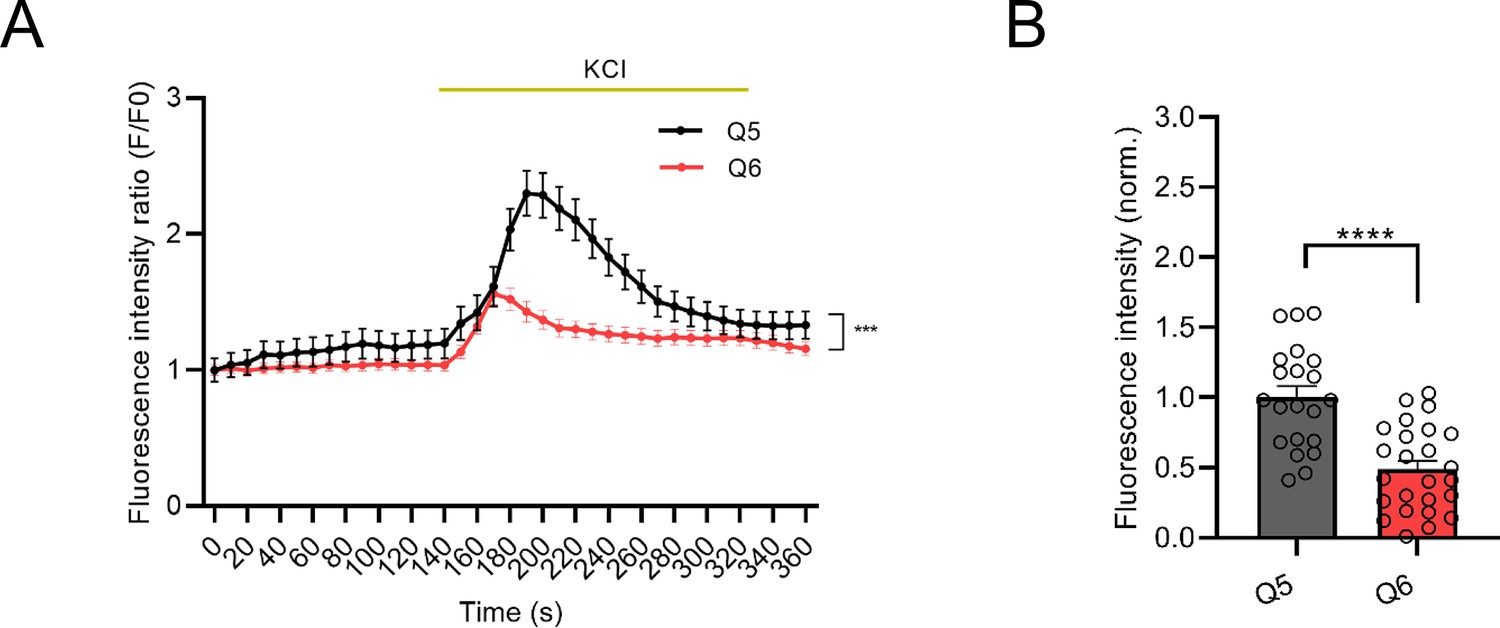
(A) Changes in Fluo4-AM fluorescence signal intensity in response to 75 mM KCl in Q5 (Ctrl) and Q6 (22q11.2) hiPSC-derived neurons at DIV37 (KS D=0.4865, p=0.003). (B) Quantification of KCl-induced Fluo4 intensity peak amplitude (∆F) shows a reduction in Q6 line (p<0.0001). Q5 (Ctrl) n=21, Q6 (22q11.2) n=24 neuronal cells. Data are presented as mean ± SEM, unpaired two-tailed t-test or Kolmogorov–Smirnov test as indicated, *p<0.05, **p<0.01, ***p<0.001, ****p<0.0001.
Figure 3—figure supplement 3
PPI network analysis of the 103 shared DEGs normalized in both Q6/EMC10HET and Q6/EMC10HOM NGN2-iNs.
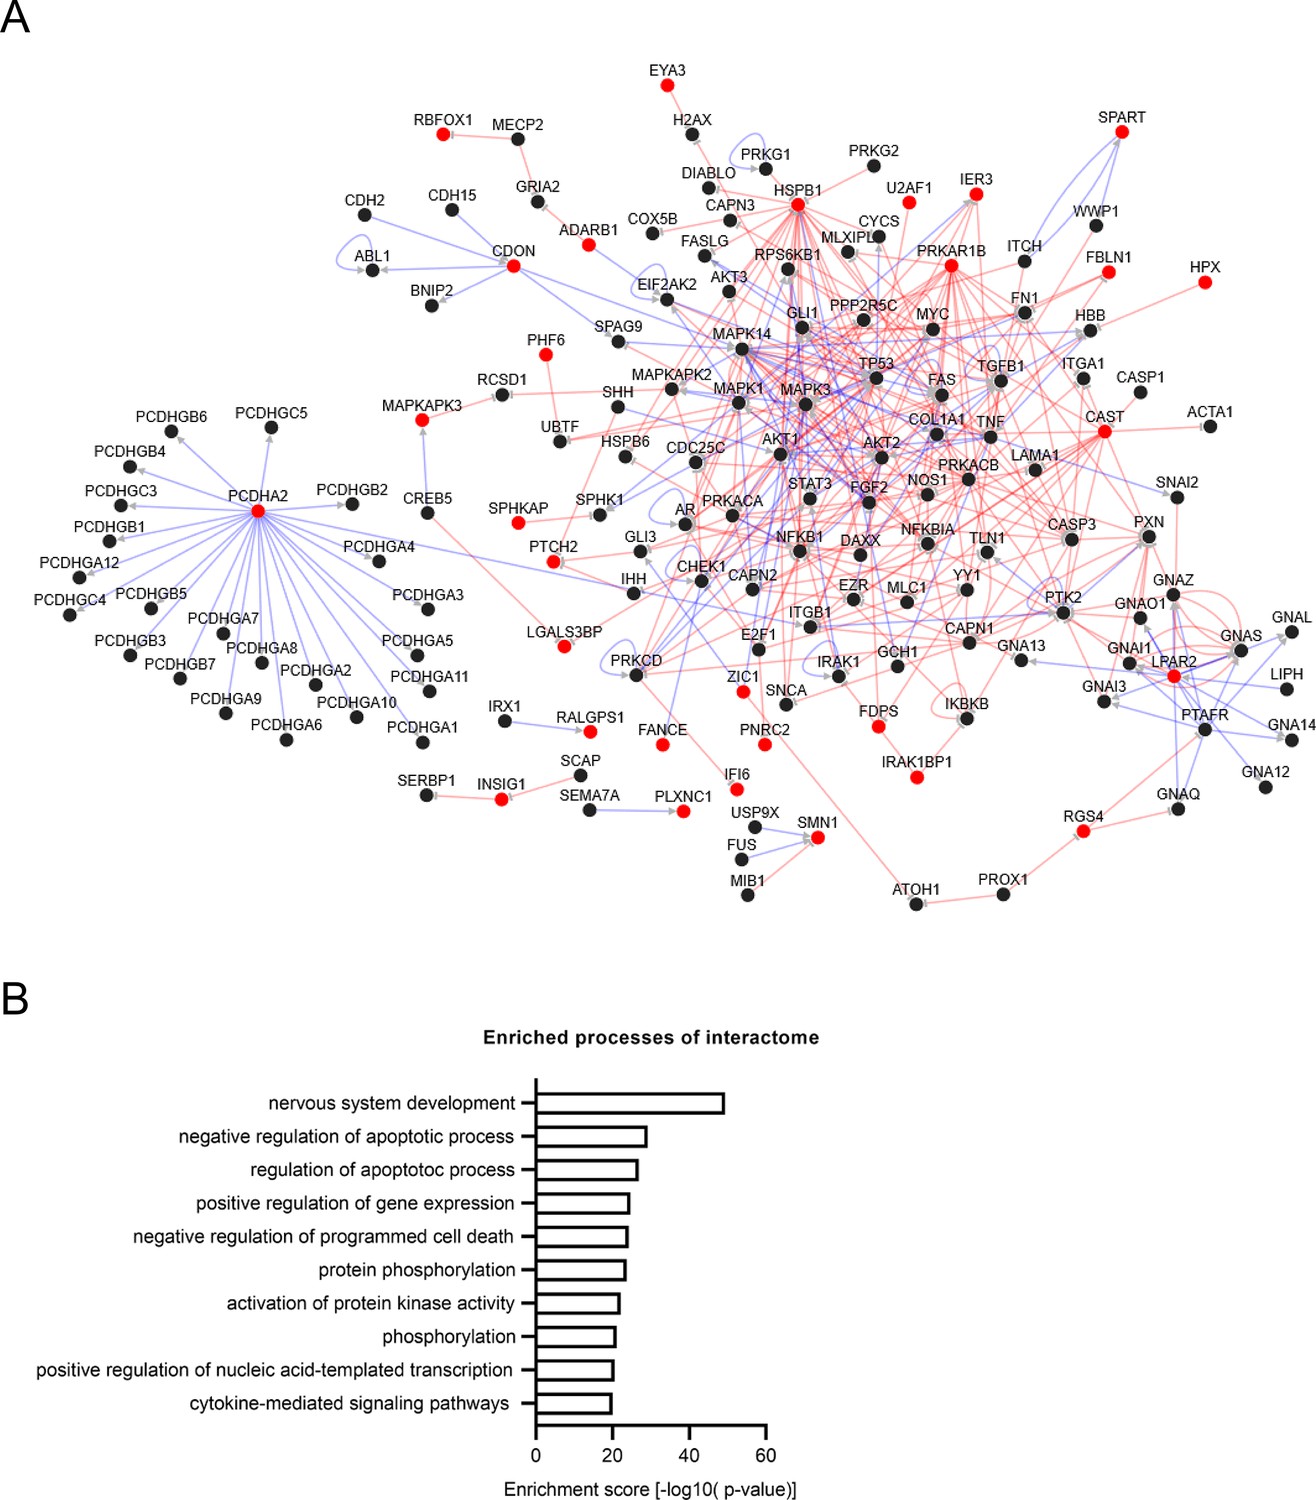
(A) Constructed directional PPI network out of the 30 matched candidates shown in red (PPI network; number of nodes: 150, number of edges: 365, average degree: 4.867, cluster of coefficient: 0.065). (B) GO term biological process: Enrichment analysis of matched proteins network.
Figure 4 with 4 supplements
ASO-mediated suppression of murine Emc10 in vivo.
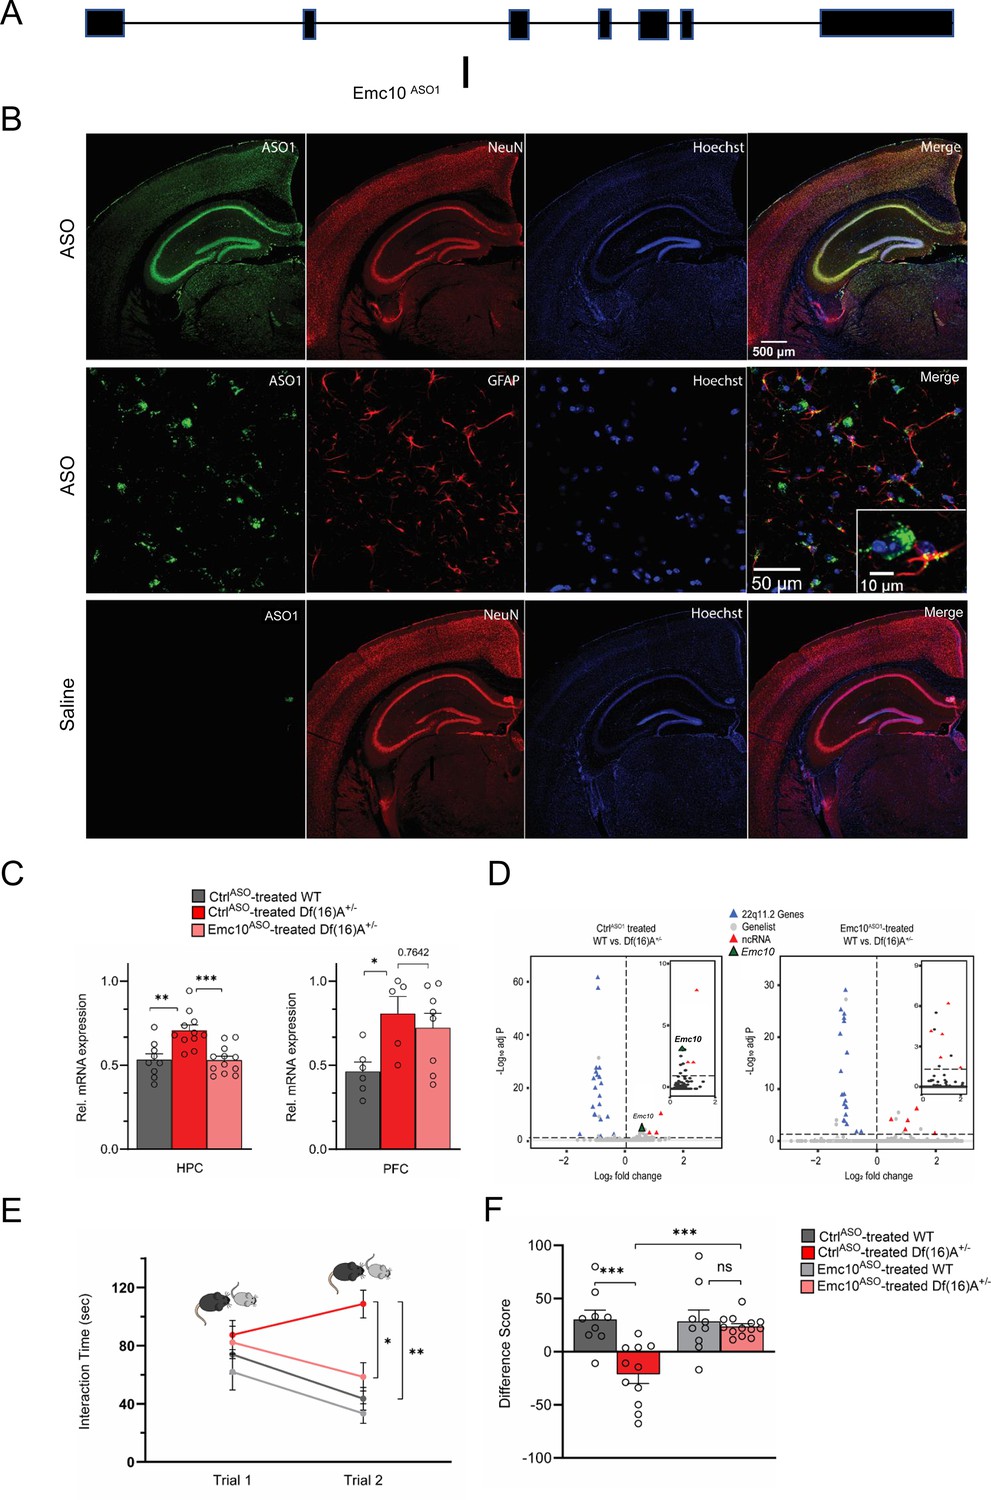
(A) Mouse Emc10 gene map plot (ENSMUST00000118808) showing the Emc10ASO1 target site. (B) Mouse brains collected 3 weeks post ICV injection were stained with an ASO antibody (green), counterstained with neuronal marker NeuN (red) and nuclear stain Hoechst (blue). A robust and uniform ASO diffusion (top panel) is observed in the HPC. No signal is detected in saline injected mice (bottom panel). Overlap with NeuN (yellow, top-right panel) confirms presence in neuronal cells. Accumulation in glial cells, specifically GFAP-labeled astrocytes is also observed (middle-right panel and inset; ASO in green, GFAP in red, and Hoechst in blue). Images are taken with 4 x, 20 x and 40 x objectives. (C) qRT-PCR analysis shows Emc10ASO-mediated normalization of Emc10 mRNA levels in the HPC of Df(16)A+/-mice (left panel). Significant upregulation of Emc10 mRNA expression levels is seen in CtrlASO-treated-Df(16)A+/-compared to WT mice one-way ANOVA, F (2, 29)=11.65, p<0.001; post hoc Tukey, p=0.001. Following ASO treatment, Emc10 expression is normalized to WT levels in Emc10ASO-treated-Df(16)A+/–compared to CtrlASO-treated-Df(16)A+/-mice (post hoc Tukey, p=<0.001). CtrlASO-treated WT mice: n=9 (5 males, 4 females), CtrlASO-treated Df(16)A+/ mice: n=11 (5 males, 6 females), and Emc10ASO-treated Df(16)A+/ mice: n=12 (7 males, 5 females). qRT-PCR analysis shows a significant upregulation of Emc10 mRNA expression levels in the PFC of CtrlASO-treated-Df(16)A+/- (right panel) compared to WT mice one-way ANOVA, F (2, 16)=4.253, p=0.0330; post hoc Tukey, p=0.0385. ASO injection does not normalize Emc10 expression levels in PFC of Df(16)A+/ mice injected with Emc10ASO (post hoc Tukey vs CtrlASO treated Df(16)A+/ mice, p=0.7642). CtrlASO-treated-WT male mice: n=6, CtrlASO-treated-Df(16)A+/-male mice: n=5, and Emc10ASO-treated-Df(16)A+/ male mice: n=8. (D) Volcano plots showing upregulation of Emc10 expression in the CtrlASO treated-Df(16)A+/-compared to the CtrlASO-treated WT mice (left panel and inset) but not in the Emc10ASO treated-Df(16)A+/-compared to the Emc10ASO-treated WT mice (right panel and inset). The expected down-regulation of genes included in the Df(16)A+/–deletion (blue) and upregulation of non-coding RNAs (ncRNAs, red) is also evident in both panels. Downregulated genes from the 22q11.2 locus (Dgcr8, Ranbp1, and Tango2) as well as the upregulated ncRNA (miRNA-containing) gene Mirg, are highlighted. CtrlASO-treated-Df(16)A+/–males: n=5, Emc10ASO-treated-Df(16)A+/–males: n=4, CtrlASO-treated WT males: n=4, and Emc10ASO-treated-WT males: n=4. (E–F) ASO-mediated behavioral rescue of SM deficit in Df(16)A+/-mice. (E) CtrlASO-treated Df(16)A+/-mice show a robust SM deficit compared to CtrlASO-treated WT mice as indicated by the significant difference in trial 2 interaction time upon reintroduction of a familiar juvenile mouse [three-way ANOVA for Trial X Genotype X Treatment Interaction matching by trial: F (1, 38)=9.393 p=0.0040; post hoc Tukey, p=0.0012]. A reduction in trial 2 interaction time indicates rescue of the SM deficit in Emc10ASO-treated Df(16)A+/-compared to CtrlASO-treated Df(16)A+/-mice (post hoc Tukey, p=0.0114). (F) A negative difference score (trial 1- trial 2) confirms the SM deficit in CtrlASO-treated adult Df(16)A+/-mice compared to WT littermates two-way ANOVA for Genotype X Treatment interaction: F (1, 38)=9.369, p=0.0040; post hoc Tukey, p=0.0002. Increase in the difference score of Df(16)A+/-mice in the Emc10ASO- vs CtrlASO- treated group demonstrates SM rescue (post hoc Tukey, p=0.0004). CtrlASO-treated WT mice: n=9 (5 males, 4 females), CtrlASO-treated Df(16)A+/ mice: n=11 (5 males, 6 females), Emc10ASO-treated WT mice: n=9 (5 males, 4 females), and Emc10ASO-treated Df(16)A+/ mice: n=13 (7 males, 6 females). Data are presented as mean ± SEM, *p<0.05; **p<0.01; ***p<0.001.
Figure 4—figure supplement 1
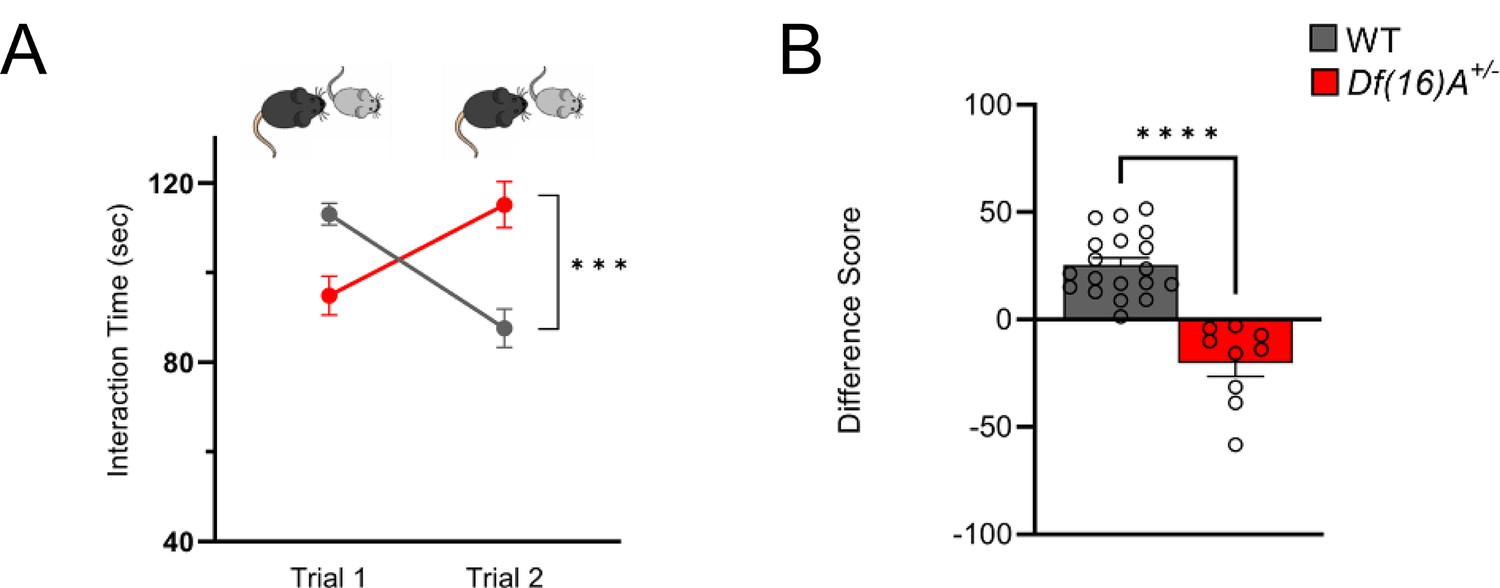
Social memory is impaired in juvenile Df(16)A+/−mice.
(A) Three-week-old juvenile Df(16)A+/-mice show a robust SM deficit compared to WT mice as indicated by the significant difference in trial 2 interaction time upon reintroduction of a familiar juvenile mouse [two-way ANOVA for Trial X Genotype Interaction matching by trial: F (1, 52)=28.76 p<0.0001; post hoc Tukey, p=0.0002]. (B) A negative difference score (trial 1- trial 2) confirms the SM deficit in juvenile Df(16)A+/-mice compared to WT littermates [unpaired two-tailed t-test]. WT mice pairs: n=19 (8 males, 11 females), Df(16)A+/-mice pairs: n=9 (7 males, 2 females). Data are presented as mean ± SEM, ***p<0.001; ****p<0.0001.
Figure 4—figure supplement 2
Genetic restoration of Emc10 levels in adulthood rescues SM performance in Df(16)A+/–mice.
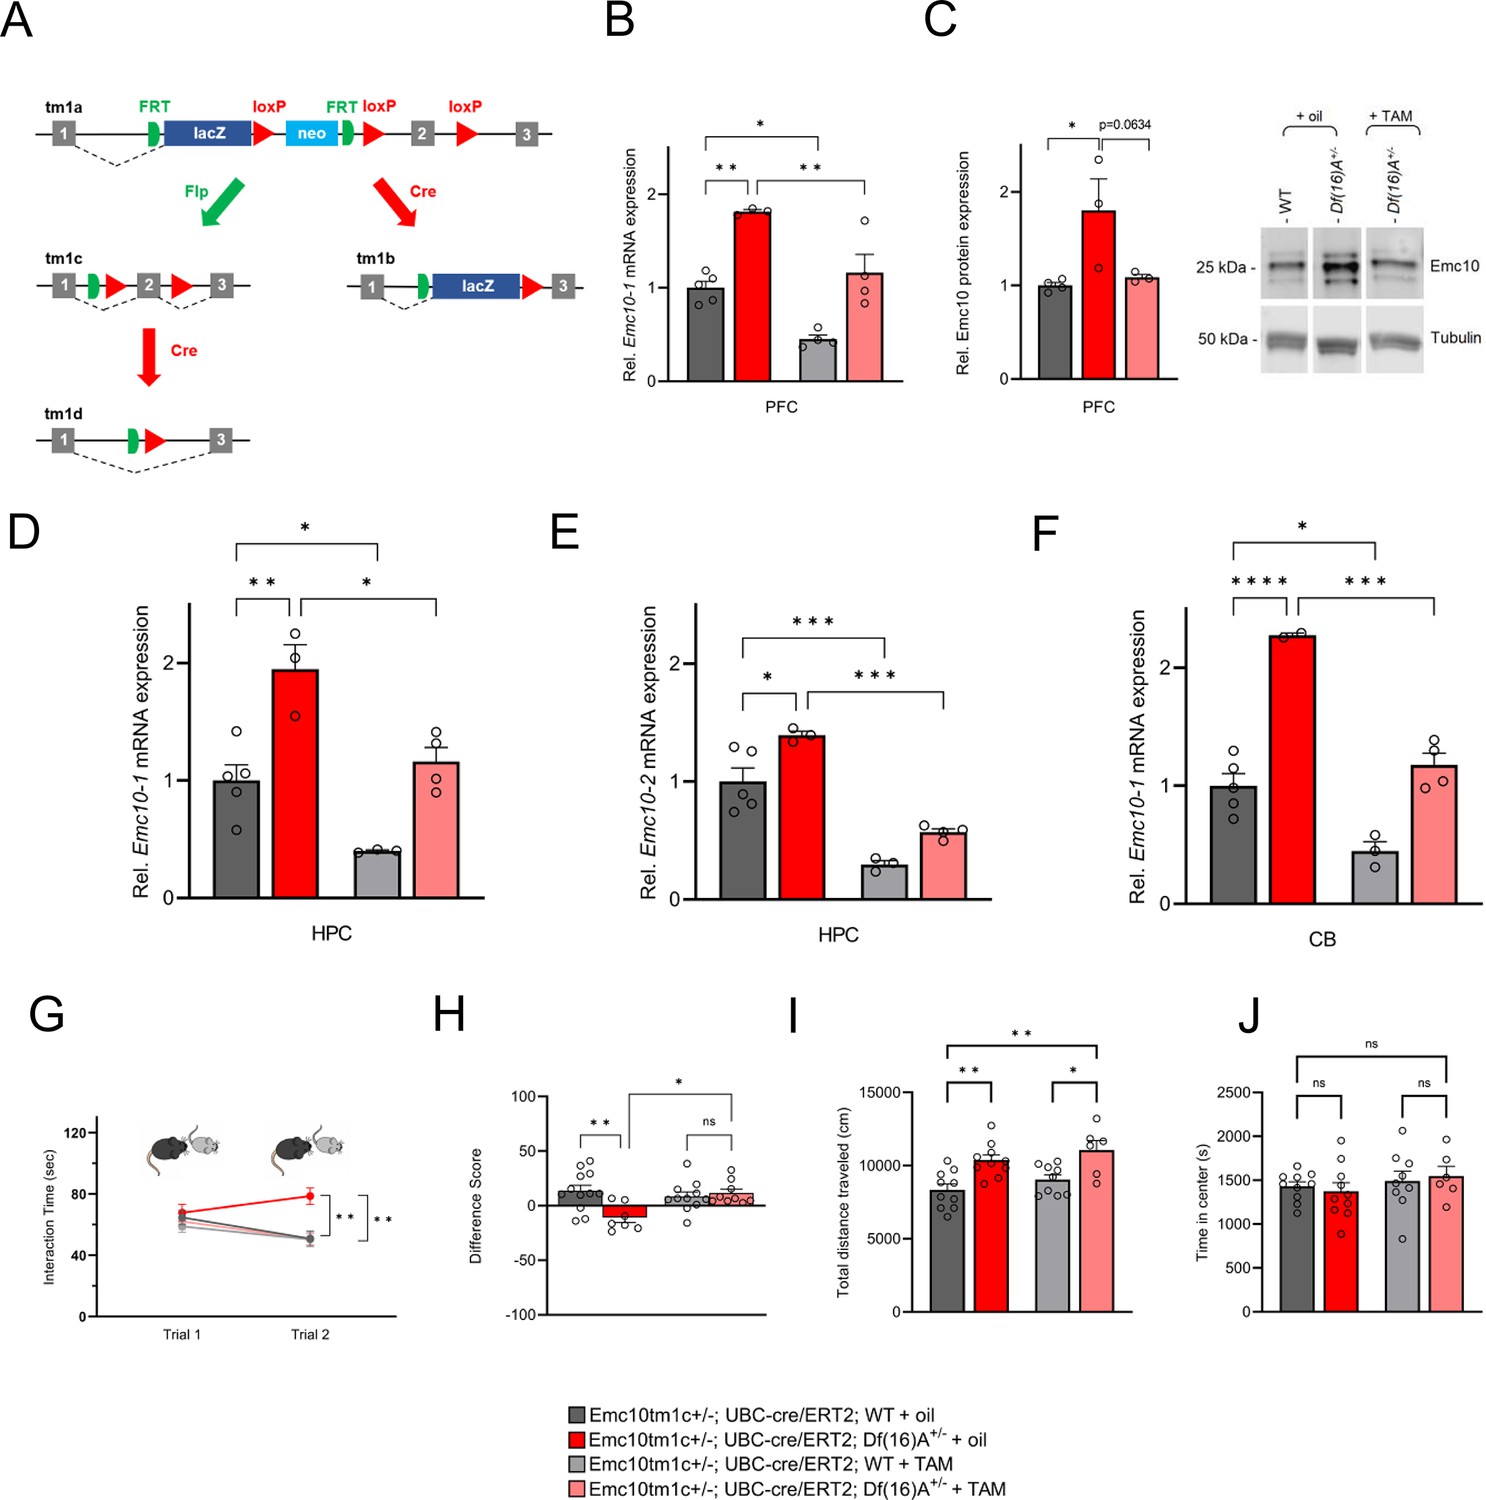
(A) Emc10 ‘knockout-first’ conditional allele. The ‘knockout-first’ allele (tm1a) contains an IRES:lacZ trapping cassette and a floxed promoter-driven neo cassette inserted into the intron of Emc10 gene, disrupting gene function. Flp converts the ‘knockout-first’ allele to a conditional allele (tm1c), restoring gene activity. Cre deletes the promoter-driven selection cassette and floxed exon of the tm1a allele to generate a lacZ-tagged allele (tm1b) or deletes the floxed exon of the tm1c allele to generate a frameshift mutation (tm1d), triggering NMD of the deleted transcript. (B) Expression levels of Emc10-1 mRNA transcript in PFC of Emc10tm1c+/-; UBC-cre/ERT2; Df(16)A+/+ and Emc10tm1c+/-; UBC-cre/ERT2; Df(16)A+/- mice [referred to as WT and Df(16)A+/-] following adult TAM treatment. qRT-PCR analysis shows TAM-mediated normalization of Emc10-1 mRNA levels in the PFC of Df(16)+/- mice. Significant upregulation of Emc10-1 mRNA expression level seen in corn oil-treated Df(16)A+/-compared to corn oil-treated WT mice [one-way ANOVA, F (3, 12)=22.58, p<0.0001; post hoc Tukey, p=0.0013]. Following TAM treatment, Emc10-1 expression is normalized to near WT levels in TAM-treated Df(16)A+/-compared to corn oil-treated Df(16)A+/-mice (post hoc Tukey, p=0.0098). Emc10-1 reduction is also observed in TAM-treated WT compared to corn oil-treated WT mice (post hoc Tukey, p=0.0131). Corn oil-treated WT mice: n=5, corn oil-treated Df(16)A+/-mice: n=3, TAM-treated WT mice: n=4, and TAM-treated Df(16)A+/-mice: n=4. (C) Emc10 protein levels in PFC of WT and Df(16)A+/- mice following adult TAM treatment. Left panel: Emc10 protein levels are significantly elevated in corn oil-treated Df(16)A+- compared to corn oil-treated WT mice [one-way ANOVA, F (2, 7)=6.216, p=0.0281, post hoc Tukey, p=0.0300]. Emc10 protein level is reduced in TAM-treated Df(16)A+/-compared to corn oil-treated Df(16)A+/-mice (post hoc Tukey, p=0.0634). Corn oil-treated WT mice: n=4, corn oil-treated Df(16)A+/-mice: n=3, TAM-treated Df(16)A+/-mice: n=3. Right panel: Representative western blot. Tubulin was used as loading control. (D–E) Emc10 mRNA expression levels of both Emc10 isoforms: Emc10-1 (D) and Emc10-2 (E), with or without a TMD, respectively (Xu et al., 2013), as assayed by qRT-PCRs in the HPC of the Emc10tm1c+/-; UBC-cre/ERT2; Df(16)A+/+ and Emc10tm1c+/-; UBC-cre/ERT2; Df(16)A+/- mice [referred to as WT and Df(16)A+/-] following adult TAM treatment. (D) qRT-PCR analysis shows TAM-mediated restoration of Emc10-1 mRNA levels in the HPC of Df(16)A+/-mice. Significant upregulation of Emc10-1 mRNA expression level seen in corn oil-treated Df(16)A+/-compared to corn oil-treated WT mice [one-way ANOVA, F (3, 11)=16.77, p<0.001; post hoc Tukey, p=0.0027]. Following TAM treatment, Emc10-1 expression is restored to near WT levels in Df(16)A+/-compared to corn oil-treated Df(16)A+/-mice (post hoc Tukey, p=0.0132). Emc10-1 reduction is also observed in TAM-treated WT compared to corn oil-treated WT mice (post hoc Tukey, p=0.0485). (E) qRT-PCR analysis shows TAM-mediated restoration of Emc10-2 mRNA levels in the HPC of Df(16)A+/-mice. Significant upregulation of Emc10-2 mRNA expression level seen in corn oil-treated Df(16)A+/-compared to corn oil-treated WT mice [one-way ANOVA, F (3, 11)=28.28, p<0.0001; post hoc Tukey, p=0.0284]. Following TAM treatment, Emc10-2 expression is restored to near WT levels in Df(16)A+/-compared to corn oil-treated Df(16)A+/-mice (post hoc Tukey, p=0.0002). Emc10-2 reduction is also observed in TAM-treated WT compared to corn oil-treated WT mice (post hoc Tukey, p=0.0005). Corn oil-treated WT mice: n=5, corn oil-treated Df(16)A+/-mice: n=3, TAM-treated WT mice: n=3, and TAM-treated Df(16)A+/-mice: n=4. (F) Expression levels of Emc10-1 mRNA transcript in cerebellum (CB) of WT and Df(16)A+/- mice following adult TAM treatment. qRT-PCR analysis shows TAM-mediated normalization of Emc10-1 mRNA levels in the PFC of Df(16)A+/-mice. Significant upregulation of Emc10-1 mRNA expression level seen in corn oil-treated Df(16)A+/-compared to corn oil-treated WT mice [one-way ANOVA, F (3, 10)=37.43, p<0.0001; post hoc Tukey, p<0.0001]. Following TAM treatment, Emc10-1 expression is normalized to WT levels in TAM-treated Df(16)A+/-compared to corn oil-treated Df(16)A+/-mice (post hoc Tukey, p=0.0003). Emc10-1 downregulation is also observed in TAM-treated WT compared to corn-oil-treated WT mice (post hoc Tukey, p=0.0122). Corn oil-treated WT mice: n=5, corn oil-treated Df(16)A+/-mice: n=2, TAM-treated WT mice: n=3, and TAM-treated Df(16)A+/-mice: n=4. (G) Corn oil-treated Df(16)A+/-mice show a robust SM deficit compared to corn oil-treated WT mice as indicated by the significant difference in trial 2 interaction time upon reintroduction of a familiar juvenile mouse [three-way ANOVA for Trial X Genotype X Treatment Interaction matching by trial: F (1, 35)=8.823 p=0.0053; post hoc Tukey, p=0.0047]. A reduction in trial 2 interaction time indicates rescue of the SM deficit in TAM-treated Df(16)A+/-compared to corn oil-treated Df(16)A+/-mice (post hoc Tukey, p=0.0082). (H) A negative difference score (trial 1- trial 2) confirms the SM deficit in corn oil-treated adult Df(16)A+/-mice compared to WT littermates [two-way ANOVA for Genotype X Treatment interaction: F (1, 35) = 8.823, p=0.0053; post hoc Tukey, p=0.0048]. Increase in the difference score of Df(16)A+/-mice in TAM- vs corn oil-treated group demonstrates rescue of SM performance (post hoc Tukey, p=0.0181). Corn oil-treated WT mice: n=12 (7 males, 5 females), corn oil-treated Df(16)A+/-mice: n=7 (3 males, 4 females), TAM-treated WT mice: n=11 (6 males, 5 females), and TAM-treated Df(16)A+/-mice: n=9 (4 males, 5 females). (I) Tamoxifen (TAM)-mediated Emc10 down-regulation does not rescue hyperactivity in Df(16)A+/−mice in the open field (OF) assay as demonstrated in the total distance traveled. In a 1 hr exposure to a novel OF arena Df(16)A+/−+TAM mice compared with WT +TAM mice remain as hyperactive [one-way ANOVA, F (3, 31)=8.052, p=0.0004; post hoc Tukey, p=0.0222] as Df(16)A+/−+oil mice compared with WT +oil mice [one-way ANOVA, F (3, 31)=8.052, p=0.0004; post hoc Tukey, p=0.0047]. (J) The time spent in the center of the open field did not differ significantly between animal groups, suggesting an absence of an anxiety-related phenotype. Corn-oil treated WT mice: n=10 (8 males, 2 females), TAM-treated WT mice: n=9 (4 males, 5 females), corn-oil treated Df(16)A+/−mice: n=10 (6 males, 4 females), TAM-treated Df(16)A+/−mice: n=6 (3 males, 3 females). Data are presented as mean ± SEM, *p<0.05, **p<0.01, ***p<0.001, ****pP<0.0001.
-
Figure 4—figure supplement 2—source data 1
PDF file containing original western blots for Figure 4—figure supplement 2C, indicating the relevant bands.
- https://cdn.elifesciences.org/articles/103328/elife-103328-fig4-figsupp2-data1-v1.pdf
-
Figure 4—figure supplement 2—source data 2
Original files for western blot analysis used in Figure 4—figure supplement 2C.
- https://cdn.elifesciences.org/articles/103328/elife-103328-fig4-figsupp2-data2-v1.zip
Figure 4—figure supplement 3
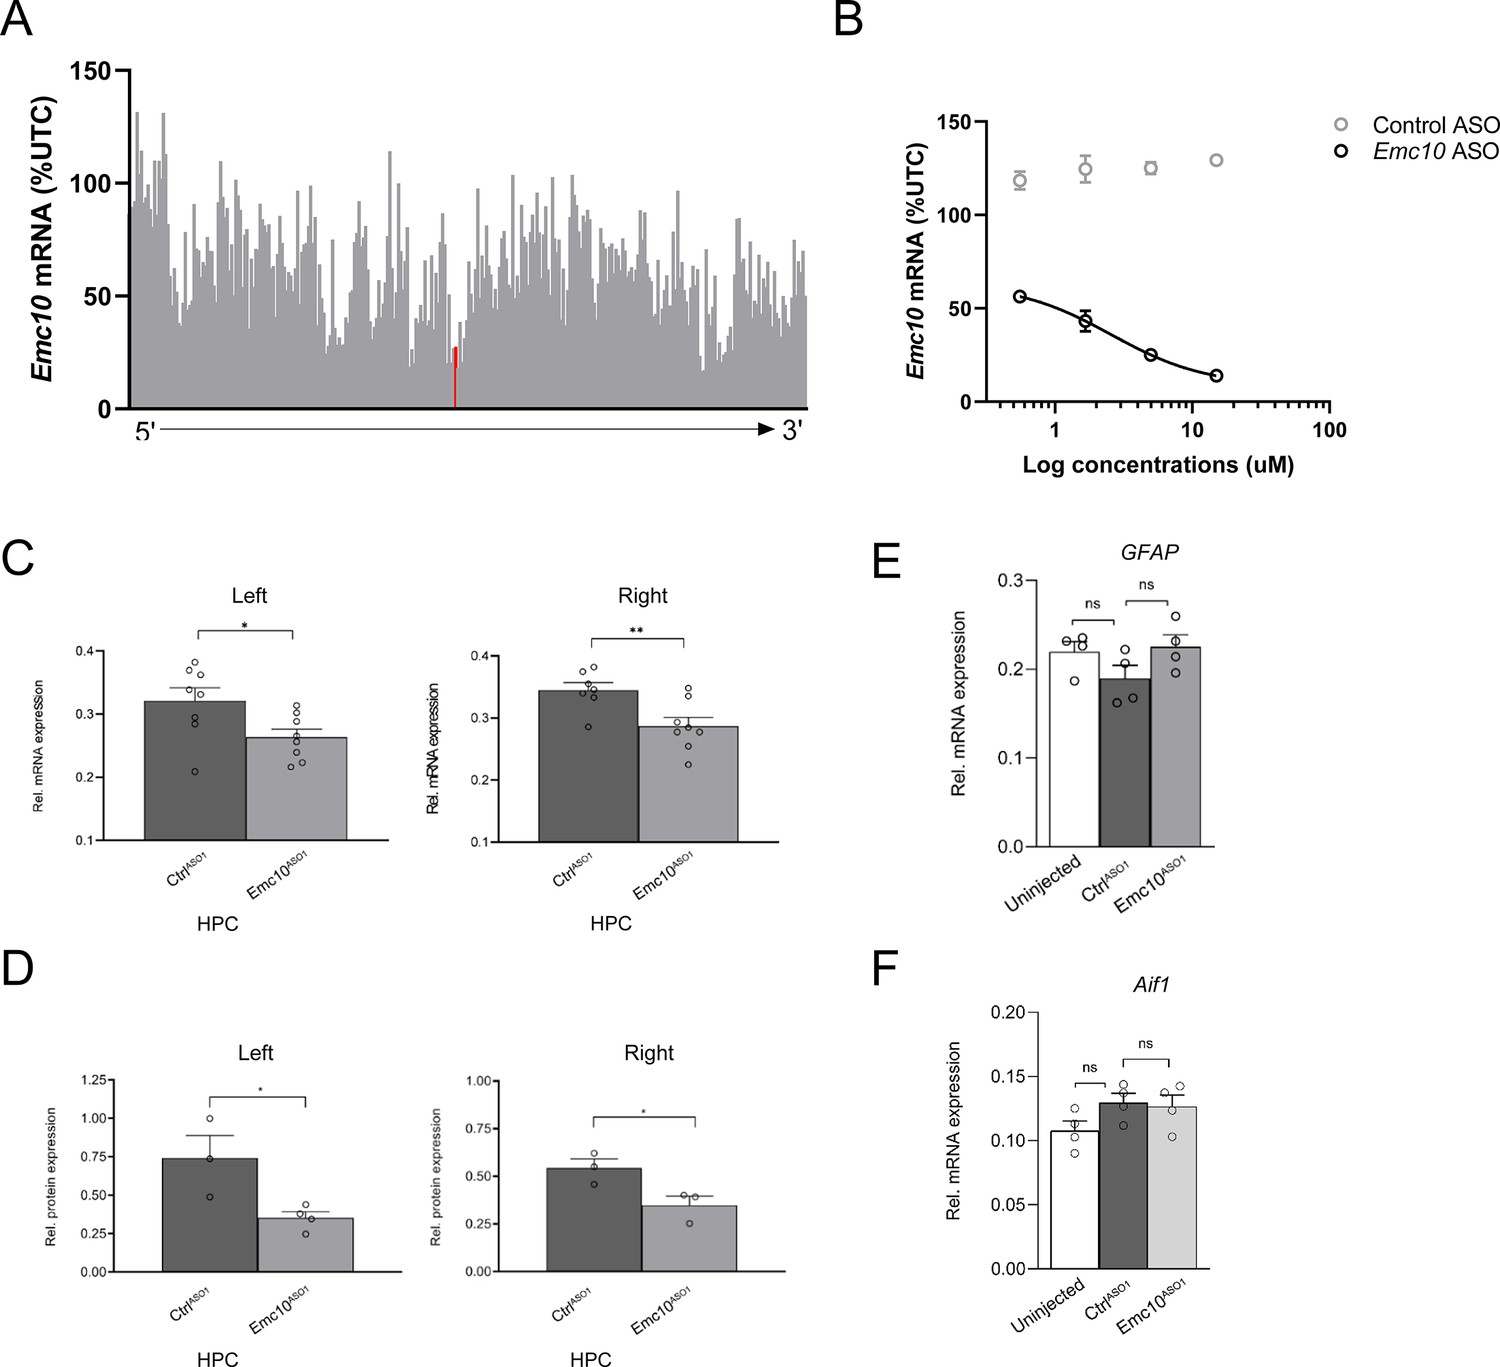
In vitro and in vivo screening of designed ASOs.
(A) Emc10 mRNA levels in 4T1 cells following 7 µM treatment with Emc10 ASOs, data normalized to untransfected controls (UTC), and lead Emc10ASO1 noted in red. (B) Dose-dependent reductions in Emc10 mRNA levels in 4T1 cells following treatment with lead Emc10ASO1, but not with a negative controlASO1. Data expressed at % UTC. (C) qRT-PCR analysis shows bilateral reduction of Emc10 mRNA expression levels in Emc10ASO1 compared to the CtrlASO1-treated WT mice in the left (unpaired two-tailed t-test, p=0.0285; CtrlASO1-treated-WT male mice: n=8, Emc10ASO1-treated-WT male mice: n=8) and the right HPC (unpaired two tailed t-test, p=0.0087; CtrlASO1-treated-WT mice: n=7, and Emc10ASO1-treated-WT mice: n=8). (D) Western blot analysis shows bilateral reduction of Emc10 protein expression in the left (p=0.0321; unpaired two-tailed t-test; CtrlASO1-treated- WT male mice: n=3, Emc10ASO1-treated-WT male mice: n=4) and right HPC (p=0.0448; unpaired two-tailed t-test; CtrlASO1 treated-WT male mice: n=3, Emc10ASO1-treated-WT male mice: n=3). (E) mRNA expression analysis of astroglial (Gfap, left panel; p=0.177; one-way ANOVA) and microglial (Aif1, right panel; p=0.1527; one-way ANOVA) activation revealed no significant differences across groups. Untreated male mice; n=4, CtrlASO1 treated-WT male mice: n=4, Emc10ASO1-treated-WT male mice: n=4.
-
Figure 4—figure supplement 3—source data 1
PDF file containing original western blots for Figure 4—figure supplement 3D, indicating the relevant bands.
- https://cdn.elifesciences.org/articles/103328/elife-103328-fig4-figsupp3-data1-v1.pdf
-
Figure 4—figure supplement 3—source data 2
Original files for western blot analysis used in Figure 4—figure supplement 3D.
- https://cdn.elifesciences.org/articles/103328/elife-103328-fig4-figsupp3-data2-v1.zip
Figure 4—figure supplement 4
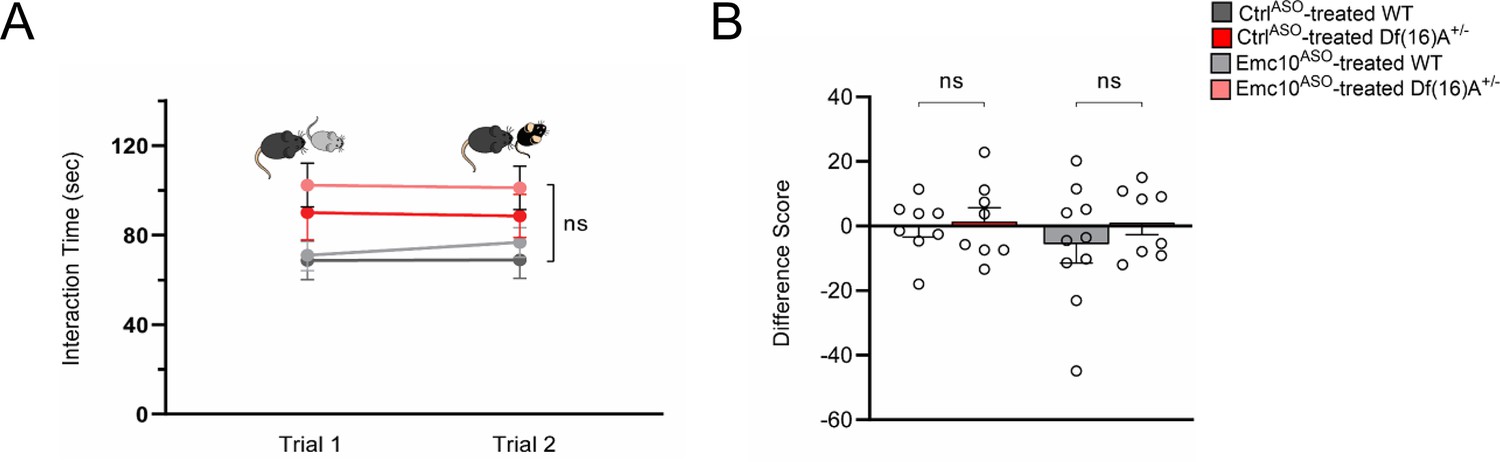
Social memory interaction task with novel stimulus mice.
(A–B) Control experiment for direct interaction test using two different novel mice in trials 1 and 2. (A) No significant difference in SM trials is observed across groups upon reintroduction of a novel juvenile mouse indicating SM rescue is not due to task fatigue [three-way ANOVA for Trial X Genotype X Treatment matching by trial; F (1, 30)=0.3001, p=0.5878]. (B) No significant changes across groups in SM difference score upon reintroduction of a novel juvenile mouse [two-way ANOVA for Genotype X Treatment interaction; F (1, 30)=0.3001 p=0.5878]. CtrlASO-treated WT: n=8 (4 males, 4 females), Emc10ASO-treated WT: n=10 (4 males, 6 females), n=8 CtrlASO-treated Df(16)A+/ (3 males, 5 females) and Emc10ASO-treated Df(16)A+/: n=8 (4 males, 4 females). Data are presented as mean ± SEM, *p<0.05; ***p<0.001.
Figure 5 with 2 supplements
Restoration of cognitive function in Df(16)A+/-mice using an independent Emc10 ASO.
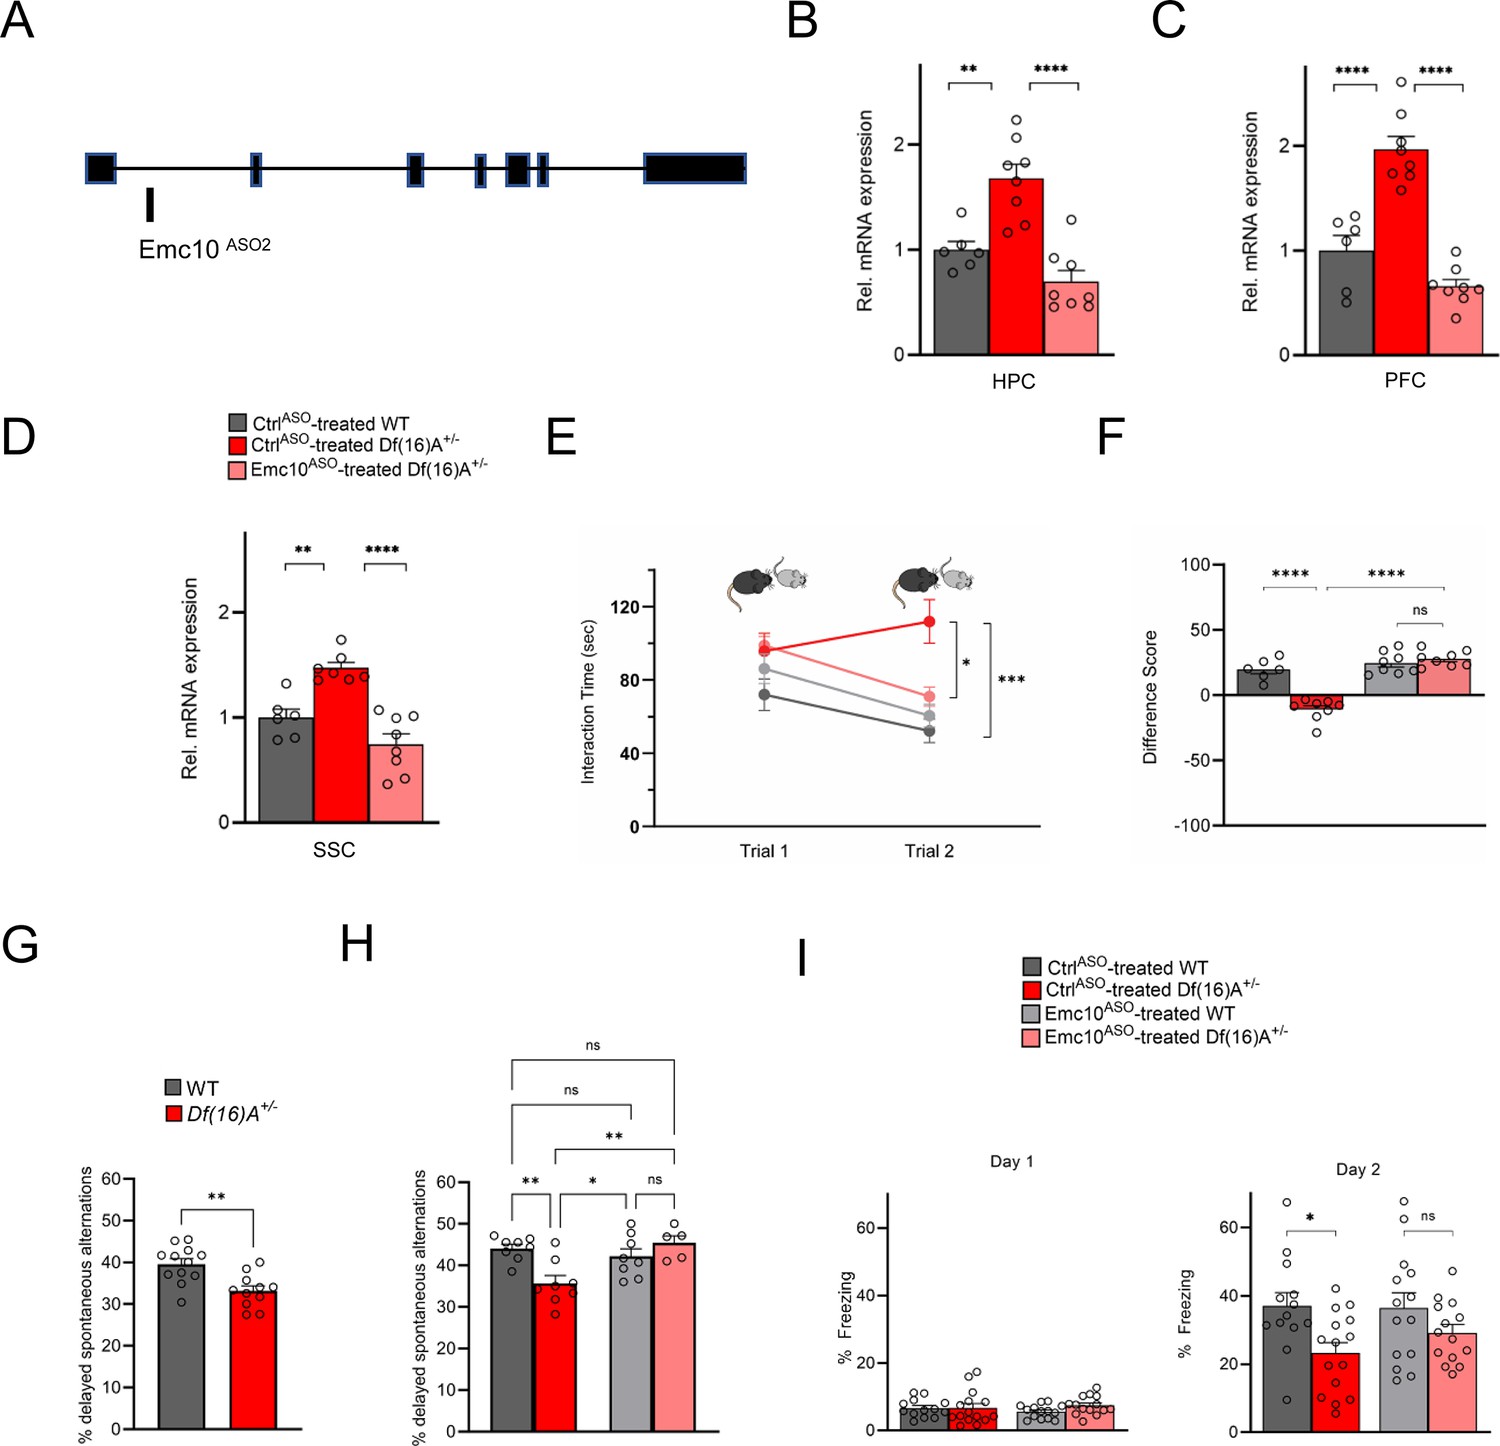
(A) Mouse Emc10 gene map plot (ENSMUST00000118808) showing the Emc10ASO2 target site. (B) qRT-PCR analysis shows significant upregulation of Emc10 mRNA expression levels in the HPC of CtrlASO-treated-Df(16)A+/-compared to WT mice [one-way ANOVA, F (2, 19)=20.92, p<0.0001; post hoc Tukey, p=0.0018]. Following ASO treatment, Emc10 expression is normalized to WT levels in Emc10ASO-treated-Df(16)A+/–compared to CtrlASO-treated-Df(16)A+/-mice (post hoc Tukey, p=<0.0001). (C) qRT-PCR analysis shows a significant upregulation of Emc10 mRNA expression levels in the PFC of CtrlASO-treated-Df(16)A+/-compared to WT mice [one-way ANOVA, F (2, 19)=40.75, p=<0.0001; post hoc Tukey, p=<0.0001]. Following ASO treatment, Emc10 expression is normalized to WT levels in the Emc10ASO-treated-Df(16)A+/–compared to CtrlASO-treated-Df(16)A+/-mice (post hoc Tukey, p=<0.0001). CtrlASO-treated WT male mice: n=6, CtrlASO-treated Df(16)A+/ male mice: n=8, and Emc10ASO-treated Df(16)A+/ mice: n=8. (D) qRT-PCR analysis shows a significant upregulation of Emc10 mRNA expression levels in Somatosensory Cortex (SSC) of CtrlASO-treated-Df(16)A+/-compared to WT mice [one-way ANOVA, F (2, 18)=21.53, p=<0.0001; post hoc Tukey, p=<0.0026]. Following ASO treatment, Emc10 expression is normalized to WT levels in Emc10ASO-treated-Df(16)A+/–compared to CtrlASO-treated-Df(16)A+/-mice (post hoc Tukey, p=<0.0001). CtrlASO-treated WT mice: n=6, CtrlASO-treated Df(16)A+/ mice: n=7, and Emc10ASO-treated Df(16)A+/ mice: n=8. (E) CtrlASO-treated Df(16)A+/-mice show a robust SM deficit compared to CtrlASO-treated WT mice as indicated by the significant difference in trial 2 interaction time upon reintroduction of a familiar juvenile mouse [three-way ANOVA for Trial X Genotype X Treatment Interaction matching by trial: F (1, 26) = 35.74 p<0.0001; post hoc Tukey, p=0.0004]. A reduction in trial 2 interaction time indicates rescue of the SM deficit in Emc10ASO-treated Df(16)A+/-compared to CtrlASO-treated Df(16)A+/-mice (post hoc Tukey, p=0.0255). [CtrlASO-treated WT male mice: n=6, CtrlASO-treated Df(16)A+/ mice: n=8, Emc10ASO-treated WT mice: n=8, and Emc10ASO-treated Df(16)A+/ mice: n=8]. (F) A negative difference score (trial 1- trial 2) confirms the SM deficit in CtrlASO-treated adult Df(16)A+/-mice compared to WT littermates two-way ANOVA for Genotype X Treatment interaction F (1, 26)=35.74, p<0.0001; post hoc Tukey, p<0.0001. Increase in the difference score of Df(16)A+/-mice in the Emc10ASO- vs CtrlASO- treated group demonstrates SM rescue (post hoc Tukey, p<0.0001). (G) Y-maze task displayed memory impairments in adult Df(16)A+/-mice. Impaired short-term spatial memory in Df(16)A+/-mice shown by the reduced amount of delayed alternations (%) after a delay of 1 hr (P=0.0015). WT mice: n=12, Df(16)A+/ mice: n=11. (H) Deficits in short-term spatial memory in the Y-maze task in CtrlASO-treated adult Df(16)A+/-mice can be rescued in Emc10ASO-treated Df(16)A+/-mice (one-way ANOVA, F (3, 25)=6.727, p=0.0018, post hoc Tukey, p=0.0042) after 3 weeks of ASO-injection. CtrlASO-treated WT mice: n=8, Emc10ASO-treated WT mice: n=8, CtrlASO-treated Df(16)A+/ mice: n=8 and Emc10ASO-treated DfA+/ mice: n=5. (I) In a contextual fear memory assay, minimal freezing is observed on day 1 (left) with no significant changes across groups [two-way ANOVA for Genotype X Treatment interaction: F (1, 52)=1.003, p=0.3211]. In the CtrlASO-treated group, Df(16)A+/- mice show the expected contextual fear memory deficit compared to WT mice (right panel) one-way ANOVA, F (3, 52)=3.524 p=0.0212; post hoc Tukey, 0.0384. Emc10ASO treatment was not sufficient to fully rescue the learning deficit in Df(16)A+/–mice compared to CtrlASO-treated WT levels (post hoc Tukey, p=0.1045). However, there is increased freezing in Df(16)A+/-mice injected with Emc10ASO- versus CtrlASO-treated group, which results in a non-significant difference in freezing between Emc10ASO-treated DfA+/-and WT mice (two-way ANOVA for genotype x treatment F (1, 52)=0.8524, p=0.3601; post hoc Tukey, p=0.4676) indicating a partial rescue of the contextual fear memory deficit. CtrlASO-treated WT: n=13 (9 males, 4 females), Emc10ASO-treated WT mice: n=14 (10 males, 4 females), CtrlASO-treated Df(16)A+/ mice: n=15 (11 males, 4 females) and Emc10ASO-treated Df(16)A+/ mice: n=14 (10 males, 4 females). Unpaired students t-test, one- two- or three-way ANOVA as indicated. Data are presented as mean ± SEM, *p<0.05, **p<0.01, ***p<0.01, ****p<0.0001.
Figure 5—figure supplement 1
In vivo post-injection screening of designed ASOs.
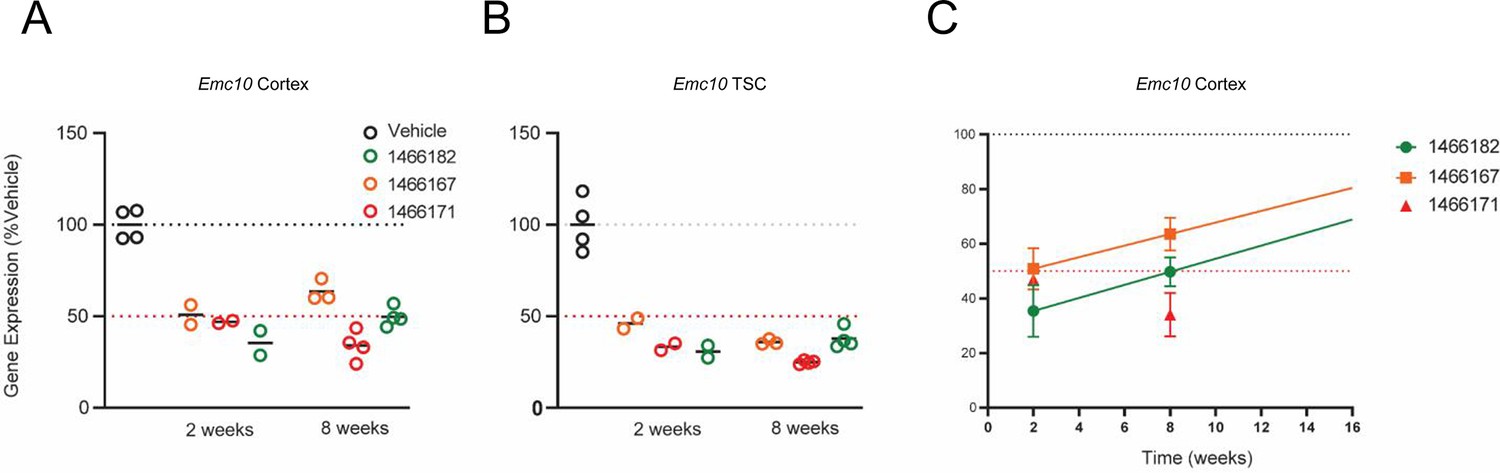
(A–C) In vivo efficacy of selected ASOs in suppressing the levels of Emc10 mRNA in the cortex of WT mice at 2- and 8 weeks post-injection. Three ASOs were selected from an initial screen for the analysis shown here, based on their pharmacological efficacy. 700 µg of ASOs were injected into the right lateral ventricle of C57Bl/6 mice. Depicted is their efficacy in suppressing the levels of Emc10 mRNA in the (A) retrosplenial cortex (cortex) and (B) thoracic spinal cord (TSC) at both 2- and 8 weeks following a single bolus dose. (C) Calculation of the approximate time to normal expression (~T100%) from the 2- and 8-week Emc10 expression data.~T100% for Emc10 #1466182 ASO is 26 weeks but this remains to be empirically determined.
Figure 5—figure supplement 2
Emc10ASO2 reduces Emc10 expression in adult Df(16)A+/-mice.
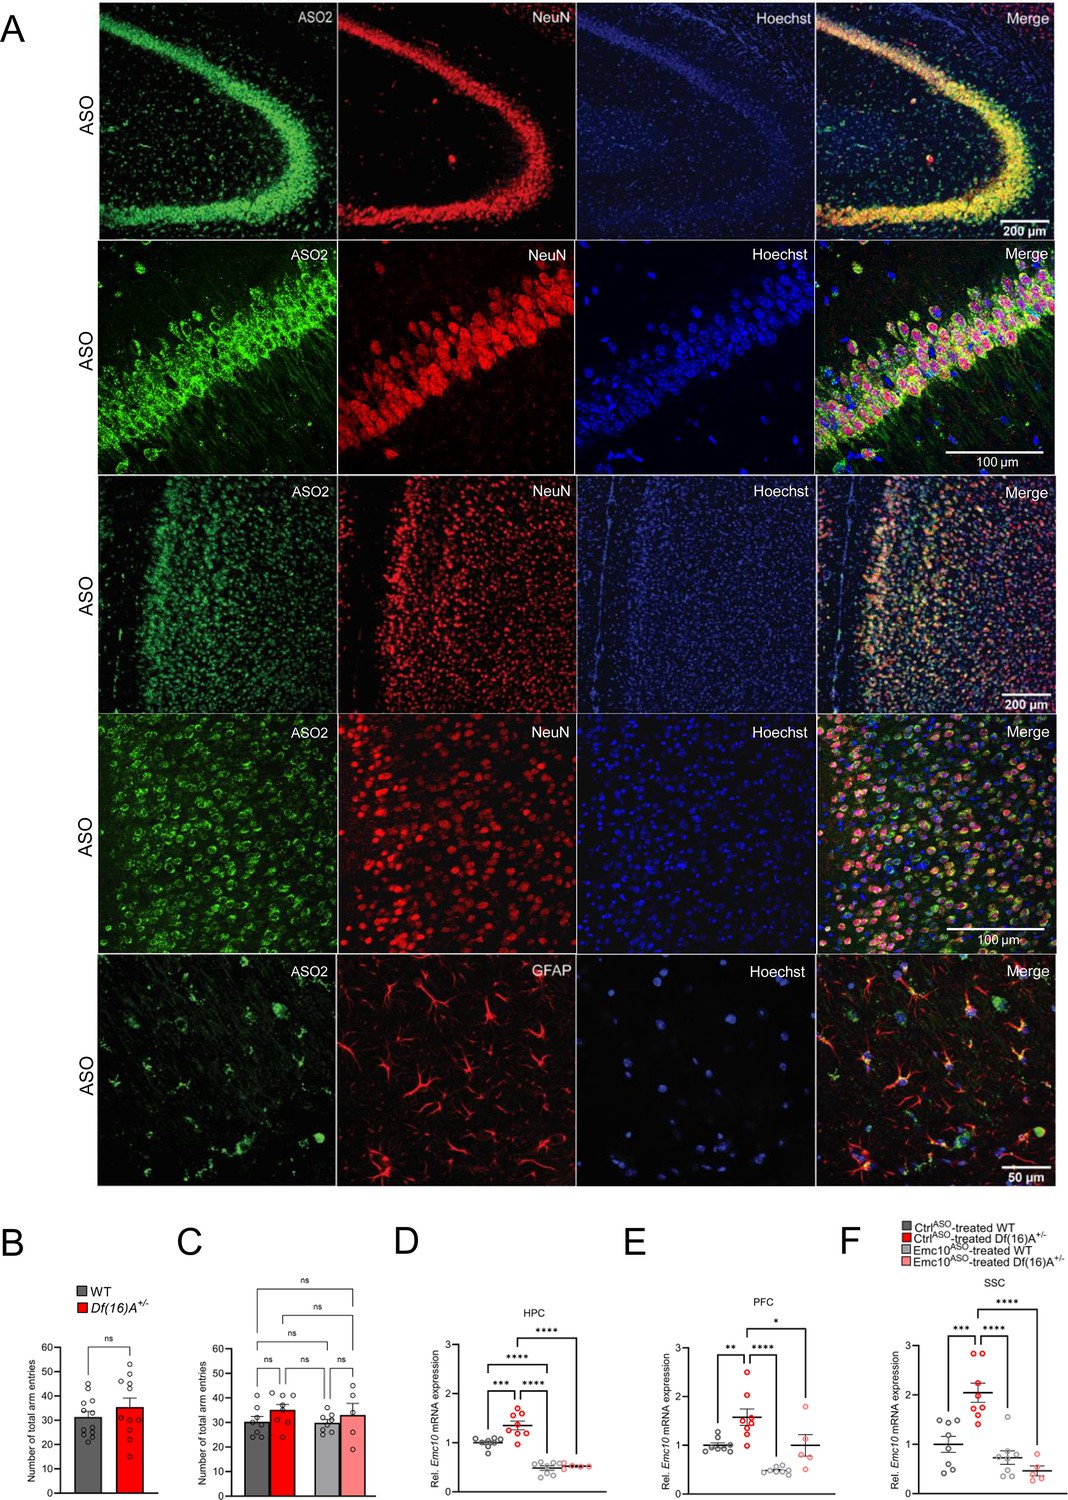
(A) Mouse brains collected 3 weeks post ICV injection were stained with an ASO antibody (green) and counterstained with neuronal marker NeuN (red) and nuclear stain Hoechst (blue). A robust and uniform ASO2 diffusion is observed in the HPC (first and second panels) and PFC (third and fourth panels). Overlap with NeuN confirms its presence in neuronal cells. The ASO signal extensively colocalizes with NeuN, demonstrating robust ASO uptake in neurons. High-magnification images (panels 2 and 4) showing an almost complete overlap (97%) between ASO and NeuN signals. Accumulation in glial cells in PFC, specifically GFAP-labeled astrocytes is also observed (bottom panel). Images are taken with 10 x and 20 x, 40 x objectives. (B–C) Y-maze task in adult male mice. (B) Locomotor activity is unchanged between WT and Df(16)A+/ mice (p=0.8844) reflected by the number of total arm entries in the Y-maze task. WT mice: n=12, Df(16)A+/ mice: n=11. (C) No significant changes in the number of total arm entries between the groups after 3 weeks of ASO-injection, indicating normal locomotor activity in this task. CtrlASO-treated male WT mice: n=8, Emc10ASO-treated male WT mice: n=8, CtrlASO-treated male Df(16)A+/ mice: n=8 and Emc10ASO-treated male Df(16)A+/ mice: n=5. (D–F) ASO-mediated inhibition of Emc10 in different brain regions of Df(16)A+/-mice used in the Y-maze assay after 3 weeks of injection. (D) qRT-PCR analysis shows significant upregulation of Emc10 mRNA expression levels in the HPC of CtrlASO-treated-Df(16)A+/-compared to WT mice [one-way ANOVA, F (3, 25)=50.42, p<0.0001; post hoc Tukey, p=0.0009]. Following ASO treatment, Emc10 expression is normalized to WT levels in Emc10ASO treated-Df(16)A+/–compared to CtrlASO-treated-Df(16)A+/-mice (post hoc Tukey, p=<0.0001). (E) qRT-PCR analysis shows a significant upregulation of Emc10 mRNA expression levels in the PFC of CtrlASO treated-Df(16)A+/-compared to WT mice [one-way ANOVA, F (3, 25)=14.45, p=<0.0001; post hoc Tukey, p=0.0097]. Following ASO treatment, Emc10 expression is normalized to WT levels in the Emc10ASO-treated-Df(16)A+/–compared to CtrlASO treated-Df(16)A+/-mice (post hoc Tukey, p=0.0258). (F) qRT-PCR analysis shows a significant upregulation of Emc10 mRNA expression levels in Somatosensory Cortex (SSC) of CtrlASO-treated-Df(16)A+/-compared to WT mice [one-way ANOVA, F (3, 25)=17.91, p=<0.0001; post hoc Tukey, p<0.0004]. Following ASO treatment, Emc10 expression is normalized to WT levels in Emc10ASO-treated-Df(16)A+/–compared to CtrlASO-treated-Df(16)A+/-mice (post hoc Tukey, p=<0.0001). CtrlASO-treated WT male mice: n=8, CtrlASO-treated Df(16)A+/ male mice: n=8, Emc10ASO-treated WT male mice: n=5 and Emc10ASO-treated Df(16)A+/ male mice: n=5. (G–H) Y-maze task in adult male mice: No significant changes were observed in the total number of arm entries between groups, indicating normal locomotor activity in this task at both 4 weeks (G) and 9 weeks (H) following ASO injection. CtrlASO-treated WT: n=9, Emc10ASO treated WT mice: n=8, CtrlASO-treated Df(16)A+/ mice: n=8 and Emc10ASO-treated Df(16)A+/ mice: n=8. Unpaired students t-test or one-way ANOVA as indicated. Data are presented as mean ± SEM, *p<0.05, **p<0.01, ***p<0.01, ****p<0.0001.
Figure 6 with 1 supplement
Sustained rescue of cognitive deficits in Df(16)A+/-mice following ASO administration.
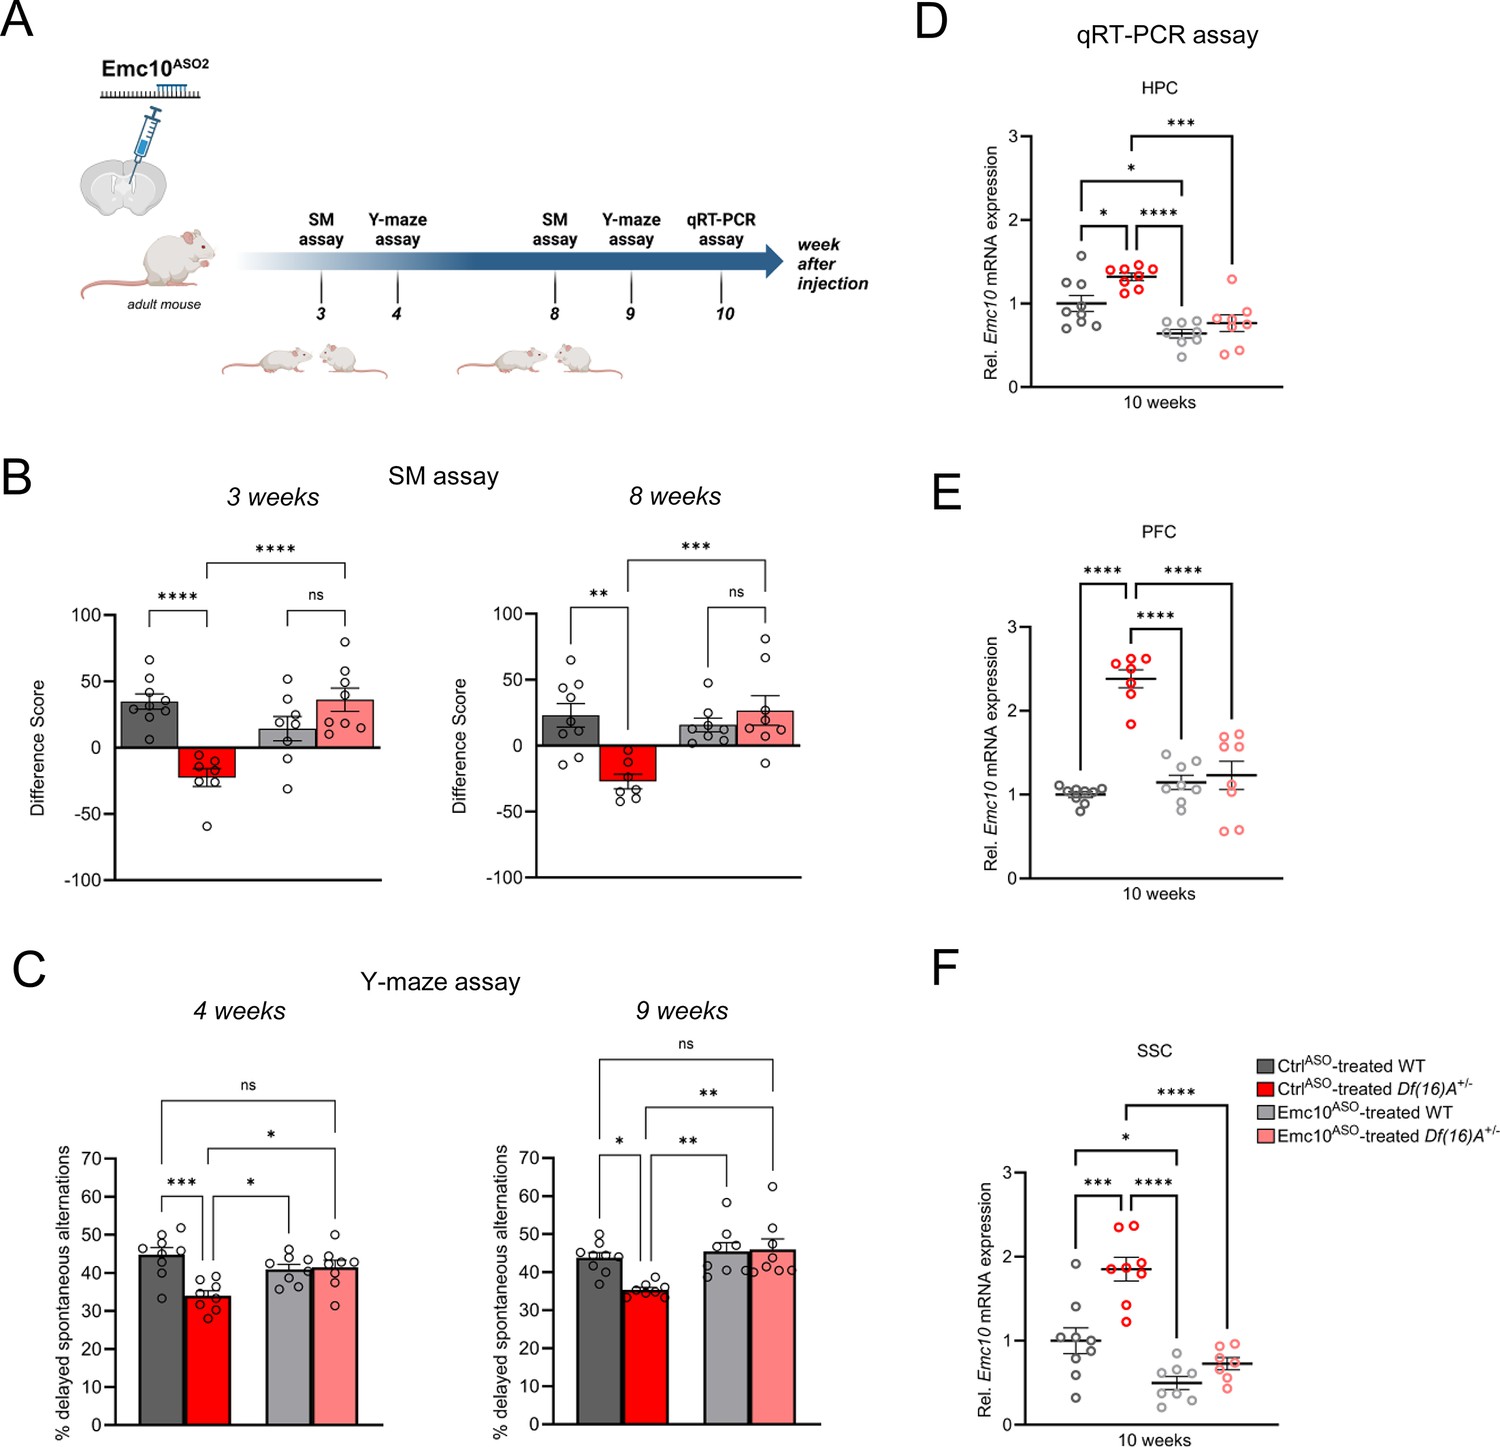
(A) Experimental timeline of Emc10ASO2-treated adult Df(16)A+/-mice to determine long-term rescue effect of Emc10 de-repression. This panel was created using BioRender.com. (B–C) Sustained ASO effect on behavioral rescue of Emc10ASO-treated Df(16)A+/-mice in HPC- and PFC-dependent tasks. (B) Rescue of SM deficit in Df(16)A+/-mice after 3- and 8 weeks of ASO injection. After 3 weeks of ASO treatment (left panel), a negative difference score (trial 1- trial 2) confirms the SM deficit in CtrlASO-treated adult Df(16)A+/-mice compared to WT littermates two-way ANOVA for Genotype X Treatment interaction F (1, 28)=26.20, p<0.0001; post hoc Tukey, p<0.0001. Increase in the difference score of Df(16)A+/-mice in the Emc10ASO- vs CtrlASO- treated group demonstrates SM rescue (post hoc Tukey, p<0.0001). After 8 weeks of ASO treatment (right panel), a negative difference score (trial 1- trial 2) confirms the SM deficit in CtrlASO-treated adult Df(16)A+/-mice compared to WT littermates two-way ANOVA for Genotype X Treatment interaction F (1, 28)=13.36, p=0.0010; post hoc Tukey, p=0.0012. Increase in the difference score of Df(16)A+/-mice in the Emc10ASO- vs CtrlASO- treated group demonstrates prolonged SM rescue (post hoc Tukey, p=0.0007). CtrlASO-treated WT mice: n=9, CtrlASO-treated Df(16)A+/ mice: n=7, Emc10ASO-treated WT mice: n=8 and Emc10ASO-treated Df(16)A+/ mice: n=8. (C) Y-maze task displayed rescue of memory impairments in adult Df(16)A+/-male mice 4- and 9 weeks after Emc10ASO injection. Deficits in short-term spatial memory shown by the reduced number of delayed alternations (%) in CtrlASO-treated adult Df(16)A+/-mice can be rescued in Emc10ASO-treated Df(16)A+/-mice after 4 weeks of ASO injection (left panel) one-way ANOVA, F (3, 29)=7.585, p=0.0007, post hoc Tukey, p=0.0193. Deficits in short-term spatial memory in CtrlASO-treated adult Df(16)A+/-mice can be rescued in Emc10ASO-treated Df(16)A+/-mice also after 9 weeks of ASO injection (right panel) one-way ANOVA, F (3, 29)=6.547, p=0.0016, post hoc Tukey, p=0.0029. CtrlASO-treated WT mice: n=9, CtrlASO-treated Df(16)A+/ mice: n=8, Emc10ASO-treated WT mice: n=8 and Emc10ASO-treated Df(16)A+/ mice: n=8. (D–F) Sustained Emc10 de-repression after 2 months of Emc10ASO injection. ASO-mediated inhibition of Emc10 in different brain regions of Df(16)A+/-mice after 10 weeks of injection. (D) qRT-PCR analysis shows significant upregulation of Emc10 mRNA expression levels in the HPC of CtrlASO-treated-Df(16)A+/-compared to WT mice one-way ANOVA, F (3, 29)=13.97, p<0.0001; post hoc Tukey, p=0.0331. Following ASO treatment, Emc10 expression is normalized to WT levels in Emc10ASO-treated-Df(16)A+/–compared to CtrlASO-treated-Df(16)A+/-mice (post hoc Tukey, p=<0.0002). CtrlASO-treated WT mice: n=9, CtrlASO-treated Df(16)A+/ mice: n=8, Emc10ASO-treated WT mice: n=8 and Emc10ASO-treated Df(16)A+/ mice: n=8. (E) qRT-PCR analysis shows a significant upregulation of Emc10 mRNA expression levels in the PFC of CtrlASO-treated-Df(16)A+/-compared to WT mice [one-way ANOVA, F (3, 28)=32.47, p<0.0001; post hoc Tukey, p<0.0001]. Following ASO treatment, Emc10 expression is normalized to WT levels in the Emc10ASO treated-Df(16)A+/–compared to CtrlASO treated-Df(16)A+/-mice (post hoc Tukey, P<0.0001). CtrlASO-treated WT mice: n=9, CtrlASO-treated Df(16)A+/ mice: n=7, Emc10ASO-treated WT mice: n=8 and Emc10ASO-treated Df(16)A+/ mice: n=8. (F) qRT-PCR analysis shows a significant upregulation of Emc10 mRNA expression levels in Somatosensory Cortex (SSC) of CtrlASO-treated-Df(16)A+/-compared to WT mice one-way ANOVA, F (3, 28)=23.18, p<0.0001; post hoc Tukey, p=0.0001. Following ASO treatment, Emc10 expression is normalized to WT levels in Emc10ASO treated-Df(16)A+/–compared to CtrlASO treated-Df(16)A+/-mice (post hoc Tukey, p<0.0001). CtrlASO-treated WT mice: n=9, CtrlASO-treated Df(16)A+/ mice: n=8, Emc10ASO-treated WT mice: n=8 and Emc10ASO-treated Df(16)A+/ male mice: n=7. One- or two-way ANOVA as indicated. Data are presented as mean ± SEM, *p<0.05, **p<0.01, ***p<0.01, ****p<0.0001.
Figure 6—figure supplement 1
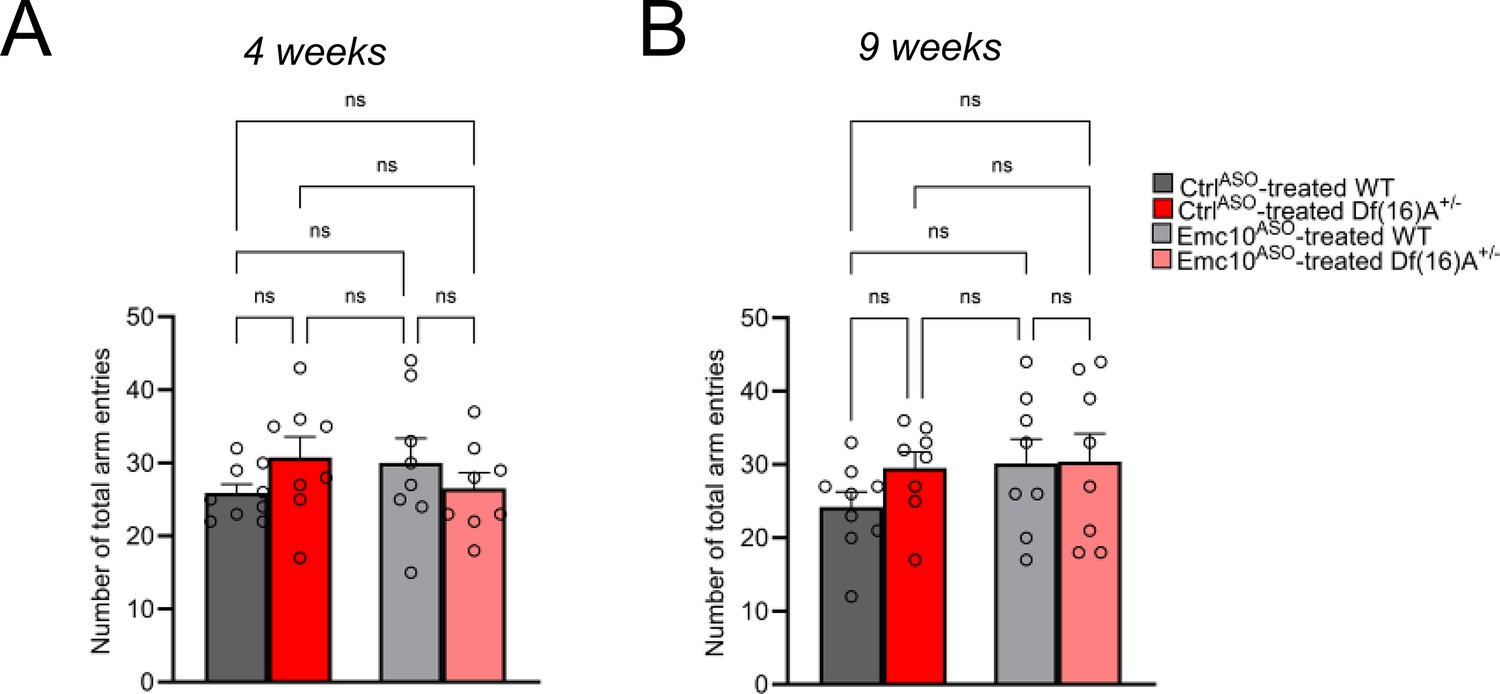
Y-maze task in adult male mice after Emc10ASO2 post-injection.
(A–B) No significant changes were observed in the total number of arm entries between groups, indicating normal locomotor activity in this task at both 4 weeks (A) and 9 weeks (B) following ASO injection. CtrlASO-treated WT: n=9, Emc10ASO-treated WT mice: n=8, CtrlASO-treated Df(16)A+/ mice: n=8 and Emc10ASO-treated Df(16)A+/ mice: n=8. One-way ANOVA as indicated, ns = not significant. Data are presented as mean ± SEM.
Tables
Appendix 1—key resources table
| Reagent type (species) or resource | Designation | Source or reference | Identifiers | Additional information |
|---|---|---|---|---|
| Strain, strain background (Mus musculus) | Df(16)A+/- | Ref (Stark et al., 2008) | N/A | C57BL/6 J background; 1.3 Mb deficiency syntenic to 1.5 Mb human 22q11.2 deletion |
| Strain, strain background (Mus musculus) | Emc10tm1a+/- | MRC Harwell Institute | 2310044h10rik-Tm1a | ‘Knockout-first’ allele; crossed with Flp line |
| Strain, strain background (Mus musculus) | Emc10tm1c+/- | This paper | N/A | Conditional KO via Flp recombination; loxP-flanked WT allele |
| Strain, strain background (Mus musculus) | UBC-Cre/ERT2 | Jackson Laboratory | RRID:IMSR_JAX:008085 | B6.Cg-Ndor1 Tg(UBC-cre/ERT2)1Ejb/2 J; tamoxifen-inducible Cre |
| Strain, strain background (Mus musculus) | Flp mouse line | Jackson Laboratory | RRID:IMSR_JAX:009086 | B6.129S4-Gt(ROSA)26Sortm1(FLP1)Dym/RainJ; germline Flp recombinase |
| Strain, strain background (Mus musculus) | C57BL/6 J | Jackson Laboratory | RRID:IMSR_JAX:000664 | 3–4 weeks old stimulus mice for SM assays |
| Cell line (Homo sapiens) | Q5 hiPSC | This paper | Columbia Stem Cell Core Facility | Control line from healthy twin |
| Cell line (Homo sapiens) | Q6 hiPSC | This paper | Columbia Stem Cell Core Facility | 22q11.2DS/SCZ patient line |
| Cell line (Homo sapiens) | Q1 hiPSC | This paper, Ref (Li et al., 2021) | Columbia Stem Cell Core Facility | 22q11.2DS/SCZ patient line; previously DEL3; Ref (Li et al., 2021) |
| Cell line (Homo sapiens) | Q2 hiPSC | This paper, Ref (Li et al., 2021) | Columbia Stem Cell Core Facility | Control line from healthy sibling; previously WT3; Ref (Li et al., 2021) |
| Cell line (Homo sapiens) | QR27 hiPSC | NIMH Repository, Ref (Lin et al., 2016) | MH0159027 | 22q11.2DS/SCZ patient line; Ref (Lin et al., 2016) |
| Cell line (Homo sapiens) | QR20 hiPSC | NIMH Repository, Ref (Lin et al., 2016) | MH0159020 | Control line from healthy donor, Ref (Lin et al., 2016) |
| Cell line (Homo sapiens) | Q6/EMC10HET | This paper | N/A | Heterozygous EMC10 LoF mutation in Q6 via CRISPR/Cas9 |
| Cell line (Homo sapiens) | Q6/EMC10HOM | This paper | N/A | Homozygous EMC10 LoF mutation in Q6 via CRISPR/Cas9 |
| Cell line (Mus musculus) | 4T1 | Ionis Pharmaceuticals | N/A | Used for in vitro ASO screening |
| Cell line (Mus musculus) | Mouse glial cells | Prepared in accordance to Ref (Pak et al., 2018) | N/A | 25% in NGN2-iN co-culture |
| Antibody | Anti-EMC10 (rabbit polyclonal) | Abcam | cat#Ab181209 | 1:1000 for Western blot |
| Antibody | Anti-DGCR8 (rabbit monoclonal) | Abcam | cat#Ab191875 | 1:1000 for Western blot |
| Antibody | Anti-RANBP1 (rabbit polyclonal) | Abcam | cat#Ab97659 | 1:500 for Western blot |
| Antibody | Anti-alpha-Tubulin (rabbit polyclonal) | Cell Signaling | cat#2144 S | 1:1000 for Western blot |
| Antibody | Anti-ASO (rabbit polyclonal) | Ionis Pharmaceuticals | N/A | 1:10000 for IHC; detects phosphorothioate backbone of the ASO |
| Antibody | Anti-GFAP (chicken polyclonal) | Aves Labs Inc. | cat#GFAP | 1:1000 for IHC |
| Antibody | Anti-NeuN (mouse monoclonal) | Millipore | cat#MAB377 | 1:200 for IHC |
| Antibody | Anti-TUJ1 (mouse monoclonal) | Sigma-Aldrich | cat#T8660 | 1:500 for IHC |
| Antibody | Anti-TBR1 (rabbit monoclonal) | Abcam | cat#Ab183032 | 1:100 for IHC |
| Antibody | Anti-GFP (goat polyclonal) | Rockland Immunochemicals | cat#600-101-215 | 1:1000 for IHC |
| Antibody | Anti-MAP2 (chicken polyclonal) | Abcam | cat#5392 | 1:2000 for IHC |
| Recombinant DNA reagent | pLenti-FUW-M2rtTA | Ref (Hockemeyer et al., 2008); Addgene | plasmid#20342 | Lentivirus; for NGN2 neuronal induction |
| Recombinant DNA reagent | pLenti-TetO-hNGN2-eGFP-puro | Ref (Ho et al., 2016); Addgene | plasmid#79823 | Lentivirus; for NGN2 neuronal induction |
| Recombinant DNA reagent | pLenti-TetO-hNGN2-puro | Ref (Ho et al., 2017); Addgene | plasmid#99378 | Lentivirus; for NGN2 neuronal induction |
| Sequence-based reagent | hsa-miR-185–5 p mimic | Ambion (Thermo Fisher) | cat#17100, PM12486 | Transfection |
| Sequence-based reagent | hsa-miR-485–5 p mimic | Ambion (Thermo Fisher) | cat#17100, PM10837 | Transfection |
| Sequence-based reagent | pre-miR Negative Control #1 | Ambion (Thermo Fisher) | cat#17110 | Transfection |
| Sequence-based reagent | hsa-miR-185–5 p inhibitor | Ambion (Thermo Fisher) | cat#MH12485 | Transfection |
| Sequence-based reagent | hsa-miR-485–5 p inhibitor | Ambion (Thermo Fisher) | cat#MH10837 | Transfection |
| Sequence-based reagent | miRNA inhibitor Neg. Ctrl #1 | Ambion (Thermo Fisher) | cat#4464076 | Transfection |
| Sequence-based reagent | EMC10-g1 gRNA (ACAGTGCCAACTTCCGGAAG) | This paper | N/A | CRISPR/Cas9 targeting EMC10; PAM: CGG |
| Sequence-based reagent | EMC10-g2 gRNA (GGGACAAGGTACCATCCTGC) | This paper | N/A | CRISPR/Cas9 targeting EMC10; PAM: TGG |
| Sequence-based reagent | qRT-PCR primers | Integrated DNA Technologies | N/A | See Supplementary file 9 for sequences |
| Sequence-based reagent | TaqMan Mm01197551_m1 (Emc10) | Thermo Fisher | cat#4351372 | Mouse Emc10 qRT-PCR |
| Sequence-based reagent | TaqMan Mm01208065_m1 (Emc10-1) | Thermo Fisher | cat#4351372 | Mouse Emc10 qRT-PCR |
| Sequence-based reagent | TaqMan Mm01197555_m1 (Emc10-2) | Thermo Fisher | cat#4351372 | Mouse Emc10 qRT-PCR |
| Sequence-based reagent | Mouse Gapdh Endogenous Control | Life Technologies | cat#4352339E | Housekeeping gene for mouse qRT-PCR |
| Sequence-based reagent | TaqMan Hs00382250 (EMC10) | Thermo Fisher | cat#4331182 | Human EMC10 qRT-PCR |
| Sequence-based reagent | TaqMan Hs01597912 (RANBP1) | Thermo Fisher | cat#4331182 | Human RANBP1 qRT-PCR |
| Sequence-based reagent | TaqMan Hs04260367 (OCT4/POU5F1) | Thermo Fisher | cat#4331182 | Human OCT4 qRT-PCR |
| Sequence-based reagent | TaqMan Hs02387400 (NANOG) | Thermo Fisher | cat#4331182 | Human NANOG qRT-PCR |
| Sequence-based reagent | TaqMan Hs00232429 (TBR1) | Thermo Fisher | cat#4331182 | Human TBR1 qRT-PCR |
| Sequence-based reagent | TaqMan Hs00909233 (GFAP) | Thermo Fisher | cat#4331182 | Human GFAP qRT-PCR |
| Sequence-based reagent | TaqMan Hs00159598 (NEUROD1) | Thermo Fisher | cat#4331182 | Human NEUROD1 qRT-PCR |
| Sequence-based reagent | TaqMan Hs00220404 (vGLUT1) | Thermo Fisher | cat#4331182 | Human vGLUT1 qRT-PCR |
| Sequence-based reagent | TaqMan Hs00698288 (DLX1) | Thermo Fisher | cat#4331182 | Human DLX1 qRT-PCR |
| Sequence-based reagent | TaqMan Hs00271595 (BRN2) | Thermo Fisher | cat#4331182 | Human BRN2 qRT-PCR |
| Sequence-based reagent | Human GAPDH Endogenous Control | Life Technologies | cat#4325792 | Housekeeping gene for human qRT-PCR |
| Sequence-based reagent | Emc10ASO1 (ASO1081815; TTGTTCCTACAGATCTAGGG) | Ionis Pharmaceuticals | N/A | ICV injection; targets Emc10 intron 2 |
| Sequence-based reagent | Emc10ASO2 (ASO1466182; GCCATATCTTTATTAATTAC) | Ionis Pharmaceuticals | N/A | ICV injection; targets Emc10 intron 1 |
| Chemical compound, drug | Tamoxifen (TAM) | Sigma-Aldrich | cat#T5648 | Solved in corn oil |
| Chemical compound, drug | Y-27632 | Tocris Bioscience | cat#1254 | Differentiation |
| Chemical compound, drug | LDN193189 | Stemgent | cat#04–0074 | Differentiation |
| Chemical compound, drug | SB431542 | Tocris Bioscience | cat#1614 | Differentiation |
| Chemical compound, drug | XAV939 | Tocris Bioscience | cat#3748 | Differentiation |
| Chemical compound, drug | PD0325901 | Tocris Bioscience | cat#4192 | Differentiation |
| Chemical compound, drug | SU5402 | BioVision Inc. | cat#1645–05 | Differentiation |
| Chemical compound, drug | DAPT | Tocris Bioscience | cat#2634 | Differentiation |
| Chemical compound, drug | BDNF (human) | R&D Systems | cat#248-BDB | Differentiation |
| Chemical compound, drug | NT-3 (human) | PeproTech | cat#450–03 | Differentiation |
| Chemical compound, drug | cAMP | Sigma-Aldrich | cat#A6885 | Differentiation |
| chemical compound, drug | Ascorbic acid | Sigma-Aldrich | cat#A92902 | Differentiation |
| Chemical compound, drug | Ara-C | Sigma-Aldrich | cat#C1768 | Differentiation |
| Chemical compound, drug | Puromycin | Sigma-Aldrich | cat#P8833 | 1 mg/l for NGN2-iN selection |
| Chemical compound, drug | Doxycycline | Sigma-Aldrich | cat#D9891 | For NGN2 induction |
| Chemical compound, drug | Fluo-4 AM | Invitrogen | cat#F14201 | For calcium imaging |
| Chemical compound, drug | Mouse laminin | Corning | cat#354232 | NGN2-iN culture |
| Chemical compound, drug | Lipofectamine 2000 | Life Technologies | cat#11668–030 | Transfection reagent |
| Chemical compound, drug | QIAzol lysis reagent | Qiagen | cat#79306 | Protein extraction from HPC |
| Commercial assay or kit | RNeasy Mini Kit | Qiagen | cat#1038703 | RNA extraction from mouse tissues |
| Commercial assay or kit | miRVana miRNA isolation kit | Ambion (Thermo Fisher) | cat#AM1560 | RNA/miRNA extraction from hiPSC/neurons |
| Commercial assay or kit | High-Capacity RNA-to-cDNA Kit | Applied Biosystems | cat#4387406 | cDNA synthesis |
| Commercial assay or kit | TaqMan Universal Master Mix II | Thermo Fisher Scientific | cat#4440038 | qRT-PCR |
| Commercial assay or kit | iTaq Universal SYBR Green Supermix | Bio-Rad | cat#1725121 | qRT-PCR with SYBR Green |
| Commercial assay or kit | Pierce BCA Protein Assay Kit | Thermo Scientific | cat#23227 | Protein quantification |
| Software, algorithm | ImageJ | NIH | RRID:SCR_003070 | Image and Western blot analysis |
| Software, algorithm | NeuronStudio (v0.9.92) | Ref (80) | RRID:SCR_013798 | Dendritic complexity analysis |
| Software, algorithm | VAA3D (v3.1.00) | Ref (Peng et al., 2010; Peng et al., 2014a; Peng et al., 2014b) | RRID:SCR_002609 | 3D dendritic analysis |
| Software, algorithm | FreezeFrame 3 | Harvard Apparatus | N/A | For fear conditioning analysis |
| Software, algorithm | TruScan (v1.012–00) | Coulbourn Instruments | N/A | Open field recordings |
| Software, algorithm | gProfiler | Ref (Raudvere et al., 2019) | RRID:SCR_006809 | GO term enrichment analysis |
| Software, algorithm | TargetScan (v8.0) | Ref (Agarwal et al., 2015) | RRID:SCR_010845 | miRNA target prediction |
| Software, algorithm | konnect2prot | Ref (Kumar et al., 2023) | N/A | PPI network analysis |
| Software, algorithm | COSMID | Ref (Cradick et al., 2014) | N/A | CRISPR off-target prediction |
| Software, algorithm | miRNet 2.0 | Ref (Chang et al., 2020) | N/A | miRNA target network analysis |
| Software, algorithm | Nikon NIS Elements AR (v5.21.03) | Nikon Instruments | RRID:SCR_014329 | Confocal image capture |
| Software, algorithm | GraphPad Prism | GraphPad Software | RRID:SCR_002798 | Data visualization and analysis |
| Other | Mouse astrocyte conditioned media | ScienCell | cat#M1811-57 | 10% in NGN2-iN culture |
| Other | Glass bottom dishes (14 mm) | MatTek | cat#P35G-1.5–14 C | Calcium imaging |
Additional files
-
Supplementary file 1
Clinical and demographic characteristics of 22q11.2DS/SCZ patients and healthy controls.
- https://cdn.elifesciences.org/articles/103328/elife-103328-supp1-v1.xlsx
-
Supplementary file 2
Differentially expressed microRNAs in cortical neurons (DIV8) from 22q11.2DS/SCZ (Q6) and control line (Q5) derived using small-molecule inhibitors of SMAD and WNT signaling pathways.
- https://cdn.elifesciences.org/articles/103328/elife-103328-supp2-v1.xlsx
-
Supplementary file 3
DEGs in cortical neurons (DIV8) from 22q11.2DS/SCZ (Q6) and control line (Q5) derived using small-molecule inhibitors of SMAD and WNT signaling pathways.
- https://cdn.elifesciences.org/articles/103328/elife-103328-supp3-v1.xlsx
-
Supplementary file 4
List of targets of downregulated miRNAs identified from the intersection of predicted targets of downregulated miRNAs and upregulated DEGs in hiPSC-derived cortical neurons at DIV8.
- https://cdn.elifesciences.org/articles/103328/elife-103328-supp4-v1.xlsx
-
Supplementary file 5
Predicted targets of miR-185–5 p, miR-1286 and miR-1306–5 p in EMC10 3’UTR.
- https://cdn.elifesciences.org/articles/103328/elife-103328-supp5-v1.xlsx
-
Supplementary file 6
DEGs in NGN2-iNs (DIV21) from 22q11.2DS/SCZ (Q6) and control line (Q5) that were normalized ('rescued') in Q6 EM10 HET and Q6 EMC10 HOM lines.
- https://cdn.elifesciences.org/articles/103328/elife-103328-supp6-v1.xlsx
-
Supplementary file 7
List of 103 DEGs normalized in both Q6 EMC10 HET and EMC10 HOM lines, used for PPI konnect2prot network analysis.
- https://cdn.elifesciences.org/articles/103328/elife-103328-supp7-v1.xlsx
-
Supplementary file 8
List of genes upregulated in CtrlASO1 treated-Df(16)A+/-mice compared to CtrlASO1 treated-WT mice but not in the Emc10ASO1 treated-Df(16)A+/-compared to Emc10-ASO1 treated-WT mice.
- https://cdn.elifesciences.org/articles/103328/elife-103328-supp8-v1.xlsx
-
Supplementary file 9
List of primer sequences used for qRT-PCRs.
- https://cdn.elifesciences.org/articles/103328/elife-103328-supp9-v1.xlsx
-
MDAR checklist
- https://cdn.elifesciences.org/articles/103328/elife-103328-mdarchecklist1-v1.pdf
Download links
A two-part list of links to download the article, or parts of the article, in various formats.
Downloads (link to download the article as PDF)
Open citations (links to open the citations from this article in various online reference manager services)
Cite this article (links to download the citations from this article in formats compatible with various reference manager tools)
An antisense oligonucleotide-based strategy to ameliorate cognitive dysfunction in the 22q11.2 Deletion Syndrome
eLife 13:RP103328.
https://doi.org/10.7554/eLife.103328.3


