Effects of parental care on skin microbial community composition in poison frogs
- Department of Biology, Stanford University, United States
- Division of Microbial Ecology, University of Vienna, Austria
- Department of Medicine, Stanford University School of Medicine, United States
- Department of Microbiology & Immunology, Stanford University School of Medicine, United States
- Infectious Diseases Section, Veterans Affairs Palo Alto Health Care System, United States
- Wu Tsai Institute for Neuroscience, Stanford University, United States
Figures
Figure 1 with 2 supplements
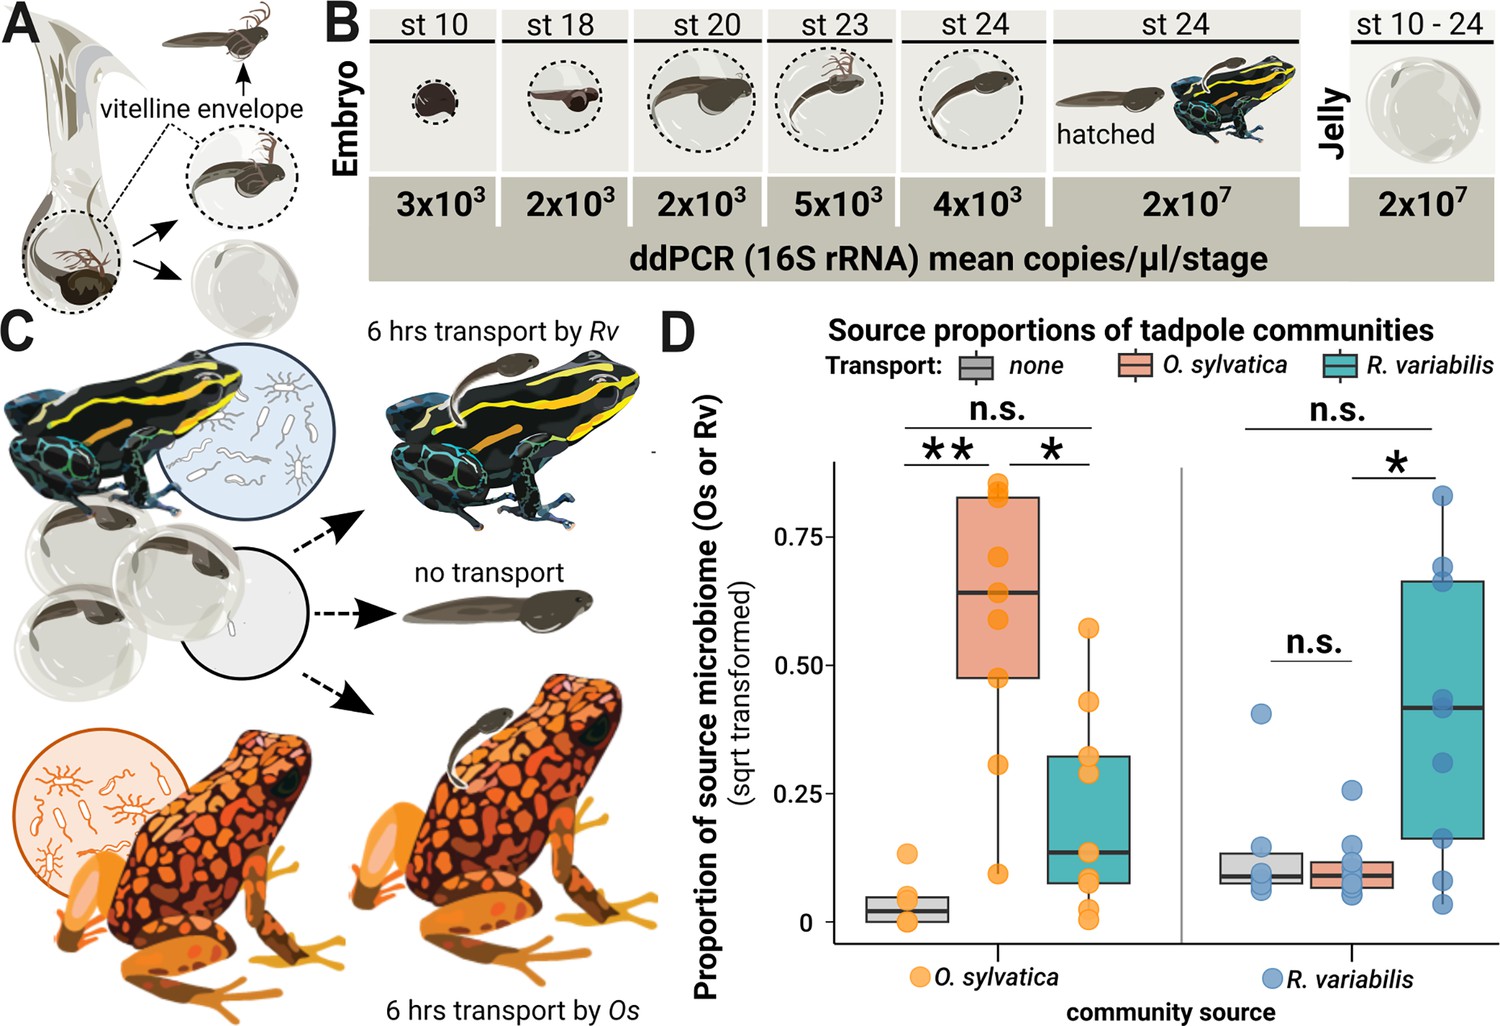
Microbes colonize a poison frog embryo after hatching and are vertically transmitted during tadpole transport.
(A) Embryos in the vitelline envelope (dashed line) were manually separated from jelly using tweezers. The vitelline envelope (dashed line) containing the embryo was transferred to sterile water and opened to free the embryo. The embryo was washed in fresh sterile water before homogenization. (B) 16 S rRNA gene copy number variations across developmental stages of embryos and jelly. DNA was isolated from whole embryos (N=14) and jellies (N=12) of different developmental stages and tested for bacterial presence using droplet digital PCR (ddPCR). Rounded mean copy numbers/µl/stage are displayed. (C) After hatching, siblings of a clutch were either (1) not transported (middle arrow, N=6), (2) transported by their biological parent (upper arrow, N=7), or (3) transported by a foster poison frog of a different species (Oophaga sylvatica) (lower arrow, N=9). (D) We performed 16 S rRNA gene-specific amplicon sequencing targeting the V4 region on swabs from the transporting frogs and the skins of the transported tadpoles and used Sourcetracker to identify the sources of taxa that had been acquired by tadpoles. The function was trained on communities of adult Ranitomeya variabilis (Rv) and Oophaga sylvatica (Os) that had served as caregivers. Source proportions of both species (Os: orange dots and Rv: blue dots) were determined for each tadpole (N=24), resulting in two data points per tadpole. Source proportions (Os: orange dots, Rv: blue dots) were determined in tadpoles transported by Os (orange boxes), Rv (blue boxes), and non-transported tadpoles (gray boxes) and compared with a Kruskal-Wallis test. P-values were adjusted for multiple comparisons (Benjamini-Hochberg). Boxplots show the median and interquartile range (IQR); error bars represent values within 1.5× the IQR, significances are indicated by * (<0.05), and ** (<0.01).
Figure 1—figure supplement 1
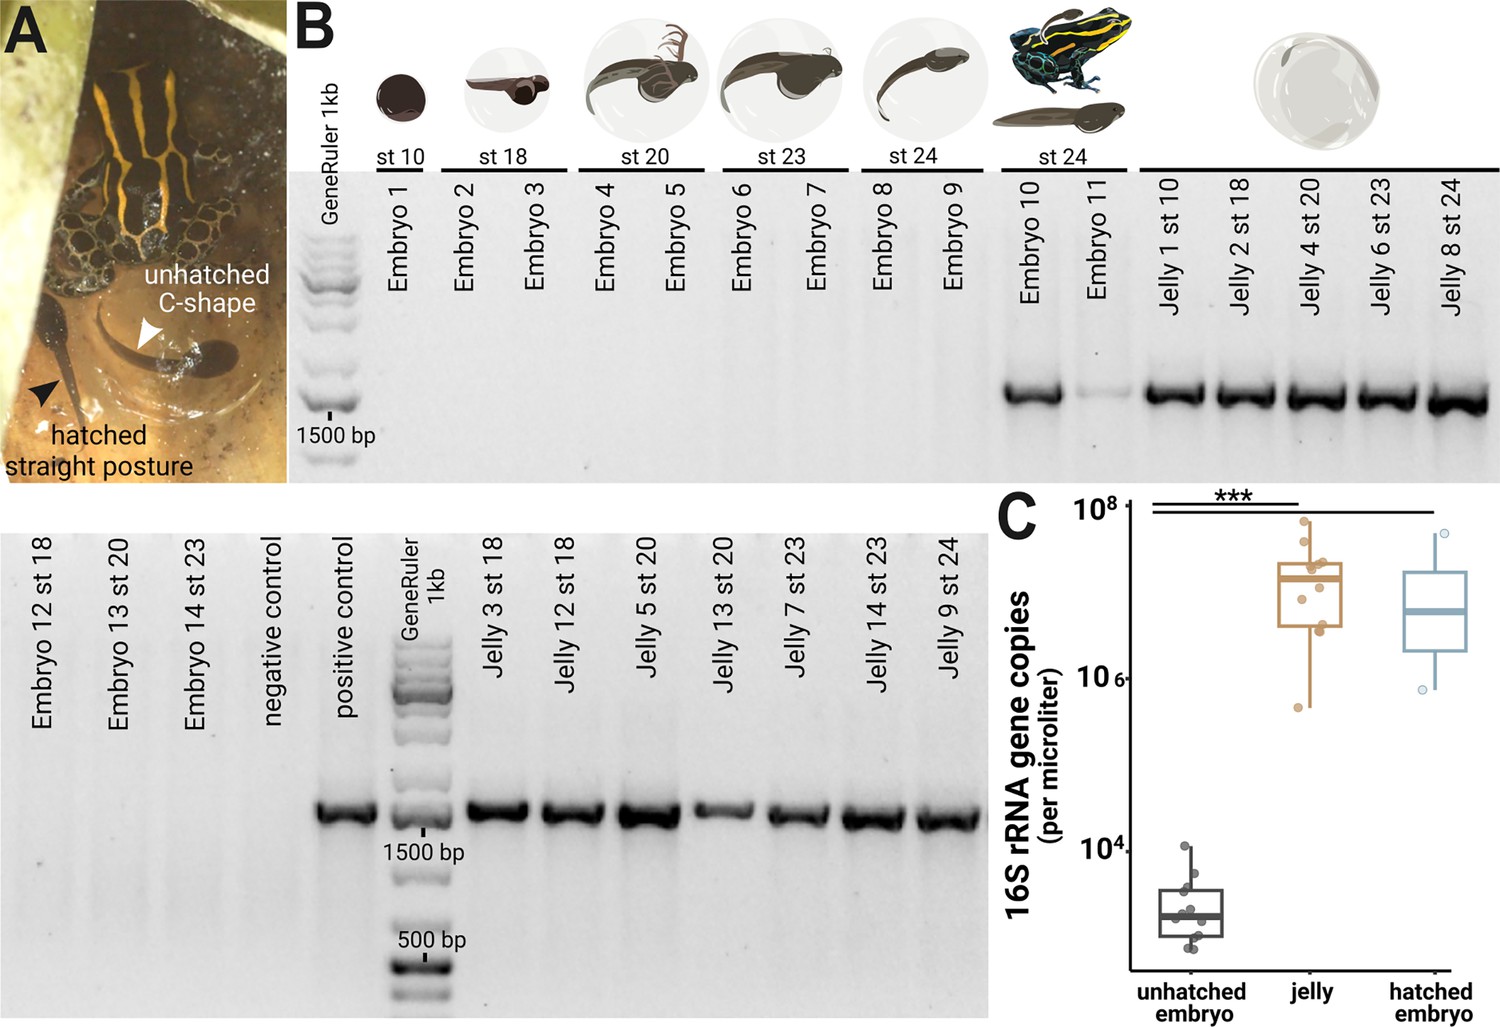
Microbes colonize a poison frog embryo after hatching from the vitelline membrane.
(A) Two tadpoles on the day of transport by their caregiver. Before hatching, tadpoles’ posture is restricted by the transparent vitelline membrane, and they adopt a characteristic C-shape (right tadpole). After tadpoles hatch from the vitelline envelope, they display a straightened posture (left tadpole). Picture credit: Daniel Shaykevich. (B) DNA was isolated from whole embryos (N=14) and jellies (N=12) of different developmental stages. The 16 S rRNA gene was amplified with a broad range PCR using primer specific for the full 16 S rRNA region (27 F and 1492 R, ~1500 bp). Amplification products were visualized on a 2% agarose gel. (C) 16 S rRNA gene copy numbers were quantified in jellies, hatched and unhatched embryos using a digital droplet PCR (ddPCR). Variations in copy numbers between the three groups were analyzed with a Kruskal-Wallis test with Benjamini-Hochberg correction followed by a Dunn test. Boxplots show the median and interquartile range (IQR); error bars represent values within 1.5× the IQR, significant p-values <0.001 are indicated by ***.
-
Figure 1—figure supplement 1—source data 1
Original gel pictures containing used to create Figure 1—figure supplement 1B, indicating the relevant bands and sample names.
- https://cdn.elifesciences.org/articles/103331/elife-103331-fig1-figsupp1-data1-v1.zip
-
Figure 1—figure supplement 1—source data 2
Original, unedited pictures used to create Figure 1—figure supplement 1B.
- https://cdn.elifesciences.org/articles/103331/elife-103331-fig1-figsupp1-data2-v1.zip
Figure 1—figure supplement 2
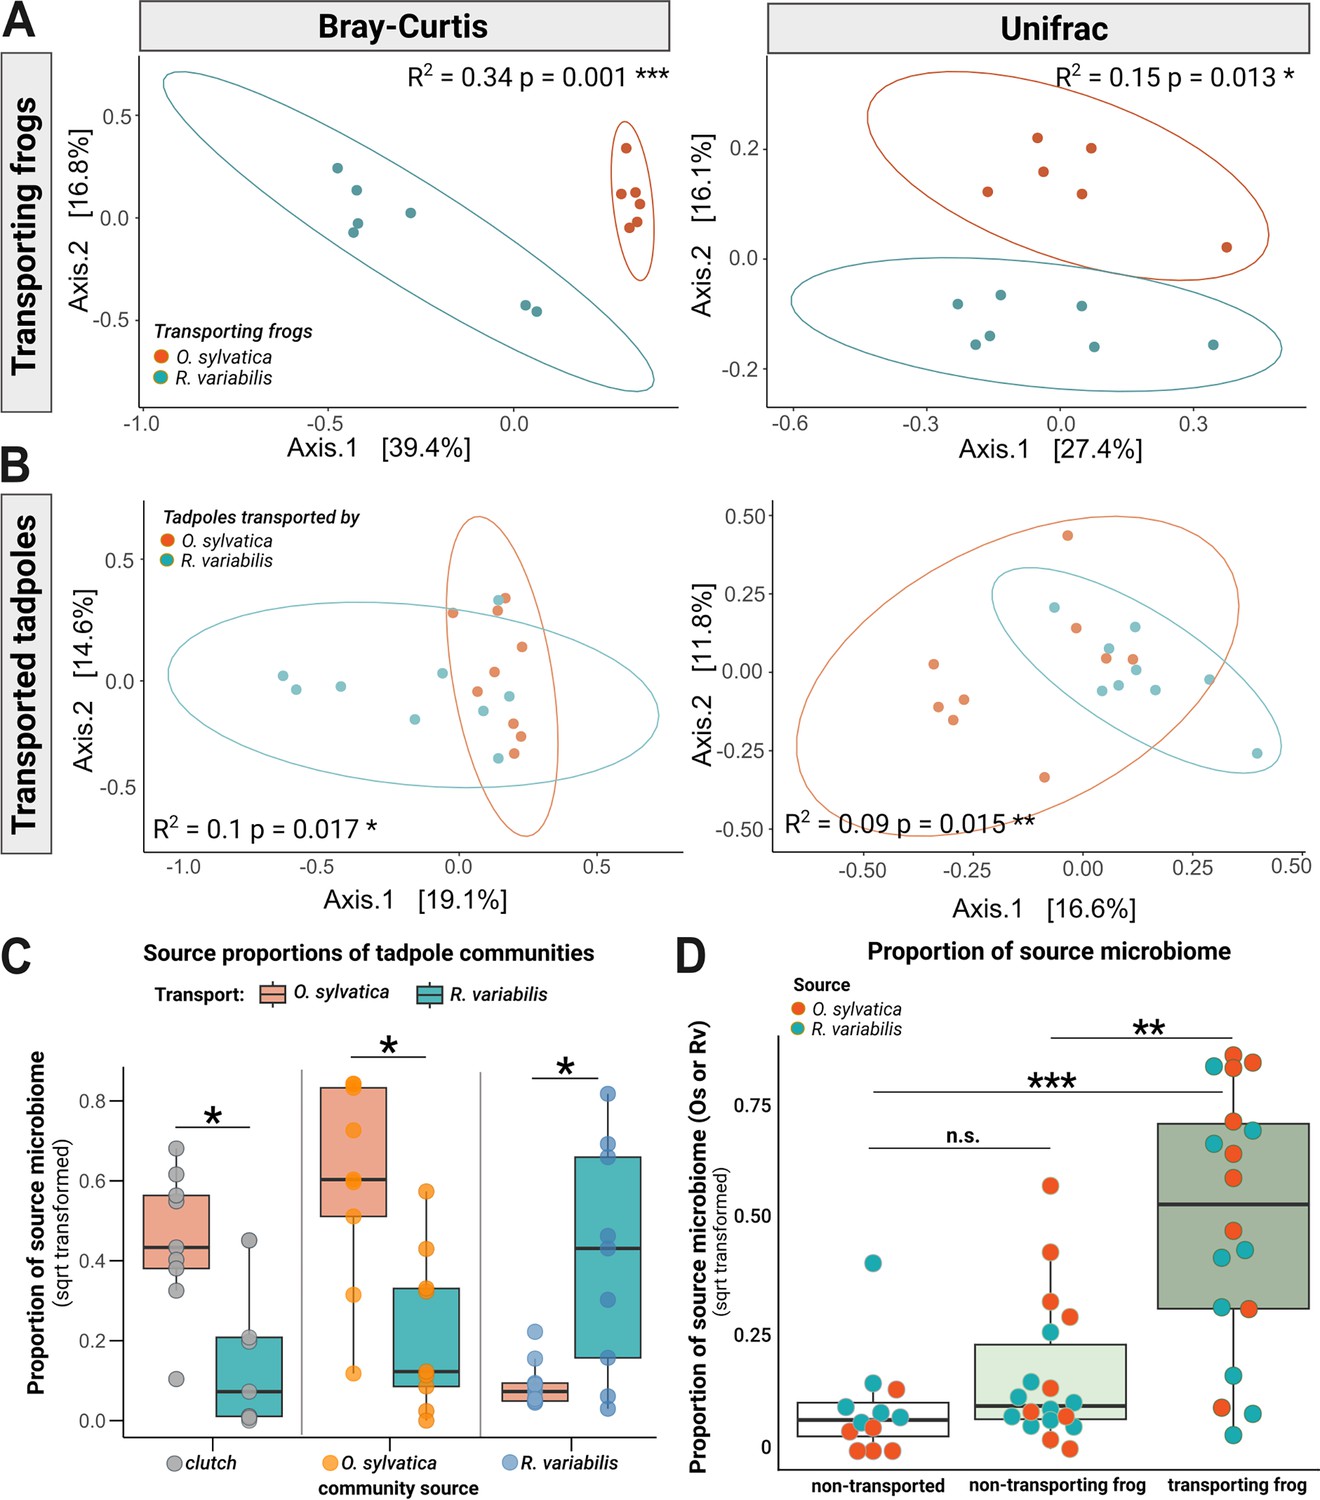
Transporting frogs serve as a source of microbes for transported tadpoles.
(A) Communities of frog species Ranitomeya variabilis (Rv) (blue, N=7) and Oophaga sylvatica (Os) (orange, N=6) that transported tadpoles cluster distinctly from each other in a principal coordinate analysis of Bray Curtis (left panel) and Unifrac (right panel) distances. (B) After 6 hr of transport, communities of tadpoles transported by Rv and Os (N=18) overlap but cluster distinctly. (C) In a separate analysis, SourceTracker was trained on the communities of non-transported siblings (N=6) as an additional source to assess whether microbes associated with transported tadpoles had been acquired from the clutch; this approach also served to test the consistency of our findings across different source configurations. Source proportions (clutch: gray dots, Os: orange dots, Rv: blue dots) were determined for tadpoles transported by Os (orange boxes) or Rv (blue boxes) and compared with a pairwise Wilcoxon test. P-values were adjusted using the Benjamini Hochberg correction. All source proportions were square root transformed for plotting. (D) We used Sourcetracker to identify the sources of taxa (identified with 16S v4 specific amplicon sequences) that had been acquired by tadpoles. The function was trained on communities of adult Rv and Os that had served as caregivers. Source proportions of both species (Os: orange dots and Rv: blue dots) were determined for each tadpole (N=24), resulting in two data points per tadpole. Proportions were then grouped to display either (1) proportions of the transporting species in transported tadpoles (Rv proportions in tadpoles transported by Rv and Os proportions in tadpoles transported by Os) (dark green), or (2) proportions of the non-transporting species on transported tadpoles (indicating Rv proportions in tadpoles transported by Os and Os proportions in tadpoles transported by Rv) (light green), or (3) proportions of both species in non-transported tadpoles (indicating Rv and Os proportions in non-transported tadpoles) (white). Proportions were compared with a Kruskal-Wallis test with Benjamini-Hochberg correction. Source proportions were square root transformed for plotting. Boxplots show the median and interquartile range (IQR); error bars represent values within 1.5× the IQR, significances p<0.05 are indicated by *p<0.01 by **;p;<0.001 by ***.
Figure 2 with 2 supplements
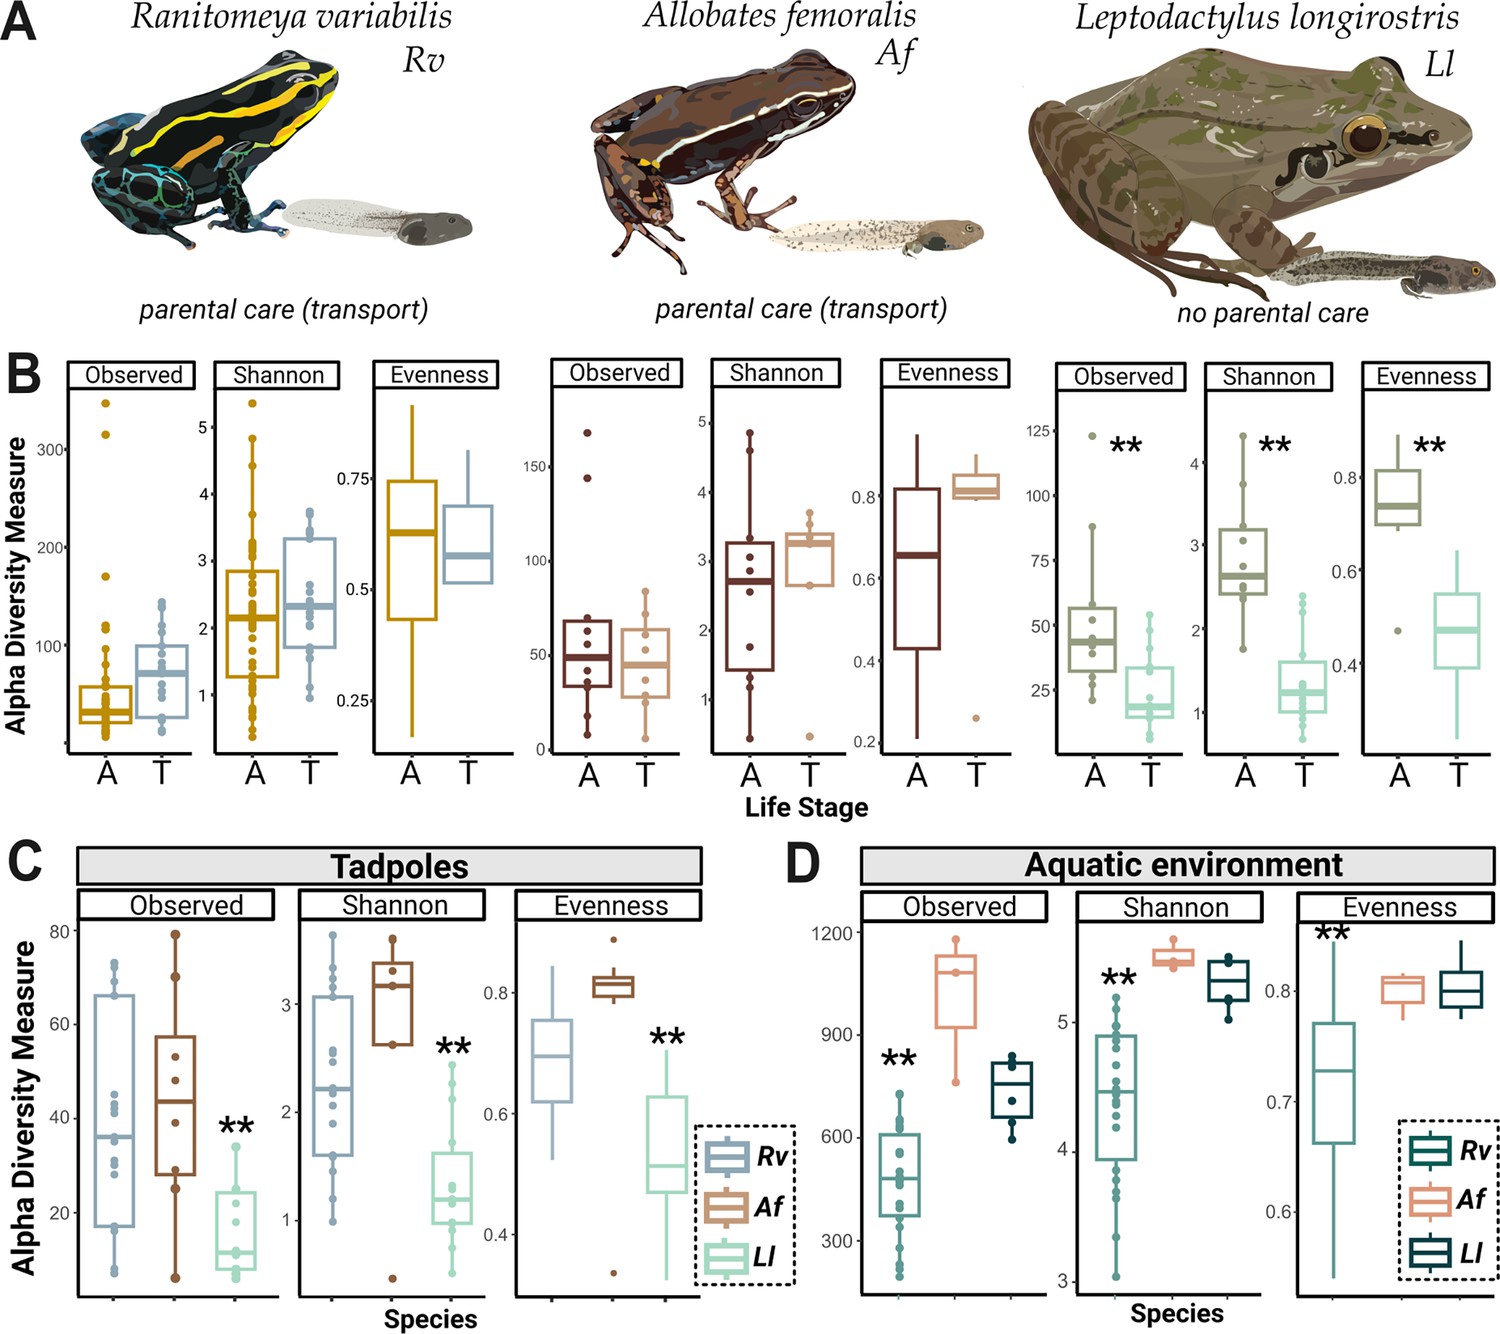
Tadpoles skin microbiome is shaped by their environment and is more diverse in Ranitomeya variabilis (Rv) and Allobates femoralis (Af) compared to Leptodactylus longirostris (Ll) tadpoles.
(A) We compared the skin microbiome of three anuran species: two species of poison frogs inhabiting different habitats that transport their offspring (Rv and Af) and a leptodactylid frog (Ll) that deposits its eggs in water without transporting the tadpoles. N (Rv)=44 adults and 21 tadpoles, N (Ll)=10 adults and 14 tadpoles, N (Af)=10 adults and ight tadpoles. (B) Alpha diversity measures (observed Amplicon Sequence Variant ASV richness, Shannon diversity, and evenness) for tadpoles (T) and adults (A) of each species were compared. Differences were determined with an ANOVA or Kruskal-Wallis test, p-values were adjusted for multiple comparisons (Benjamini-Hochberg). (C) Comparison of ASV richness, Shannon diversity, and evenness of communities associated with poison frog tadpoles (Af or Rv) and non-poison frog species (Ll). (D) Comparison of Shannon diversity and evenness of communities associated with the aquatic habitats of Af, Rv, and Ll. Bars in boxplots represent median values, error bars represent values within 1.5× the interquartile range (IQR), significant p-values <0.01 are indicated by **. The dataset was separately rarefied to the lowest read depth of each comparison.
Figure 2—figure supplement 1
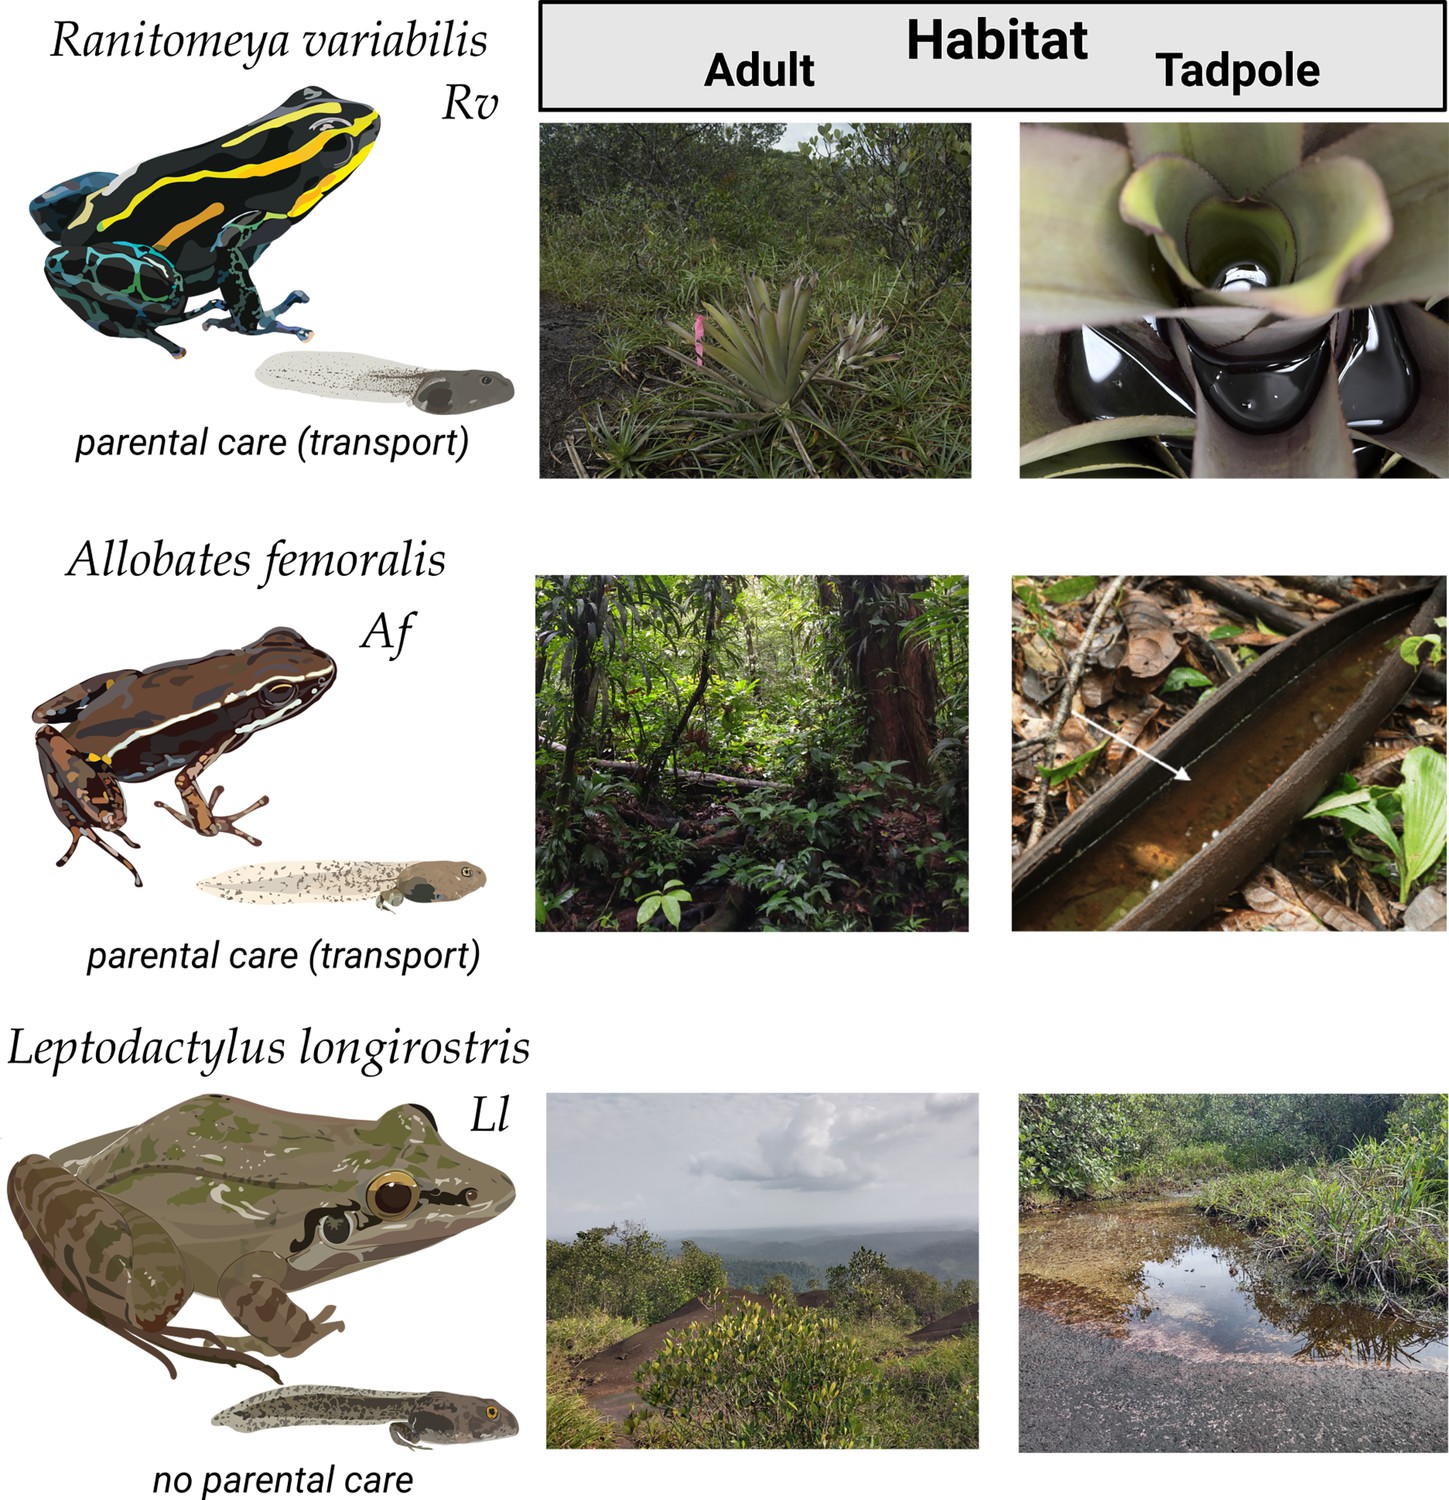
Study species and their habitat.
We compared the skin microbiome of three anuran species: Ranitomeya variabilis (Rv) (upper panel) and Allobates femoralis (Af) (middle panel) are poison frogs that transport their offspring but prefer different habitat types (leaf litter in primary forest vs. rock savanna on a mountain plateau). While both transport their offspring, Af tadpoles grow up in groups and Rv tadpoles are cannibalistic and grow up in individual leaf axil pools. Leptodactylus longirostris (Ll) (lower panel) is a leptodactylid frog that cohabits the rock savanna with Rv but deposits its eggs in water without transporting its tadpoles. Picture of Af tadpole habitat published by Pašukonis et al., 2019 under a CC BY 4.0 license.
Figure 2—figure supplement 2
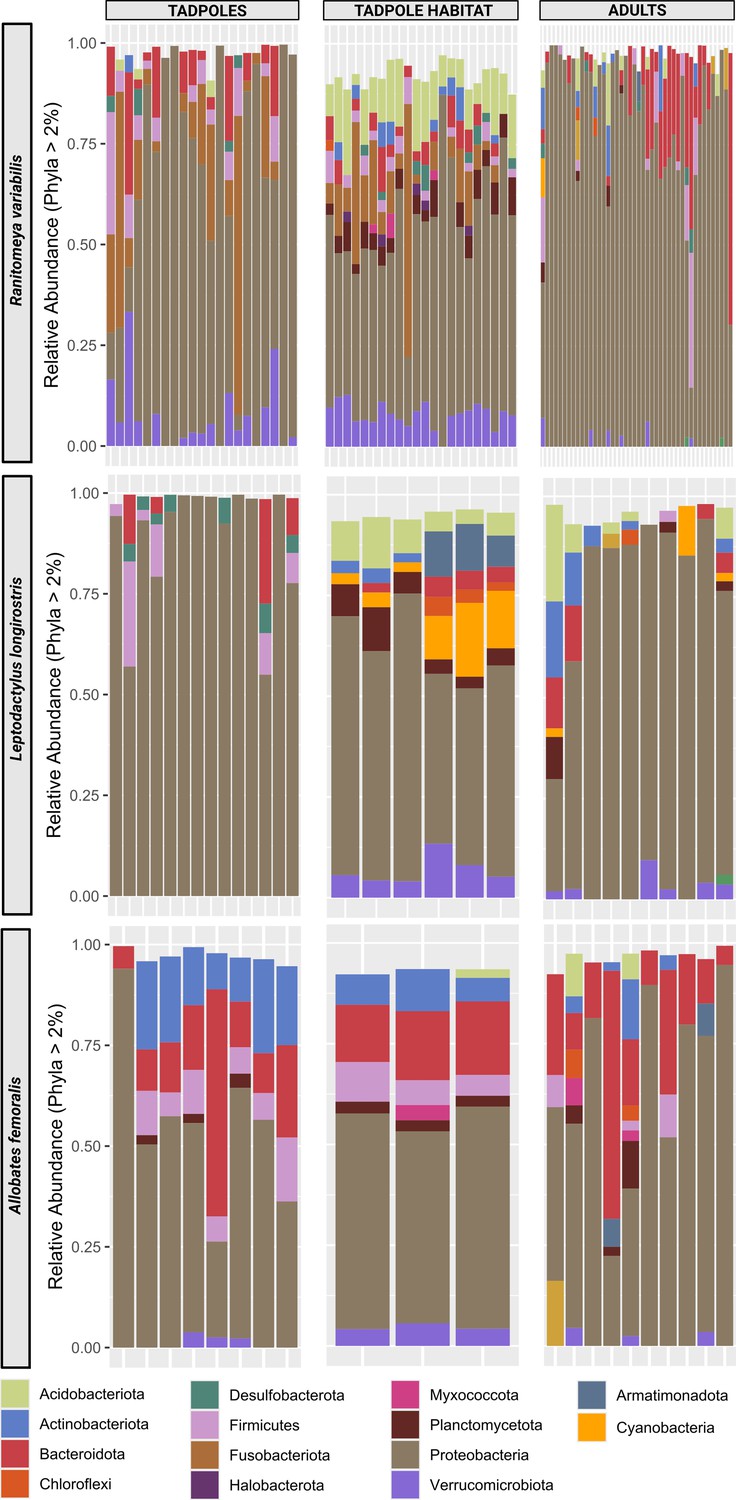
Phyla distribution per species and group.
Bars represent individual tadpoles, frogs or samples of the aquatic environment. Sample sizes are indicated in Supplementary file 1c. We sampled triplicates of aquatic environments of group-living tadpoles occurring in the same pool. Colors represent phyla that were detected with a relative abundance of more than 2%.
Figure 3
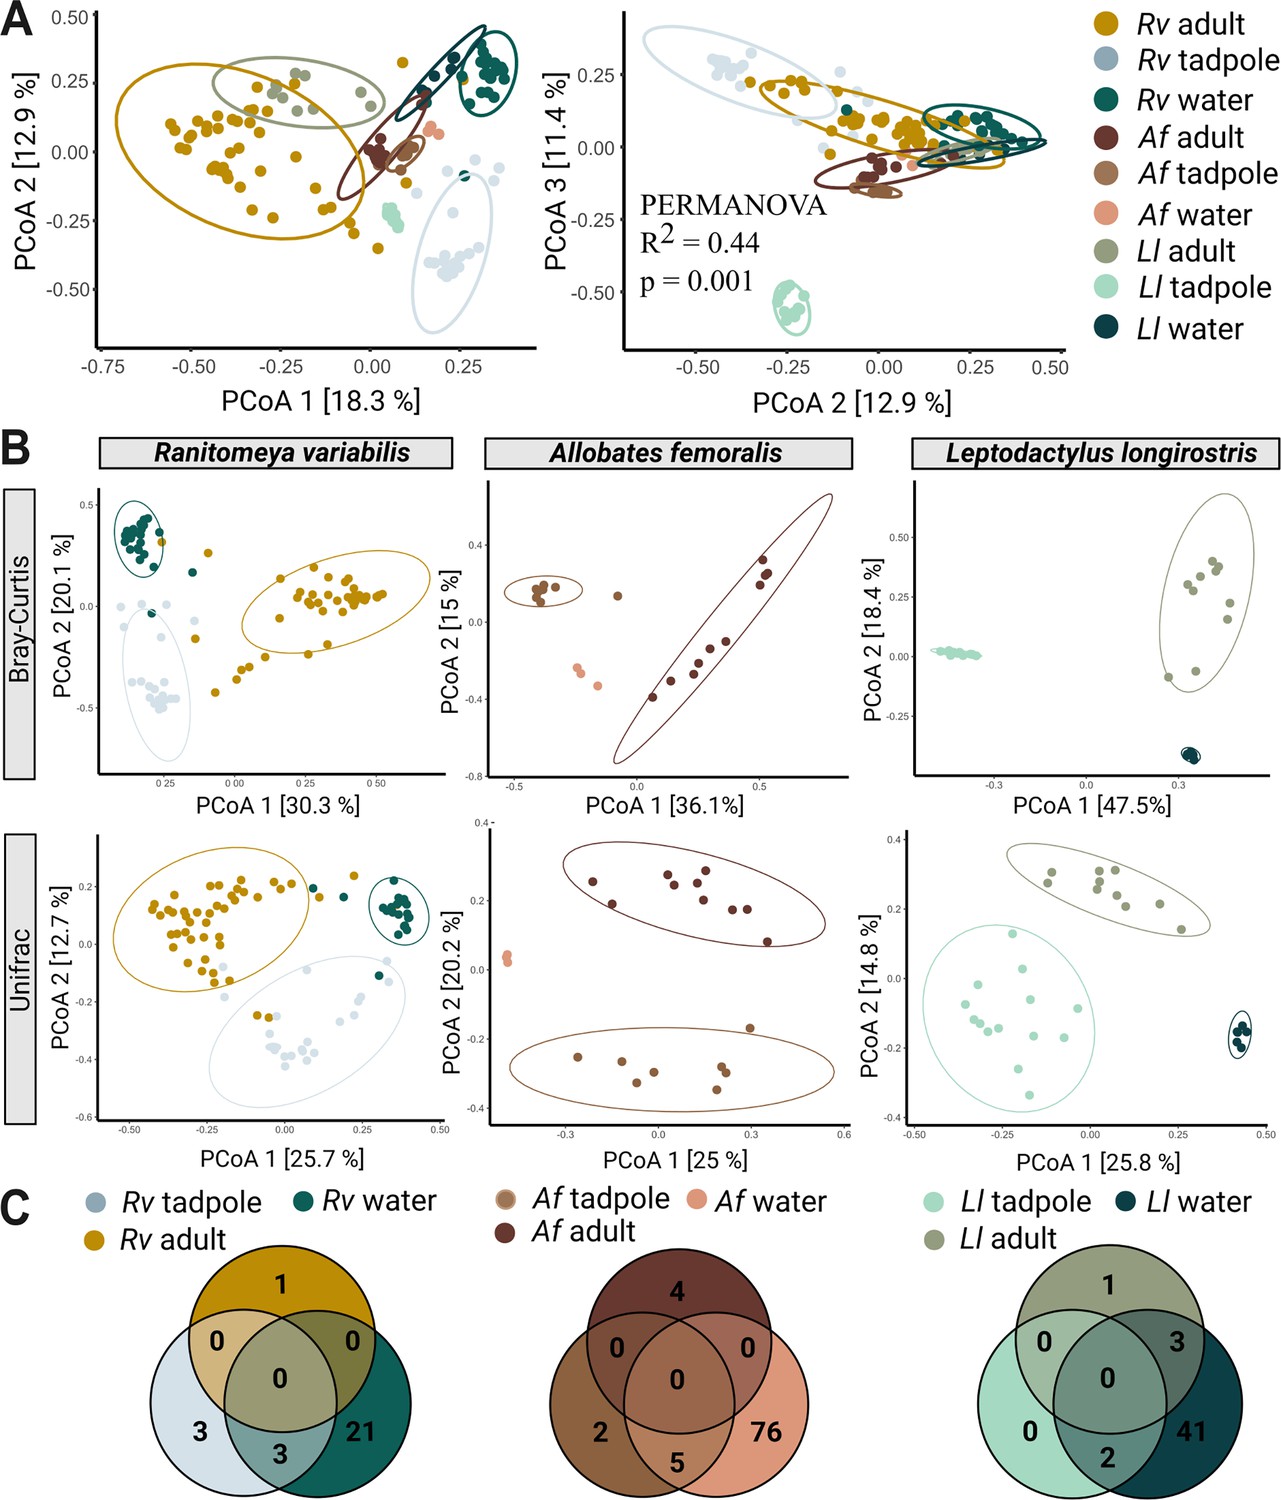
Species, life stage, and parental care affect clustering of microbial communities.
(A) In a Principal Coordinate Analysis constructed with Bray-Curtis distances (axis 1 and 2 on the left, axes 2 and 3 on the right) tadpoles cluster significantly differently from each other, adults, and their aquatic environment. Significances were determined with a PERMANOVA followed by a pairwise Adonis post hoc test. Points in ordination plots represent the communities of each sample, circles represent confidence ellipses. N (Ranitomeya variabilis, Rv)=44 adults and 21 tadpoles, N (Leptodactylus longirostris, Ll)=10 adults and 14 tadpoles, N (Allobates femoralis, Af)=10 adults and eight tadpoles. (B) Principal Coordinate Analysis constructed with Bray-Curtis and Unifrac distances for adults, tadpoles, and aquatic environment of each species. (C) Number of core species (prevalence >75%, relative abundance >0.1%) shared between adults, tadpoles, and the respective aquatic environment of each species.
Figure 4
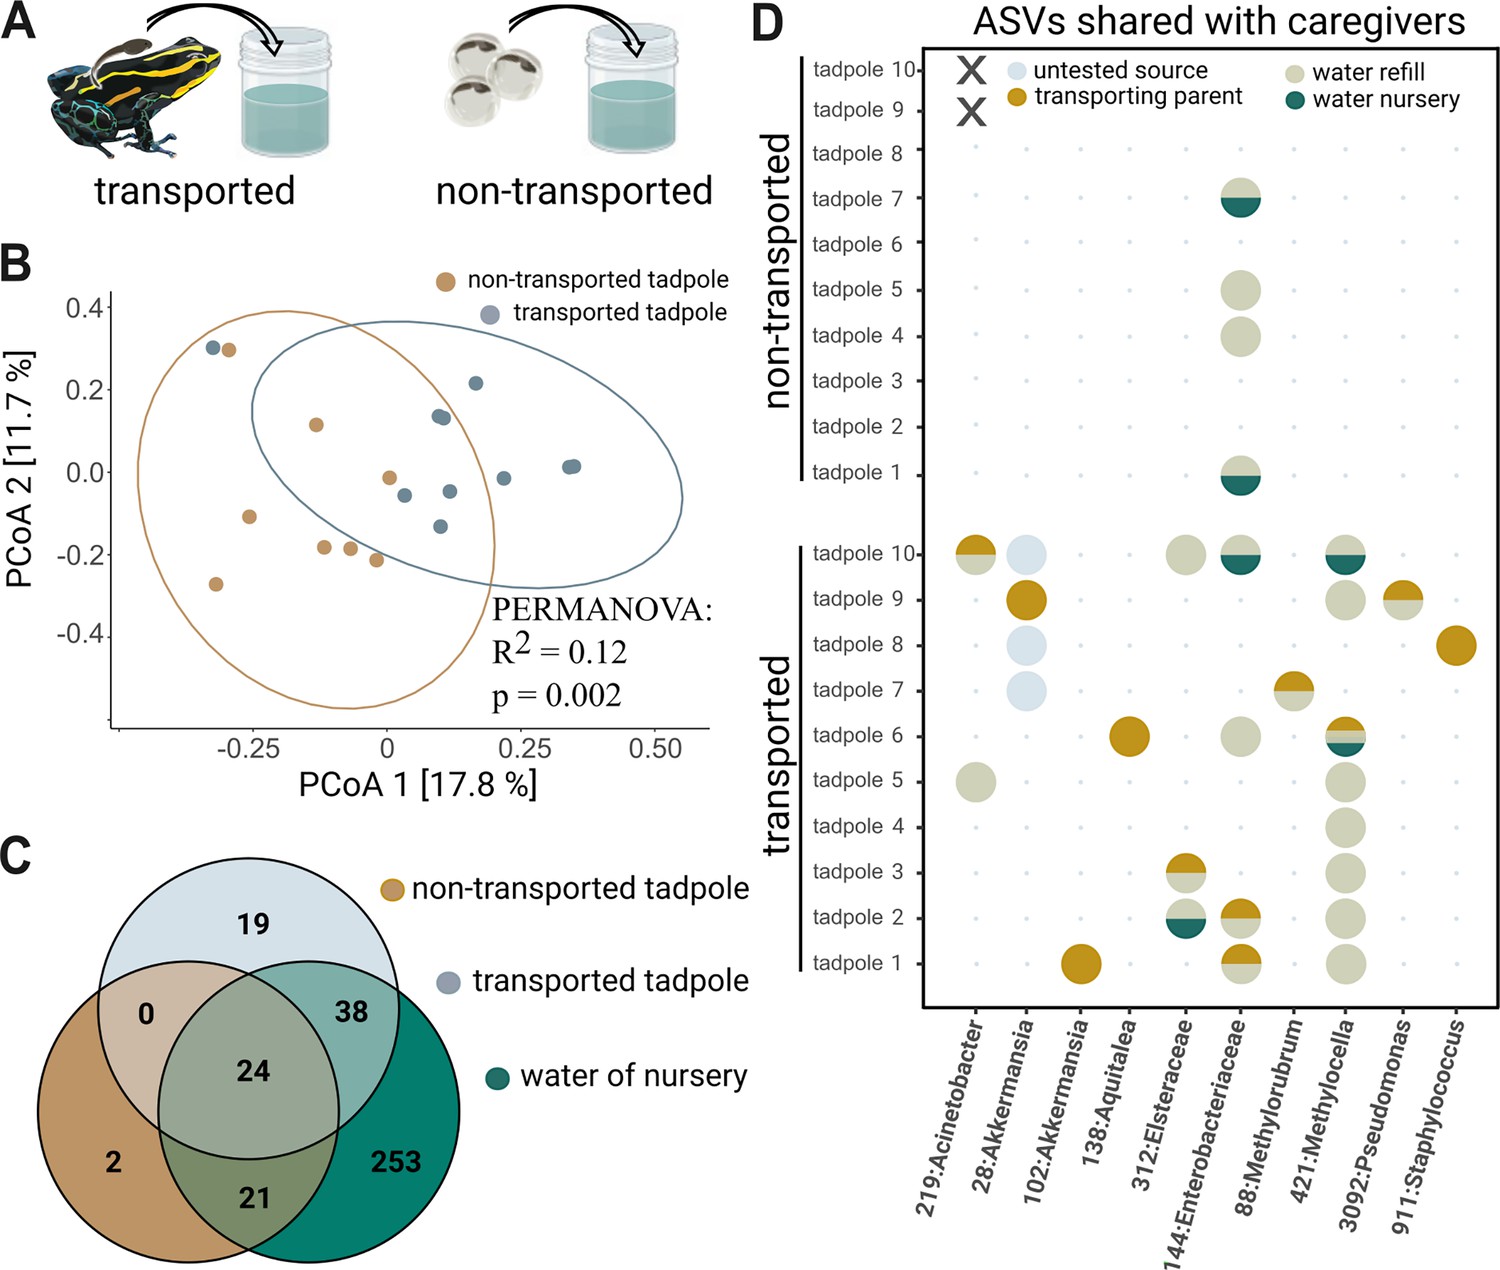
Tadpole transport influences community structure.
(A) Tadpoles collected from the back of their caregiver (‘transported,’ N=10) and reared in artificial cups for one month were compared to 6-week-old tadpoles that hatched from eggs transferred to artificial cups and did not experience transport by adult frogs (‘non-transported,’ N=10). (B) Principal Coordinate Analysis constructed using unweighted Unifrac distances shows that transported tadpoles cluster significantly differently from non-transported tadpoles. Significances were determined with a PERMANOVA followed by a pairwise Adonis post hoc test. (C) Venn diagram comparing unrarefied Amplicon Sequence Variants (ASVs) agglomerated on a genus level between transported tadpoles, non-transported tadpoles, and the aquatic environment. (D) Bubble diagram depicting the presence (circle) or absence (dot) of 10 ASVs shared between parents and transported tadpoles as well as their possible source (‘transporting parent,’ ‘nursery water,’ ‘refill water,’ or ‘untested’). Non-transported tadpoles (N=2) that died prior to sampling are indicated by ‘X’.
Additional files
-
MDAR checklist
- https://cdn.elifesciences.org/articles/103331/elife-103331-mdarchecklist1-v1.docx
-
Supplementary file 1
Supplementary tables supporting the main findings of this study.
(a) 16S rRNA gene copy number variations in embryos and jelly measured by ddPCR. (b) Source proportions of Os and Rv communities in the microbiome of tadpoles transported by Os, and their sibling transported by Rv or non-transported. (c) Taxonomic composition of microbiome samples from wild tadpoles and adults. (d) Statistical analysis of alpha diversity measures across species and life stages and environments. (e) PERMANOVA results for Principal Coordinate-located in the nature reserve ‘Les Analysis on Bray Curtis distances. (f) Identity and number of core taxa across abundance and prevalence cutoffs. (h–j) Shared ASVs between transported tadpoles and their caregivers, including relative and scaled absolute abundances and presence in non-transported tadpoles.
- https://cdn.elifesciences.org/articles/103331/elife-103331-supp1-v1.docx
-
Supplementary file 2
Differentially abundant genera between transported and non-transported tadpoles.
Differentially abundant genera between experimental conditions (N = 10 transported, N = 8 non-transported tadpoles) were determined with the R package ANCOMBC2.
- https://cdn.elifesciences.org/articles/103331/elife-103331-supp2-v1.xlsx
Download links
A two-part list of links to download the article, or parts of the article, in various formats.
Downloads (link to download the article as PDF)
Open citations (links to open the citations from this article in various online reference manager services)
Cite this article (links to download the citations from this article in formats compatible with various reference manager tools)
Effects of parental care on skin microbial community composition in poison frogs
eLife 14:RP103331.
https://doi.org/10.7554/eLife.103331.3


