Primosomal protein PriC rescues replication initiation stress by bypassing the DnaA-DnaB interaction step for DnaB helicase loading at oriC
- Department of Molecular Biology, Kyushu University Graduate School of Pharmaceutical Sciences, Japan
Figures
Figure 1
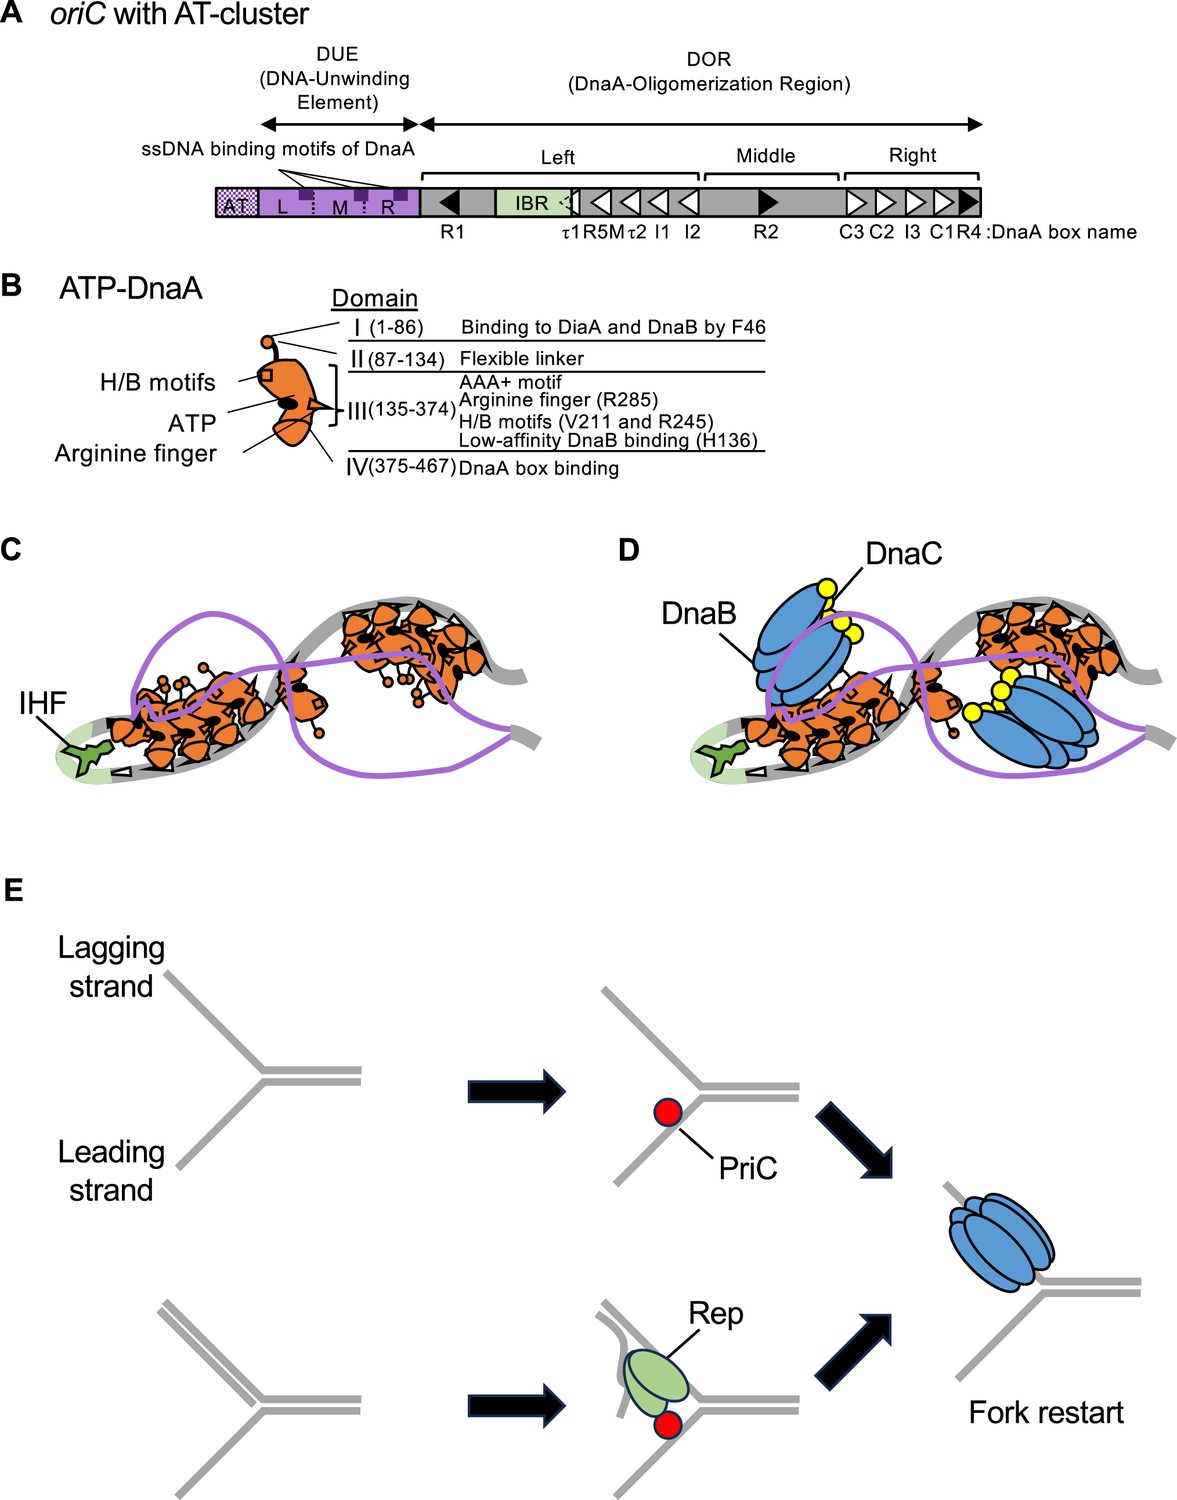
Schematic structures of oriC and DnaA and the replication initiation mechanism.
(A) Overall structure of oriC with the AT-rich cluster. oriC (245 bp) includes the Duplex-Unwinding Element (DUE, purple bar) and the DnaA-Oligomerization Region (DOR, gray bar). DUE is composed of three AT-rich 13-mer repeats termed L, M, and R. Dark purple boxes indicate the specific sequences involved in DnaA-ssDNA binding (TT[A/G]T(T)). The AT-cluster (purple dots) flanking the DUE outside oriC is a supplementary unwinding region. The DnaA-oligomerization region (DOR) contains 12 DnaA boxes (filled and open arrowheads representing sites with the full consensus TTA[A/T]NCACA sequence and sites with mismatches, respectively) and an IHF-binding region (IBR, green box). The DOR is subdivided into Left, Middle, and Right subregions. (B) Domains of DnaA. Domains I-IV are shown schematically, with amino acid residue numbers shown in each bracket. H/B motifs (V211 and R245, squares) and Arginine finger (R285, triangle) are indicated. The major functions of each domain are described on the right side of the structure. (C) DUE unwinding by the ssDUE recruitment mechanism. DnaA and IHF are indicated by red and green diagrams, respectively. When ATP-DnaA oligomerizes, DUE is unwound unstably by thermal motion and torsional stress. The M/R region of the DUE-upper strand (purple line) binds to R1-DnaA and R5M-DnaA via IHF-induced DNA bending, resulting in stable DUE unwinding. In addition to M/R-DUE, L-DUE is moderately unwound and interacts with the Right-DnaA subcomplex. (D) Mechanism for DnaB loading. Each Left-DnaA and Right-DnaA subcomplex binds to a DnaB hexamer (blue ovals) complexed with DnaC (yellow circles). (E) PriC-dependent fork rescue pathways. PriC (vivid red circle) promotes DnaB reloading to the abandoned fork, which exposes ssDNA regions. PriC binds to ssDNA at the replication fork, which remodels the single-stranded DNA binding protein (SSB)-ssDNA complex (for simplicity, SSB is omitted) for DnaC-dependent reloading of DnaB (upper panel). If the ssDNA region is accompanied with a nascent lagging strand, Rep helicase (green shape) is recruited by PriC and unwinds the lagging strand to expose the ssDNA region for DnaB loading (the lower case).
Figure 2 with 2 supplements
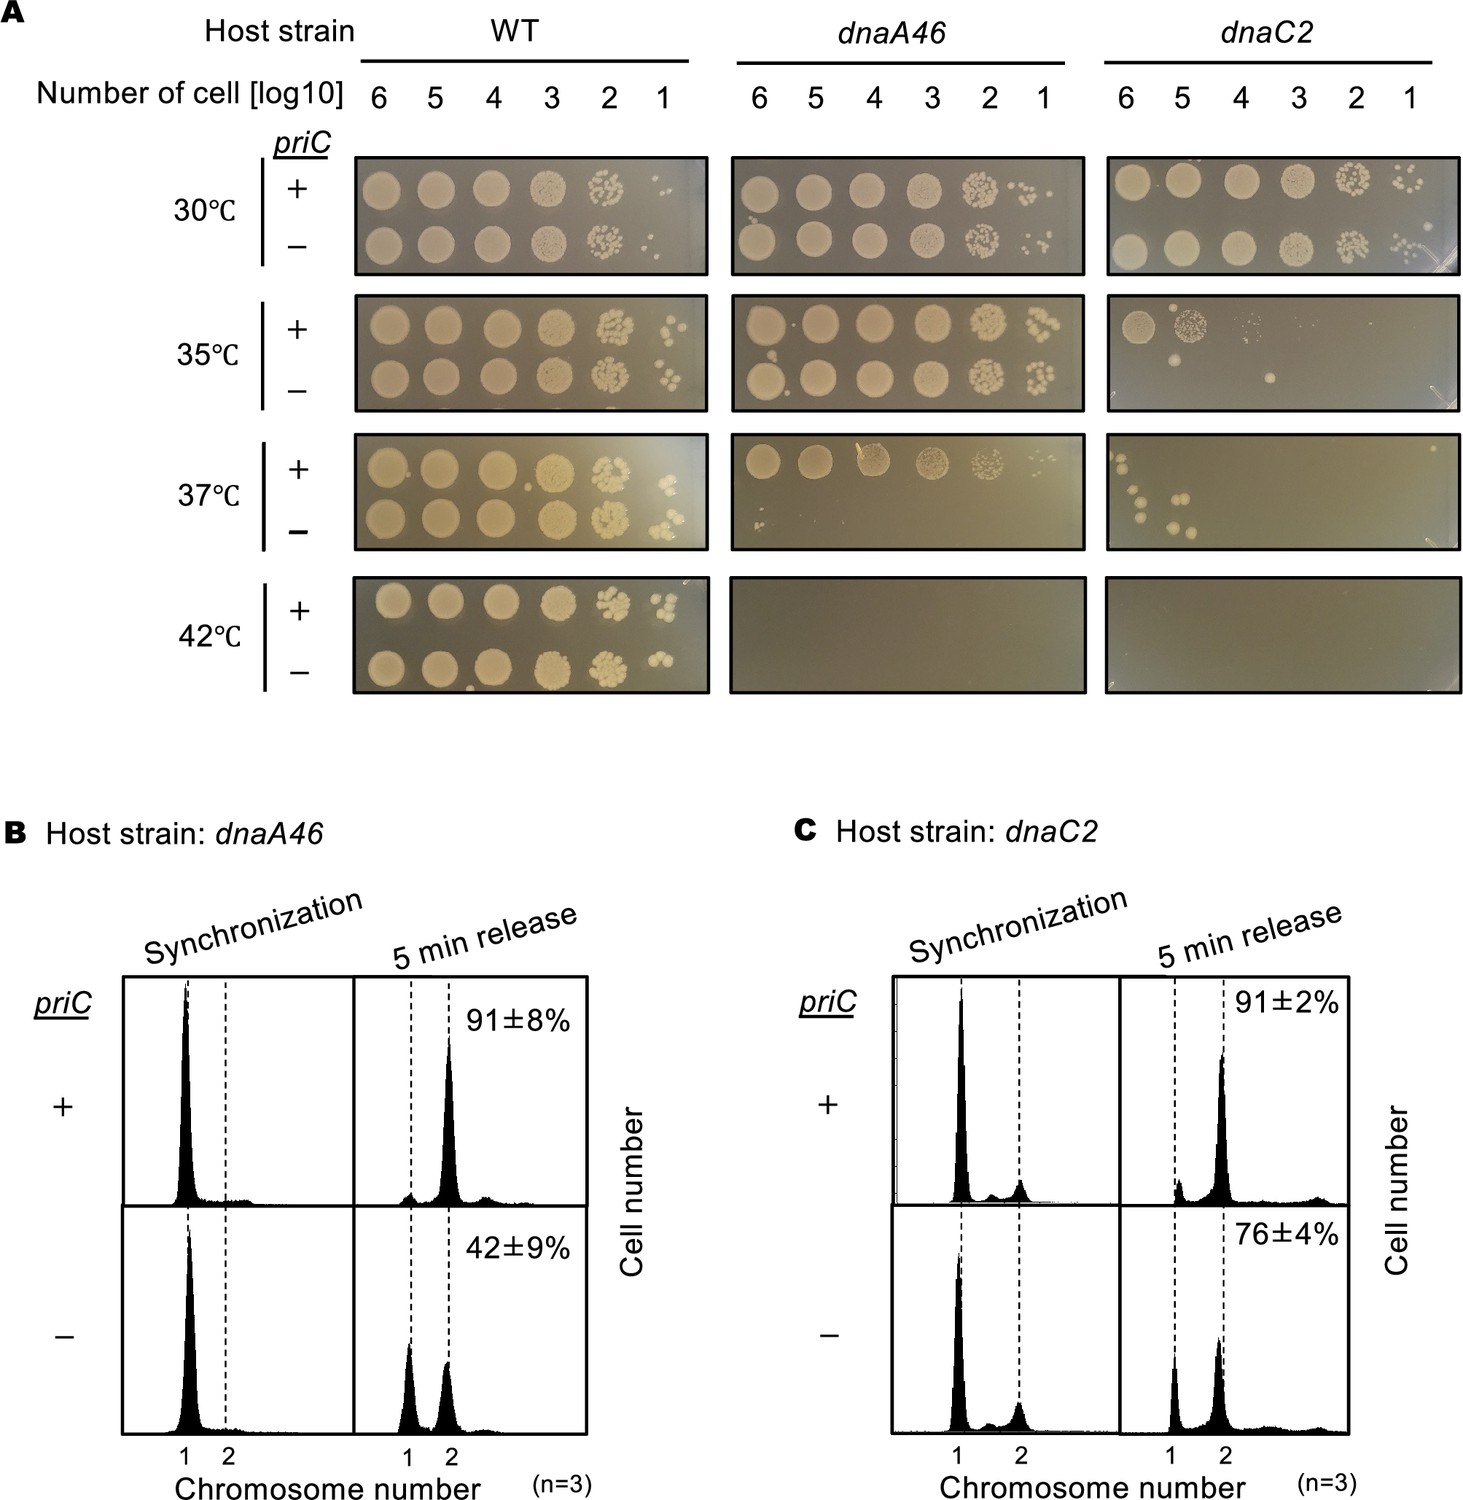
Requirement of priC for DNA replication initiation in dnaA46 and dnaC2 strains.
(A) Cell growth abilities. MG1655 and its derivatives MIT125 (MG1655 dnaA46 tnaA::Tn10), KYA018 (MG1655 dnaC2 zjj18::cat), KRC002 (MG1655 ∆priC::frt-kan), KRC004 (MG1655 dnaA46 tnaA::Tn10 ∆priC::frt-kan), and KRC005 (MG1655 dnaC2 zjj18::cat ∆priC::frt-kan) were grown overnight. 10-fold-serial dilutions of the overnight cultures (~109 cells/mL) were incubated for 16 hr at 30℃, or for 14 hr at 35/37/42℃ on LB agar medium. Three independent experiments were performed. +, WT priC; -, ∆priC::frt-kan. The images of representative plates are shown. (B) DNA replication initiation in synchronized dnaA46 cells with or without priC. Exponentially growing MIT125 (MG1655 dnaA46 tnaA::Tn10) (+) and KRC004 (MG1655 dnaA46 tnaA::Tn10 ∆priC::frt-kan) (-) cells were synchronized to the pre-initiation stage by incubation for 90 min at 42℃ in LB medium, followed by incubation for 5 min at 30℃ to initiate DNA replication, which was further followed by incubation with rifampicin and cephalexin for 4 hr at 42℃ to allow run-out of ongoing DNA replication. Samples were withdrawn after synchronization and run-out replication. The DNA contents of these samples were measured by flow cytometry. Representative histograms of three independent experiments are shown. For each sample, the mean number of cells with more than one chromosome equivalent after a 5 min release was quantified and is shown as a percentage with standard deviations. (C) DNA replication initiation in synchronized dnaC2 cells with or without priC. Exponentially growing KYA018 (MG1655 dnaC2 zjj18::cat) (+) and KRC005 (MG1655 dnaC2 zjj18::cat ∆priC::frt-kan) (-) cells were synchronized to the pre-initiation stage by incubation for 80 min at 37℃ in LB medium, followed by incubation for 5 min at 30℃ and further incubation with rifampicin and cephalexin as described above. Samples were withdrawn and analyzed as described above.
Figure 2—figure supplement 1
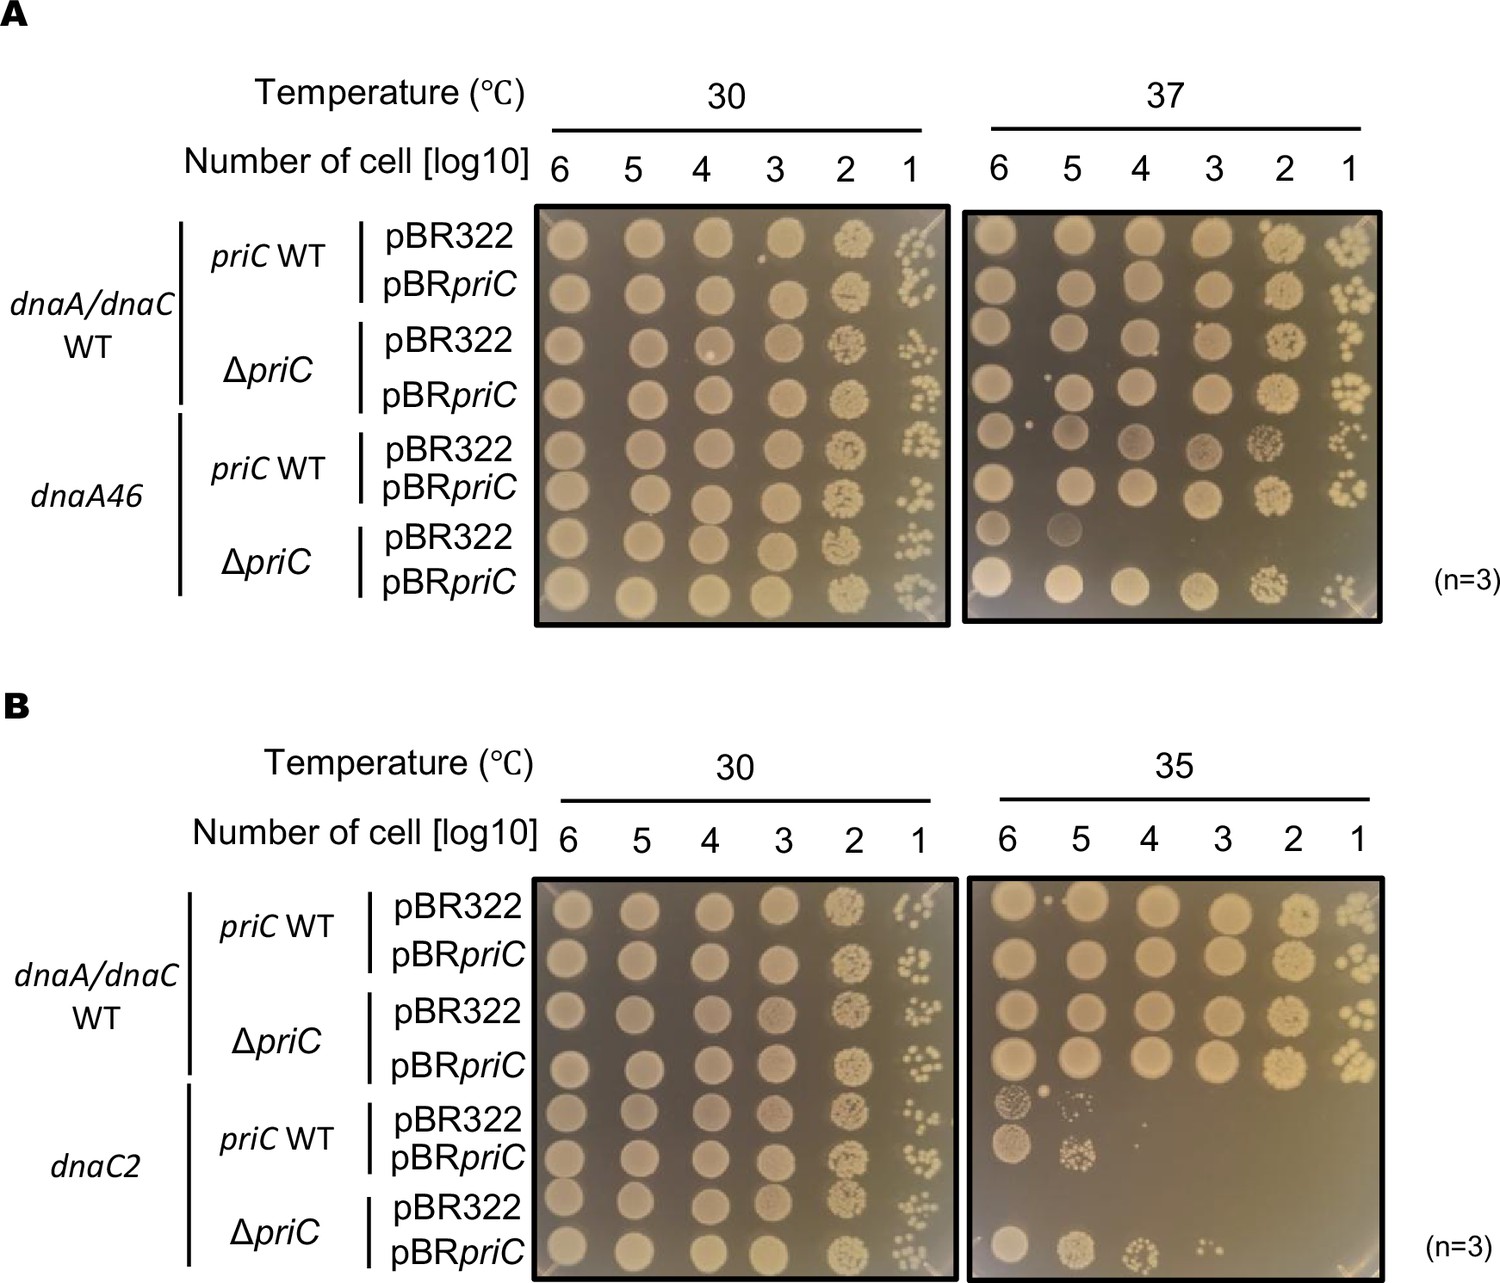
Role of PriC in cell growth of dnaA46 and dnaC2 cells.
pBR322 vector or pBR322 with priC (pBRpriC) was introduced into cells of MG1655 (dnaA/dnaC WT), KRC002 (MG1655 ∆priC::frt-kan), MIT125 (MG1655 dnaA46 tnaA::Tn10), or KRC004 (MG1655 dnaA46 tnaA::Tn10 ∆priC::frt-kan) (A). The same plasmids were also introduced into cells of MG1655, KRC002, KYA018 (MG1655 dnaC2 zjj18::cat), or KRC005 (MG1655 dnaC2 zjj18::cat ∆priC::frt-kan) (B). Independent transformants were assessed for the cell growth by spotting assays with incubation at the indicated temperatures for 24 hr on LB agar plates supplemented with 100 µg/ml ampicillin as described for Figure 2A.
Figure 2—figure supplement 2
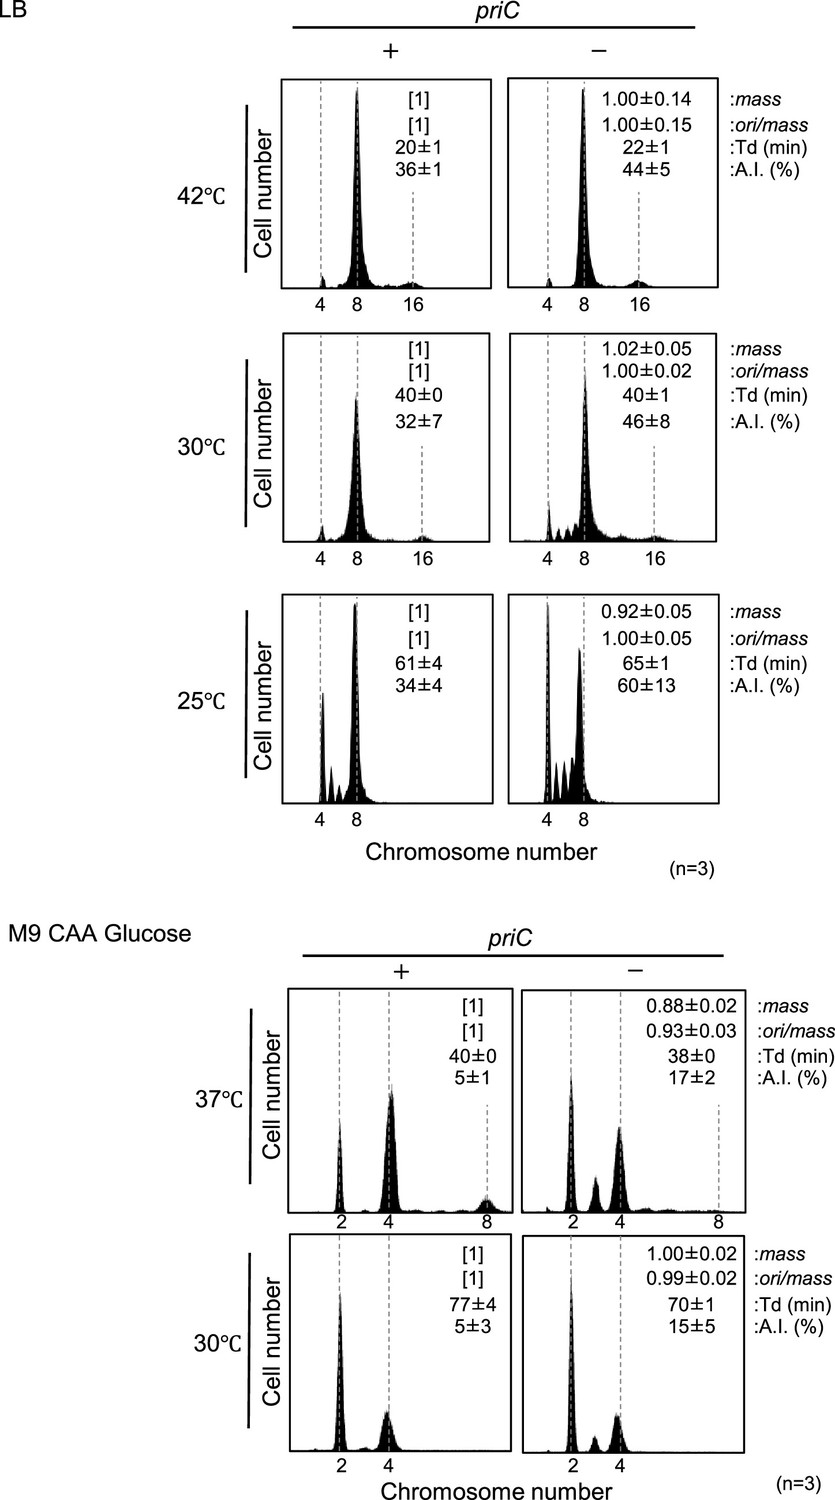
Role of PriC in cell growth of cells with wild-type (WT) DnaA and DnaC.
(A) Flow cytometry analyses of MG1655 and KRC002 (MG1655 ∆priC::frt-kan) cells in LB medium. Cells were exponentially grown at 25℃, 30℃, and 42℃ in LB medium, followed by further incubation with rifampicin and cephalexin to allow run-out replication of chromosomal DNA. DNA contents were quantified by flow cytometry, and cell size (mass) at the time of drug addition was measured by a Coulter counter. Mean mass, ori/mass ratio, doubling time (Td), and asynchrony index (A.I.: the percentage of cell numbers with non-2n copies of oriC per the cell numbers with 2n copies of oriC) of each strain are indicated at the top right of each panel with standard deviations. Three to four independent experiments were performed. +, WT priC; -, ∆priC::frt-kan. (B) Flow cytometry analyses of MG1655 and KRC002 (MG1655 ∆priC::frt-kan) cells in M9 minimal medium including 0.2% glucose and 0.2% casamino acids. Cells were grown and analyzed as described above. Three independent experiments were performed. For ‘priC’ column, +, WT priC; -, ∆priC::frt.
Figure 3 with 1 supplement

Role of PriC in growth of DnaA mutant defective in interactions with DnaB.
Cell growth of MIT125 (MG1655 dnaA46 tnaA::Tn10) and KRC004 (MG1655 dnaA46 tnaA::Tn10 ∆priC::frt-kan) cells bearing pING1 plasmid vector (-) or its derivatives pKA234 expressing wild-type (WT) DnaA (WT) or pFH expressing DnaA F46A H136A (F46A H136A). Cells were grown at 30 °C overnight and 10-fold serial dilutions of the cultures (~109 cells/mL) were incubated on LB agar plates containing ampicillin for 16 hr at 30 °C and for 14 hr at 42 °C, respectively. Four independent experiments were performed. +, WT priC; -, ∆priC::frt-kan.
Figure 3—figure supplement 1
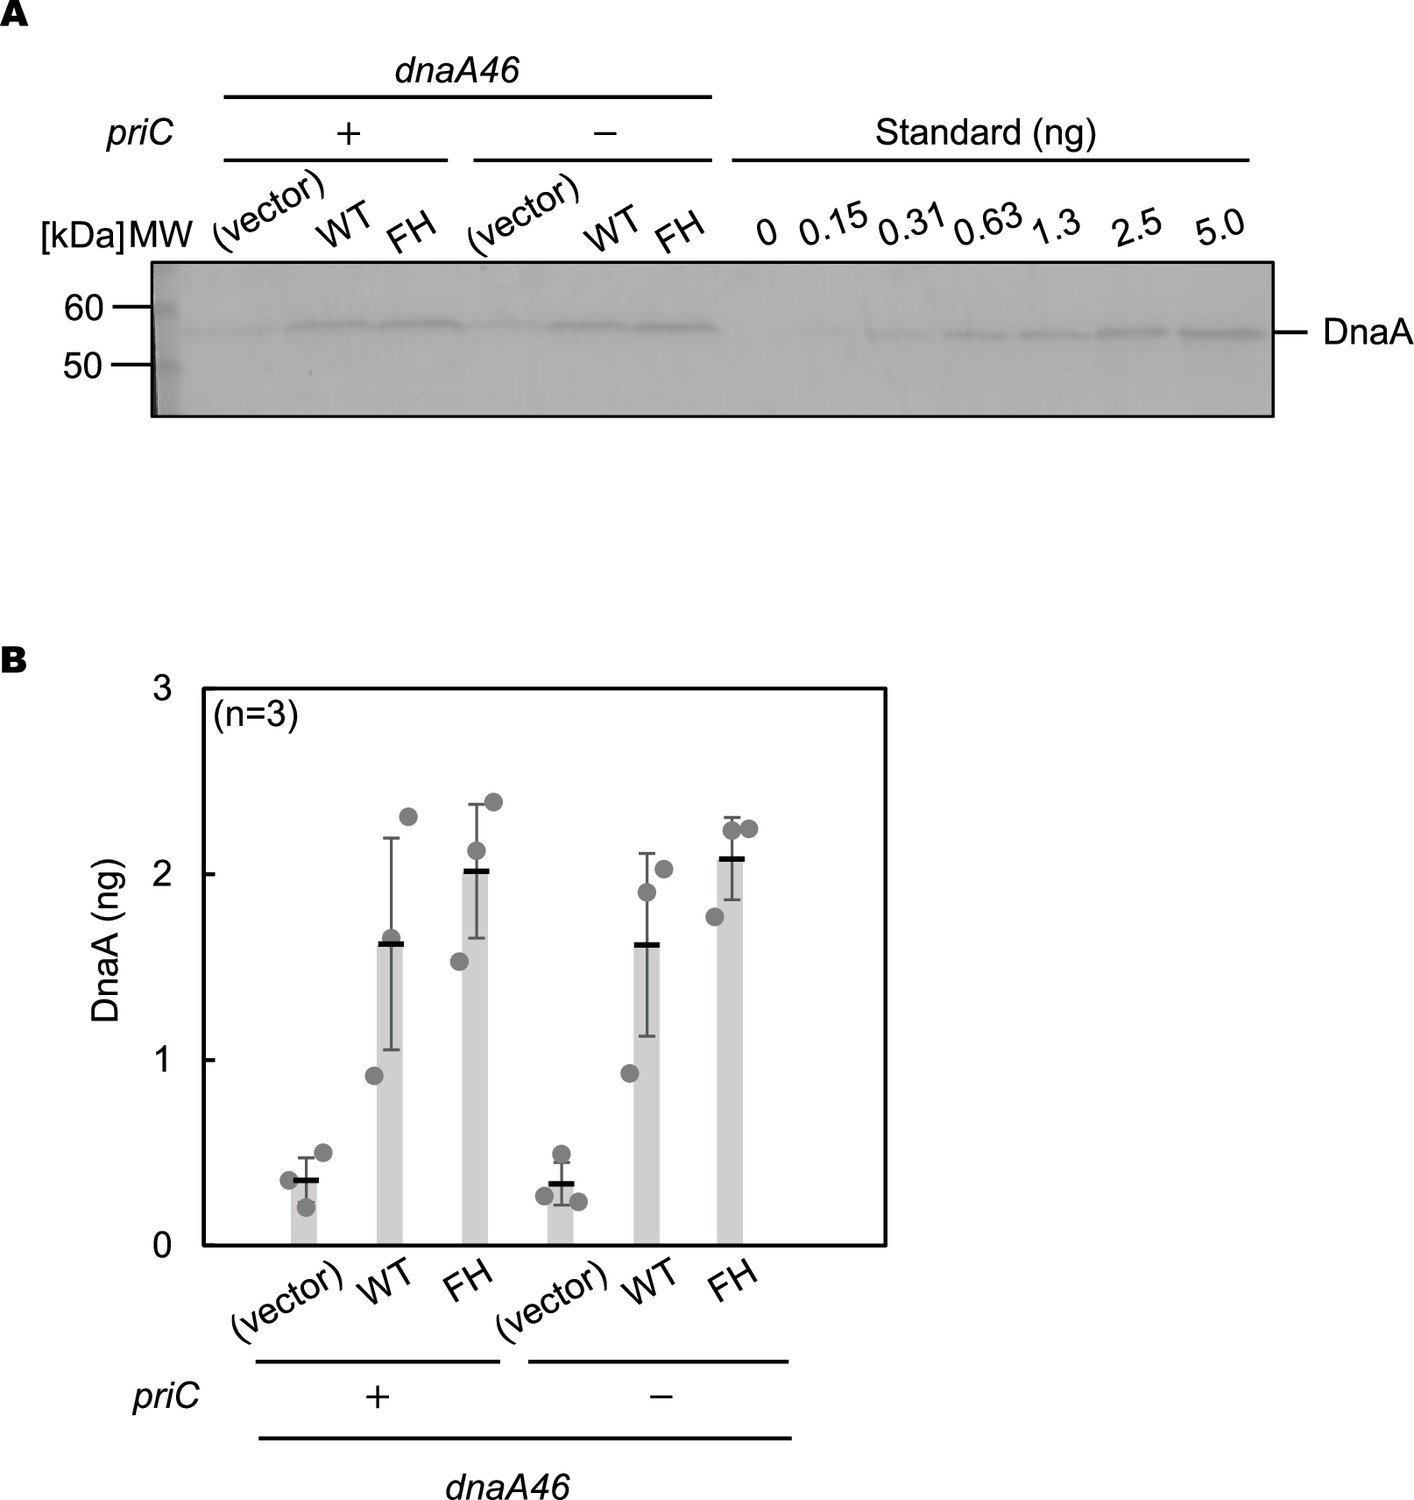
Immunoblot analysis for plasmid-encoded DnaA proteins in dnaA46 cells.
(A and B) Cells of MIT125 (MG1655 dnaA46 tnaA::Tn10) and KRC004 (MG1655 dnaA46 tnaA::Tn10 ∆priC::frt-kan) bearing pING1 (Vector), pKA234 (WT) or pFH (FH) were grown in LB medium including ampicillin at 30 °C until the absorbance of the culture (A600) reached 0.05, followed by incubation at 42 °C for 90 min. Immunoblot analysis was performed using anti-DnaA serum. Purified DnaA was also used as a quantitative standard. MW, molecular weight markers. A representative membrane image from three independent experiments is shown (A). Band intensities of each lane in the image were analyzed by densitometric scanning and the amounts of DnaA were deduced using the standard and shown as ‘DnaA (ng)’ (B). Means and standard deviations (SDs) are shown with each data.
-
Figure 3—figure supplement 1—source data 1
Original western blot corresponding to Figure 3—figure supplement 1A.
Colored protein size markers were used. Each lane is labeled as in the main text.
- https://cdn.elifesciences.org/articles/103340/elife-103340-fig3-figsupp1-data1-v1.zip
-
Figure 3—figure supplement 1—source data 2
Original western blot corresponding to Figure 3—figure supplement 1A.
- https://cdn.elifesciences.org/articles/103340/elife-103340-fig3-figsupp1-data2-v1.zip
Figure 4 with 1 supplement
PriC stimulation of DNA replication initiation inhibited by DiaA oversupply.
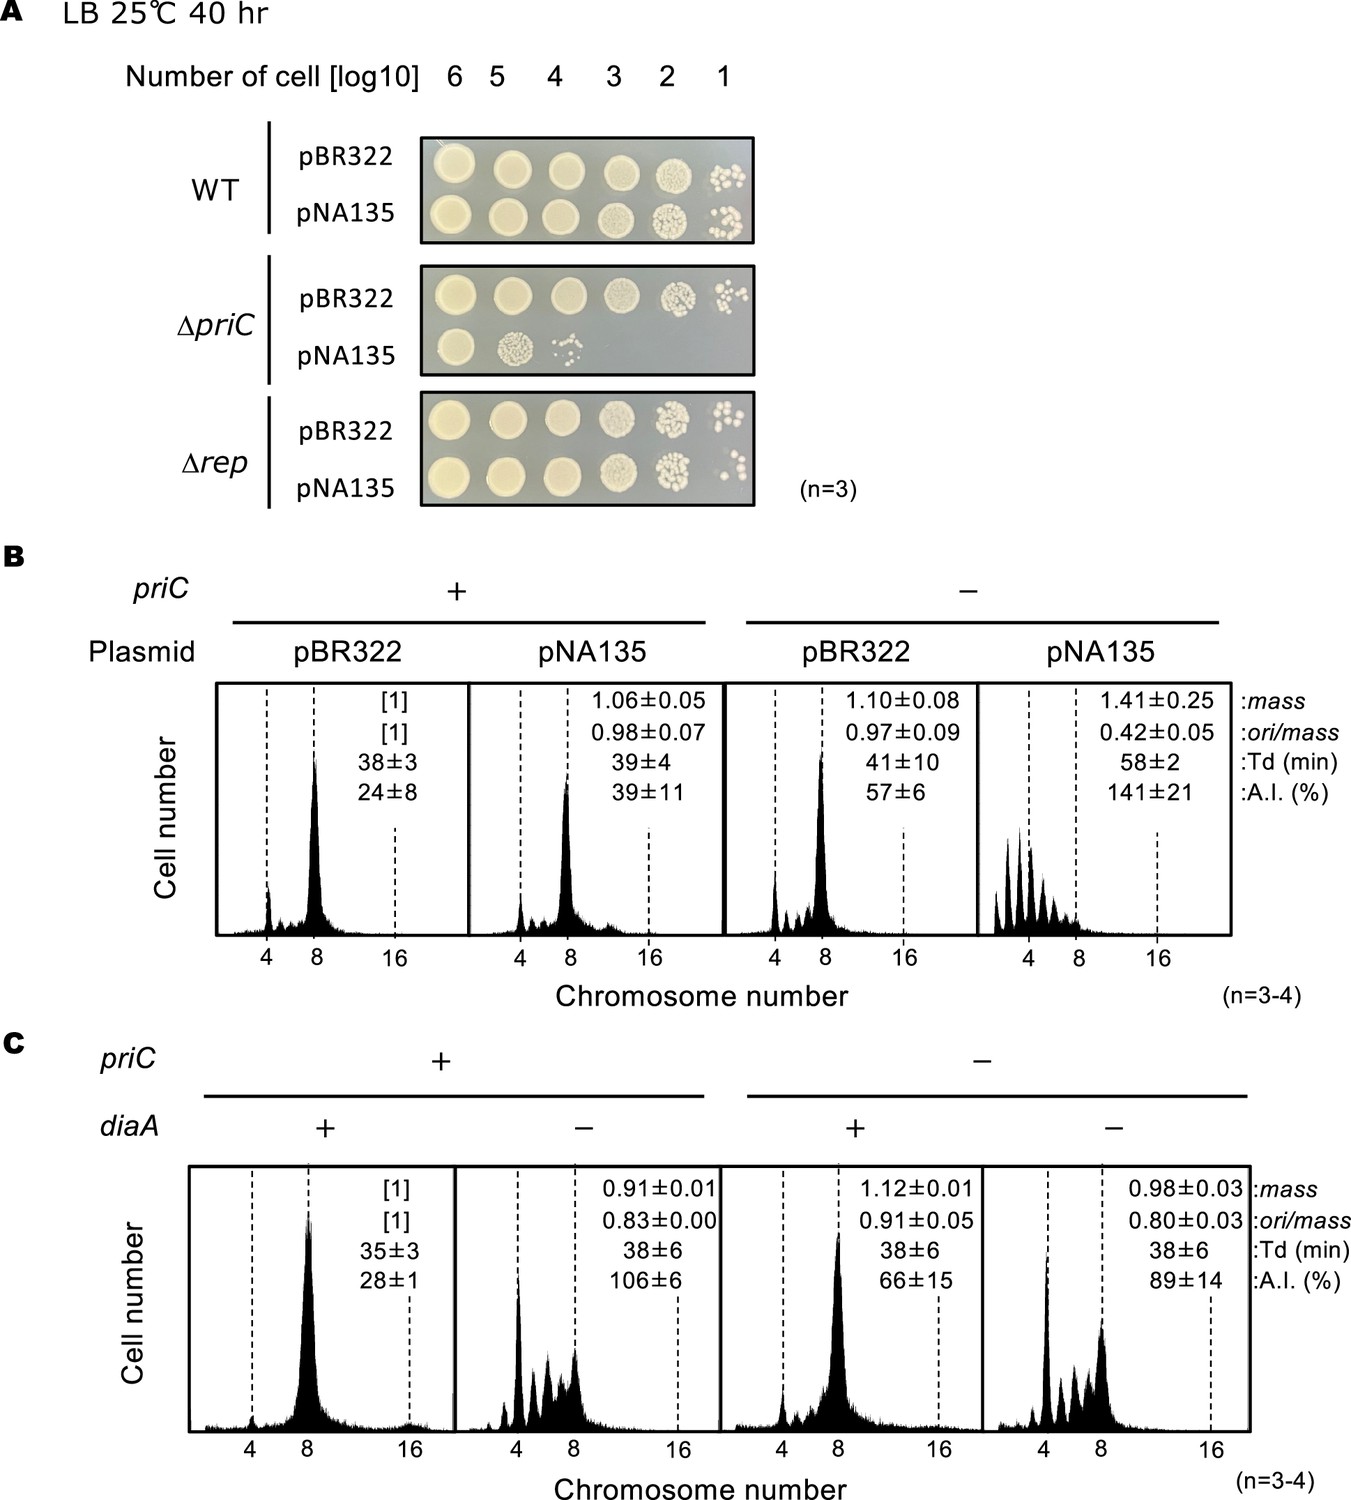
(A) Cell growth of MG1655, KRC002 (MG1655 ∆priC::frt-kan), and FF001 (MG1655 ∆rep::frt-kan) cells bearing pBR322 or pNA135 (pBR322 derivatives carrying diaA). Overnight cultures (~109 cells/mL) of MG1655 and KRC002 cells bearing pBR322 or pNA135 were 10-fold serially diluted and incubated on LB agar plates containing ampicillin for 40 hr at 25℃. The results of three independent experiments were consistent, and one which is shown. (B) Flow cytometry analyses of MG1655 and KRC002 (MG1655 ∆priC::frt-kan) cells bearing pBR322 or pNA135. Cells were exponentially grown at 30℃ in LB medium with ampicillin, followed by further incubation with rifampicin and cephalexin to allow run-out of chromosomal DNA replication. DNA contents were quantified by flow cytometry, and cell size (mass) at the time of drug addition was measured by a Coulter counter. Mean mass, ori/mass ratio, doubling time (Td), and asynchrony index (A.I.: the percentage of cell numbers with non-2n copies of oriC per the cell numbers with 2n copies of oriC) of each strain are indicated at the top right of each panel with standard deviations. Three to four independent experiments were performed. +, WT priC; -, ∆priC::frt-kan. (C) Flow cytometry analyses of MG1655, KRC003 (MG1655 ∆priC::frt), SA103 (MG1655 ∆diaA::frt-kan), and KRC006 (MG1655 ∆priC::frt, ∆diaA::frt-kan) cells. Cells were grown and analyzed as described above. Three independent experiments were performed. For ‘priC’ column, +, WT priC; -, ∆priC::frt. For ‘diaA’ column, +, WT diaA; -, ∆diaA::frt-kan.
Figure 4—figure supplement 1

Cell growth ability of cells carrying pBR322 or pNA135 with WT priC or ∆priC::frt-kan.
Cell growth of MG1655 or KRC002 (MG1655 ∆priC::frt-kan) cells bearing pBR322 or pNA135 (pBR322 derivatives carrying diaA). Overnight cultures (~109 cells/mL) of MG1655 and KRC002 cells carrying pBR322 or pNA135 were 10-fold serially diluted and incubated on LB agar plates containing ampicillin for 14 hr at 30–42℃. +, WT priC; -, ∆priC::frt-kan. The results of three independent experiments were consistent, and one representative result is shown.
Figure 5
Stimulation of replication initiation by PriC in Right-DnaA subcomplex-defective cells.
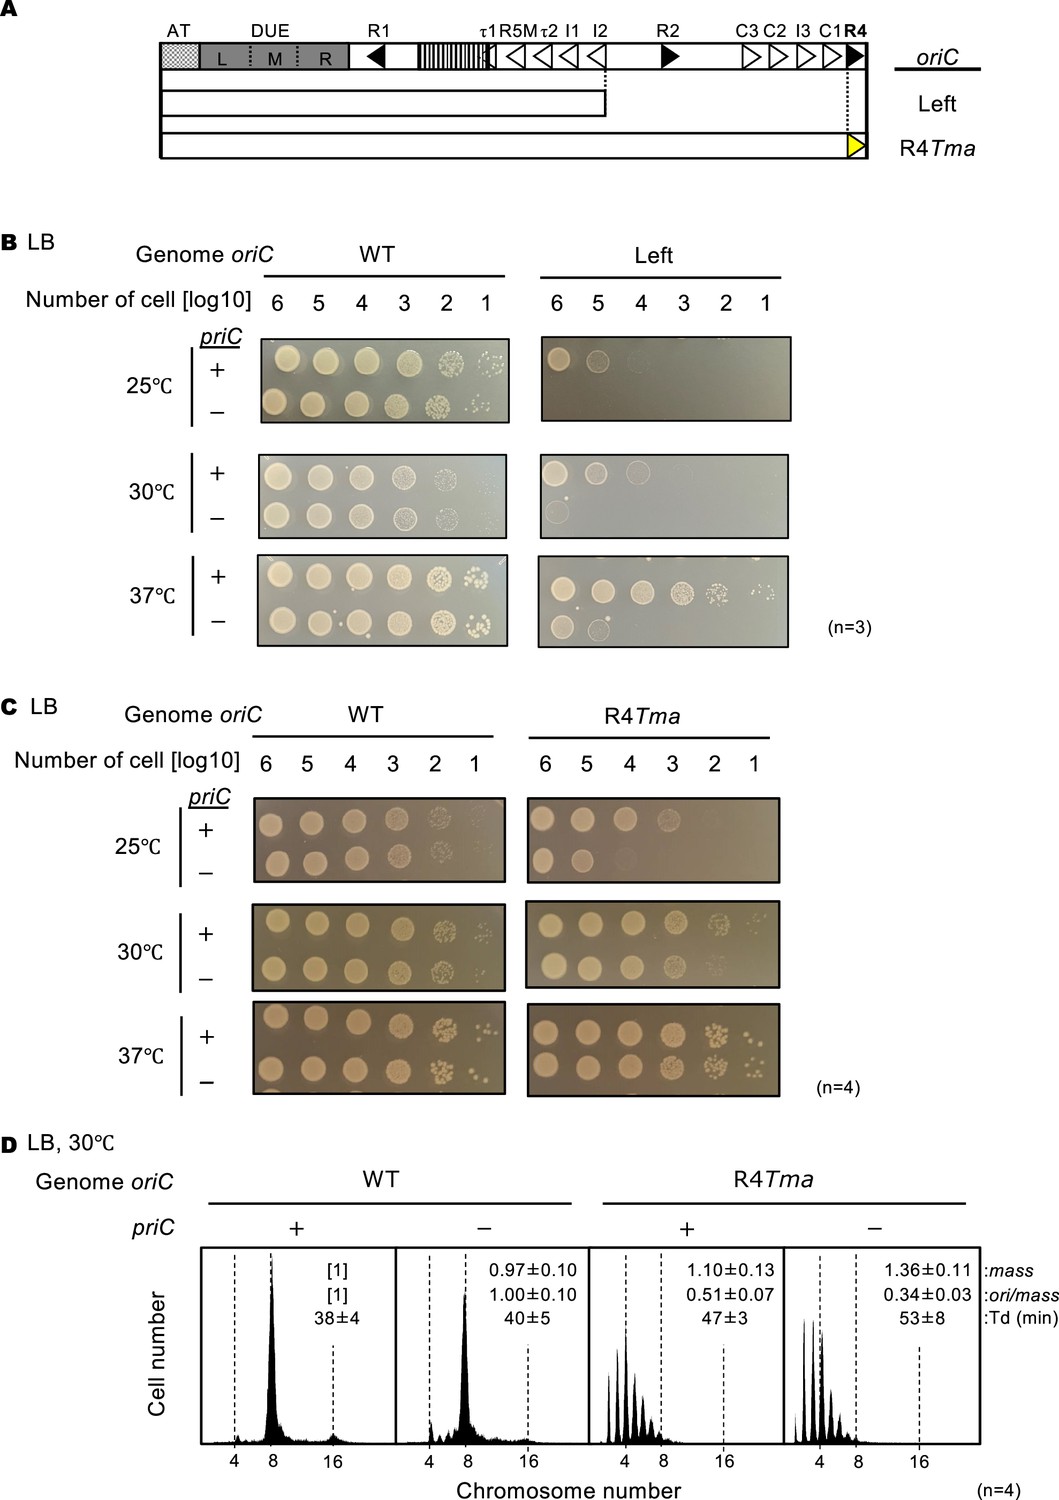
(A) Schematic structure of Left-oriC and R4Tma oriC. AT-rich region, Duplex-Unwinding Element (DUE), and DnaA-Oligomerization Region (DOR) are indicated by a gray dotted box, a gray box, and an open box, respectively. Filled and open arrowheads in the DOR show DnaA boxes with the full consensus sequence or mismatches. In addition, a striped box indicates the IBR. The regions of each mutant oriC are indicated below the structure as open boxes. The position of the TmaDnaA box substitution is indicated by a yellow arrowhead. (B) Cell growth of WT oriC and Left-oriC cells with or without priC. Overnight cultures (~109 cells/mL) of NY20-frt (WT oriC; WT) and NY20L-frt (Left-oriC; Left) cells with (+) or without (-) priC were 10-fold serially diluted and incubated on LB agar plates for 24 hr at 25 °C, for 16 hr at 30 °C, and for 14 hr at 37 °C. +, WT priC; -, ∆priC::frt-kan. Three independent experiments were performed. (C) Cell growth of WT oriC and oriC R4-box mutant cells with or without priC. NY20-frt (WT oriC) and NY24-frt (oriC with R4Tma substitution, R4Tma) cells with (+) or without (-) priC were grown as described in panel A. +, WT priC; -, ∆priC::frt-kan. Four independent experiments were performed. (D) Flow cytometry analyses of WT and R4Tma cells with or without priC. Cells were exponentially grown at 30℃ in LB medium with ampicillin and analyzed as described in Figure 4. Representative histograms from four independent experiments are shown. Mean mass, ori/mass, and Td of each strain are indicated at the top right of each panel with standard deviations.
Figure 6
Stimulation of replication initiation by PriC in cells with a deletion in the ssDNA-expanding region of oriC.
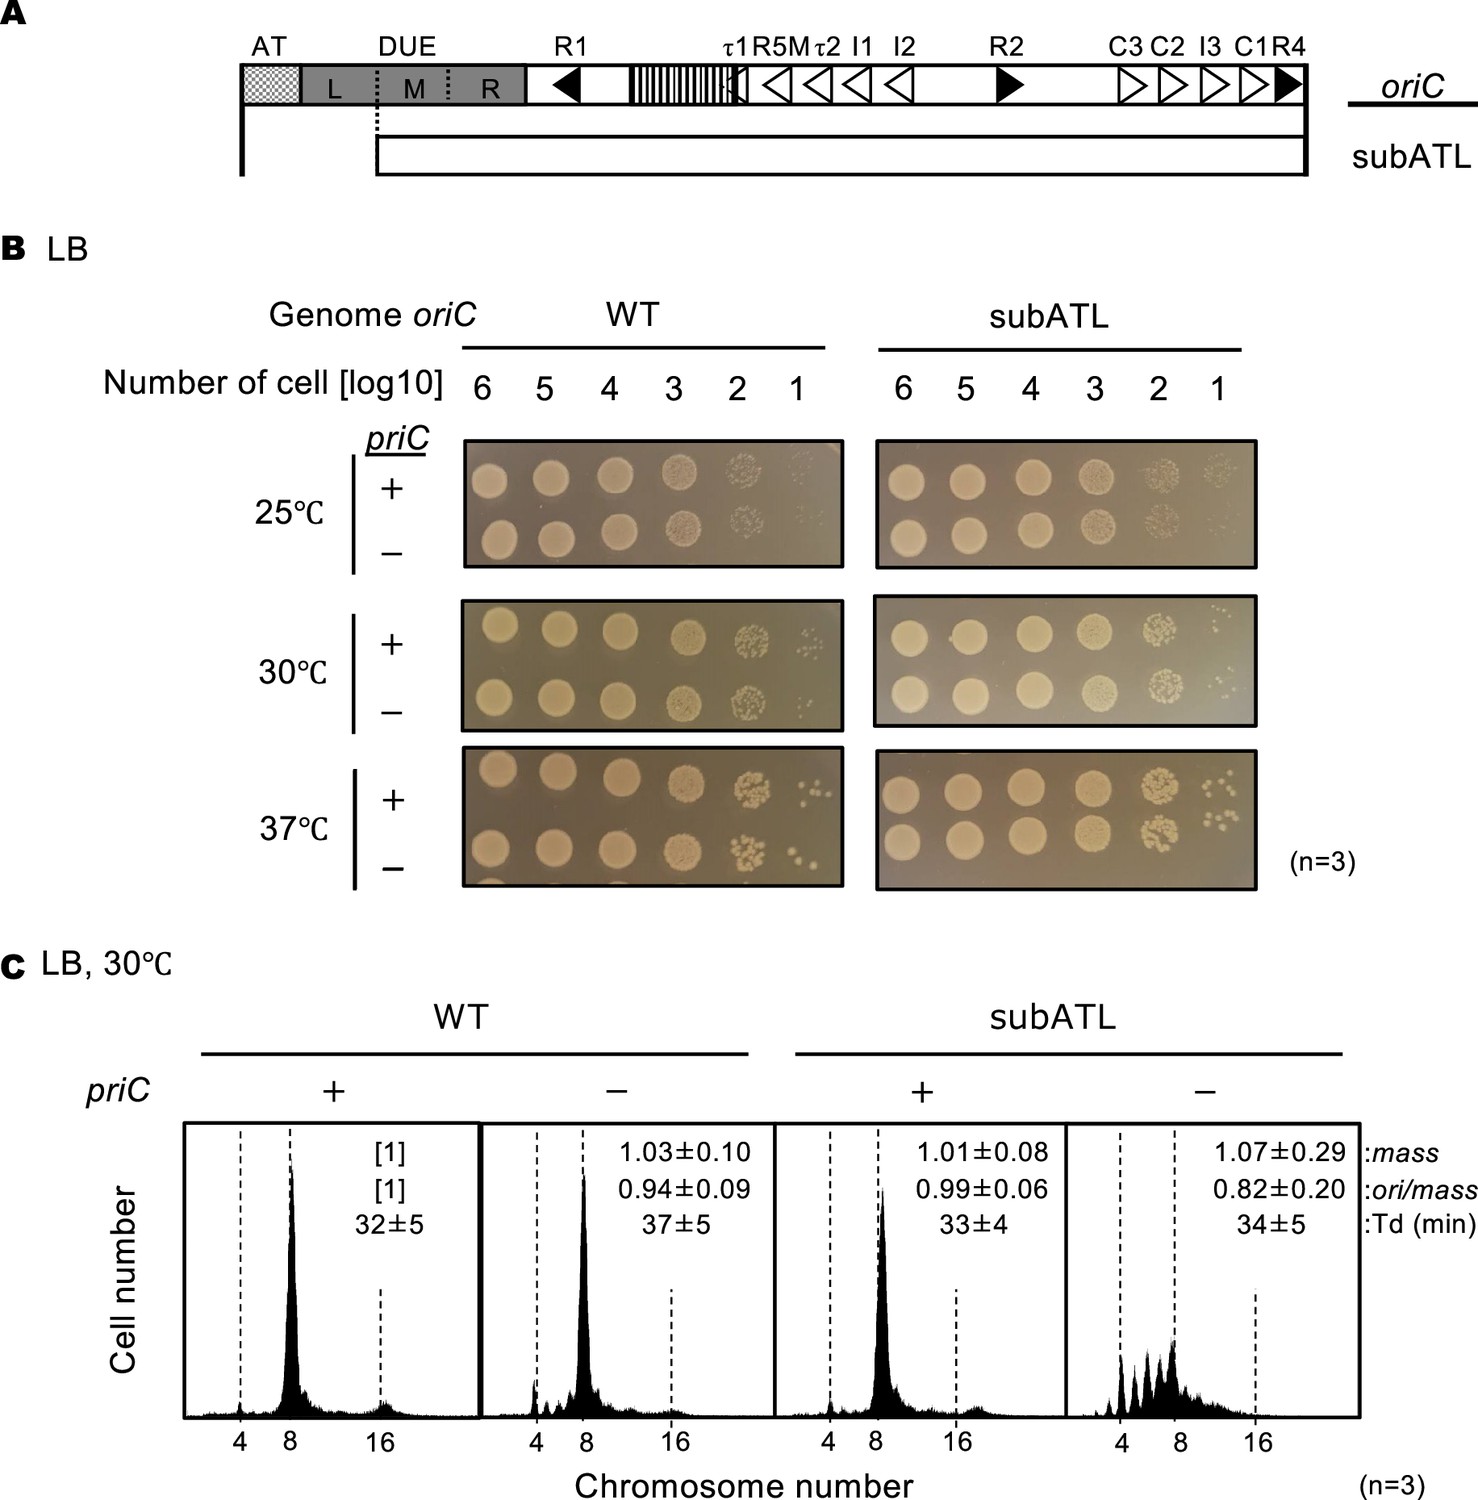
(A) Schematic structure of subATL oriC as shown in Figure 5. The oriC region, including the subATL oriC is indicated below the structure as a white box. (B) Cell growth of wild-type (WT) oriC and oriC subATL mutant cells with or without WT priC. NY20-frt (WT oriC) and NY20ATL-frt (oriC lacking AT and L sequences, subATL) with (+) or without (-) WT priC were grown as described in Figure 5. +, WT priC; -, ∆priC::frt-kan. Three independent experiments were performed. (C) Flow cytometry analyses of WT oriC and oriC subATL mutant cells with or without WT priC. Cells were exponentially grown at 30℃ in LB medium and analyzed as described in Figure 4. Representative histograms from three independent experiments are shown. Mean mass, ori/mass, and Td of each strain are indicated at the top right of each panel with standard deviations.
Figure 7 with 1 supplement
DnaB loading onto the ssDUE by PriC.
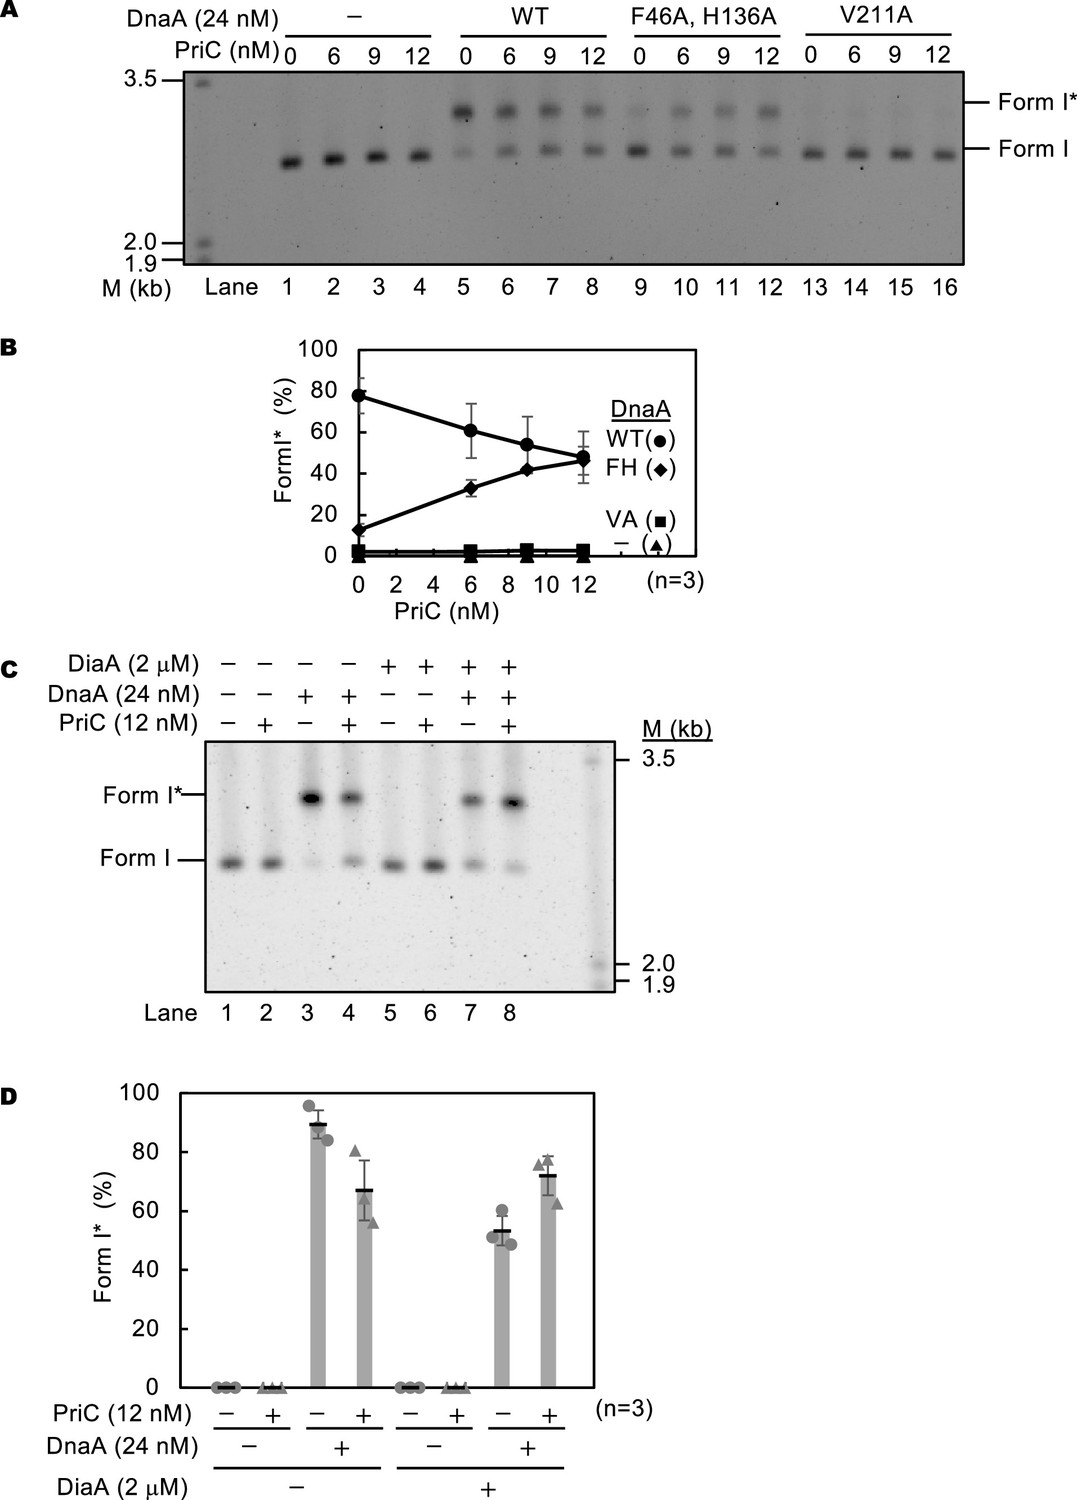
(A and B) In vitro reconstituted system for DnaB loading. Form I of oriC plasmid (pBSoriC; 1.6 nM) was incubated for 15 min at 30℃ with the indicated amount of PriC in the presence of ATP-DnaA or its mutant derivatives, DnaB, DnaC, IHF, gyrase, and Single-Stranded DNA Binding protein (SSB). The resulting plasmids were purified and analyzed using agarose gel electrophoresis. A representative image of three independent experiments is shown in the black/white-inverted mode (A). In panel A, the size markers of linear dsDNA (M) are also shown. Band intensities of each lane in the gel image were analyzed by densitometric scanning. The percentages of form I* oriC plasmid per input DNA are shown as ‘Form I* (%)’. Mean and standard deviations are shown (B). Abbreviations in panel B: -, no addition of DnaA; WT, wild-type DnaA; FH, DnaA F46A H136A; VA, DnaA V211A. (C and D) In vitro reconstituted system containing DiaA. Form I of pBSoriC plasmid was used as described above except for the addition of the indicated amounts of DiaA. A representative image of three independent experiments is shown in black/white-inverted mode (C). In panel C, the size markers of linear dsDNA (M) are also shown. Band intensities of each lane in the gel image were analyzed by densitometric scanning. The percentages of form I*oriC plasmid together with the mean and standard deviations are shown as described above (D).
-
Figure 7—source data 1
Original gels corresponding to Figure 7, panels A (Upper gel) and C (Lower gel).
Lambda DNA markers were employed. Each lane shown is labeled as that in the main text.
- https://cdn.elifesciences.org/articles/103340/elife-103340-fig7-data1-v1.zip
-
Figure 7—source data 2
Original gel image corresponding to Figure 7A.
- https://cdn.elifesciences.org/articles/103340/elife-103340-fig7-data2-v1.zip
-
Figure 7—source data 3
Original gel image corresponding to Figure 7B.
- https://cdn.elifesciences.org/articles/103340/elife-103340-fig7-data3-v1.zip
Figure 7—figure supplement 1
Duplex-Unwinding Element (DUE) unwinding activities of DnaA mutant derivatives in the presence and absence of PriC.
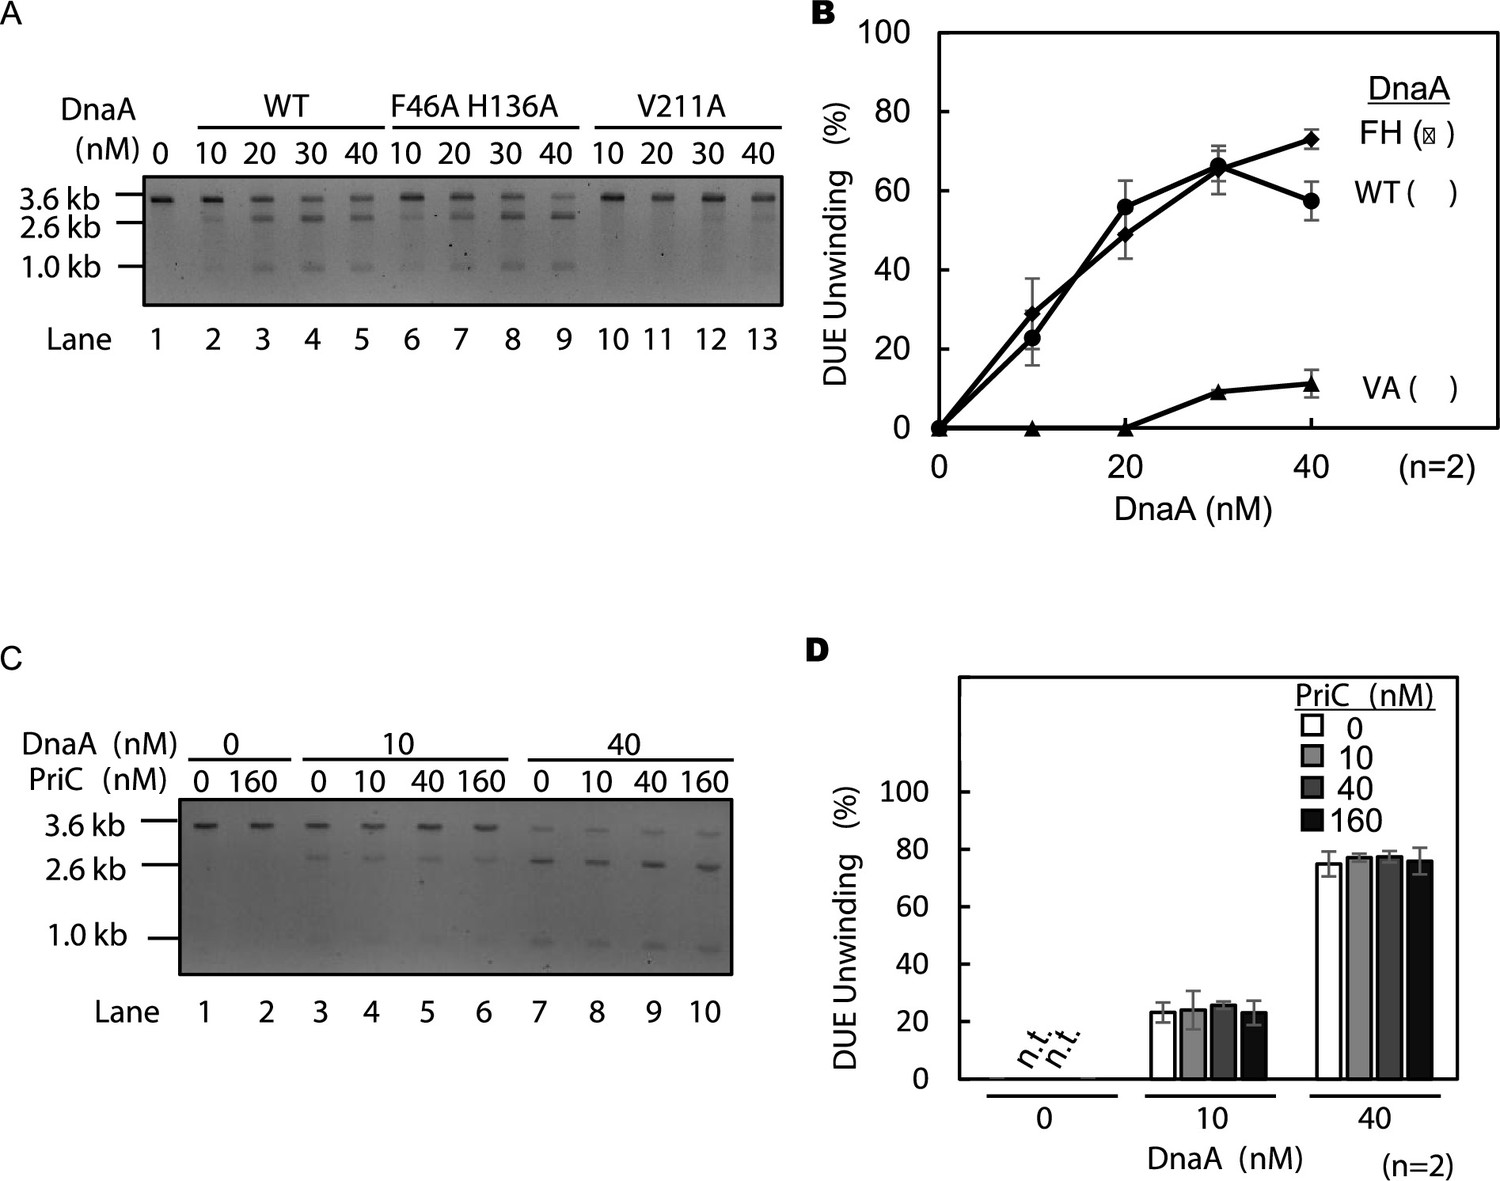
(A and B) in vitro DUE unwinding assays using DnaA mutant derivatives. Form I of oriC (pBSoriC; 1.6 nM) was incubated for 9 min at 30℃ with the indicated amount of DnaA or its mutant derivatives in the presence of IHF (42 nM), followed by incubation with P1 nuclease (1.5 units) and further incubation with AlwNI before agarose gel electrophoresis. Note that 2.6 kb and 1.0 kb fragments are observed with restriction enzyme digestion when the ssDNA-specific P1 nuclease cleaves 3.6 kb pBSoriC at the DUE. A representative image of two independent experiments is shown in black/white-inverted mode (A). The sizes of each band are indicated at the left side of the image. Band intensities of each lane in the gel image were analyzed by densitometric scanning. The percentages of P1 nuclease-digested oriC DNA per input DNA molecules are shown as ‘DUE unwinding (%).’ Mean and data are shown (B). Abbreviations in panel B: -, no addition of DnaA; WT, wild-type DnaA; FH, DnaA F46A H136A; VA, DnaA V211A. (C and D) In vitro DUE unwinding assay with PriC. pBSoriC was used as described above except for PriC addition. A representative image of two independent experiments is shown in black/white-inverted mode (C). Data were analyzed as described above (D). n.t., not tested.
-
Figure 7—figure supplement 1—source data 1
Original gels corresponding to Figure 7—figure supplement 1A and C.
Lambda DNA markers were employed. Each lane is labeled as in the main text.
- https://cdn.elifesciences.org/articles/103340/elife-103340-fig7-figsupp1-data1-v1.zip
-
Figure 7—figure supplement 1—source data 2
Original gel image corresponding to Figure 7—figure supplement 1A.
- https://cdn.elifesciences.org/articles/103340/elife-103340-fig7-figsupp1-data2-v1.zip
-
Figure 7—figure supplement 1—source data 3
Original gel image corresponding to Figure 7—figure supplement 1C.
- https://cdn.elifesciences.org/articles/103340/elife-103340-fig7-figsupp1-data3-v1.zip
Figure 8 with 1 supplement
PriC stimulation of constitutive stable DNA replication (cSDR)-dependent cell growth.
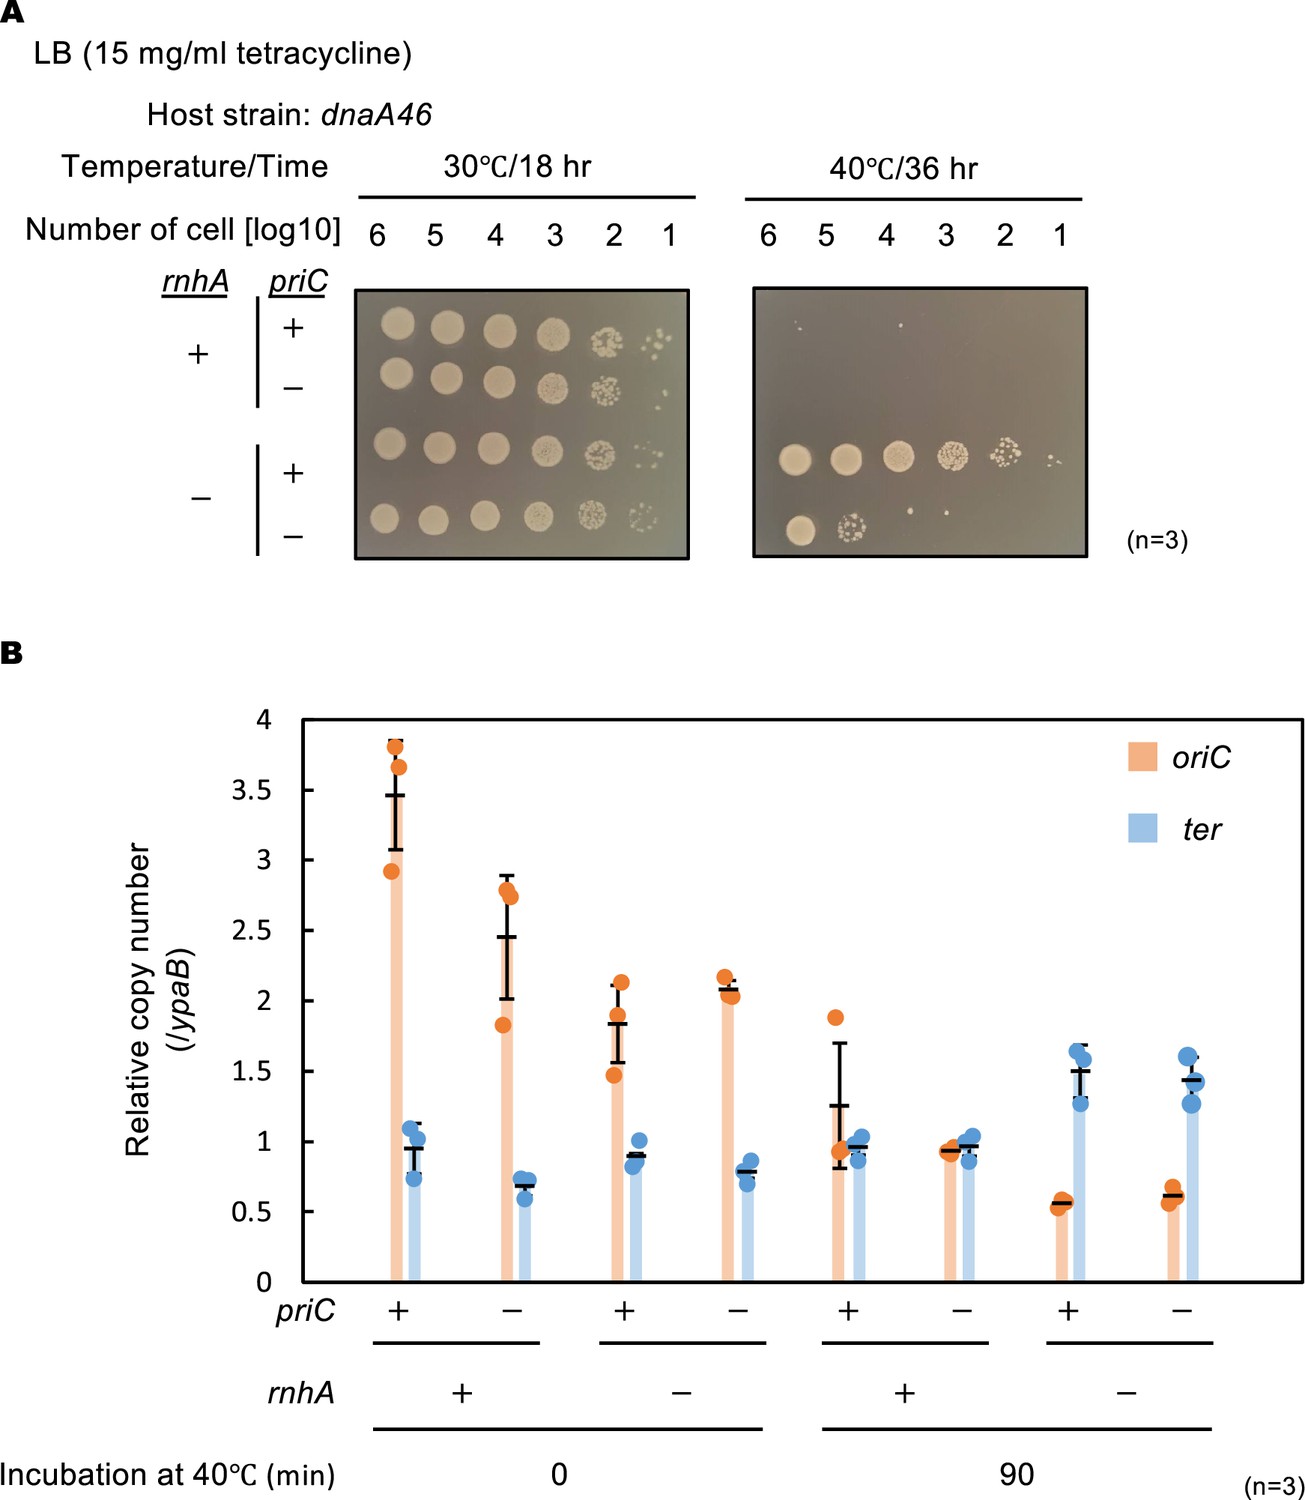
(A) Cell growth abilities. Cells of MIT125 (MG1655 dnaA46), MIT125c (MG1655 dnaA46 rnhA::cat), KRC004 (MG1655 dnaA46 ∆priC::frt-kan), and KRC004c (MG1655 dnaA46 ∆priC::frt-kan rnhA::cat) were grown at 30℃ overnight and 10-fold-serial dilutions of the overnight cultures (~109 cells/mL) were incubated for 16 h at 30℃ and for 36 hr at 40℃ on LB agar plates. Three independent experiments were performed. +, WT; -, deletion. (B) oriC and ter copy numbers. MIT125, MIT125c, KRC004, and KRC004c cells growing exponentially at 30℃ were further incubated for 90 min at 40℃ in LB medium. Samples were withdrawn before and after the 40℃ incubation. The genome DNA of each sample was extracted by boiling the cells for 5 min at 95℃. The relative copy numbers of oriC (84.6 min) and ter (32.4 min) to that of ypaB (50.5 min) were quantified using real-time qPCR. The data and averages of three independent experiments are shown with standard deviations.
Figure 8—figure supplement 1
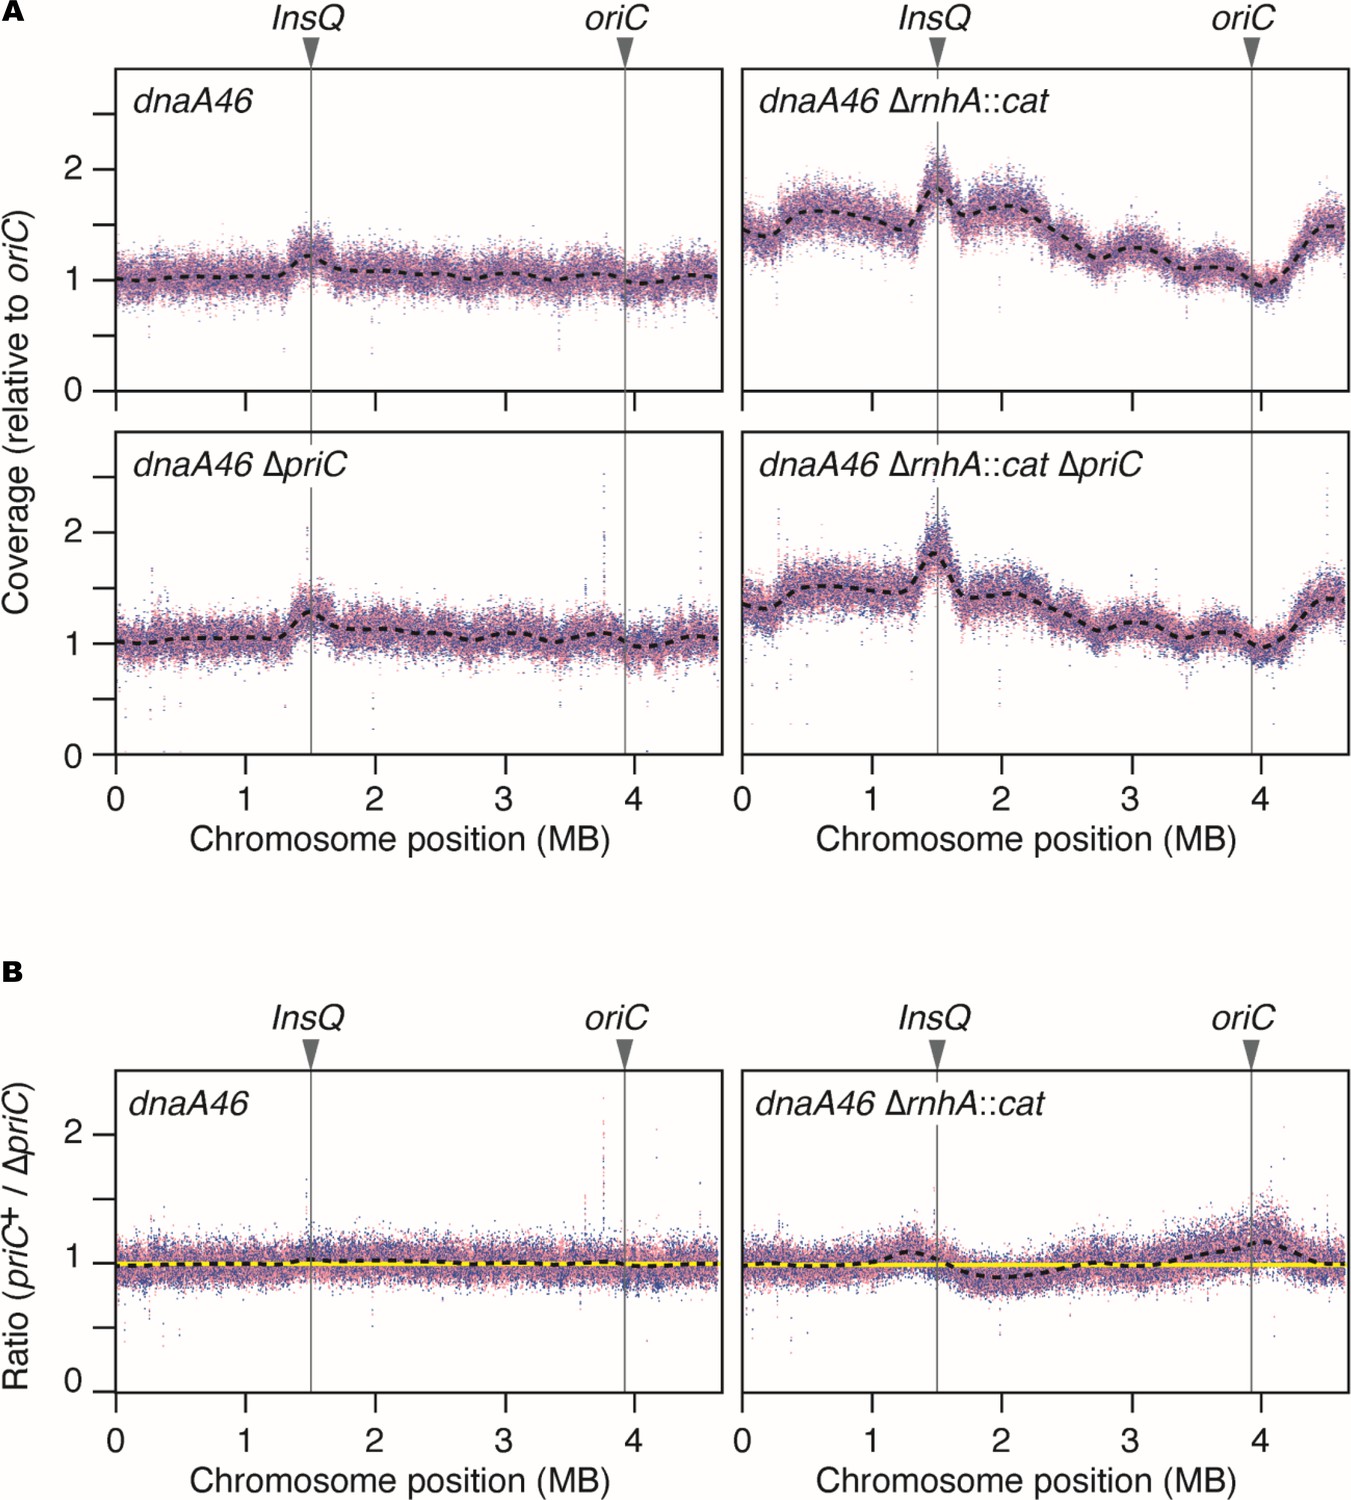
Chromosome loci copy-number analysis of dnaA46 mutant cells and its derivative cells.
(A) Coverage of aligned sequence reads. MIT125, MIT125c, KRC004, and KRC004c cells were exponentially grown in LB medium at 30 °C, followed by incubation for 90 min at 40 °C. Chromosomal DNA from each sample was extracted and analyzed using whole-genome sequencing. Coverage was calculated for every 250 bp window and plotted, with the coverage at the oriC region normalized to 1.0. Dotted splines represent coverage profiles based on the combined data from two biological replicates, shown in different colors (red and blue). (B) Relative coverage. The coverage for each 250 bp window in priC+ cells was divided by that in ∆priC cells, and the resulting values were plotted as ‘relative coverage.’ Yellow lines indicate a value of 1.0.
Figure 9

Model for PriC-promoted replication initiation.
PriC-promoted rescue of blocked DnaA-oriC-dependent replication initiation. oriC, DnaA, IHF, DnaB, and DnaC are illustrated as depicted in Figure 1C. When tight DnaA binding of DiaA (dark gray circle) (or DnaA F46A H136A double mutations) inhibits DnaB recruitment, PriC (Brilliant red circle) binds to a stably unwound DUE strand, recruiting a DnaB-DnaC complex to lower strand of DUE instead of Left-DnaA subcomplex. When a sufficient ssDNA region is exposed, PriC then recruits the DnaB-DnaC complex to the opposite strand.
Author response image 1

Tables
Appendix 1—key resources table
| Reagent type (species) or resource | Designation | Source or reference | Identifiers | Additional information |
|---|---|---|---|---|
| Strain, strain background (Escherichia coli) | BW25113 ∆priC::frt-kan | Keio collection | JW0456-KC | |
| Strain, strain background (Escherichia coli) | BW25113 ∆rep::frt-kan | Keio collection | JW5604-KC | |
| Strain, strain background (Escherichia coli) | MG1655 dnaC2 zjj18::cat | Kasho and Katayama, 2013 | KYA018 | |
| Strain, strain background (Escherichia coli) | MG1655 dnaA46 tnaA::Tn10 | Noguchi and Katayama, 2016 | MIT125 | |
| Strain, strain background (Escherichia coli) | MG1655 rnhA::cat | Noguchi and Katayama, 2016 | MIT162 | |
| Strain, strain background (Escherichia coli) | MG1655 ∆diaA::frt-kan | Noguchi and Katayama, 2016 | SA103 | |
| Strain, strain background (Escherichia coli) | MG1655 ∆priC::frt-kan | This work | KRC002 | MG1655 x P1 JW0456-KC |
| Strain, strain background (Escherichia coli) | MG1655 ∆priC::frt | This work | KRC003 | KRC002 x pCP20 |
| Strain, strain background (Escherichia coli) | MIT125 ∆priC::frt-kan | This work | KRC004 | MIT125 x P1 JW0456-KC |
| Strain, strain background (Escherichia coli) | KYA018 ∆priC::frt-kan | This work | KRC005 | KYA018 x P1 JW0456-KC |
| Strain, strain background (Escherichia coli) | KRC003 ∆diaA::frt-kan | This work | KRC006 | KRC003 x P1 SA103 |
| Strain, strain background (Escherichia coli) | MG1655 ∆rep::frt-kan | This work | FF001 | MG1655 x P1 JW5604-KC |
| Strain, strain background (Escherichia coli) | MG1655 asnA::frt-kan | Noguchi et al., 2015 | NY20 | |
| Strain, strain background (Escherichia coli) | MG1655 asnA::frt-kan oriC∆R4 box::TmaDnaA box | Noguchi et al., 2015 | NY21 | |
| Strain, strain background (Escherichia coli) | MG1655 asnA::frt-kan oriC∆Middle-Right DOR | This work | NY20L | |
| strain, strain background (Escherichia coli) | MG1655 asnA::frt-kan oriC∆AT-L region | This work | NY20ATL | |
| Strain, strain background (Escherichia coli) | MG1655 asnA::frt | Yoshida et al., 2023 | NY20-frt | |
| Strain, strain background (Escherichia coli) | MG1655 asnA::frt oriC∆R4 box::TmaDnaA box | This work | NY21-frt | NY21 x pCP20 |
| Strain, strain background (Escherichia coli) | MG1655 asnA::frt oriC∆Middle-Right DOR | This work | NY20L-frt | NY20L x pCP20 |
| Strain, strain background (Escherichia coli) | MG1655 asnA::frt oriC∆AT-L region | This work | NY20ATL-frt | NY20ATL x pCP20 |
| Strain, strain background (Escherichia coli) | NY20-frt ∆priC::frt-kan | This work | NY20-priC | NY20-frt x P1 KRC002 |
| Strain, strain background (Escherichia coli) | NY21-frt ∆priC::frt-kan | This work | NY21-priC | NY21-frt x P1 KRC002 |
| Strain, strain background (Escherichia coli) | NY20L-frt ∆priC::frt-kan | This work | NY20L-priC | NY20L-frt x P1 KRC002 |
| Strain, strain background (Escherichia coli) | NY20ATL-frt ∆priC::frt-kan | This work | NY20ATL-priC | NY20ATL-frt x P1 KRC002 |
| Strain, strain background (Escherichia coli) | MIT125 ∆rnhA::cat | This work | MIT125c | MIT125 x P1 MIT162 |
| Strain, strain background (Escherichia coli) | KRC004 ∆rnhA::cat | This work | KRC004c | KRC004 x P1 MIT162 |
| Antibody | anti-DnaA (Rabbit polyclonal) | Kawakami et al., 2005 | Immunoblot (1:3000) | |
| Antibody | Goat Anti-Rabbit IgG (H+L)-AP Conjugate | Bio-Rad | Cat. #1706518 | Immunoblot (1:3000) |
| Recombinant DNA reagent | pBRpriC (Plasmid) | This work | pBR322 encoding priC | |
| Recombinant DNA reagent | pING1 (Plasmid) | Johnston et al., 1985 | Vector bearing arabinose-inducible promoter | |
| Recombinant DNA reagent | pKA234 (Plasmid) | Kubota et al., 1997 | pING1 encoding dnaA | |
| Recombinant DNA reagent | pH136A (Plasmid) | Sakiyama et al., 2018 | pKA234 dnaA H136A | |
| Recombinant DNA reagent | pFH (Plasmid) | This study | pH136A mutated by Quick Change site-directed mutagenesis by primers F46A 1/2 | |
| Recombinant DNA reagent | pKW44-1 (Plasmid) | Ozaki et al., 2008 | pKA234 dnaA V211A | |
| Recombinant DNA reagent | pNA135 (Plasmid) | Ishida et al., 2004 | pBR322 bearing diaA gene | |
| Recombinant DNA reagent | pBSoriC (Plasmid) | Kawakami et al., 2005 | pBluescript bearing a 678 bp chromosome-derived region including oriC | |
| Recombinant DNA reagent | pET22b(+)-priC (Plasmid) | Aramaki et al., 2015 | pET22b(+) bearing priC under the T7 promoter | |
| Recombinant DNA reagent | pTKM601 (Plasmid) | Keyamura et al., 2007 | pBAD/HisB bearing diaA | |
| Sequence-based reagent | F46A 1 | Keyamura et al., 2009 | PCR primer | GTACGCGCCAAACCGCGCGGTCCTTCGATTG GGTACG |
| Sequence-based reagent | F46A 2 | Keyamura et al., 2009 | PCR primer | CGTACCCAATCGAAGGACCGCGCGGTTTGGCGCGTAC |
| Sequence-based reagent | ORI_1 | Kasho et al., 2014 | qPCR primer | CTGTGAATGATCGGTGATC |
| Sequence-based reagent | KWoriCRev | Kasho et al., 2014 | qPCR primer | GTGGATAACTCTGTCAGGAAGCTTG |
| Sequence-based reagent | qoriK fw | Brochu et al., 2018 | qPCR primer | CGAGACTTCAGCGACAGTTAAG |
| Sequence-based reagent | qoriK rev | Brochu et al., 2018 | qPCR primer | CCTGCGGATATTTGCGATACA |
| Sequence-based reagent | STM419 | This work | qPCR primer | CGGACACCTTGTCTGACCTAAG |
| Sequence-based reagent | STM420 | This work | qPCR primer | AGTGTGAAAATGACCCTCTTGC |
| Commercial assay or kit | AP Conjugate Substrate Kit | Bio-Rad | Cat #1706432 |
Additional files
Download links
A two-part list of links to download the article, or parts of the article, in various formats.
Downloads (link to download the article as PDF)
Open citations (links to open the citations from this article in various online reference manager services)
Cite this article (links to download the citations from this article in formats compatible with various reference manager tools)
Primosomal protein PriC rescues replication initiation stress by bypassing the DnaA-DnaB interaction step for DnaB helicase loading at oriC
eLife 13:RP103340.
https://doi.org/10.7554/eLife.103340.3


