Heterozygosity for neurodevelopmental disorder-associated TRIO variants yields distinct deficits in behavior, neuronal development, and synaptic transmission in mice
- Department of Molecular Biophysics and Biochemistry, Yale University, United States
- Department of Neuroscience, Yale School of Medicine, United States
- Interdepartmental Neuroscience Program, Yale University, United States
- Department of Gerontology, The Third Medical Center, Chinese PLA General Hospital, China
- Department of Comparative Medicine, Yale School of Medicine, United States
- Laboratory for Immunochemical Circuits, La Jolla Institute for Immunology, United States
- Department of Neurosurgery, Yale School of Medicine, United States
Figures
Figure 1 with 1 supplement

Genetically engineered mice with heterozygosity for K1431M, K1918X, or M2145T Trio variants have divergent effects on Trio protein expression and Rho GTPase activity.
(A) Schematic of major Trio isoforms present in the adult mouse brain, with locations of engineered neurodevelopmental disease (NDD)-associated Trio variants: K1431M is a rare missense variant in the GEF1 DH domain associated with autism spectrum disorder (ASD); a K1918X nonsense variant that lies just before the GEF2 domain associated with schizophrenia (SCZ); and M2145T missense variant in the GEF2 DH domain found in an individual with bipolar disorder (BPD). (B) Representative sequencing chromatograms of WT and Trio variant mice. Arrows indicate heterozygosity for the variant alleles. (C) Representative immunoblots for Trio in P0 brain lysates using an antibody against Trio spectrin repeats (SR5-6). (D) Quantification of Trio protein levels from P0 brain lysates. Trio protein levels are reduced only in the brains of +/K1918X mice compared to WT controls (0.545±0.126 of WT level, p=0.0046). (E–H) Activity levels of Rac1 (E,G) and RhoA (F,H) in whole brain homogenates of neonate (P0, E–F) and adult (P42, G–H) Trio variant mice as measured by G-LISA assay. Rac1 activity is increased in +/K1431M mice relative to WT at both ages (1.106±0.027 fold at P0, p=0.0035; 1.509±0.175 fold at P42, p=0.0279) and decreased in neonate +/K1918X mice (0.908±0.0.032 fold, p=0.0230), with a trend towards increased activity in adult +/M2145T mice (1.438±0.183 fold, p=0.0843); meanwhile, RhoA activity appears unchanged in all mice relative to WT, although there may be a trend towards decreased activity in +/K1918X neonates (0.840±0.074 fold, p=0.1292). (I,J) Activity levels of Rac1 (I) and RhoA (J) in synaptosomes isolated from P42 mouse cortex. Rac1 activity is increased in +/K1431M synaptosomes (1.125±0.107 fold, p=0.0023), while RhoA activity is decreased in +/M2145T synaptosomes (0.731±0.042 fold, p=0.0093) relative to WT. All data shown as mean ± SEM. For (D–J), one-way ANOVA with post-hoc Bonferroni MC test identified differences from WT (nsp <0.1, *p<0.05, **p<0.01). Mouse numbers per group are shown in bars.
-
Figure 1—source data 1
Full raw uncropped, unedited western blot files and Ponceau stains used for analysis displayed in Figure 1C and D.
- https://cdn.elifesciences.org/articles/103620/elife-103620-fig1-data1-v1.zip
-
Figure 1—source data 2
PDF file containing annotated original western blot files and Ponceau stains for Figure 1C and D.
- https://cdn.elifesciences.org/articles/103620/elife-103620-fig1-data2-v1.zip
Figure 1—figure supplement 1
Trio +/K1918X but not +/K1431M or +/M2145T mice have reduced levels of Trio protein in the brain.
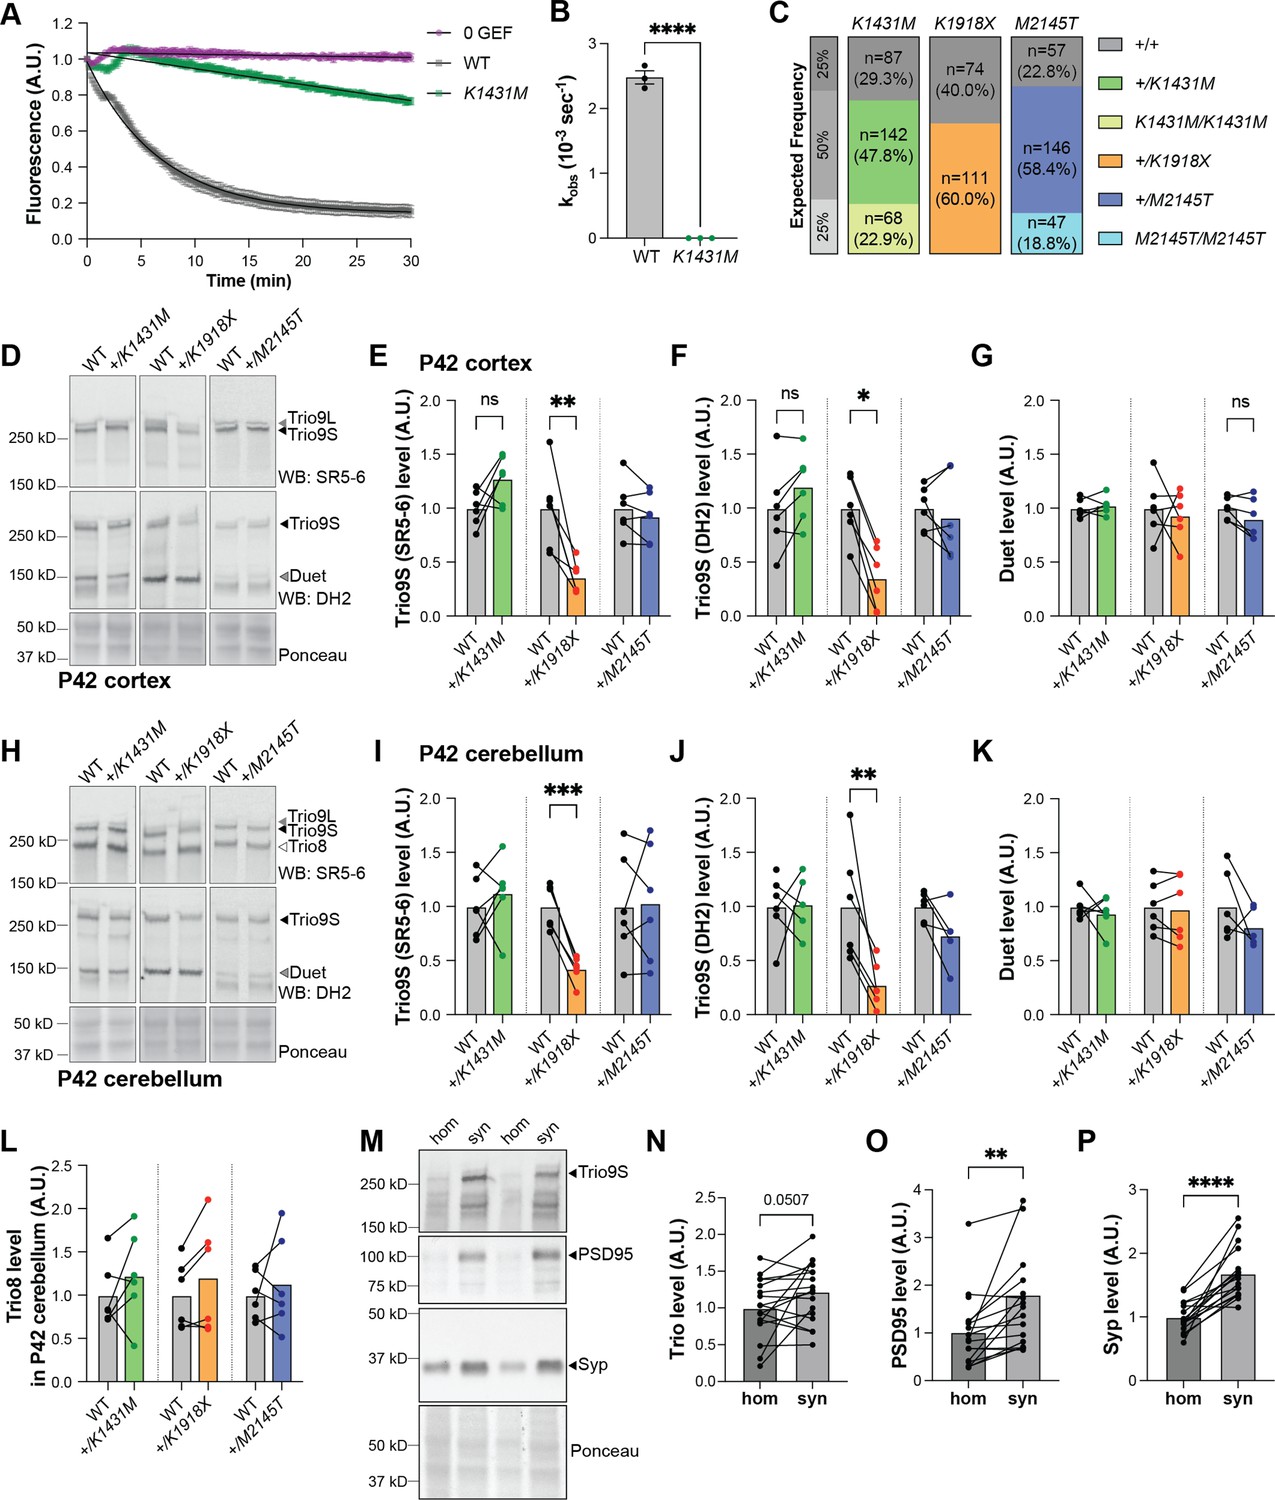
(A) In vitro GEF assay showing Rac1:Bodipy-FL-GDP exchange via fluorescence decay over time, with background subtracted and fitted with exponential curves. K1431M has impaired GEF activity compared to WT at equimolar amounts (500 nM) of TRIO GEF1 protein (n=3 replicates). (B) K1431M significantly decreases the initial rate of nucleotide exchange compared to WT (Kobs = 0.0006 ± 0.0002 x10⁻³ s–1 vs WT Kobs = 2.5 ± 0.1 x10⁻³ s–1; p<0.0001, n=3). (C) Number and frequency of progeny from heterozygote intercrosses. +/K1431M x +/K1431M crosses produced litters in the expected Mendelian frequencies of 25% +/+: 50% +/variant: 25% variant/variant (Chi-square test, two-tailed p=0.2231). +/K1918X (Chi-square test, two-tailed p<0.0001) intercrosses did not yield homozygote variants (binomial test, two-tailed p=0.0610). +/M2145T x +/M2145T crosses yielded slightly more heterozygotes than expected (Chi-square test, two-tailed p=0.0140). (D,H) Representative immunoblots for Trio isoforms in the cortex (D) and cerebellum (H) of P42 male Trio heterozygous variant and paired WT littermate mice (used antibodies noted in parentheses). (E–G,I–L) Quantification of Trio isoform levels in immunoblots of the cortex (E–G) and cerebellum (I–L). Significant decreases in Trio9 levels were found only in +/K1918X cortex (in E: 0.3590±0.06005 vs WT 1.000±0.1541, p=0.0036; in F: 0.3513±0.1191 vs WT 1.000±0.1165, p=0.0207) and cerebellum (in I: 0.4239±0.04858 vs WT 1.000±0.08361, p=0.0003; in J: 0.2753±0.08413 vs WT 1.000±0.2118, p=0.0059, n=6 mice per group). No significant changes in Trio levels were observed in +/K1431M or +/M2145T mouse brains. Trio8 levels in the cerebellum for all Trio heterozygous variant mice were unchanged from WT littermates. Ratio paired t-tests identified differences from the WT mean (n=6 mice per group). (M) Representative immunoblots showing enrichment of Trio, PSD95, and synaptophysin (Syp) in synaptosomes (syn) compared to 40 µm-filtered total homogenate (hom) from P42 WT mouse cortex. (N–P) Quantification of Trio9S, PSD95, and Syp in immunoblots from P42 mouse synaptosomes versus total homogenate (n=18 mice). All data are presented as mean ± SEM; significance tested by Paired t-tests unless specified otherwise (nsp <0.1, *p<0.05, **p<0.01, ****p<0.0001).
-
Figure 1—figure supplement 1—source data 1
Full raw uncropped, unedited western blot files and Ponceau stains used for analysis displayed in Figure 1—figure supplement 1D–L.
- https://cdn.elifesciences.org/articles/103620/elife-103620-fig1-figsupp1-data1-v1.zip
-
Figure 1—figure supplement 1—source data 2
PDF file containing annotated original western blot files and Ponceau stains for Figure 1—figure supplement 1D–L.
- https://cdn.elifesciences.org/articles/103620/elife-103620-fig1-figsupp1-data2-v1.zip
-
Figure 1—figure supplement 1—source data 3
Full raw uncropped, unedited western blot files and Ponceau stains used for analysis displayed in Figure 1—figure supplement 1M–P.
- https://cdn.elifesciences.org/articles/103620/elife-103620-fig1-figsupp1-data3-v1.zip
-
Figure 1—figure supplement 1—source data 4
PDF file containing annotated original western blot files and Ponceau stains for Figure 1—figure supplement 1M–P.
- https://cdn.elifesciences.org/articles/103620/elife-103620-fig1-figsupp1-data4-v1.zip
Figure 2 with 1 supplement
Heterozygosity for distinct Trio variants differentially impacts NDD-like mouse behaviors.
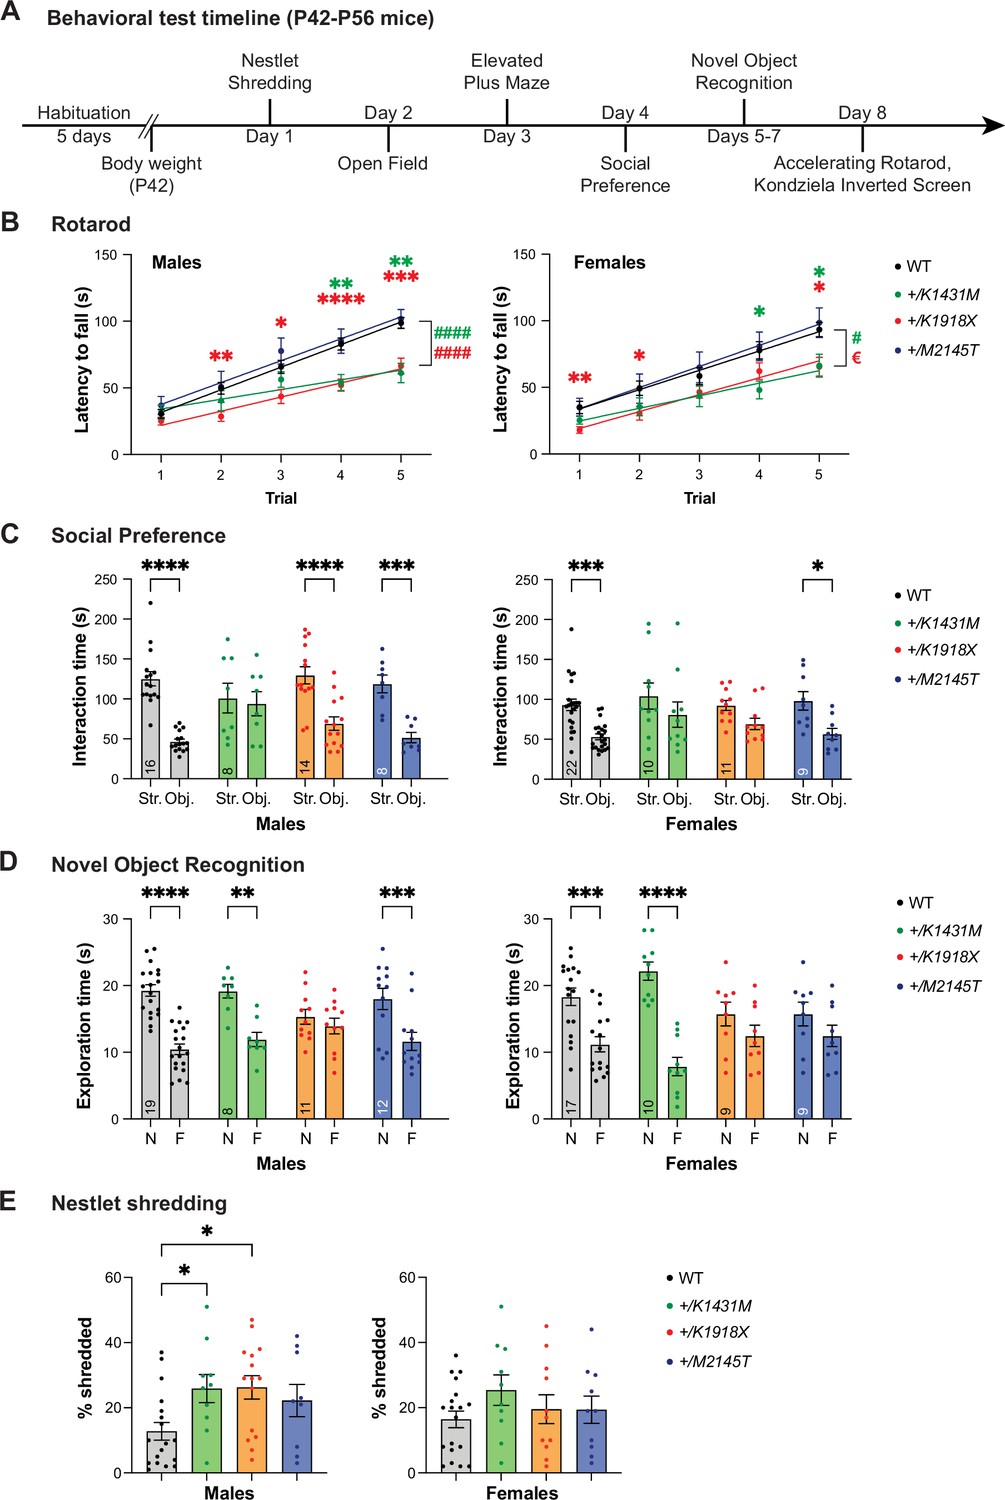
(A) Schematic illustration of the behavioral tests performed on young adult (P42–P56) heterozygous Trio variant mice of both sexes. All mice proceeded through the same battery of tests. (B) +/K1431M and +/K1918X mice of both sexes had decreased latency to fall off an accelerating rotarod compared to WT male mice. In male mice (left), linear regressions identified differences from WT in slopes, indicating impaired rate of improvement in the skill (WT 16.96±1.344; +/K1431M 7.270±2.019, p<0.0001; +/K1918X 10.61 ± 1.444, p<0.0001; ####p<0.0001) (n=40 WT; 10 +/K1431M; 16 +/K1918X; 13 +/M2145T male mice). In female mice (right), linear regressions identified differences from WT in slopes (+/K1431M 9.436±2.146, p=0.0215; vs WT 14.52±1.792; #p<0.05) and intercepts (+/K1918X 6.492 ± 5.555, p=0.0248; vs WT 19.28±5.942; €p<0.05; n=28 WT; 11 +/K1431M; 16 13 +/K1918X; and 15 +/M2145T female mice). (C) +/K1431M mice of both sexes and +/K1918X females showed impaired social interactions in a three-chamber test, showing no preference to the (Str.) vs. inanimate object (Obj.) compared to WT. (D) +/K1918X mice of both sexes and +/M2145T females exhibit impaired novel object recognition and spend equal time exploring a novel object (N) and a familiar object (F). (E) Male +/K1918X mice exhibited increased nestlet shredding over 30 min (26.26 ± 3.61% shredded vs WT 14.26 ± 2.97%; p=0.0433), and +/K1431M mice exhibited a trend toward increased nestlet shredding (25.90 ± 4.34% shredded, p=0.1038) compared to WT mice. n=19 male, 19 female WT; 10 male, 10 female +/K1431M; 15 male, 11 female +/K1918X; 9 male, 10 female +/M2145T mice. All data are shown as mean ± SEM, significant differences identified using two-way ANOVA with post-hoc Bonferroni MC (nsp <0.1, *p<0.05, **p<0.01, ***p<0.001, ****p<0.0001). Numbers of mice quantified per group are annotated inside the bar unless otherwise indicated.
Figure 2—figure supplement 1
Heterozygosity for distinct Trio variants differentially impacts anxiety-like behaviors.
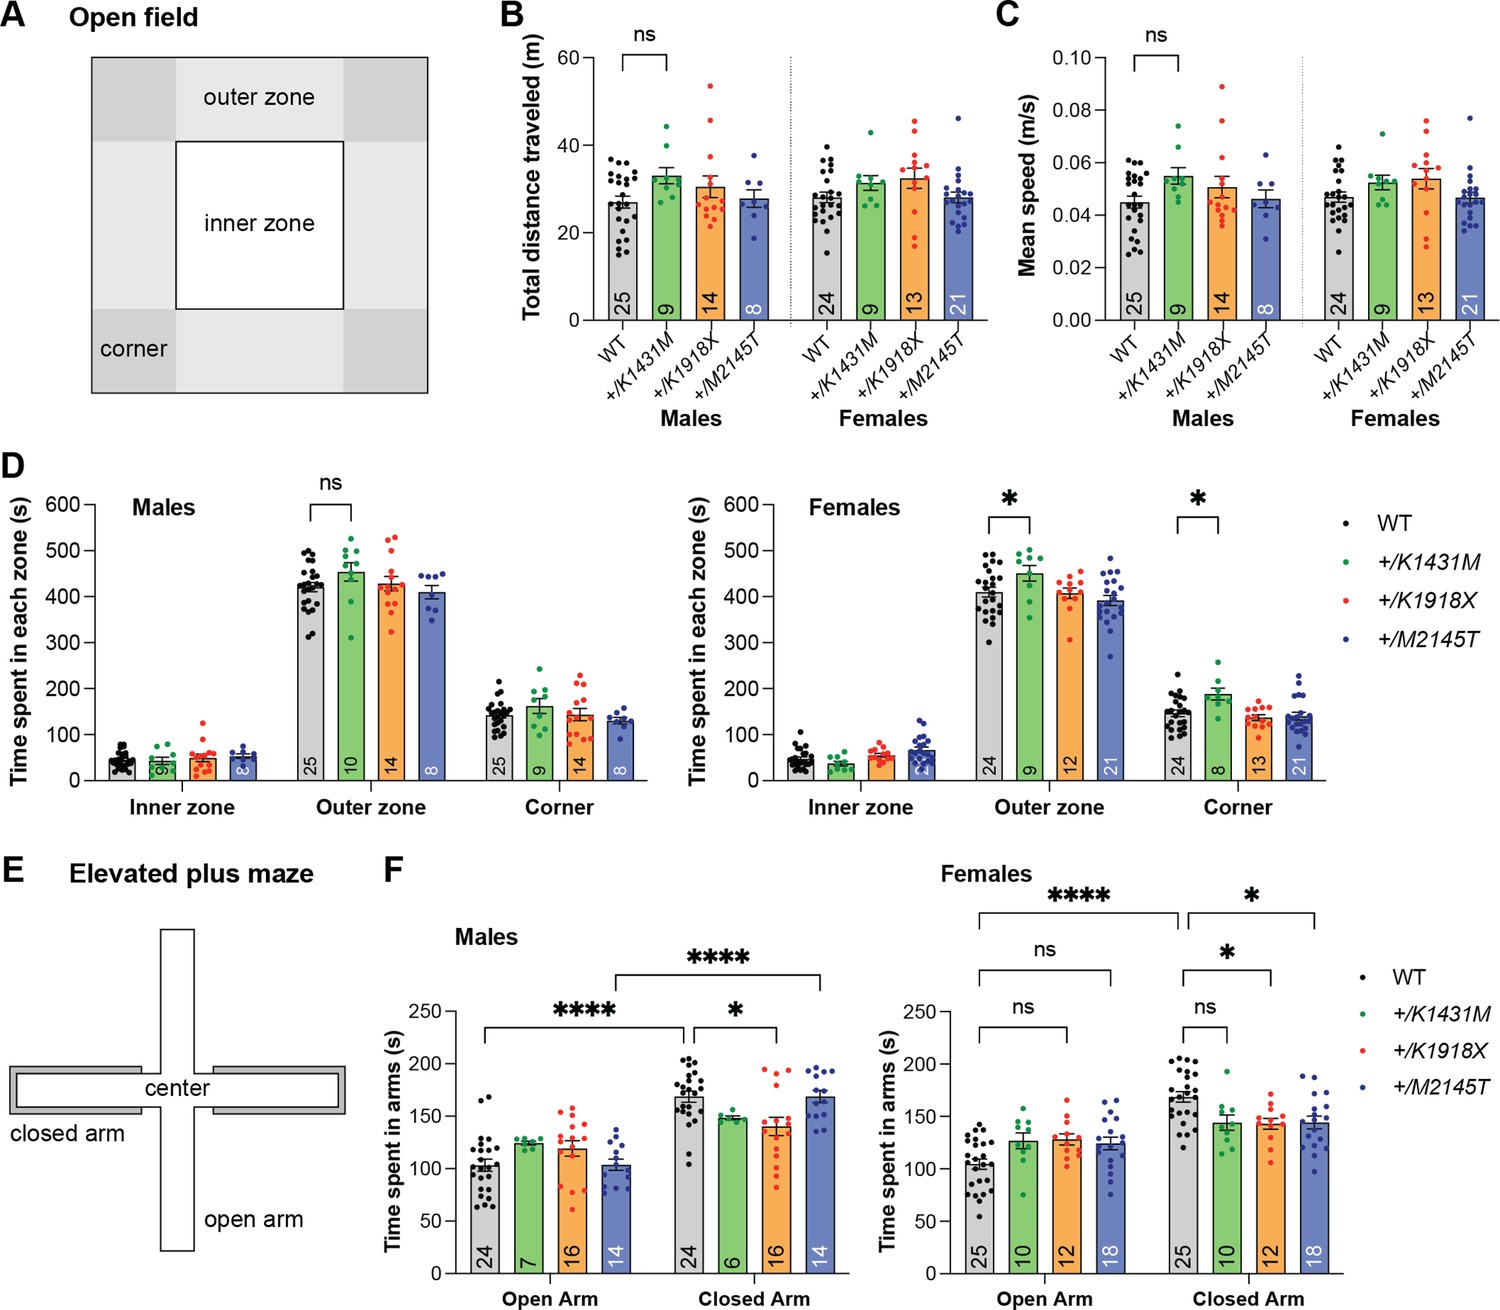
(A) Schematic diagram of the open field test. (B–F) Total distance and time in each zone were tracked automatically over 10 min per mouse (n of mouse per group are shown inside the bar). (B-C, D left) Trio variant male mice did not show significant differences in the open field test compared to WT. (D right) +/K1431M females spent significantly more time in the outer and corner zones of the open field relative to WT females (outer zone: +/K1431M 450.622±17.117 s, vs WT 409.774±10.664 s zone, p=0.0157; corner zone: +/K1431M 188.188±12.876 s, vs WT 146.550±7.251 s, p=0.0192). (E) Schematic diagram of the elevated plus maze. (F) WT mice of both sexes and +/M2145T males preferred to spend more time in the closed arms than in the open arms of the elevated plus maze; +/K1431M and +/K1918X mice of both sexes and +/M2145T females in time spent in open versus closed arms in the elevated plus maze test. Females of all Trio heterozygote genotypes as well as +/K1918X males displayed decreased time in the closed arm relative to WT mice and exhibited trends towards increased time in the open arms relative to WT. All data are presented as mean ± SEM. Two-way ANOVA with post-hoc Bonferroni MC test identified differences from WT (nsp <0.1, *p<0.05, ****p<0.0001). Numbers of mice quantified per group are annotated inside the bars.
Figure 3 with 2 supplements
Trio +/K1431M and +/K1918X mice have smaller brain weights, but only +/K1918X brains have smaller, less complex neurons.
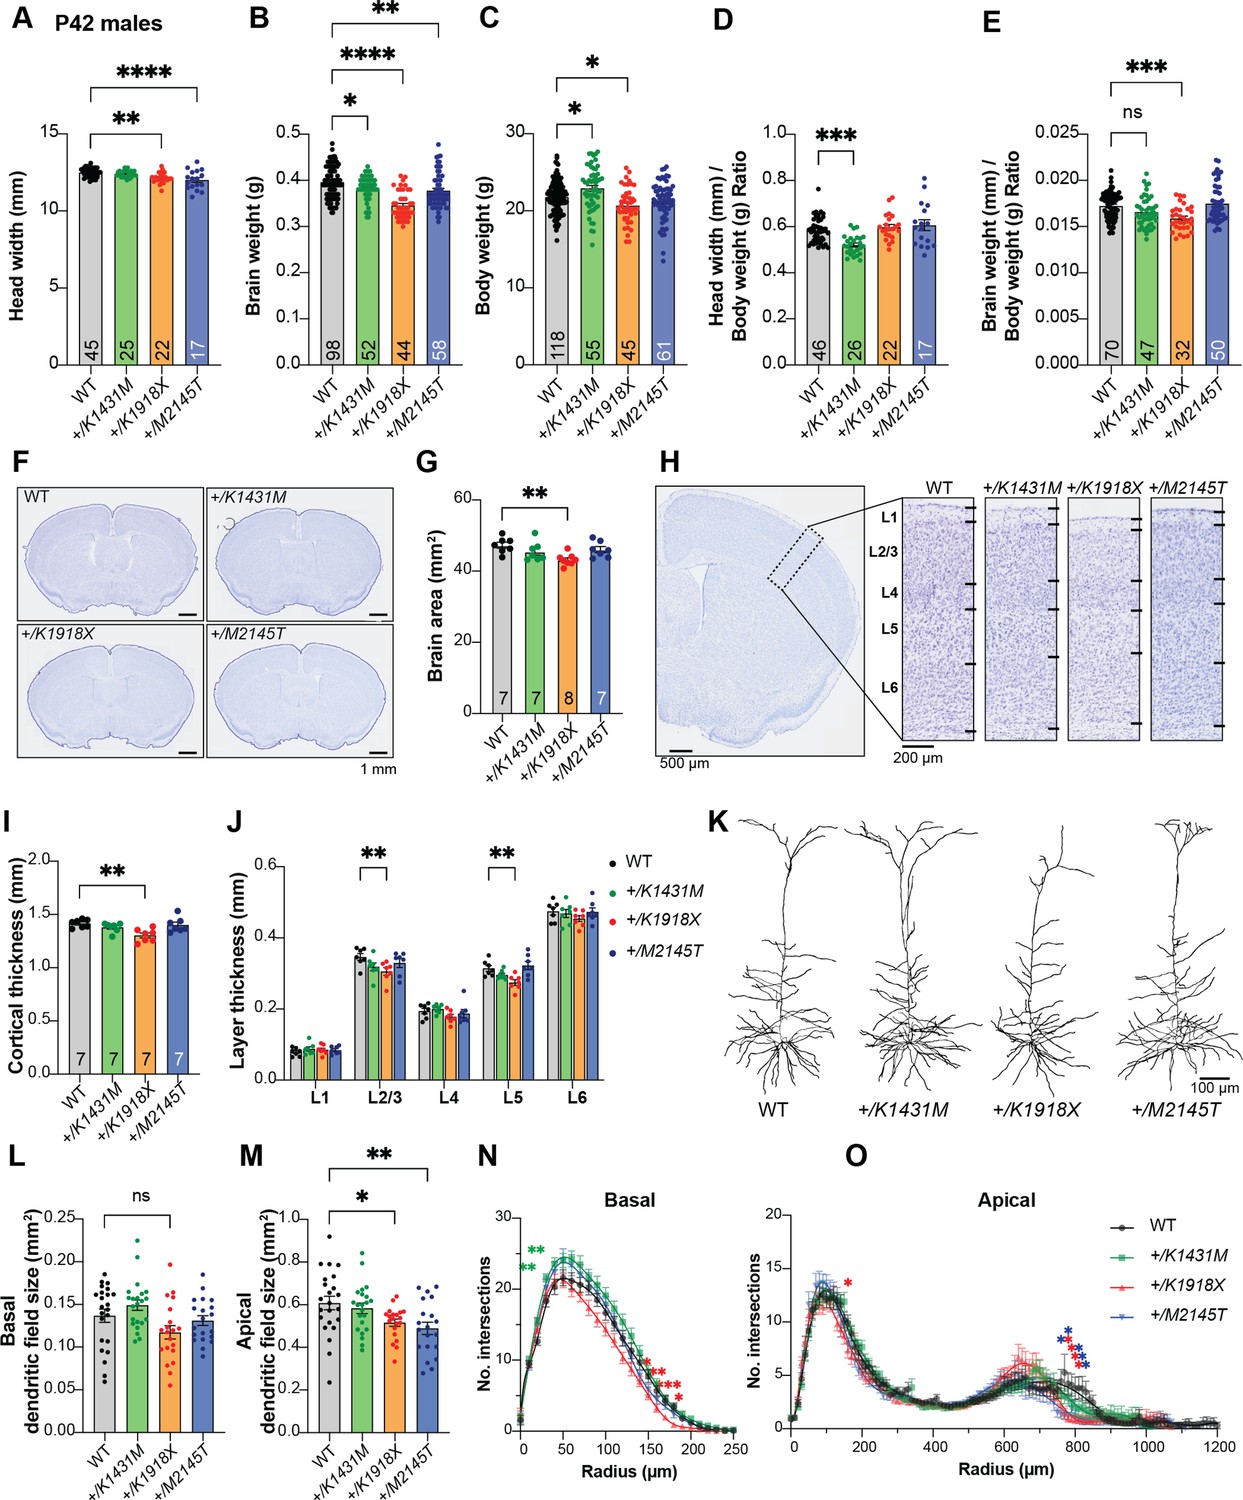
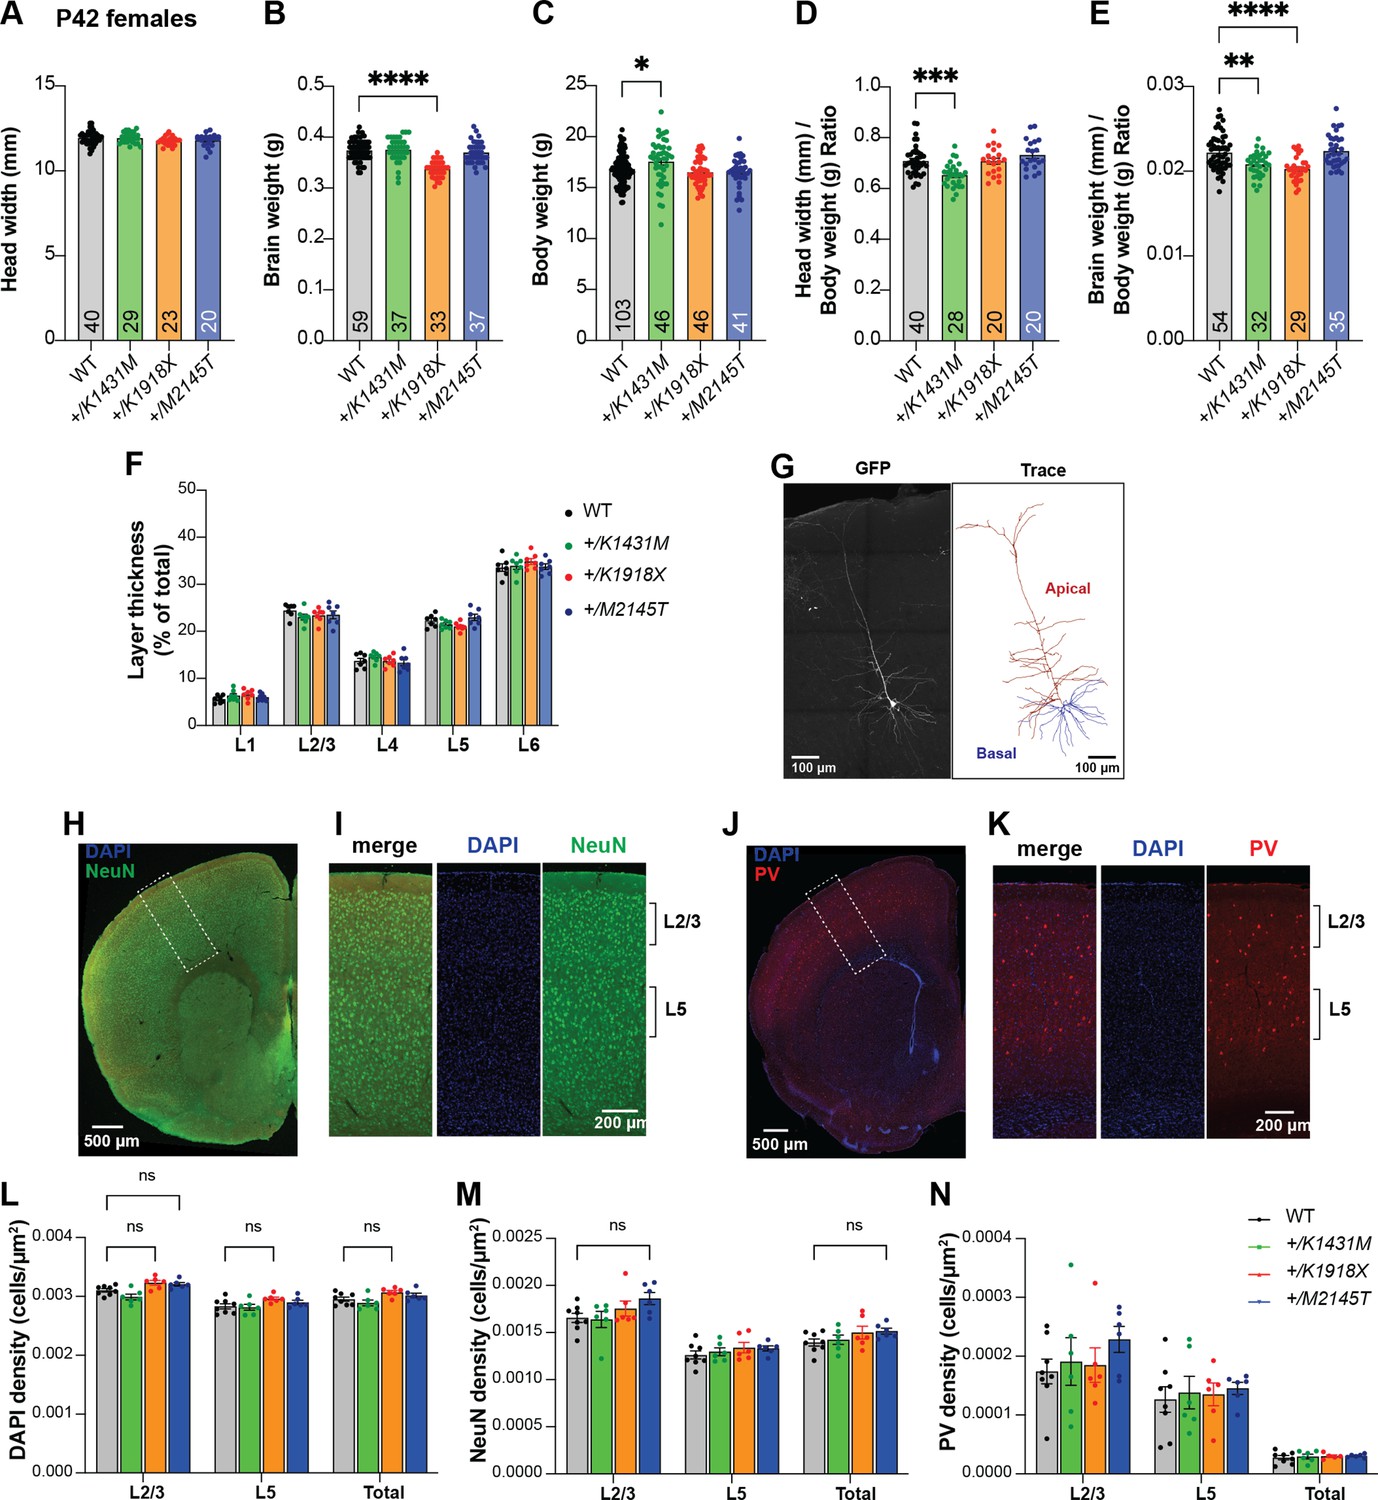
(A) Ear-to-ear head width is reduced in P42 +/K1918X and +/M2145T compared to WT male mice (+/K1431M: 12.40±0.04 mm, p=0.95; +/K1918X: 12.15±0.08, p=0.001; +/M2145T 12.01±0.15, p<0.0001; vs WT 12.49±0.04 mm, n=17–45). (B) Brain weight is significantly decreased relative to WT in P42 males of all three heterozygous Trio variants (+/K1431M: 0.382±0.004 g, p=0.04; +/K1918X: 0.346±0.004 g, p<0.0001; +/M2145T 0.378±0.005 g, p=0.002; vs WT 0.396±0.004 g, n=44–98). (C) Body weight is significantly increased in P42 +/K1431M males and decreased in +/K1918X males (+/K1431M: 22.91±0.38 g, p=0.01; +/K1918X: 20.67±0.03 g, p=0.001; +/M2145T: 21.22±0.33 g, p=0.44; vs WT 21.76±0.19 g, n=45–118). (D) Head widths normalized to body weight of P42 +/K1431M male mice were reduced 10.8% compared to WT mice (+/K1431M: 0.520±0.008 mm/g, p=0.0001; +/K1918X: 0.598±0.012 mm/g, p>0.999; +/M2145T 0.607±0.023 mm/g, p=0.54; vs WT 21.76±0.19 mm/g, n=17–46). (E) Brain weights normalized to body weight of P42 +/K1431M and +/K1918X male mice were reduced 3.9% and 7.9%, respectively compared to WT mice (+/K1431M: 0.520±0.008 mm/g, p=0.0001; +/K1918X: 0.598±0.012 mm/g, p>0.999; +/M2145T 0.607±0.023 mm/g, p=0.54; vs WT 21.76±0.19 mm/g, n=17–46). (F) Representative images of Nissl-stained 30 μm coronal slices of male P42 WT and heterozygous Trio variant brains. (G) Total cross-sectional tissue area of Nissl-stained coronal sections was reduced by ~9% + /K1918X in P42 male mice compared to WT. (H) Representative images of Nissl-stained cortical layers (L1-L6, dotted black box) of P42 WT and heterozygous Trio variant brains. (I) The total cortical thickness (from H) is reduced by ~8% in +/K1918X P42 male brains compared to WT. (J) Thickness of individual cortical layers, as identified in Nissl stains in H. L2/3 and L5 were preferentially reduced (–12% and –13%, resp.) in +/K1918X cortex relative to WT (L2/3: 0.306±0.011 mm vs WT 0.346±0.010 mm, p=0.0043; L5: 0.274±0.008 mm vs WT 0.314±0.008 mm, p=0.0054). (K) Representative traces of M1 L5 PNs from heterozygous male Trio variant mice crossed with Thy1-GFP(M). (L) +/K1918X M1 L5 PNs show a trend toward reduced basal dendritic field size (0.1172±0.0078 mm²; vs WT 0.1368±0.0077 mm², p=0.0933; n=15–22 neurons per mouse), as measured by convex hull analysis of dendrite arbor reconstructions. (M) Both +/K1918X and +/M2145T exhibit significantly smaller apical dendritic field size (+/K1918X: 0.5157±0.0169 mm², p=0.0460; +/M2145T: 0.4893±0.0285 mm², p=0.0062) compared to WT (0.6081±0.0319 mm²; n=15–22 neurons per mouse). All data shown as mean ± SEM. One-way ANOVA with post-hoc Bonferroni MC test identified significant differences from WT (nsp <0.1, *p<0.05, **p<0.01). (N,O) Sholl analysis revealed basal (N) and apical (O) dendritic arborization changes in Trio variant M1 L5 PNs compared to WT: both basal and apical arborization was reduced in +/K1918X, while proximal basal arborization was increased in +/K1431M. Two-way ANOVA (stacked) with post-hoc Bonferroni MC test identified differences from WT.
Figure 3—figure supplement 1
Heterozygous Trio variant mice show mild alterations in cortical organization.
(A) Ear-to-ear head width is unchanged from WT for all female heterozygous Trio variant mice at P42. (B) Brain weight is significantly reduced by 9.9% in P42 +/K1918X female mice compared to WT. (C) Body weight is increased by 4.2% in P42 +/K1431M female mice. (D) Head widths normalized to body weight of P42 +/K1431M female mice were reduced by 7.9% compared to WT mice. Head width-to-body weight ratios were calculated per individual mouse, with mouse number per group annotated within the bar. (E) Brain weights normalized to body weight of P42 +/K1431M and +/K1918X female mice were reduced 6.2% and 8.6%, respectively, compared to WT mice. Brain-to-body weight ratios were calculated per individual mouse, with mouse number per group annotated within the bar. (F) Thickness of individual cortical layers expressed as a percentage of total cortical thickness. No differences were observed in Trio variant mice compared to WT. For (G–H), two-way ANOVA with post-hoc Bonferroni MC test identified differences from WT (**P<0.01; n=7 mice per group). (G) Representative maximum projection fluorescence image and corresponding dendritic arbor reconstruction of a motor cortex Layer 5 pyramidal neuron (M1 L5 PN) from a P42 Thy1-GFP mouse. (H–K) Representative fluorescent image of a 30 μm coronal slice from P42 WT brain, immunostained for NeuN and PV. Regions of motor cortex as outlined by the white dotted box in (H) and (J) are magnified in (I) and (K), resp. (L–N) Density of DAPI+, NeuN+, and PV + cells did not significantly differ between Trio variants and WT in the total M1 region quantified or in cortical layers 2/3 and 5, though there were trends towards increased DAPI + cell density in +/K1918X and increased L2/3 NeuN + cell density in +/M2145T P42 male mice relative to WT. All data are shown as mean ± SEM; significance tested by one-way or two-way ANOVA with post-hoc Bonferroni MC test identified differences from WT (ns: 0.05<p < 0.1; n=6 mice for Trio variants, n=8 WT mice; 3 slices per mouse were analyzed). All data are presented as mean ± SEM.
Figure 3—figure supplement 2
Additional measurements of dendrites from M1 L5 PN reconstructions show modest order-dependent changes in Trio variant mice.
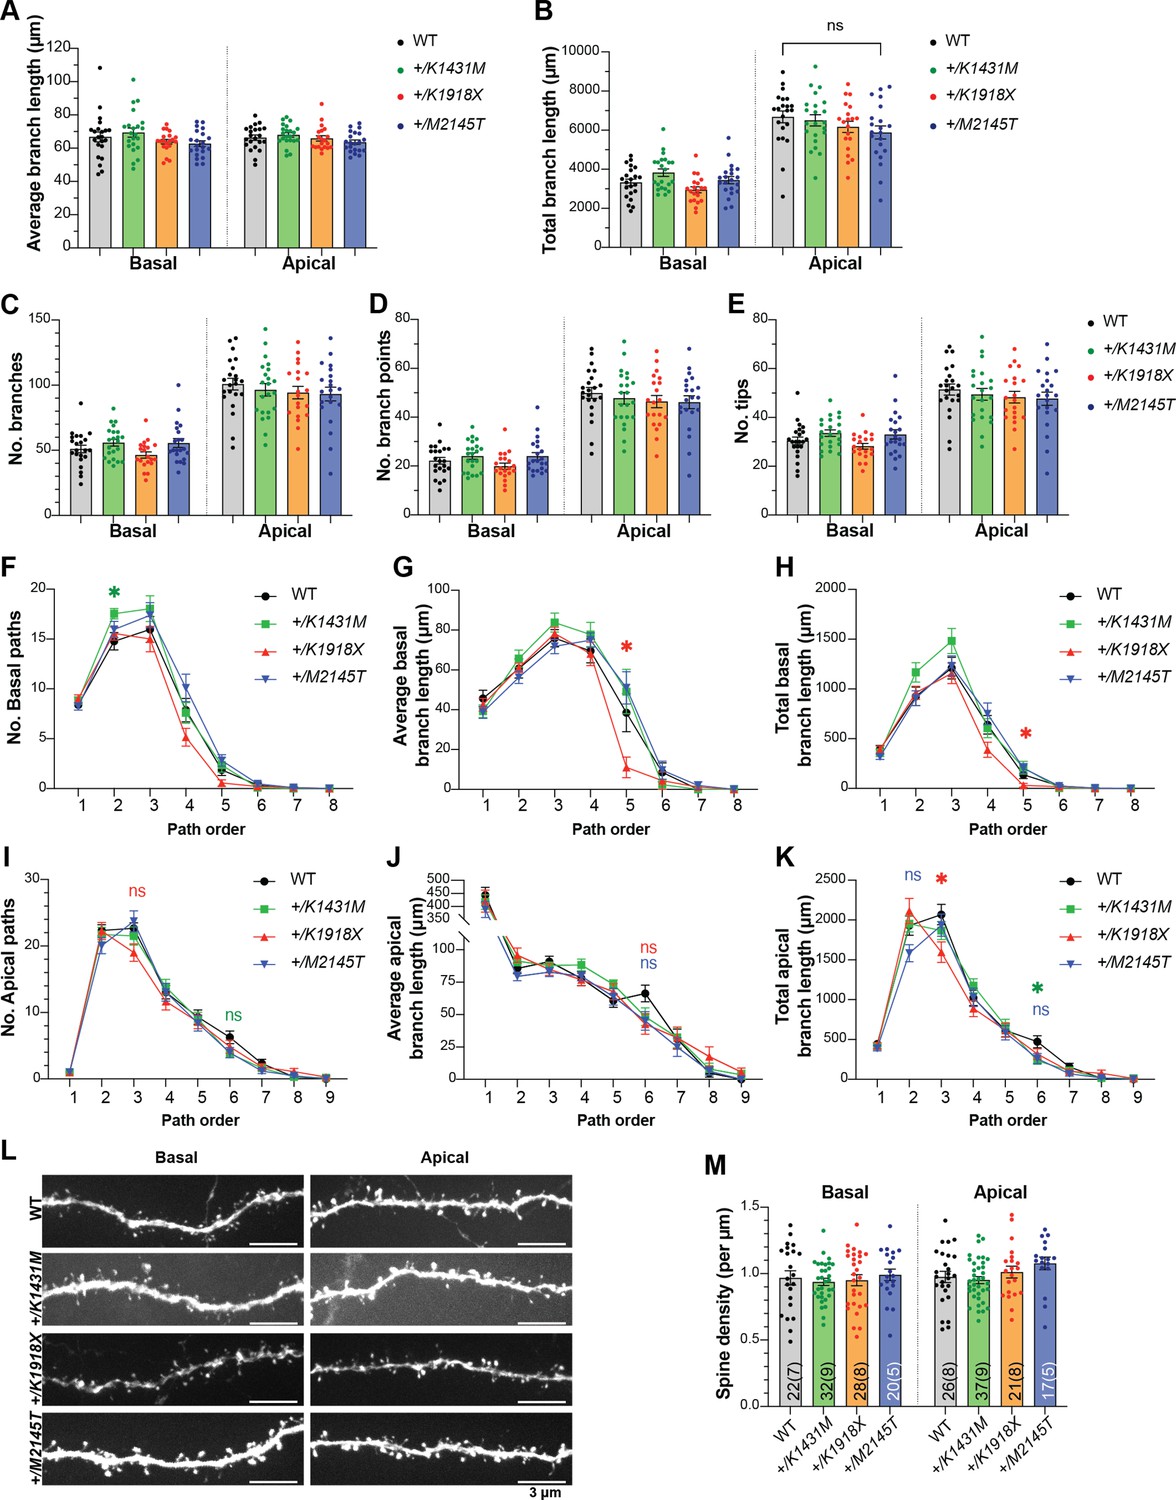
(A–E) Overall measurements of dendritic reconstructions showed that average dendrite length (A), sum total dendrite length (B), number of branches (C), number of branch points (D), and number of tips (E) of Trio variant M1 L5 PNs were not different from WT. (n=same as in main Figure 2J–M). (F–K) Path length analysis showed dendrite order-dependent changes in +/K1431M and +/K1918X number of branches (F,I), average dendrite length (G,J), sum total dendrite length (H,K) for basal (F–H) and apical (I–K) dendrites compared to WT. +/K1918X PNs exhibited reduced average and total dendrite length at higher-order basal dendrites (in 5th-order basal dendrites: average branch length 11.015±5.176 µm vs WT 38.51±9.565 µm, p=0.0491; total dendrite length 31.593±18.700 µm vs WT 137.550±38.407 µm, p=0.0491) and reduced sum total branch length in mid-order apical dendrites (in tertiary apical dendrites, 1596.476±129.408 vs WT 2068.017 ±127.918 µm, p=0.0354). +/K1431 PNs had increased proximal basal dendrite numbers (in secondary basal dendrites, 17.545±0.513 µm vs WT 14.783±0.866 µm, p=0.0256). Two-way ANOVA with post-hoc Bonferroni MC test identified differences from WT. (L) Representative maximum projection fluorescence images of basal and apical dendrite segments from M1 L5 PNs of P42 Trio variant mice. (M) Dendritic spine density on proximal apical and secondary basal dendrites is unchanged in Trio variant mice compared to WT (used 2–5 dendrites per neuron/1–2 neurons per mouse). Numbers of dendrites quantified per group are annotated inside the bar (number of neurons in parentheses). All data show mean ± SEM; significance tested using one-way or two-way ANOVA as appropriate with post-hoc Bonferroni MC test identified differences from WT (nsp <0.1, *p<0.05, **p<0.01; n=same as in main Figure 2J–M).
Figure 4

Trio variants differentially impact synapse ultrastructure and synaptic vesicle distribution.
(A) Representative electron micrographs (EMs) from motor cortex layer 5 (M1 L5) of P42 WT and Trio variant mice. Post-synaptic regions are pseudo-colored in cyan; pre-synaptic regions in magenta. (B) Asymmetric synapse density was increased in +/K1918X mice (0.09205±0.004775 synapses/µm2; vs WT 0.07633±0.003954 synapses/µm2, p=0.0345). (C) PSD lengths were slightly decreased in M1 L5 synapses by 6% in +/K1918X and 6.6% in +/M2145T mice vs WT (+/K1918X 0.2926 ± 0.004652 µm, p=0.0204; +/M2145T 0.2916±0.004922 µm, p=0.0142; vs WT 0.3125±0.005612 µm). (D,E) Presynaptic bouton and spine head areas of Trio variants M1 L5 synapses were unchanged from WT. (F) Synaptic vesicles (SVs) distribution per 100 nm of active zone (AZ) length in M1 L5 as a function of distance from the AZ. +/M2145T showed an increase in readily releasable pool (RRP) identified as docked SVs (15 nm from AZ; 1.23±0.05 vs WT 0.90±0.05) and increase in tethered SVs (50 nm from AZ; 1.44±0.04 vs WT 1.20±0.05). +/K1918X and +/M2145T also showed an increase in the reserve pool of SVs (200 nm from AZ; 3.51±0.21 and 3.81±0.18, resp. vs WT 2.74±0.16, n=15–30 synapses/mouse). (G) Total releasable pool, calculated as number of SVs at 15–150 nm from AZ per area of distribution (nm2). RRP (15–50 nm from AZ) was significantly increased in +/M2145T (0.257±0.007 vs WT 0.228±0.008), driven by increased docked and tethered SVs. All data are presented as mean ± SEM, significance tested by ordinary one-way ANOVA with post-hoc Bonferroni MC test (*p<0.05, **p<0.01, ***p<0.001, ****p<0.0001).
Figure 5
Trio variant mice exhibit deficits in synaptic signaling and LTP.
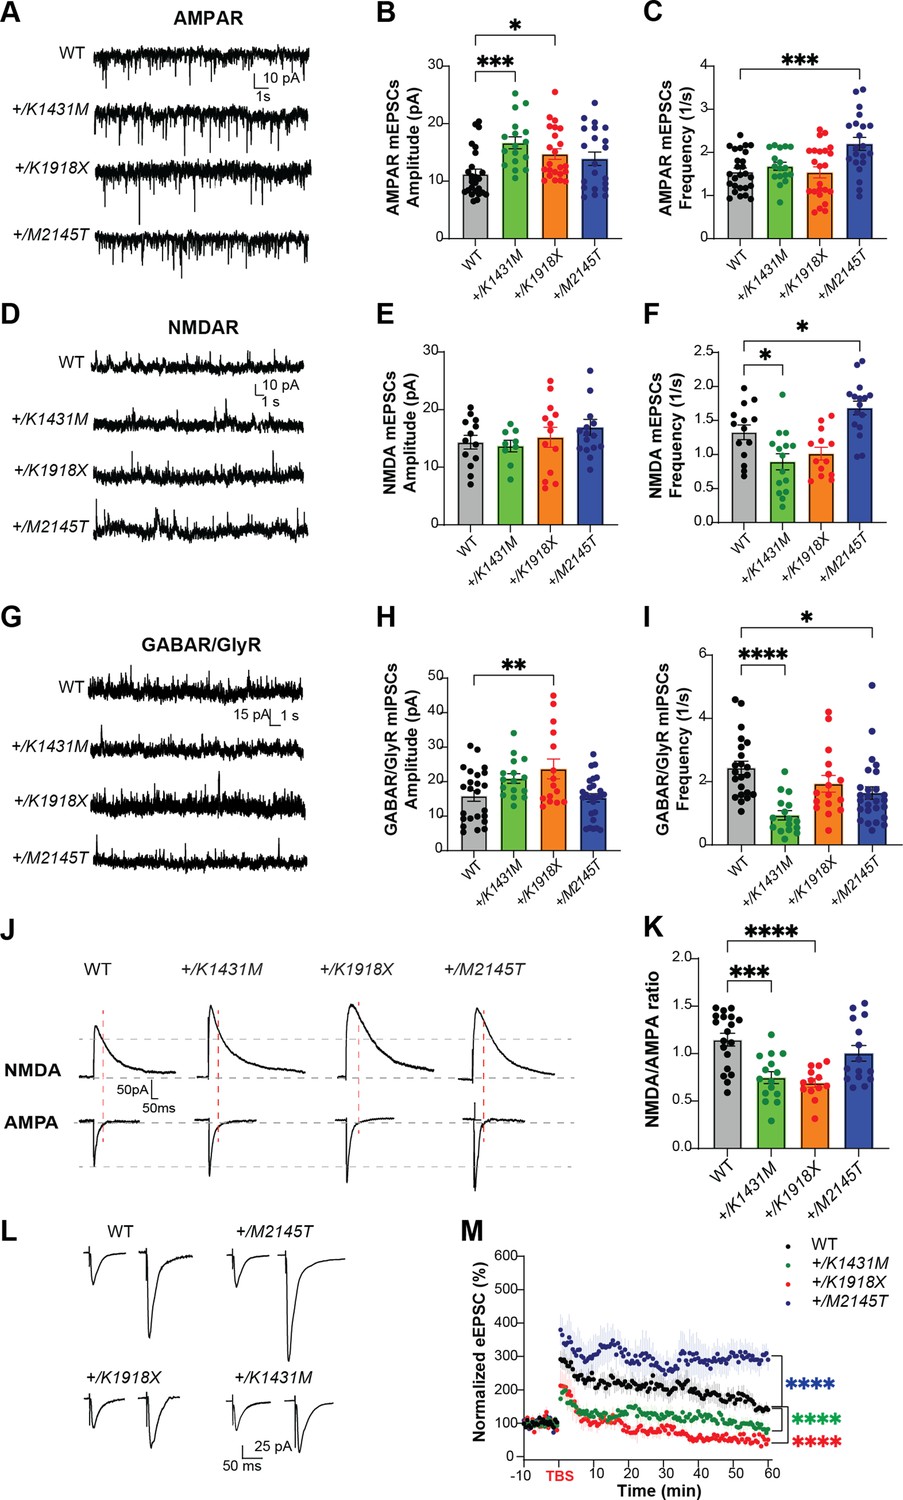
(A,D) Representative traces of miniature excitatory AMPAR-mediated mEPSCs, NMDAR-mediated mEPSCs, and (G) inhibitory postsynaptic currents (mIPSCs) in M1 L5 pyramidal neurons of WT and Trio variant mice. (B) AMPAR-mediated mEPSC amplitudes were significantly increased in +/K1431M (16.67±1.04 pA; p=0.0009) and +/K1918X (14.71±0.92 pA; p=0.03) slices, with no observed changes in +/M2145T slices (13.90±1.16 pA; p=0.16) compared to WT (11.25±0.84 pA; n=17–25 neurons from ≥6–8 mice per group). (C) No significant changes in AMPAR mEPSC frequencies (q) were observed in +/K1431M and +/K1918X, while +/M2145T had an increase (2.20±0.15 1 /s; vs WT 1.55±0.09 1 /s; p=0.0005). (E, F) NMDAR mEPSC frequencies were reduced in +/K1431M (0.89±0.12 1 /s; vs WT 1.3324±0.11 1 /s; p=0.015) and showed an increase in +/M2145T mice (1.68±0.10 1 /s vs WT 1.3324±0.11 1 /s; p=0.044, n=9–13 neurons from ≥5–7 mice per group). (H, I) GABA/GlyR mIPSC amplitudes were significantly increased in +/K1918X vs WT (23.69±2.89 pA; vs 15.86±1.56 pA, respectably; p=0.008), while frequency was decreased in +/K1431M and +/M2145T (0.94±0.14 1 /s, p<0.0001; and 1.64±0.19 1 /s, p=0.013; respectably; vs WT 2.44±0.20; n=16–26 neurons from ≥6–8 mice per group). (J) Representative averaged traces of NMDA and AMPA eEPSCs recorded in M1 L5 PNs. (K) Heterozygous +/K1431M and +/K1918X Trio variants mice display reduced NMDAR/AMPAR eEPSC amplitude ratios, suggesting an increase in AMPAR transmission in M1 L5 PNs (+/K1431M: 0.75±0.06, p=0.0002; +/K1918X: 0.69±0.05, p<0.0001; +/M2145T: 1.00±0.08, p=0.37; vs WT: 1.15±0.07; n=13–19 neurons from ≥5–6 mice per group). (L) Averaged representative traces of baseline and post-TBS eEPSC currents in M1 L5 PNs of WT and Trio variant mice. (M) Normalized eEPSC amplitudes measuring LTP in L5 PNs by TBS in L2/3 afferents in all genotypes showed a significant decrease in the initiation and no potentiation of the LTP in +/K1431M and +/K1918X, with increase in initiation and potentiation of +/M2145T M1 L5 PNs compared to WT. LTP was induced at 0 min. RM two-way ANOVA with post-hoc Bonferroni MC test identified significant differences (n=6–8 neurons from ≥4–5 mice per group). Data are presented as mean ± SEM; significance tested by one-way ANOVA with post-hoc Bonferroni test unless specified otherwise (**p<0.01; ***p<0.001; ****p<0.0001).
Figure 6
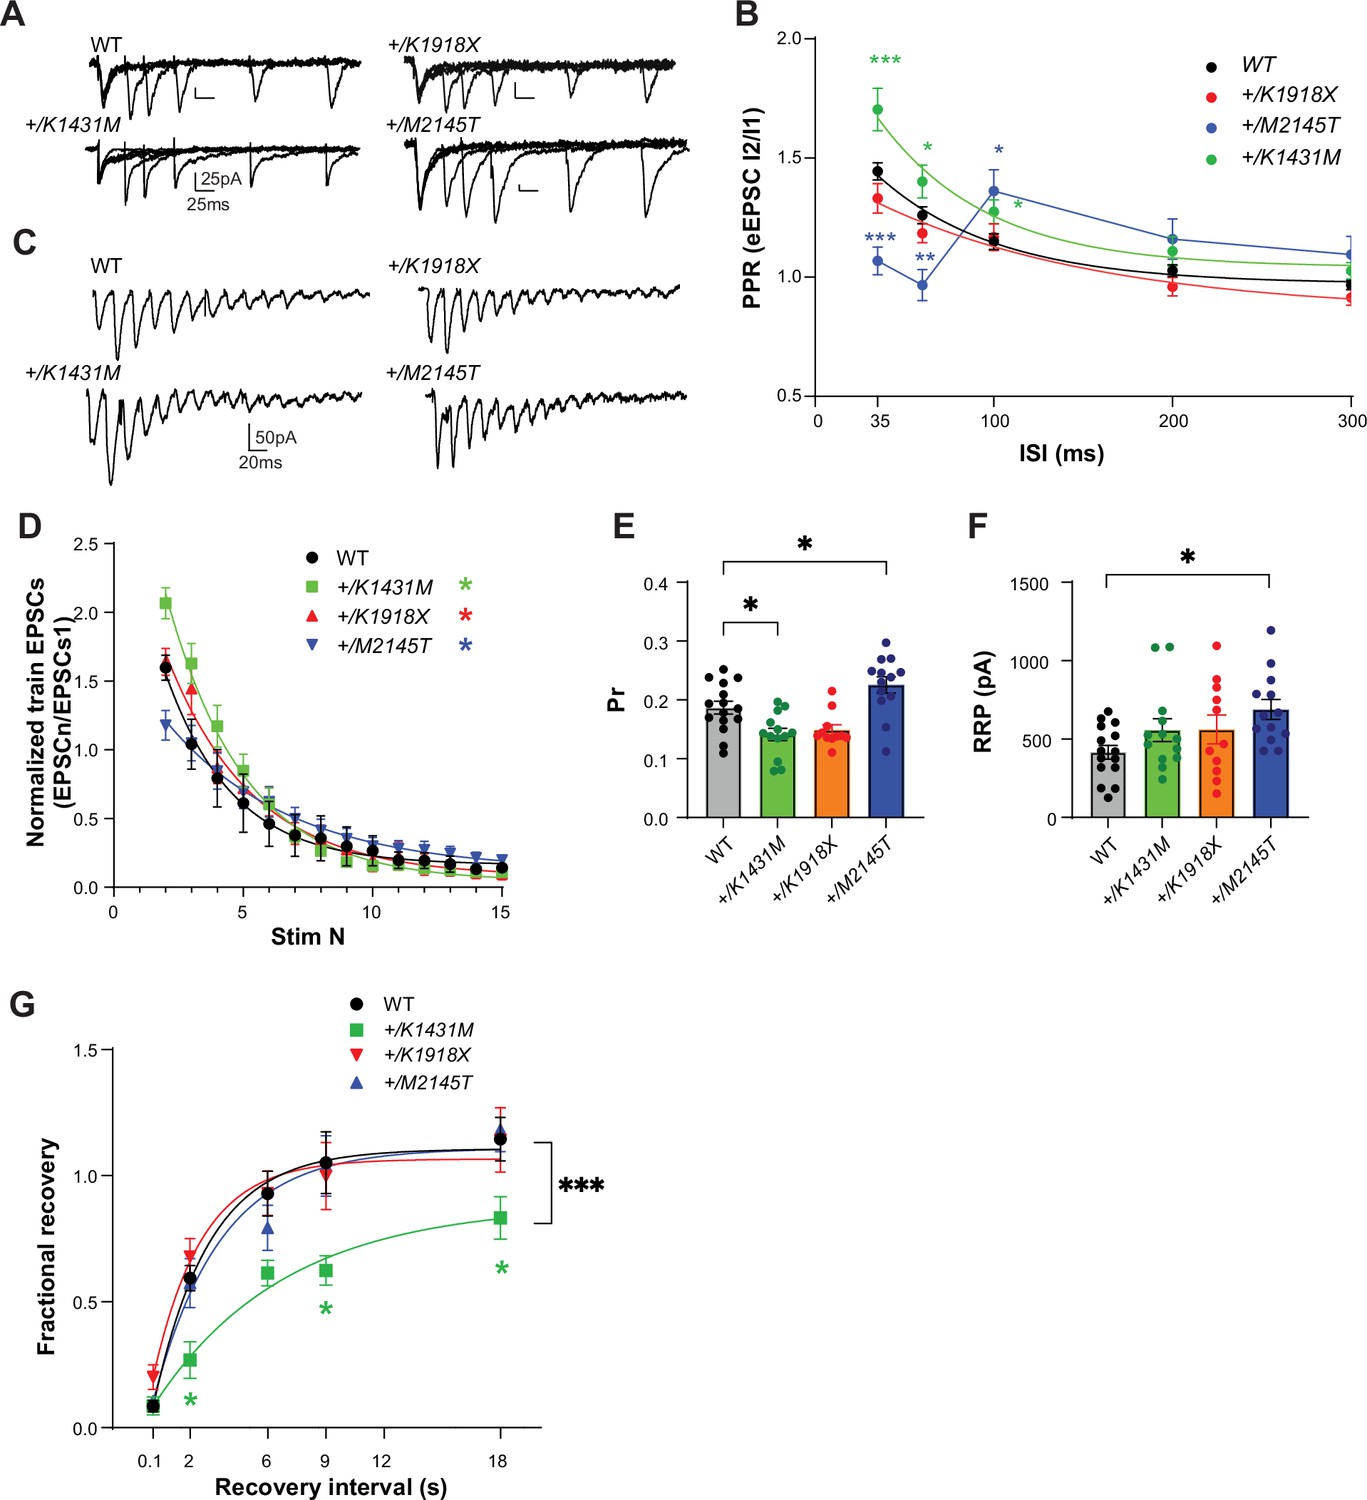
Trio +/K1431M and +/M2145T variant mice have deficiencies in short-term facilitation, glutamate Pr, and RRP.
(A) Representative traces in M1 L5 PNs of WT, Trio variant mice in response to paired pulse stimulation in L2/3. (B) Paired-pulse ratio (PPR) at varying interstimulus intervals (ISIs) was overlaid with a single exponential fit (except for +/M2145T data). An increase in the initial PPR was observed in M1 L5 PNs of +/K1431M slices (35ms: 1.70±0.089, p=0.003; 60ms: 1.40±0.07, p=0.046; 100ms: 1.27±0.05, p=0.031; n=20–34 neurons from ≥7–9 mice per group) with no change in +/K1918X slices; and in +/M2145T slices we observed a decrease in initial RRP at shorter ISIs (35ms: 1.05±0.06, p<0.0001; 60ms: 0.97±0.06, p=0.037) and an increase at longer ISIs (100ms: 1.36±0.09, p=0.034; 200ms: 1.18±0.08, p=0.013) compared to WT (35ms: 1.40±0.04; 60ms: 1.21±0.03; 100ms: 1.13±0.03; 200ms 1.0±0.02; 300ms 0.96±0.17). (C) Representative traces of AMPAR eEPSCs in M1 L5 PNs under HFS (15 pulses at 40 Hz) in L2/3. (D) AMPAR eEPSCn amplitudes normalized to eEPSC1 of the train revealed changes in the depletion rates during HFS in Trio +/K1431M and +/M2145T variants compared to WT (tau decay (τd), WT: 2.7 s, +/K1431M: 3.19 s, +/M2145T: 4.79 s, +/K1918X: 2.52 s; n=12–15 neurons from 5 to 7 mice). (E) The estimated glutamate probability of release (Pr) was decreased in +/K1431M slices (0.13±0.099; p=0.013) and increased in +/M2145T slices (0.26±0.019, p=0.042), with no significant change in +/K1918X slices (0.15±0.01, p=0.64) compared to WT M1 L5 PNs (0.19±0.01; n=12–15 neurons from ≥5 mice per group). (F) The calculated size of the readily releasable vesicle pool (RRP) was increased only in +/M2145T M1 L5 PNs compared to WT (665.7±68.5 pA vs 415.8±43.9 pA, p=0.012). RRP in +/K1431M and +/K1918X synapses did not differ from WT (543.1±64.4 pA; and 543.1±64.4 pA, respectively vs 415.8±43.9 pA) (G) Exponential fits of the fractional recovery plotted vs ISI, to estimate synapse ability to recover from RRP depletion. Time of recovery, measured by exponential tau recovery (τR), was significantly decreased in +/K1431M M1 L5 PNs (5.7 s, vs WT 2.2 s). +/K1431M also exhibited an inability to fully recover to initial levels after ISI 18 s, vs WT. Data are presented as mean ± SEM, with significant differences from WT tested using one-way ANOVA with post-hoc Bonferroni (*p<0.05; **p<0.01; ***p<0.001; ****p<0.0001).
Figure 7 with 1 supplement
Trio variant mice show different molecular changes in the cortex involving presynaptic machinery and Rac1 GEFs.
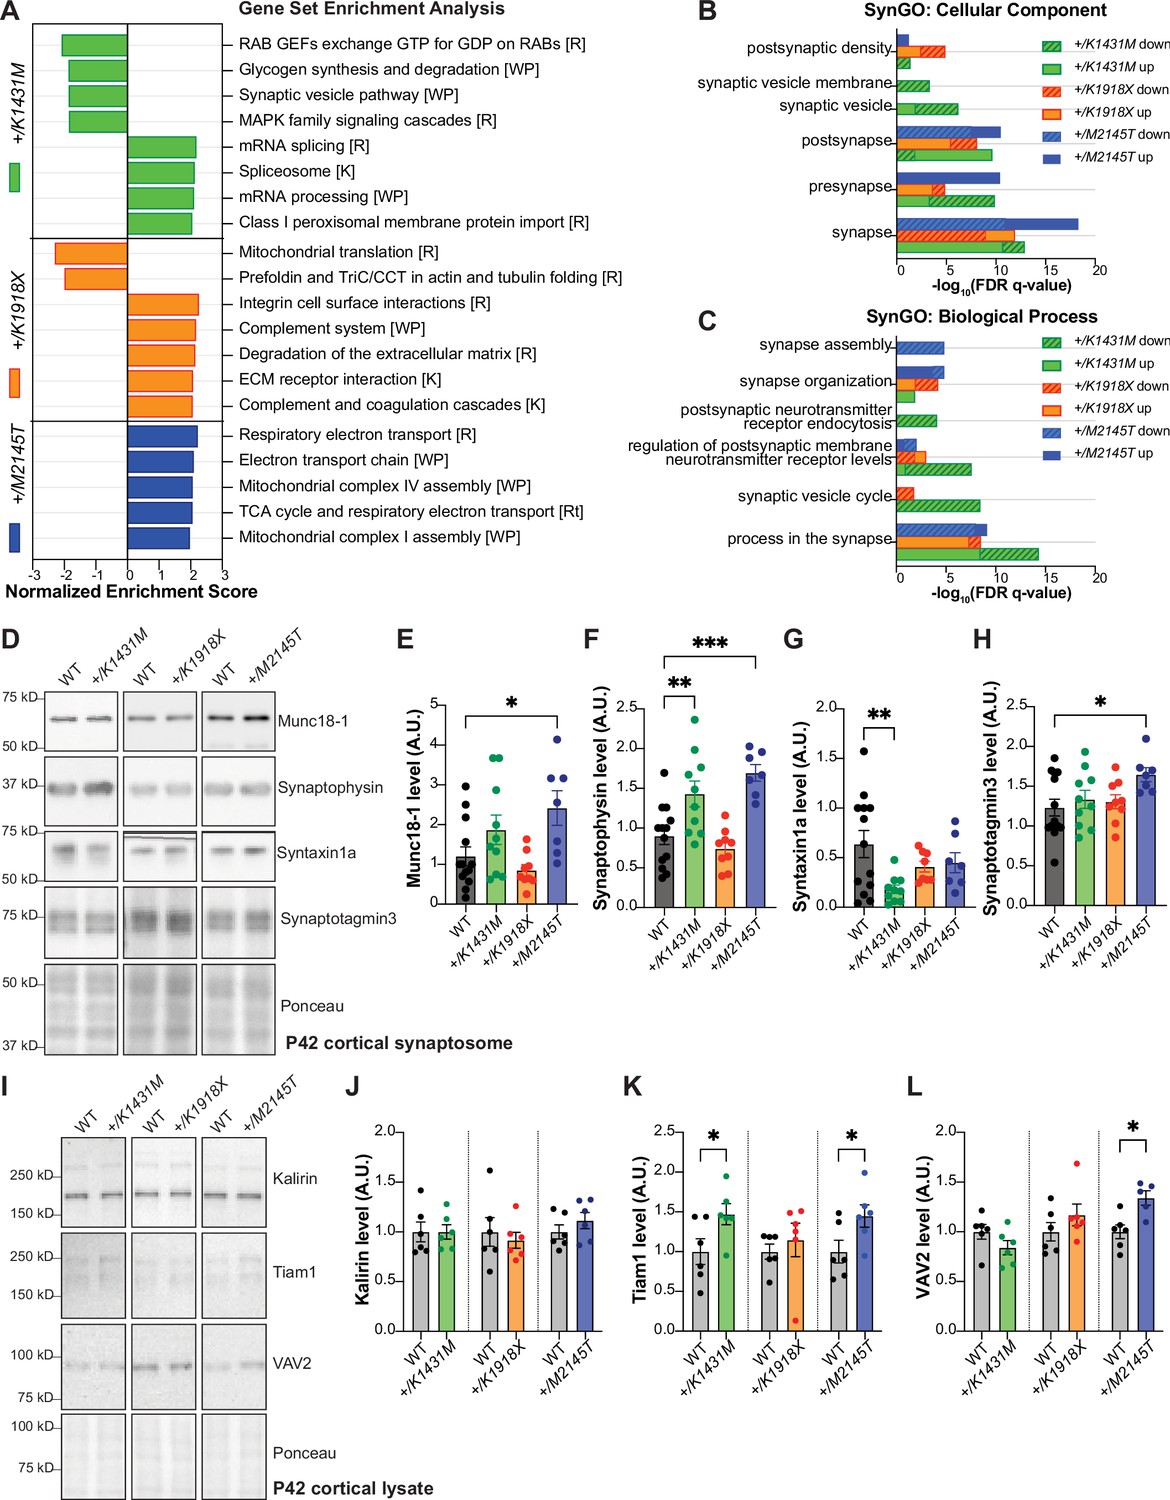
(A) Bar graph illustrating the top enriched pathways (FDR q-value <0.2, *FDR <0.05) identified by gene set enrichment analysis (GSEA) for each Trio mutant mouse compared to WT, using all 7,362 proteins quantified by mass spectrometry in P21 cortex (n=4/genotype), sorted by normalized enrichment score (NES). Pathways with +NES are upregulated, -NES are downregulated vs. WT. [ ] indicates gene set: [R] Reactome, [WP] WikiPathways, [K] KEGG. Full list attached in Figure 7—source data 1. (B, C) Bar graphs illustrating the top enriched (FDR q-value <0.001) (B) cellular components and (C) biological processes identified by GSEA, using synaptic proteins from SynGO gene sets (n=1,077 proteins), full list see in Figure 7—source data 2. (D) Representative immunoblots in synaptosomes isolated from P42 cortex of WT and Trio variant mice. (E–H) Normalized intensity levels from immunoblots demonstrate significant increases of (E) Munc18-1 (also known as syntaxin binding protein 1), (F) synaptophysin (Syp), (G) syntaxin1a (Stx1) and (H) synaptotagmin3 (Syt3) levels in +/M2145T synaptosomes; Syp is increased while Stx1a is significantly decreased in +/K1431M synaptosomes compared to WT. Ordinary one-way ANOVA with post-hoc Bonferonni MC test identified differences from WT (*p<0.05, **p<0.01, ***p<0.001; n=synaptosomes from 7 to 14 male mice). (I) Representative immunoblots of select RhoGEFs from P42 cortical lysates of WT and Trio variant mice. (J–L) Normalized intensity levels from immunoblots identified ~47% increase of Tiam1 levels in +/K1431M and increase ~45% in +/M2145T cortex vs to WT; VAV2 is increased by ~34% in +/M2145T cortex compared to WT. Unpaired t-tests identified differences from WT (*p<0.05; n=6 mice per genotype).
-
Figure 7—source data 1
Gene Set Enrichment Analysis of P21 cortex proteome of Trio WT, +/K1431M, +/K1918X, and +/M2145T mice.
- https://cdn.elifesciences.org/articles/103620/elife-103620-fig7-data1-v1.xls
-
Figure 7—source data 2
Synaptic Gene Ontologies (SynGO) of P21 cortex proteome of Trio WT, +/K1431M, +/K1918X, and +/M2145T mice.
- https://cdn.elifesciences.org/articles/103620/elife-103620-fig7-data2-v1.xls
-
Figure 7—source data 3
Full raw uncropped, unedited western blot files and Ponceau stains used for analysis displayed in Figure 7D–H.
- https://cdn.elifesciences.org/articles/103620/elife-103620-fig7-data3-v1.zip
-
Figure 7—source data 4
PDF file containing annotated original western blot files and Ponceau stains for Figure 7D–H.
- https://cdn.elifesciences.org/articles/103620/elife-103620-fig7-data4-v1.zip
-
Figure 7—source data 5
Full raw uncropped, unedited western blot files and Ponceau stains used for analysis displayed in Figure 7I–L.
- https://cdn.elifesciences.org/articles/103620/elife-103620-fig7-data5-v1.zip
-
Figure 7—source data 6
PDF file containing annotated original western blot files and Ponceau stains for Figure 7I–L.
- https://cdn.elifesciences.org/articles/103620/elife-103620-fig7-data6-v1.zip
Figure 7—figure supplement 1
Mass spectrometry-based proteomics reveals molecular changes in the brains of Trio variant mice compared to WT mice.
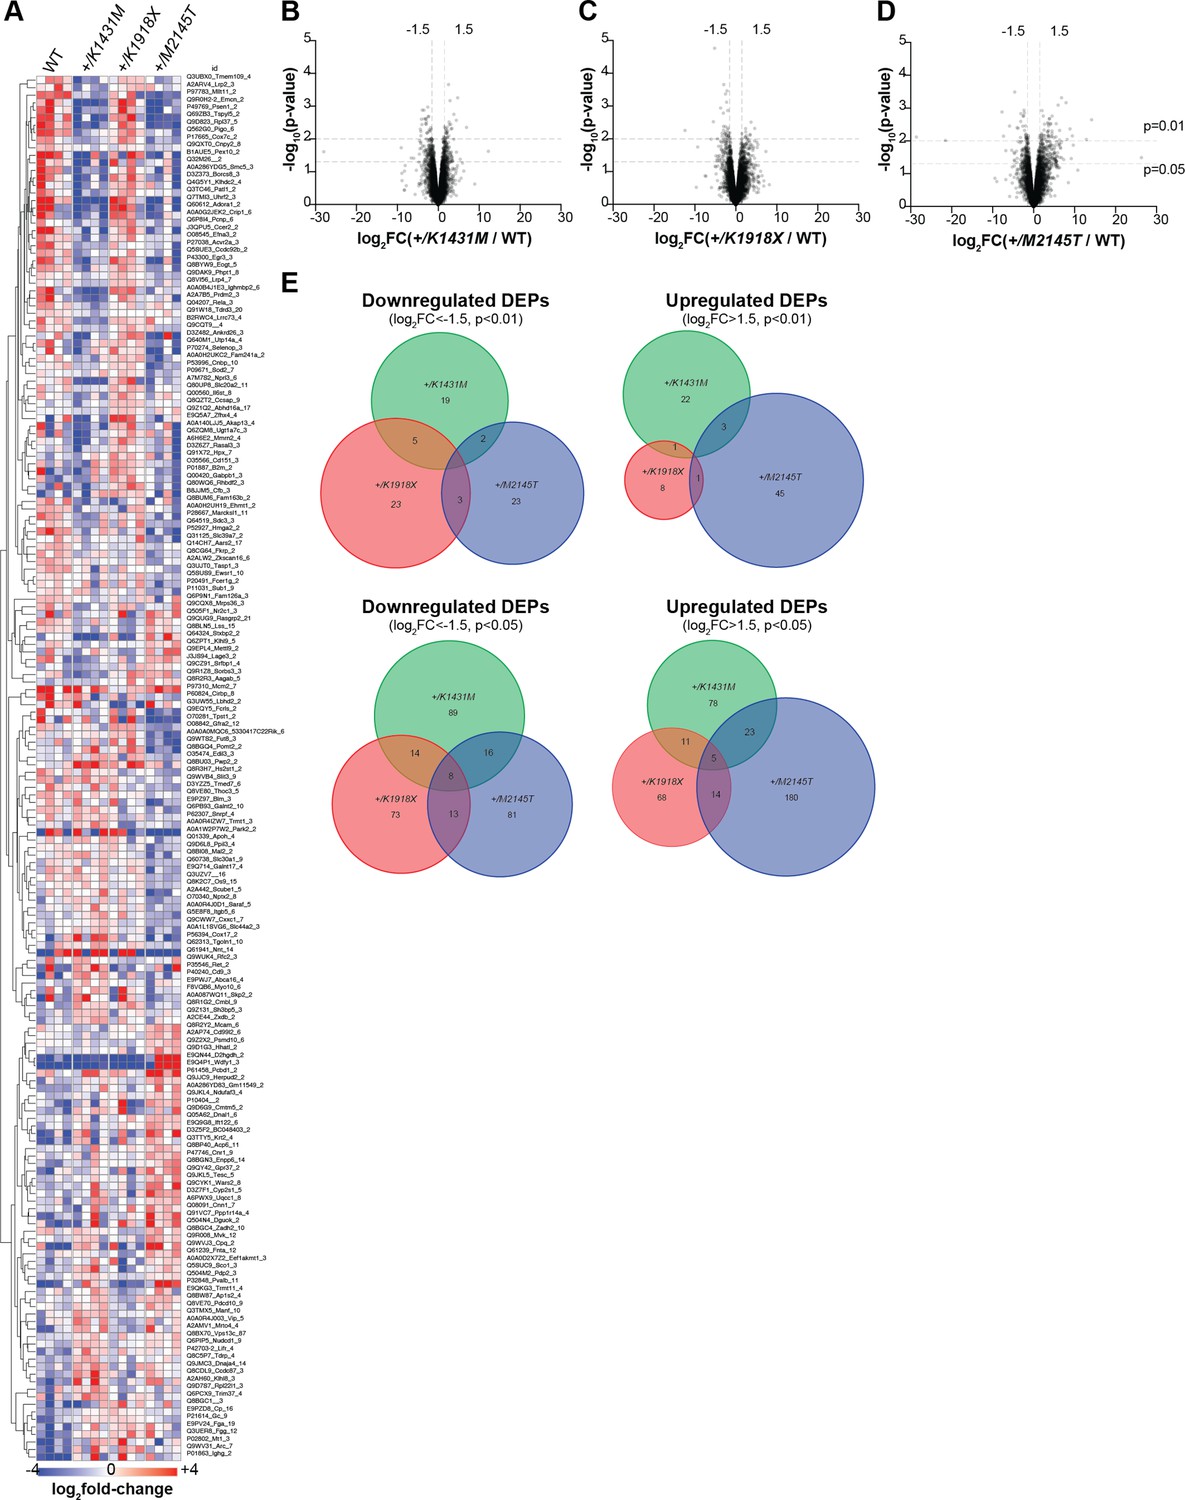
(A) Heatmap of select protein abundances in P21 cortex of WT and Trio variant mice shows genotype differences. Each row is a protein, each column a mouse (n=4 mice per genotype). Displayed are 184/7362 proteins with significant differences (p<0.01, t-test). Red = upregulated, blue = downregulated, sorted by k-means clustering. Complete list of proteins shown in Figure 7—figure supplement 1—source data 1. (B–D) Volcano plots of differentially expressed proteins (DEPs) identified by proteomics for P21 +/K1431M (B), +/K1918X (C), and +/M2145T (D) mice, expressed as log2(fold-change, FC) relative to WT mice (from n=4 mice per genotype). DEPs that are increased in the mutant compared to WT have a positive log2FC, while DEPs that are decreased in the mutant compared to WT have a negative log2FC. Dotted lines on y-axis indicate cutoffs of p<0.01 and p<0.05; dotted lines on x-axis indicate cutoffs of log2FC <−1.5 (downregulated DEPs) or log2FC >1.5 (upregulated DEPs). (E) Venn diagrams show little overlap in the up- and down-regulated DEPs between Trio variant mice, using DEP cut-off values of log2FC >1.5 (upregulated DEPs) or log2FC <−1.5 (downregulated DEPs), and p<0.01 or p<0.05.
-
Figure 7—figure supplement 1—source data 1
Proteome of P21 cortex from Trio WT, +/K1431M, +/K1918X, and +/M2145T mice.
- https://cdn.elifesciences.org/articles/103620/elife-103620-fig7-figsupp1-data1-v1.xls
Figure 8
NSC, Rac1 inhibitor application rescued Pr in +/K1431M L23-L5 synapses and improved SV recycling.
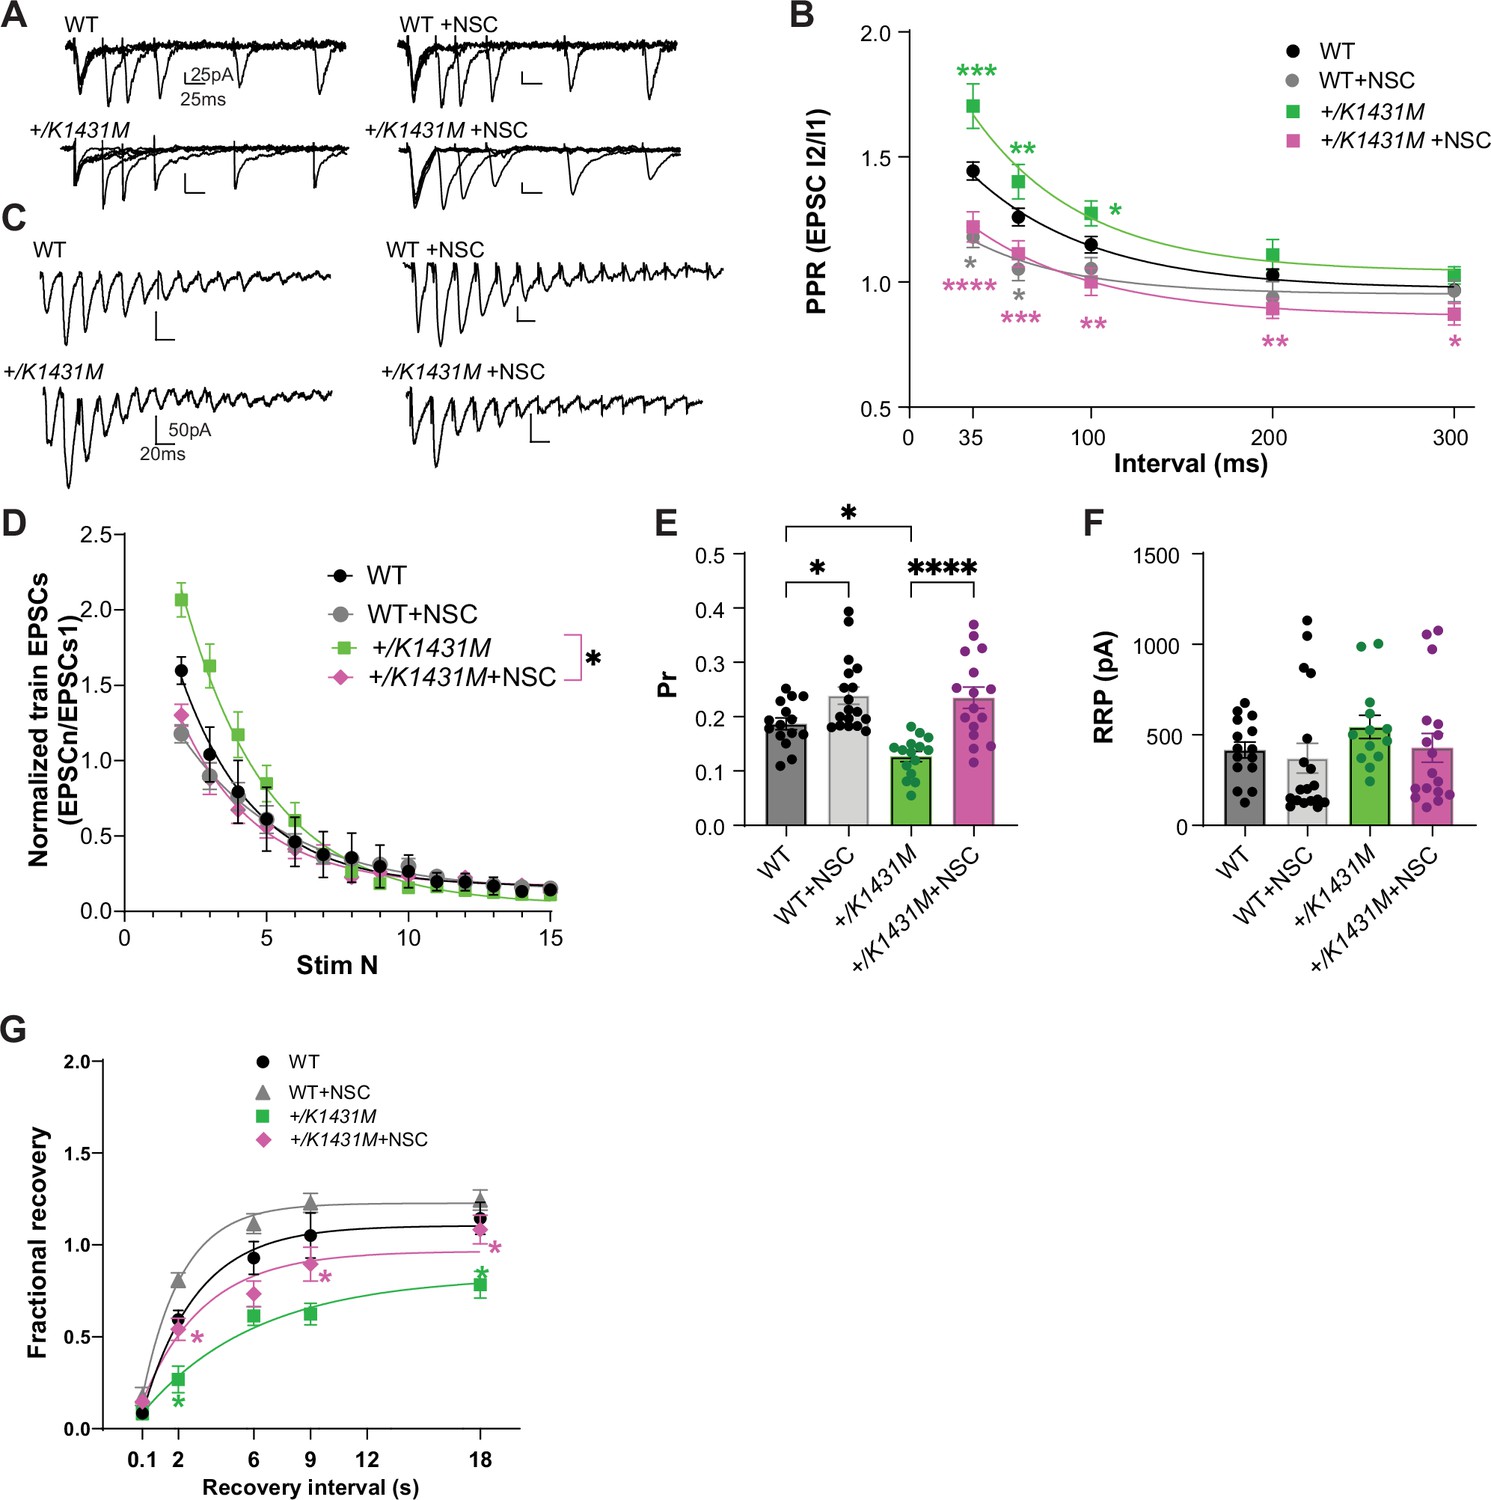
(A) Representative PPR traces of WT and Trio +/K1431M slices with or without 5 min application of 100 µM NSC23766. (B) Acute application of NSC onto both +/K1431M and WT synapses leads to a decrease in PPF in M1 L2/3-L5 synapses. +/K1431M slices significantly shifted the PPF curve at all ISI downwards compared to untreated +/K1431M slices and showed no significant difference from WT (+/K1431M+NSC 35ms: 1.25±0.06, p<0.0001; 60ms: 1.13±0.052, p=0.0007; 100ms: 1.02±0.053, p=0.0017; 200ms 0.91±0.039, p=0.0043; 300ms 0.88±0.045, p=0.021), with +/K1431M shifting into paired pulse depression at 200–300ms intervals, while WT PPF plateauing to 1. (C) Representative traces of AMPAR eEPSCs in M1 L5 PNs under HFS of WT and Trio +/K1431M slices before and after NSC application. (D) Normalized AMPAR eEPSCn amplitudes of the train revealed changes in the depletion rates during HFS before and after NSC application to WT and +/K1431M slices (tau decay (τd), WT +NSC: 2.85 s vs WT: 2.70 s; +/K1431M+NSC: 2.66 s vs +/K1431M: 3.19 s, n=12–15 neurons from 5 to 7 mice). (E) Rac1 inhibition by NSC increased the glutamate Pr in both WT and +/K1431M slices (WT +NSC 0.25±0.067 vs initial 0.19±0.01, p=0.046; and for +/K1431M+NSC 0.23±0.019 vs initial 0.13±0.099, p<0.0001; n=15–18 neurons from ≥5 mice per group). (F) RRP in WT or +/K1431M synapses with NSC did not show significant changes to initial values (WT +NSC: 370.3±82.37 pA vs 415.8±43.9 pA, p˃0.99; +/K1431M+NSC: 427.9±79.2 vs 543.1±64.44 pA, p˃0.99). (G) Exponential fits of the fractional recovery for WT and +/K1431M with and without NSC application. NSC application led to a faster recovery time in WT (+NSC: 1.5 s vs initial 2.2 s) and it significantly improved but did not fully rescue recovery time in +/K1431M (+NSC 3.2 s vs initial 5.7 s), but allowed for full recovery at 18 s. Data are presented as mean ± SEM, significance tested using one-way ANOVA with post-hoc Bonferroni (*p<0.05; **p<0.01; ***p<0.001; ****p<0.0001).
Tables
Key resources table
| Reagent type (species) or resource | Designation | Source or reference | Identifiers | Additional information |
|---|---|---|---|---|
| Strain, strain background (Mus musculus) | Trio+/+(C57Bl/6) | Jax Laboratories (by Dr. CC Little) | RRID:IMSRJAX:000664 | Both sexes |
| Strain, strain background (Mus musculus) | Trio+/K1431M | This paper | K1431M | Both sexes (see Generation of Trio mutant mice) |
| Strain, strain background (Mus musculus) | Trio+/K1918X | This paper | K1918X | Both sexes (see Generation of Trio mutant mice) |
| Strain, strain background (Mus musculus) | Trio+/M2145T | This paper | M2145T | Both sexes (see Generation of Trio mutant mice) |
| Sequence-based reagent | 5'-tgtaatacgactcactatagg ACCTGATCAAACCAGTTCA Ggttttagagctagaaatagc-3’ | This paper | sgRNA scaffold sequence K1431M | see Generation of Trio mutant mice |
| Sequence-based reagent | 5'-tgtaatacgactcactatagg AAGCTTCTCACGCACGCA GGgttttagagctagaaatagc-3’ | This paper | sgRNA scaffold sequence K1918X | see Generation of Trio mutant mice |
| Sequence-based reagent | 5'-tgtaatacgactcactatagg ATGACATGATGAACGTC GGGgttttagagctagaaatagc-3’ | This paper | sgRNA scaffold sequence M2145T | see Generation of Trio mutant mice |
| Sequence-based reagent | 5’-gccaattccatctcttcctACCTGAT CAAACCTGTACAGCG TataacaaTgtatcagctcctttt aaaggtgtgtatgaaacattgtccatctgca acatcacaccctgtgttgatatgtatcccct-3’ | This paper | Recombination template oligos K1431M | see Generation of Trio mutant mice |
| Sequence-based reagent | 5’-agctgccatctatggcaaaggcatttgta cacaggtgtgagagtgactcgcgaa ACTGCTGCATGCGTGAGAAGCT TaccattttgctttAcacgagttctt caatagcactgacgagctcagctgcgctgggag-3’ | This paper | Recombination template oligos for K1918X | see Generation of Trio mutant mice |
| Sequence-based reagent | 5’-agggcccctcaataaacaatgcattacgtcaaatccctgca GTCGACCAacgttcatcG tgtcattacagcgcttcggcacgat gcacatgacttctacagctttctgtggg tggagagaaagca-3’ | This paper | Recombination template oligos for M2145T | see Generation of Trio mutant mice |
| Sequence-based reagent | primer pairs: GFP_For: 5’-gcacgacttcttcaagtccgccatgcc-3’ GFP_Rev: 5’-gcggatcttgaagttcaccttgatgcc-3’ | This paper | Mice genotyping | see Generation of Trio mutant mice |
| Sequence-based reagent | primer pairs: Trio1431_For: 5’-ttgtcattaatgtggtactgtgccc-3’ Trio1431_Rev: 5’-gacaggccaagaaatgtcagtg-3’ | This paper | Mice genotyping | see Generation of Trio mutant mice |
| Sequence-based reagent | primer pairs: Trio1918_ For: 5’-tacgagggagttcactgtctg-3’ Trio1918_Rev: 5’-agtgcaggctatgcttcgttta-3’ | This paper | Mice genotyping | see Generation of Trio mutant mice |
| Sequence-based reagent | primer pairs: Trio2145_For: 5’-gcctggacacatccgaattaga-3’ Trio2145_Rev: 5’-aataaccccggacagaggaaag-3’ | This paper | Mice genotyping | see Generation of Trio mutant mice |
| Antibody | Rabbit anti-TRIO SR5-6 | Katrancha et al., 2019 | WB (1:1000) | |
| Antibody | Rabbit anti-TRIO DH2 | Katrancha et al., 2019 | WB (1:1000) | |
| Antibody | Mouse anti-PSD95 | NeuroMab | Cat#: K28/43 | WB (1:5000) |
| Antibody | anti-Synaptophysin (Syp; rabbit monoclonal) | Cell Signaling | Cat#: 36406 S | WB (1:5000) |
| Antibody | anti-Munc18-1/Stxbp-1 (rabbit monoclonal) | Abcam | Cat#: 109023 | WB (1:1000) |
| Antibody | anti-Syntaxin-1a (Stx1a; rabbit monoclonal) | Synaptic Systems | Cat#: 110 118 | WB (1:5000) |
| Antibody | anti-Synaptotagmin3 (Syt3; rabbit polyclonal) | Synaptic Systems | Cat#: 105 133 | WB (1:500) |
| Antibody | Rabbit anti-Kalirin (rabbit polyclonal) | Yan et al., 2015 | (CT302) | WB (1:1000) |
| Antibody | anti-Tiam1 (rabbit monoclonal) | Cell Signaling | Cat#: 31128 | WB (1:1000) |
| Antibody | anti-VAV2 (rabbit recombinant monoclonal) | Abcam | Cat#: 52640 | WB (1:5000) |
| Antibody | anti-Rabbit IgG(H+L)-HRP conjugate (goat polyclonal) | Bio-Rad | Cat#: 170–6515 | WB (1:5000) |
| Antibody | anti-Mouse IgG(H+L)-HRP conjugate (goat polyclonal) | Bio-Rad | Cat#: 172–1011 | WB (1:5000) |
| Antibody | anti-NeuN (chicken polyclonal) | Synaptic Systems | Cat#: 266 006 | IF (1:2000) |
| Antibody | anti-Parvalbumin (PV; guinea pig monoclonal) | Swant | Cat#: GP72 | IF (1:1000) |
| Antibody | anti-Chicken IgY (H+L), AlexaFluor 488 (goat polyclonal) | ThermoFisher | Cat#: A-11039 | IF (1:2000) |
| Antibody | anti-Rabbit IgG(H+L), AlexaFluor 568 (goat polyclonal) | ThermoFisher | Cat#: A-11011 | IF (1:2000) |
| Commercial assay, kit | DAPI | Invitrogen | Cat#: D21490 | IF (1:10,000) |
| Chemical compound, drug | Kynurenic acid | Tocris Bioscience | Cat# 3694 | See Materials and Methods, Electrophysiology section |
| Chemical compound, drug | Lidocaine N-ethyl bromide (QX-314) | Tocris Bioscience | Cat# 2313 | See Materials and Methods, Electrophysiology section |
| Chemical compound, drug | D-2-Amino-5-phosphonovaleric acid (D-AP5) | Tocris Bioscience | Cat# 0106 | See Materials and Methods, Electrophysiology section |
| Chemical compound, drug | (-)-bicuculline methochloride (BMI) | Tocris Bioscience | Cat# 0109 | See Materials and Methods, Electrophysiology section |
| Chemical compound, drug | Strychnine hydrochloride | Tocris Bioscience | Cat# 2785 | See Materials and Methods, Electrophysiology section |
| Chemical compound, drug | Cyanquixaline (CNQX) | Tocris Bioscience | Cat# 0190 | See Materials and Methods, Electrophysiology section |
| Chemical compound, drug | NSC23766 | Tocris Bioscience | Cat# 2785 | See Materials and Methods, Electrophysiology section |
| Chemical compound, drug | Tetrodotoxin | Tocris Bioscience | Cat# 1078 | See Materials and Methods, Electrophysiology section |
| Recombinant DNA reagent (human) | WT TRIO GEF1 | Blaise et al., 2022 | Used for recombinant protein purification | |
| Recombinant DNA reagent (human) | K1431M TRIO GEF1 | This paper | Used for recombinant protein purification | |
| Recombinant DNA reagent (human) | Rac1 | Blaise et al., 2022 | Used for recombinant protein purification | |
| Sequence-based reagent | 5’-cagcgaataacgatgtatcagctcc-3’ and 5’-ggagctgatacatcgttattcgctg-3’. | This paper | Oligonucleotides for site-directed mutagenesis (K1431M TRIO GEF1) | see In vitro GEF Assays |
| Commercial assay, kit | BODIPY-FL-GDP | Invitrogene | Cat# G22360 | See Materials and Methods |
| Commercial assay, kit | G-LISA activation assay kits for Rac1 | Cytoskeleton Inc. | Cat# BK128 | See Materials and Methods |
| Commercial assay, kit | G-LISA activation assay kits for RhoA | Cytoskeleton Inc. | Cat# BK124 | See Materials and Methods |
| Software, algorithm | AnyMaze software | Stoelting Co. | Behavioral analysis | |
| Software, algorithm | Fiji | https://fiji.sc/ | RRID:SCR_002285 | IF and WB analysis |
| Software, algorithm | Mini-Analysis software | Synaptosoft | mEPSCs analysis | |
| Software, algorithm | Origin Version 2021 | OriginLab | RRID:2JJ-JT7-8IP | Electrophysiology graphing, signal processing, and analysis |
| Software, algorithm | GraphPad Prism | Dotmatics | V10 | Statistical analysis and graphing |
| Software, algorithm | QuPath software | Bankhead et al., 2017 | V5; https://qupath.github.io/ | Neuroanatomy analysis |
| Software, algorithm | pClamp software suite | Molecular Devices | 11.1 | Electrophysiology recordings, y graphing, signal processing, and analysis |
Additional files
Download links
A two-part list of links to download the article, or parts of the article, in various formats.
Downloads (link to download the article as PDF)
Open citations (links to open the citations from this article in various online reference manager services)
Cite this article (links to download the citations from this article in formats compatible with various reference manager tools)
Heterozygosity for neurodevelopmental disorder-associated TRIO variants yields distinct deficits in behavior, neuronal development, and synaptic transmission in mice
eLife 13:RP103620.
https://doi.org/10.7554/eLife.103620.3


