Iridescent structural coloration in a crested Cretaceous enantiornithine bird from the Jehol Biota
- Key Laboratory of Vertebrate Evolution and Human Origins, Institute of Vertebrate Paleontology and Paleoanthropology, Chinese Academy of Sciences, China
- School of Instrumentation and Optoelectronic Engineering, Beihang University, China
- Department of Biology, Austin College, United States
- State Key Laboratory of Critical Earth Material Cycling and Mineral Deposits, School of Earth Sciences and Engineering, Centre for Research and Education on Biological Evolution and Environment and Frontiers Science Center for Critical Earth Material Cycling, Nanjing University, China
- Institute of Palaeontology, Yunnan Key Laboratory of Earth System Science, Yunnan University, China
- College of Earth and Planetary Sciences, University of Chinese Academy of Sciences, China
- Department of Earth and Planetary Sciences, Jackson School of Geosciences, The University of Texas at Austin, United States
Figures
Figure 1 with 2 supplements
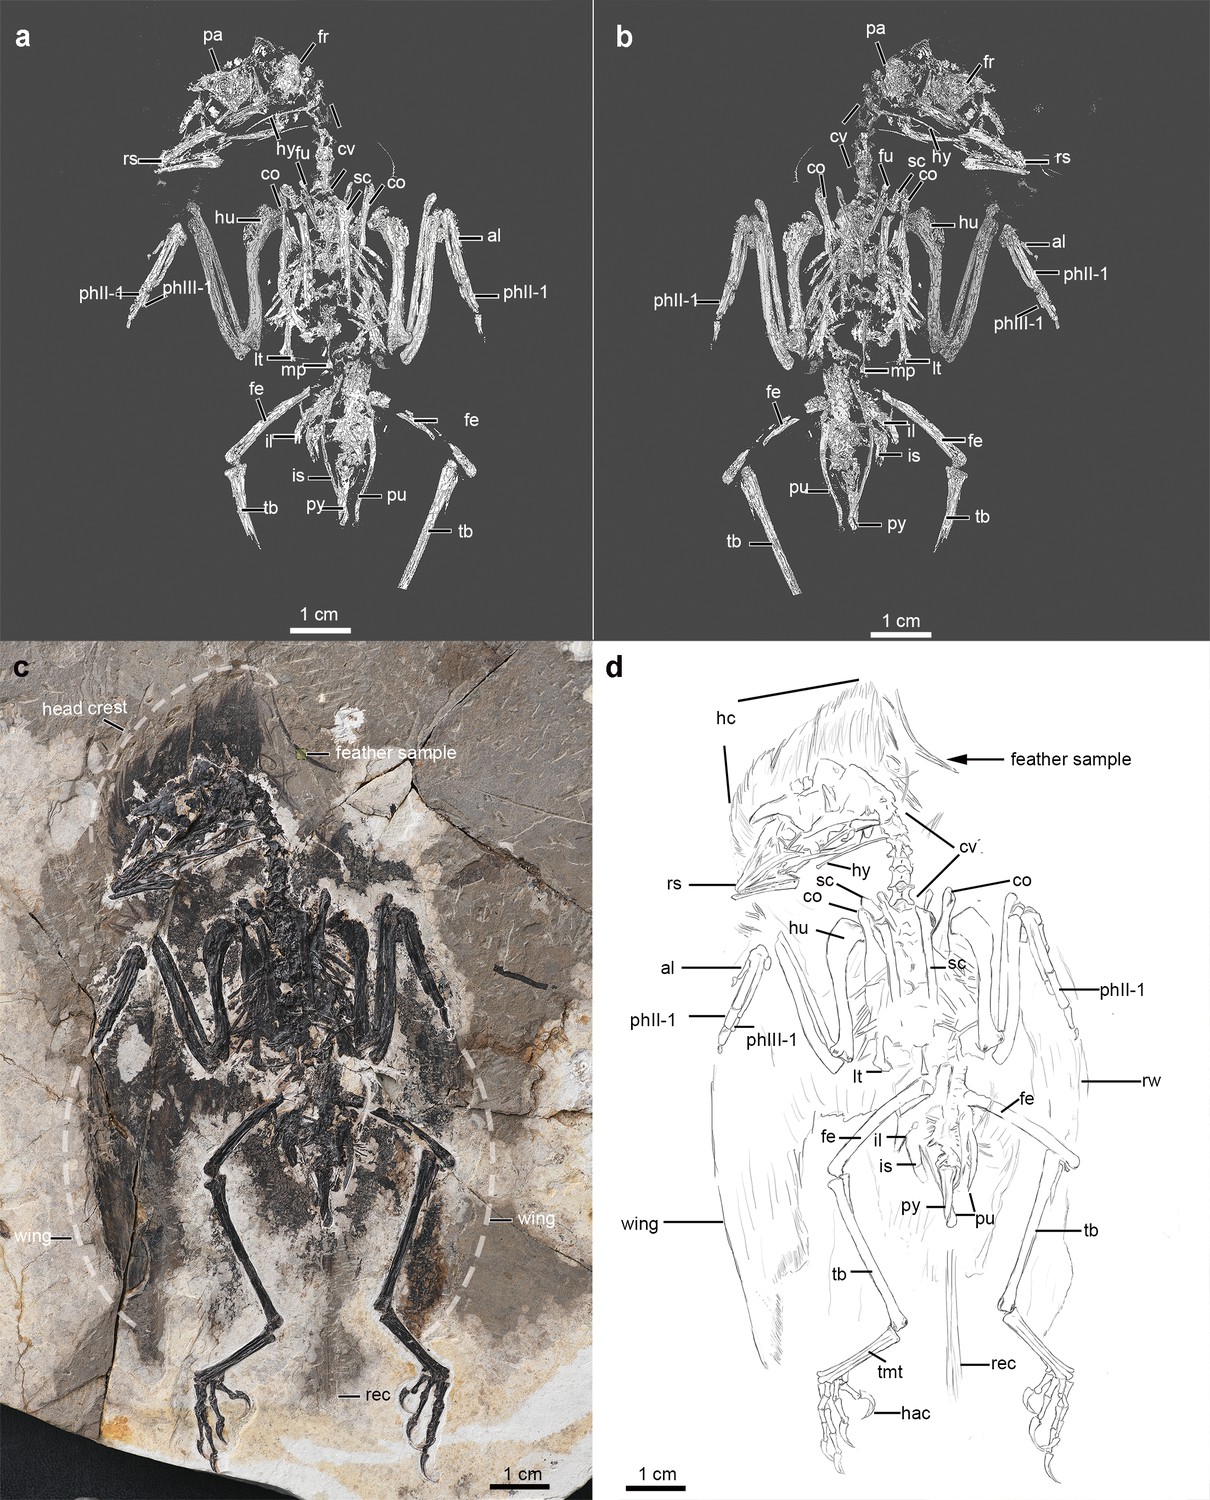
Digital rendering, photography, and line drawing of the enantiornithine fossil specimen (Shanyang sp., IVPP V26899) (a), (c), (d) - dorsal; (b) - ventral view showing the major skeletal elements.
The feather extracted from the crown is labeled as a feather sample (c). Abbreviations: al, alular metacarpal; co, coracoid; cv, cervical vertebra; fe, femur; fi, fibula; fr frontal; fu, furcula; hac, hallucal ungual; hc, head crest; hu, humerus; hy, hyoid; il, ilium; is, ischium; lt, lateral trabecula; mcf, molted crest feather; mc II, major metacarpal; mp, midline process; ph II-1, first digit of phalanx II; phIII-1, first digit of phalanx III; pa, parietal; pu, pubis; py, pygostyle; r, radius; rec, rectrices; rem, remiges; rs, rostrum; rw, right wing; sc, scapula; sk, skull; st, sternum; tb, tibiotarsus; and tmt, tarsometatarsus.
Figure 1—figure supplement 1
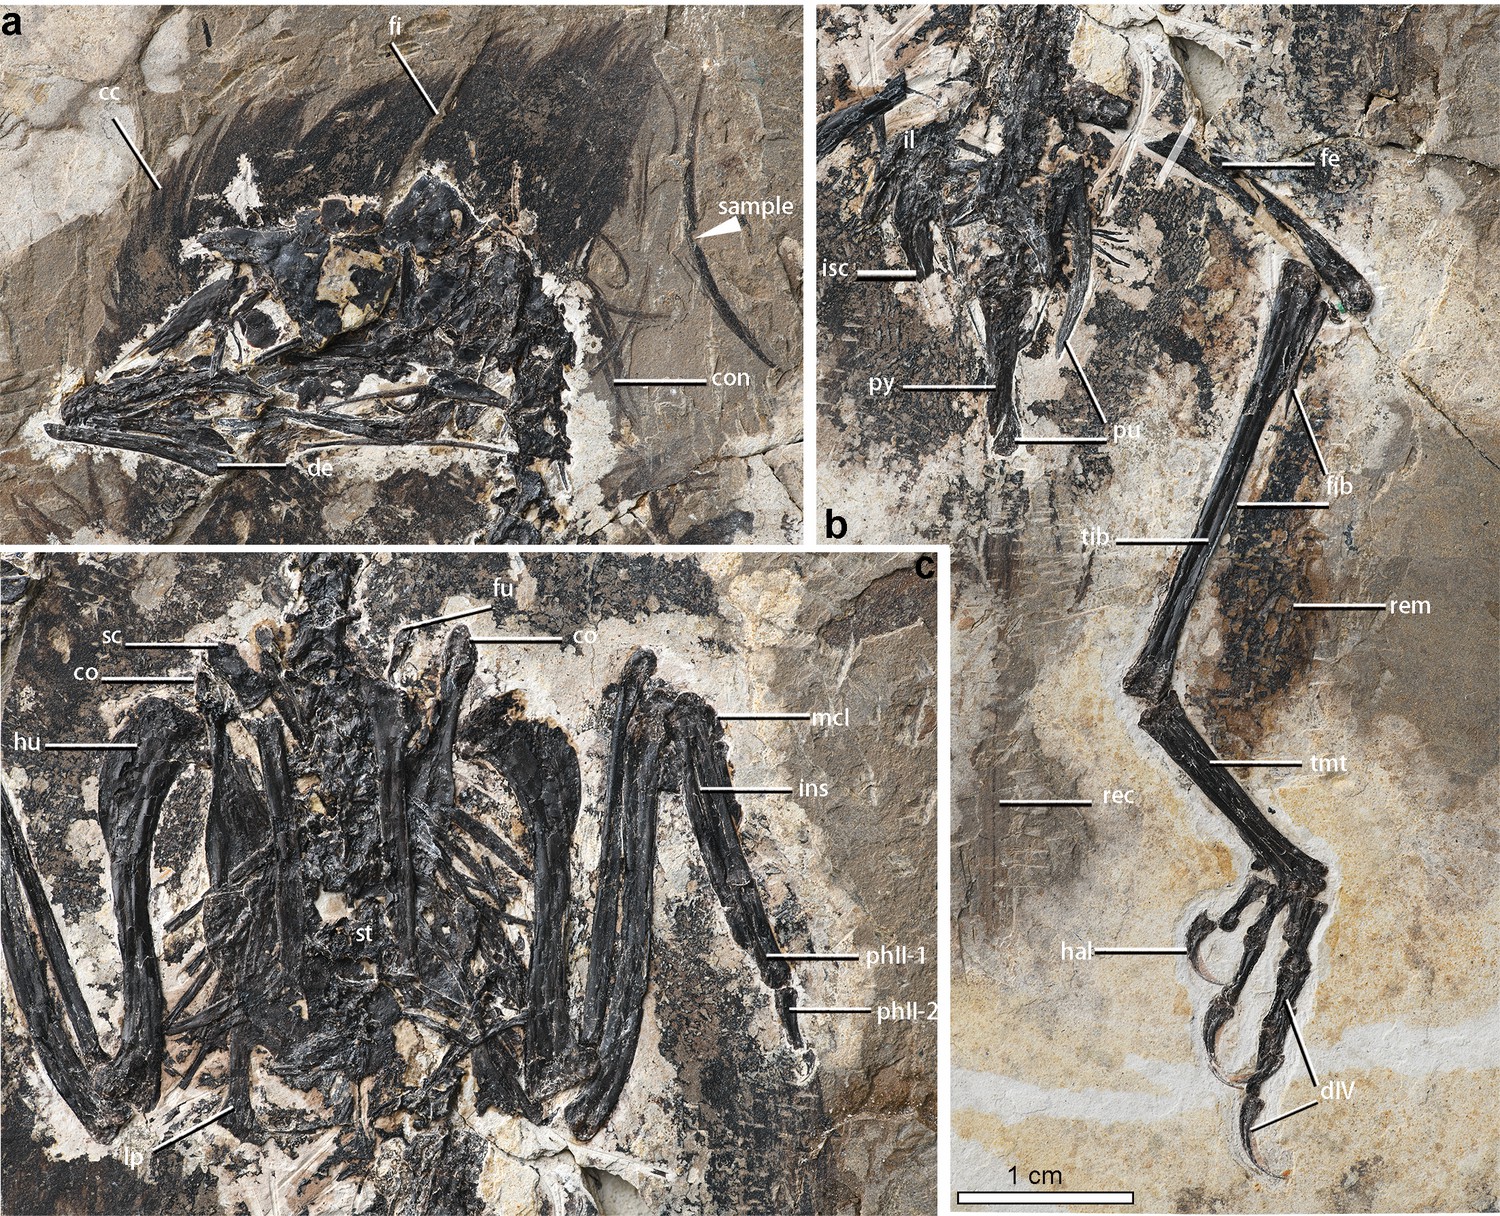
Photograph showing details of skeletal and integumentary anatomy of the new enantiornithine specimen (IVPP V26899): (a)-skull, (b)-pelvis and hindlimb, and (c)-pectoral region.
The sectioned feather is indicated as sample. Abbreviations: cc, cranial crest; co, coracoid; con, contour feather; de, dentary; dIV, pedal digit IV; fe, femur; fi, fissure; fib, fibula; fu, furcula; hal, hallucal ungual; hu, humerus; il, ilium; isc, ischium; lp, lateral process; mcI, metacarpal I; pu, pubis; py, pygostyle; rec, rectrices; sc, scapula; st, sternum; tib, tibiotarsus; and tmt, tarsometatarsus. White transparent bar in (b) indicates the region of the sampled femur fragment for ground sectioning.
Figure 1—figure supplement 2
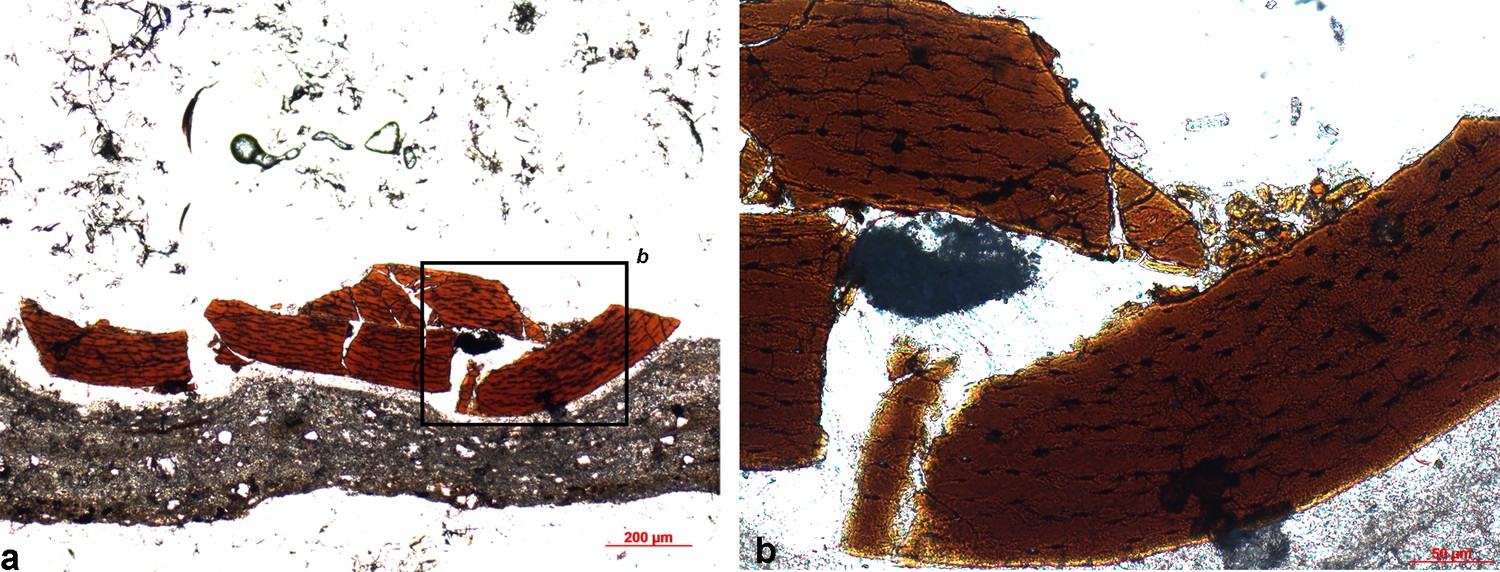
Microscopic ground section images to show the osteo-histological features of the femur sampled (a)-overall view; (b) enlarged view labeled in black box.
Figure 2 with 3 supplements
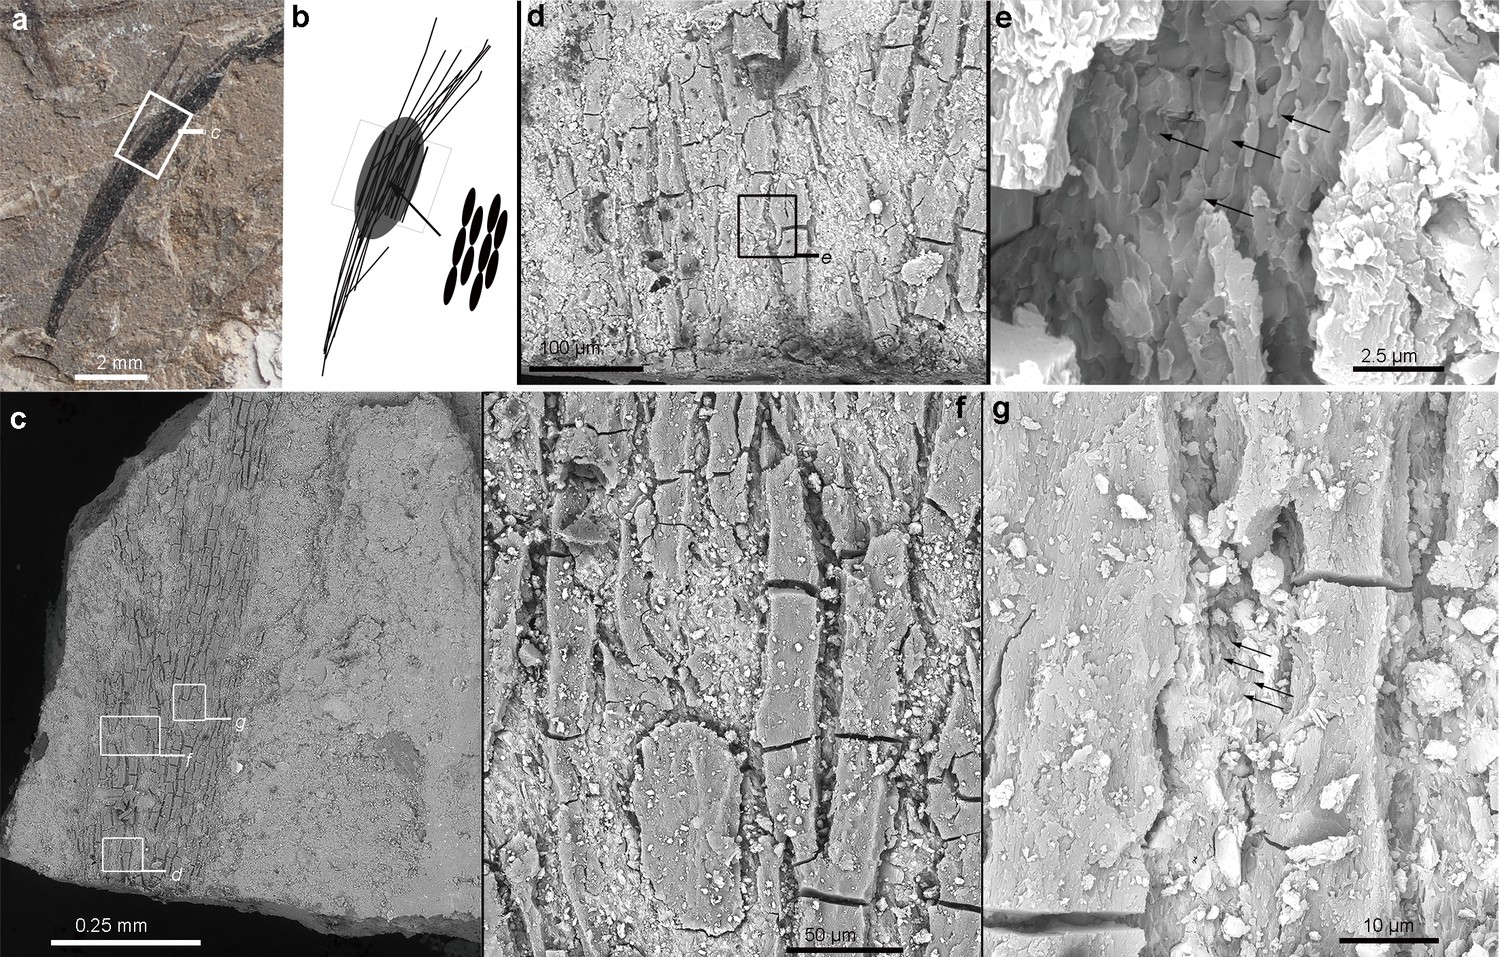
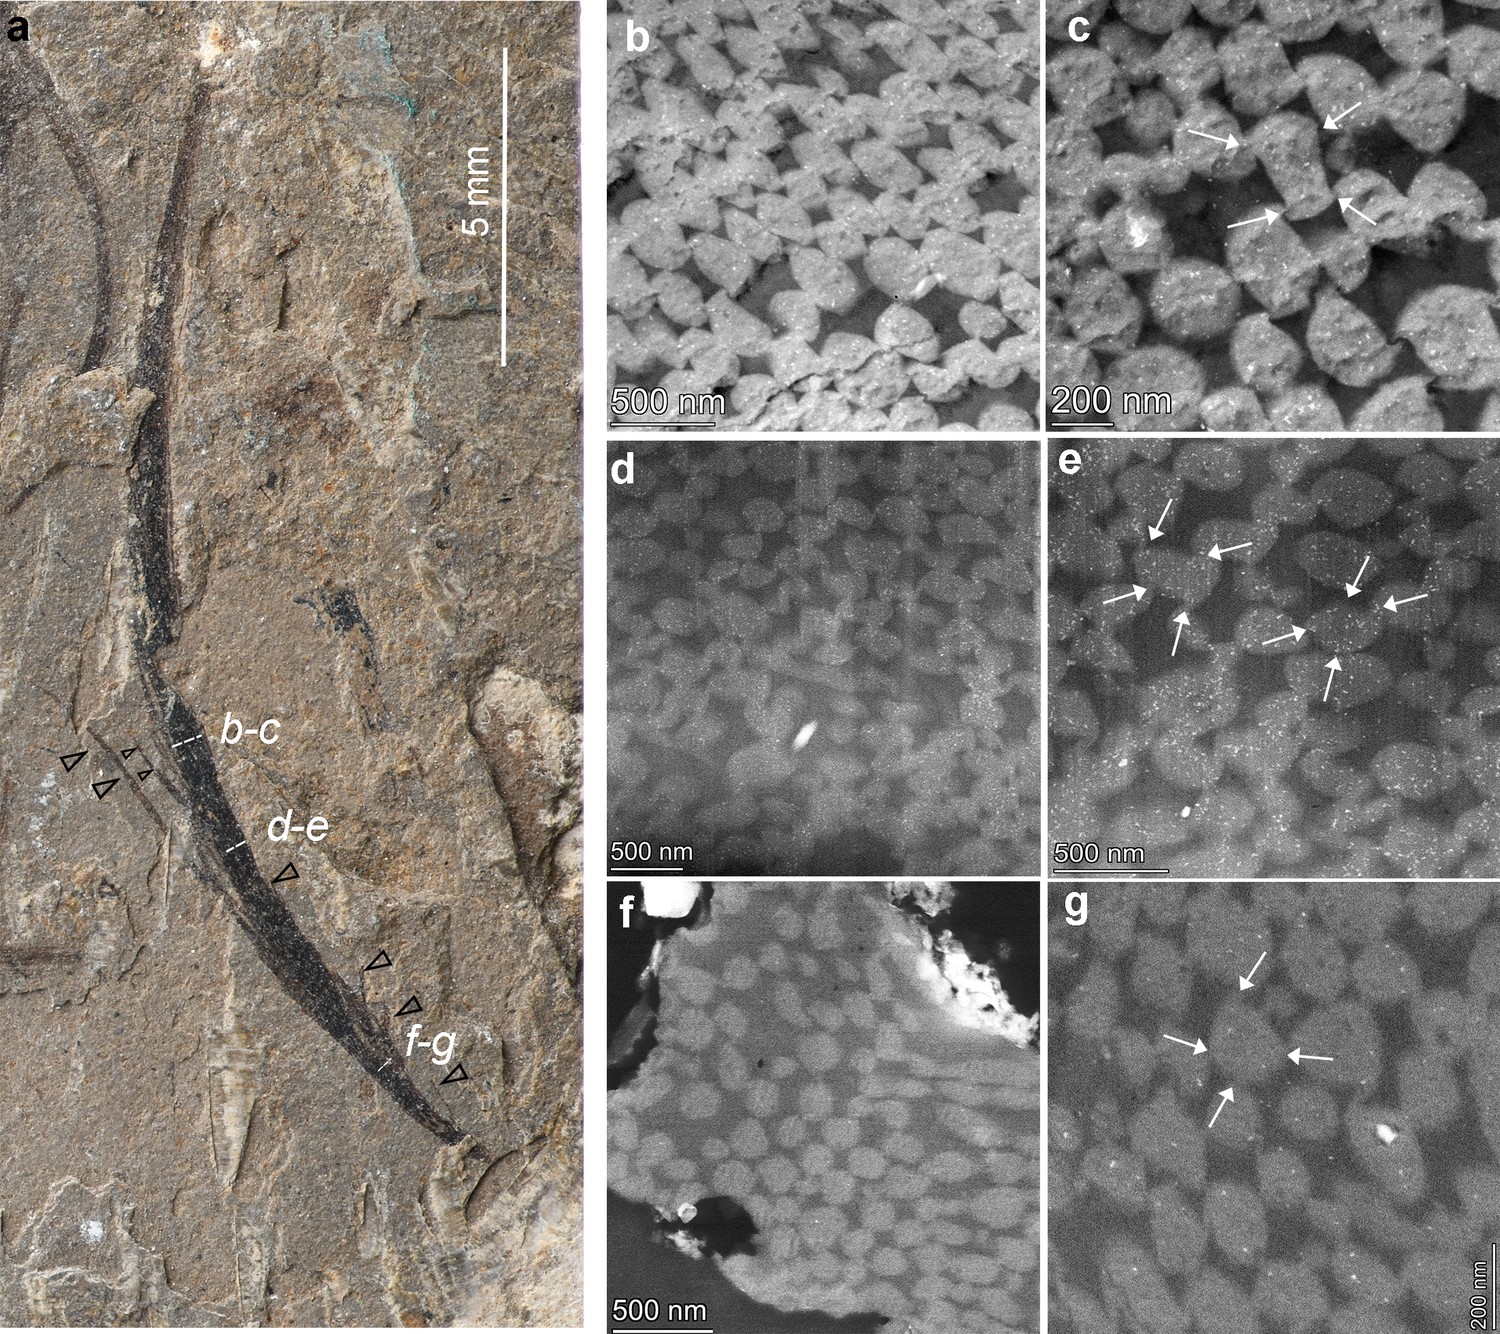
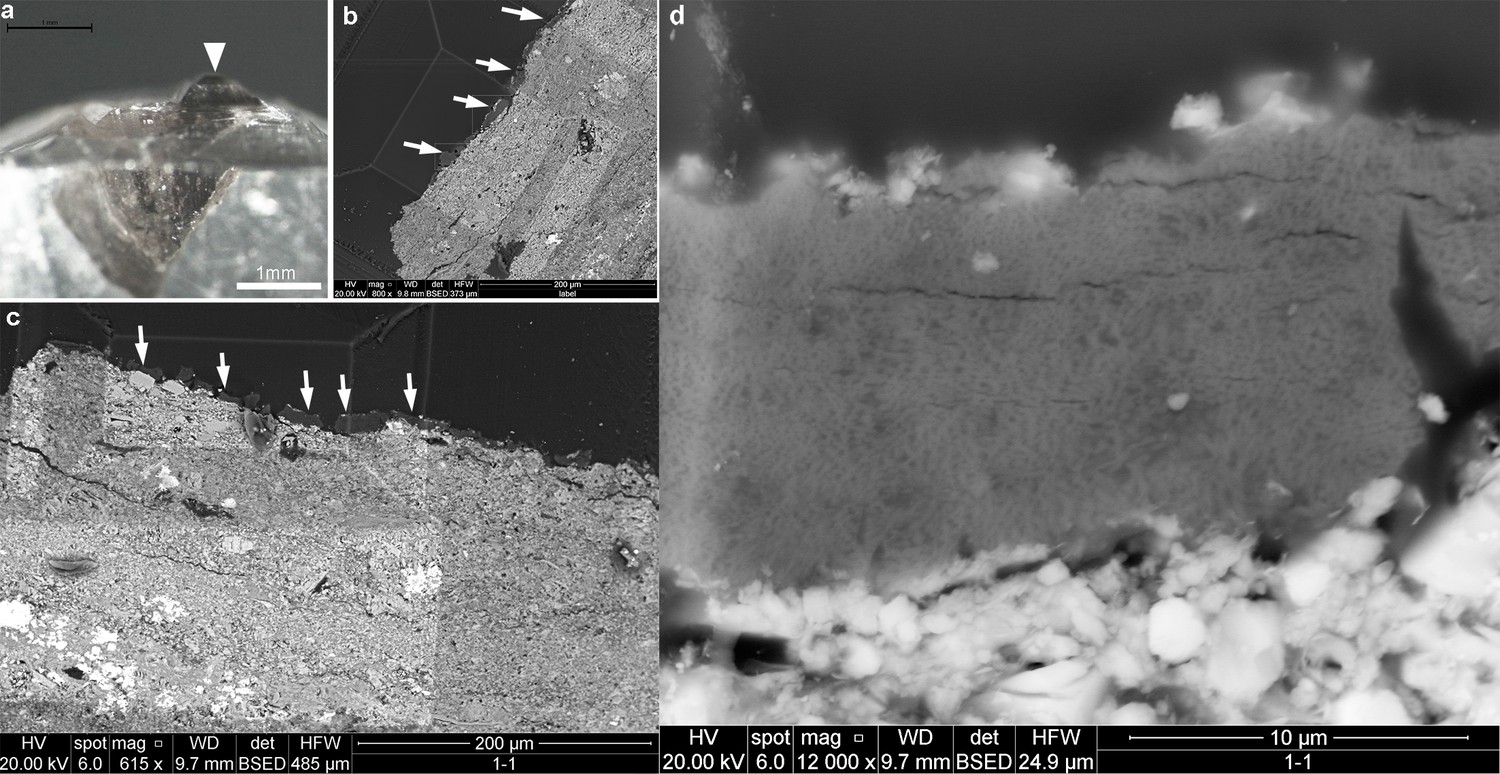
Photograph (a) and simplified line diagram (b) of the sampled isolated long feather with a focused area from SEM imaging (c–g).
As shown in the SEM images, the long elliptical or oval-shaped melanosomes are tightly aligned with their long axis parallel to the elongated barbs (e, g). The position of enlarged images (d, e, f, and g) is indicated as square in (c, d); black arrows in (e) and (g) indicate the melanosome clusters.
Figure 2—figure supplement 1
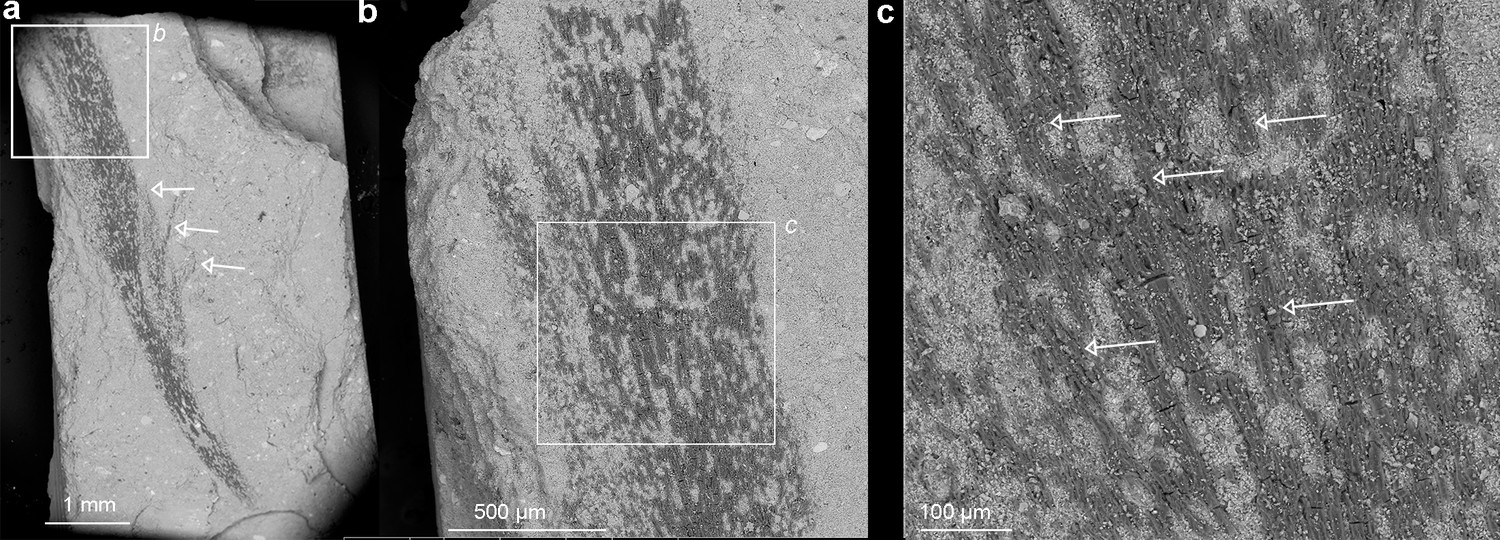
SEM of the serial zoomed view (a to c) to show the lower portion of the sampled crest feather below the sectioned fragment.
The individual barbs are roughly identified and labeled with white arrows; the feather tissue is preserved in stark contrast to the rock matrix under BSD (back scattering diffraction) model in the SEM imaging.
Figure 2—figure supplement 2
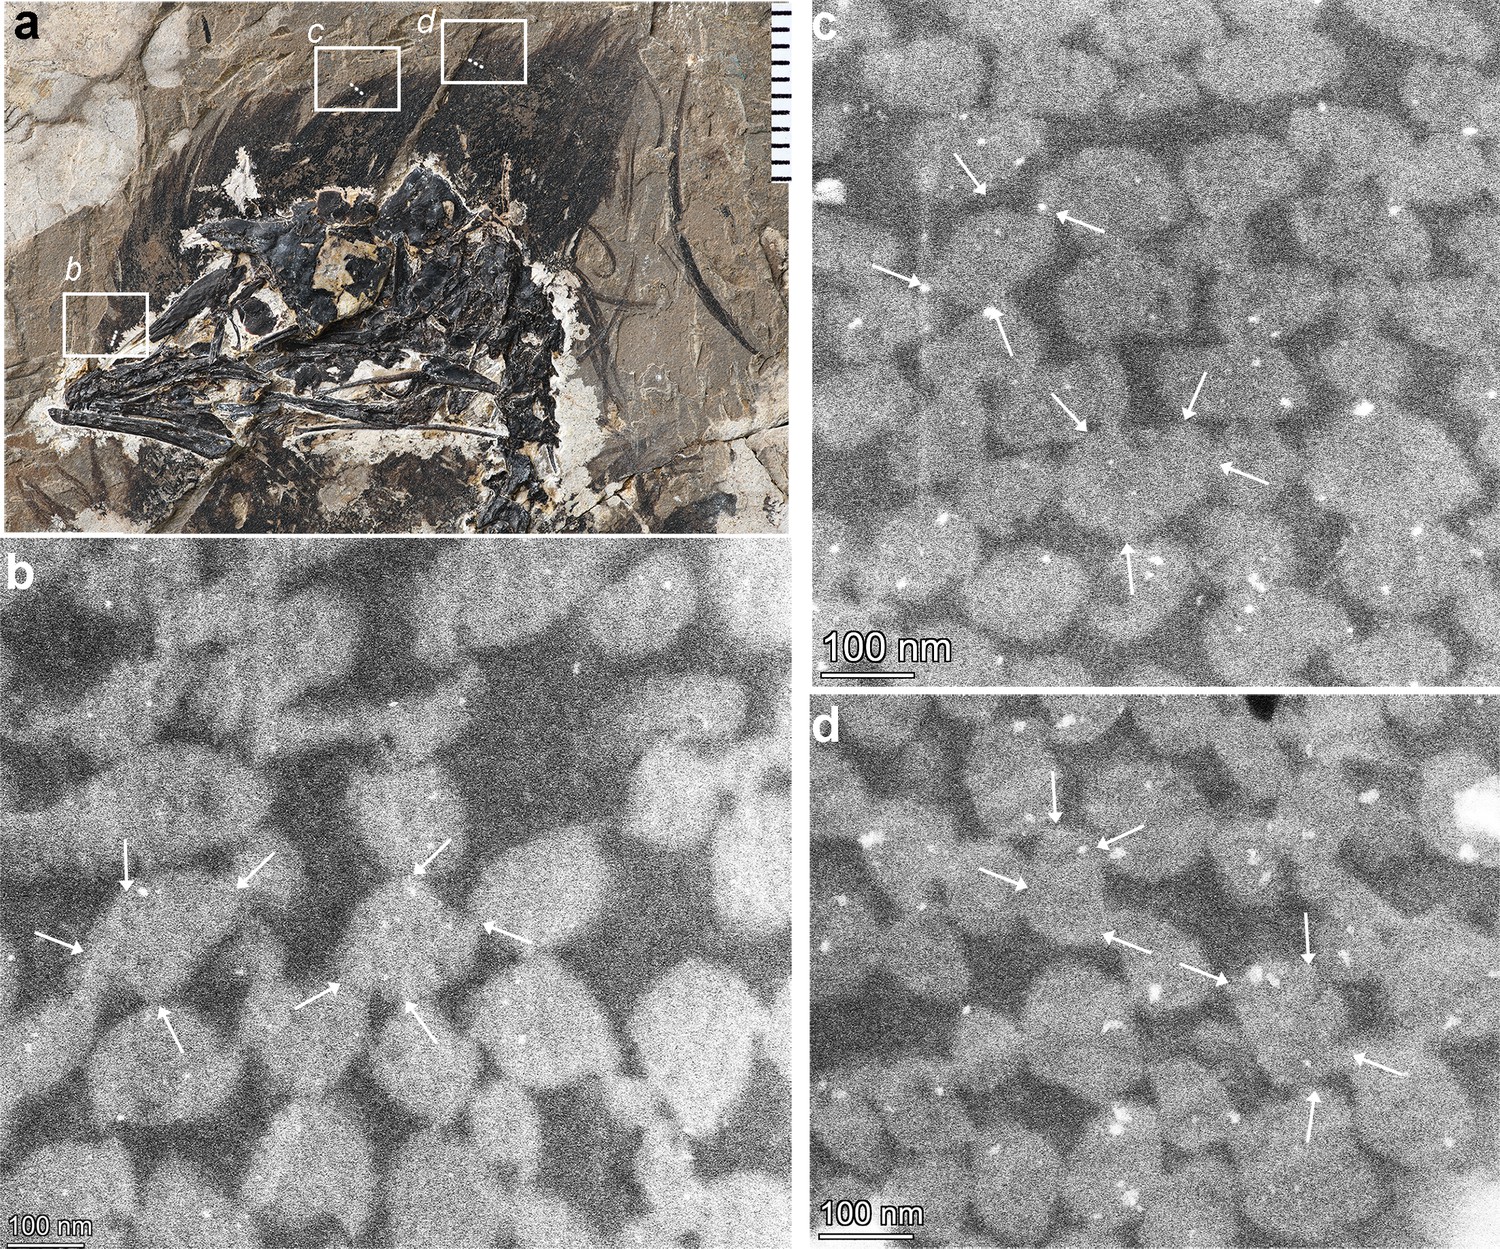
STEM images (b–g) of cross-sections taken from three different positions (indicated by white dashed lines in a) demonstrate similar melanosome packing styles.
Dashed lines labeled in (a) indicate where the corresponding position of these sections was taken, black arrows indicate the individual barbs that accumulated together in this long crest farther. One distinct feature of these sections is the hooked-link structure that aligns the melanosomes into a modified hexagonal, packed arrangement. White arrows (in c, e, g) indicate the hooked structures observed in the selected melanosomes.
Figure 2—figure supplement 3
STEM images showing melanosome structure from three fragments of the feather crest (indicated by dashed lines and a white box in a) reveal the hooked linkages between melanosomes and their surrounding melanosome structures in (b), (c), and (d).
Given the shorter length of these feather barbs, the hook structures are not as well-defined as those in the longer feather samples shown in the main text.
Figure 3 with 2 supplements
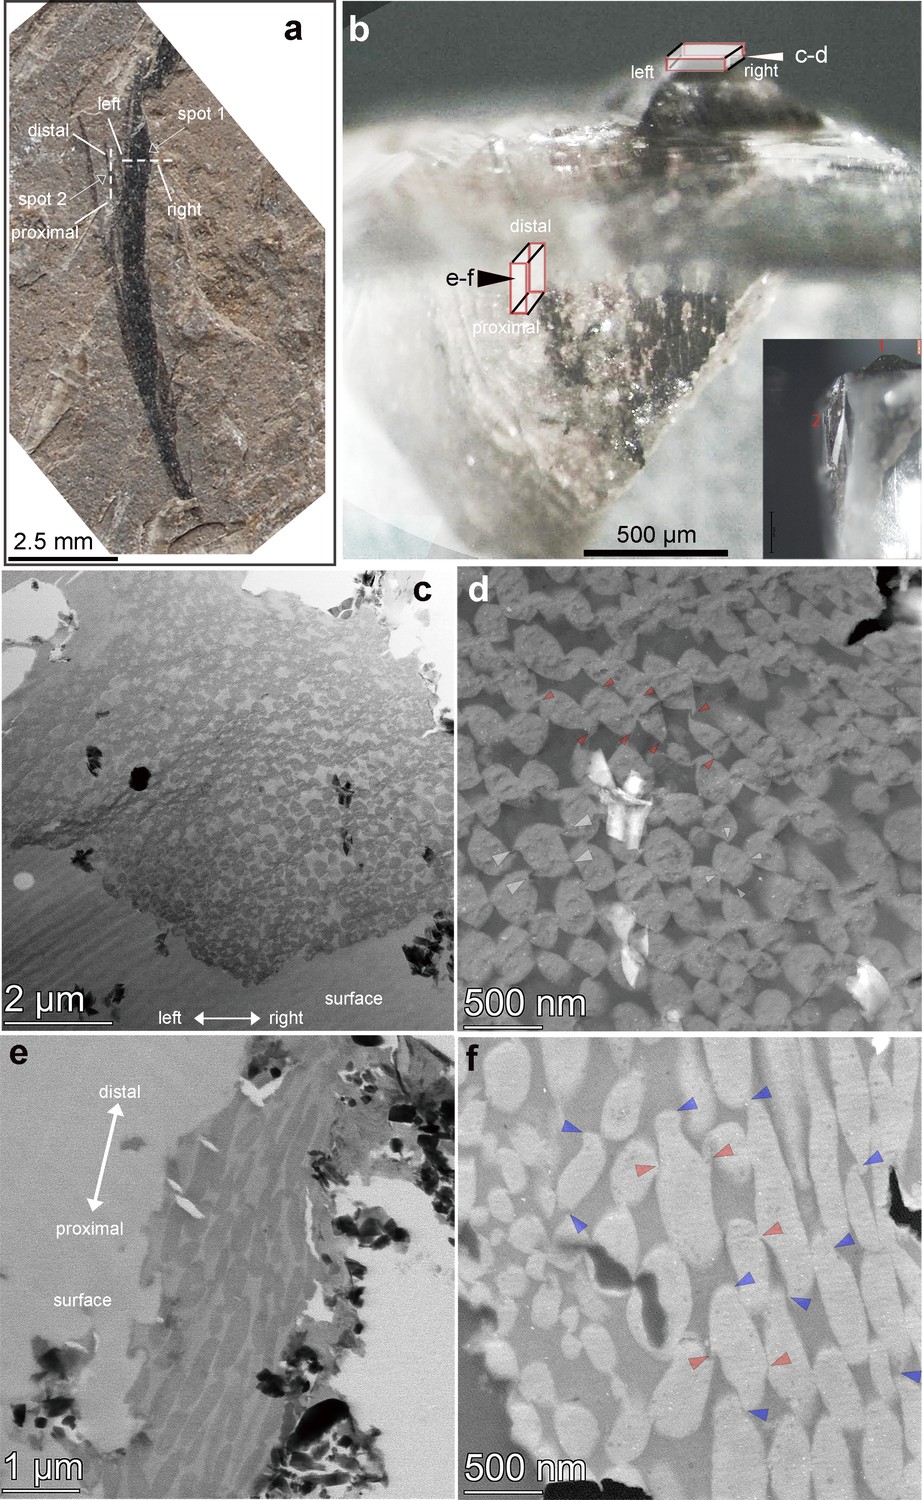
Photograph of the crest feather (a) and prepared blocks of the feather barb (b) for thin sectioning.
The sampled spots for the sliced feather are indicated as long red-colored cubes with their respective positions in (b). (c) to (f) are (STEM) images obtained from individual slices as indicated in (b). The shape and arrangement of the melanosome packing (ACHP, asymmetric compact hexagonal packing) is clearly revealed in (d); (c) and (d) are derived from the cross-section; (e) and (f) are derived from the nearly longitudinal section. As indicated by the red arrows in (d) and (f), the dorsal and ventral hooks are dominant in the cross-sectional images. On the other hand, hooks connecting the proximal and distal arrays of melanosomes are better visualized in the longitudinal section, as labeled with blue arrows in (f). The orientation of the slices was labeled (left, right, proximal, distal) with their respective positioning in the fossil before and during sectioning.
Figure 3—figure supplement 1
Barb surface and cross- section morphology of the sampled fragment of the crest feather.
(a)-light microscopy; (b, c, d) - SEM images of the cross-section to show the melanosome-composed barbs in the sectioned region of the feather fragment. The white arrow in a indicates the trimmed stage for cross sectioning; the arrows in b and c indicate the individual barbs with space in between; the zoomed image (d) shows the layer of melanosomes which entirely comprised the internal region of one barb.
Figure 3—figure supplement 2
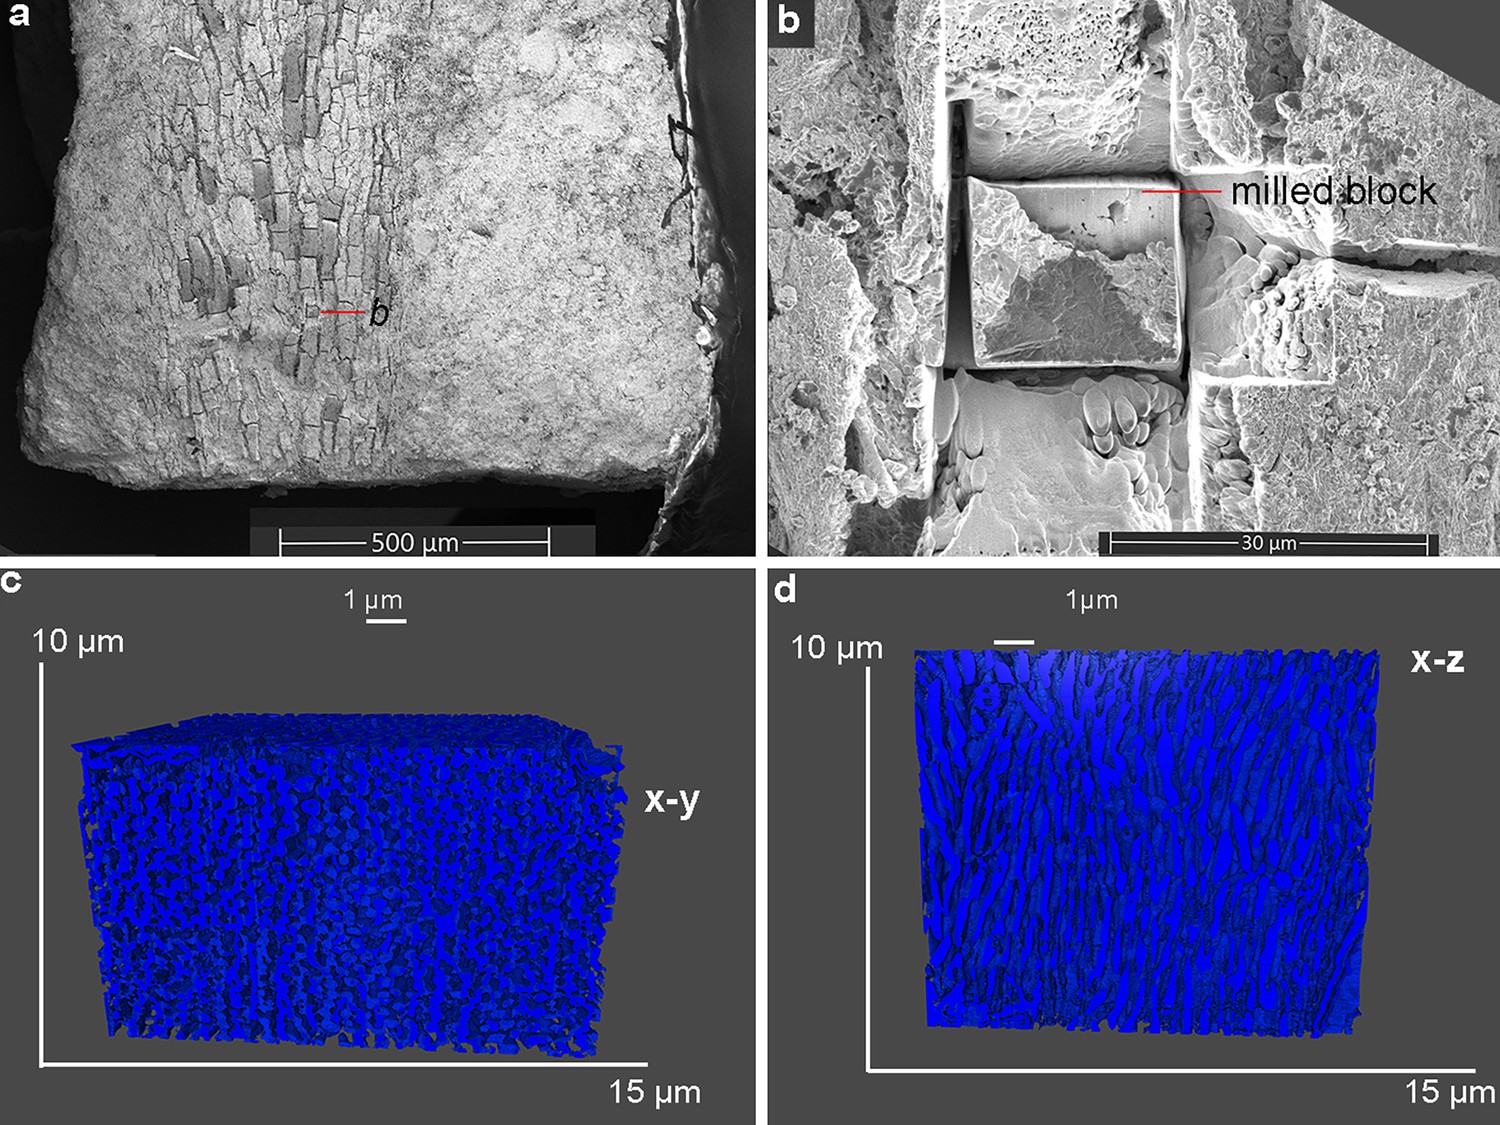
Targeted feather barb block prepared in FIB-SEM, with volume rendering reconstruction based on the acquired sequential cross-sectional images; the volume reconstruction is visualized in the x-y plane (c-cross section view) and in x-z plane (d-sagittal section view).
Figure 4 with 3 supplements
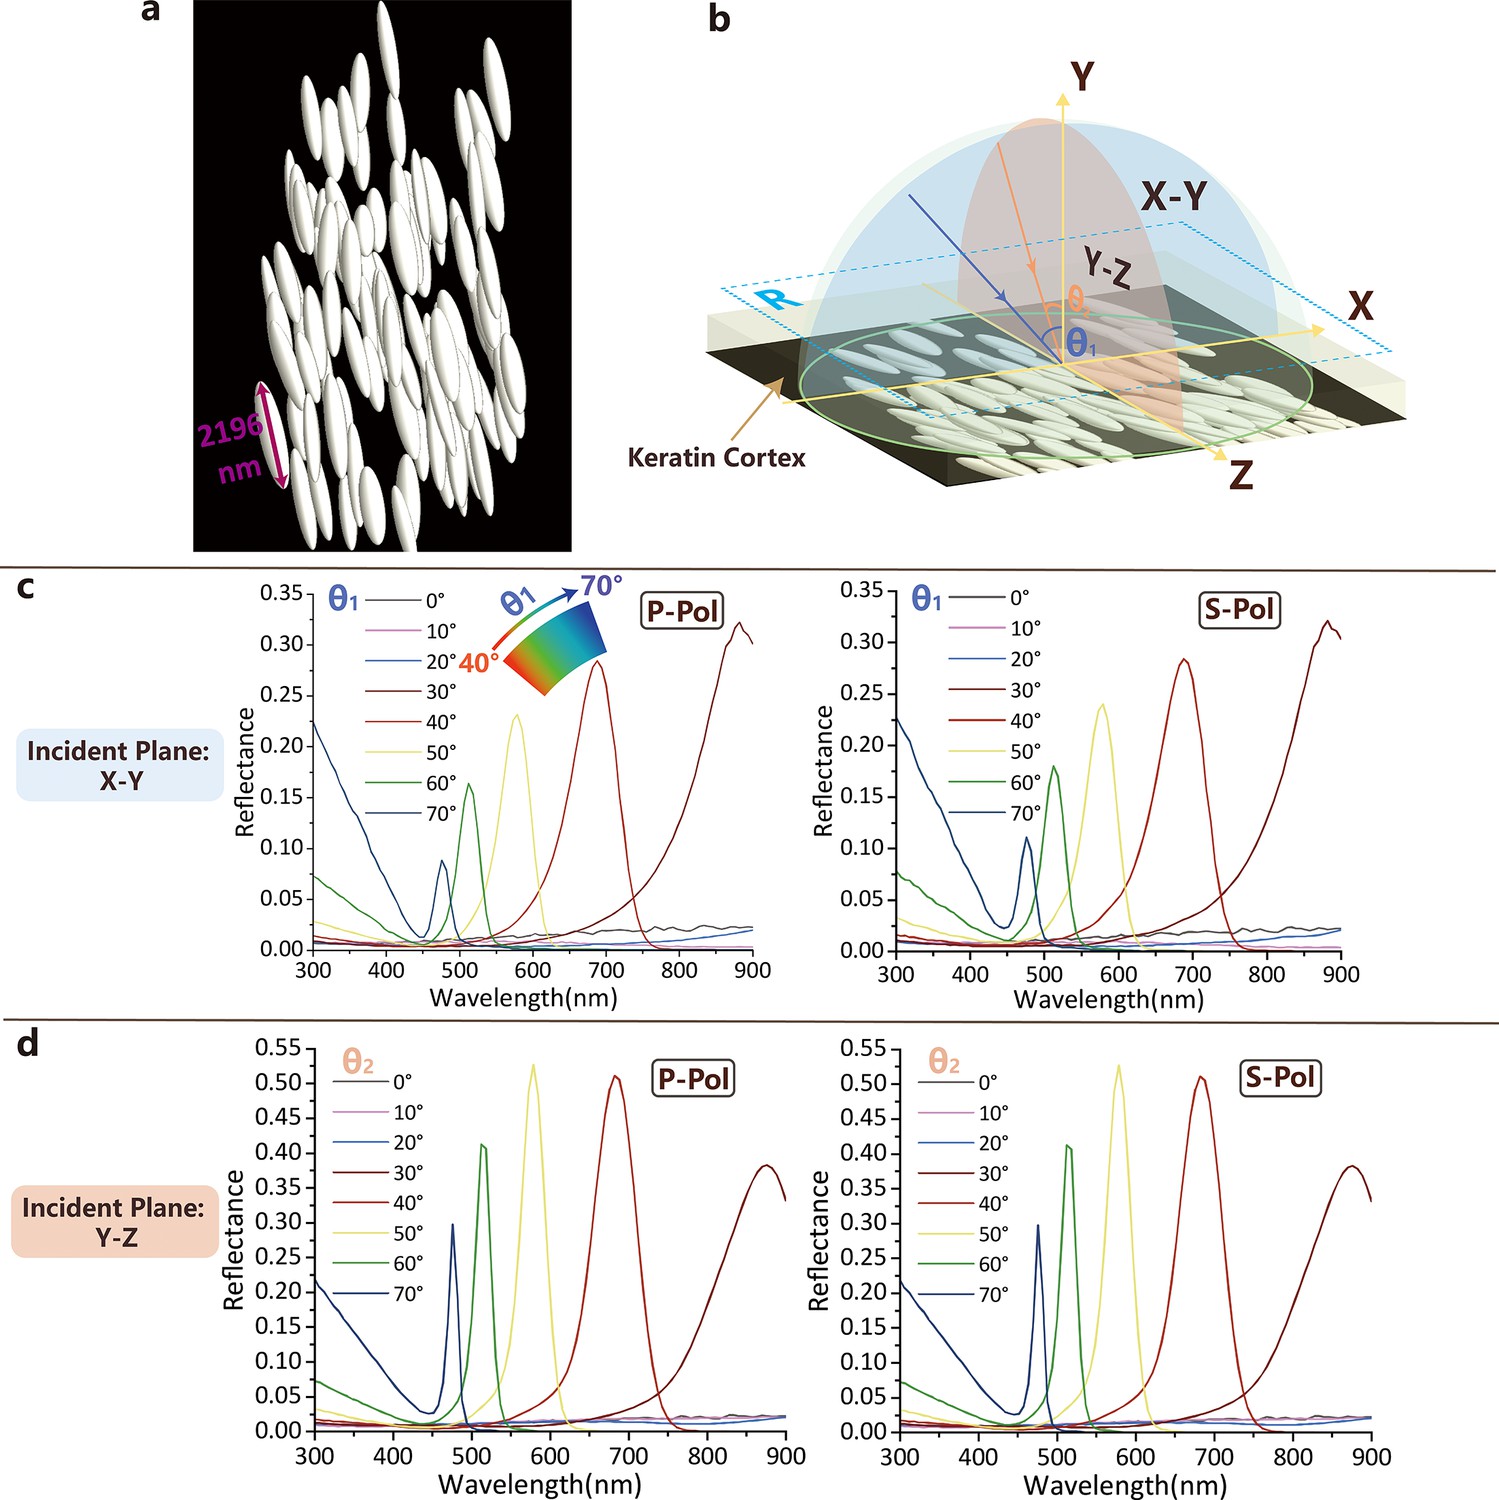
FDTD modeling results.
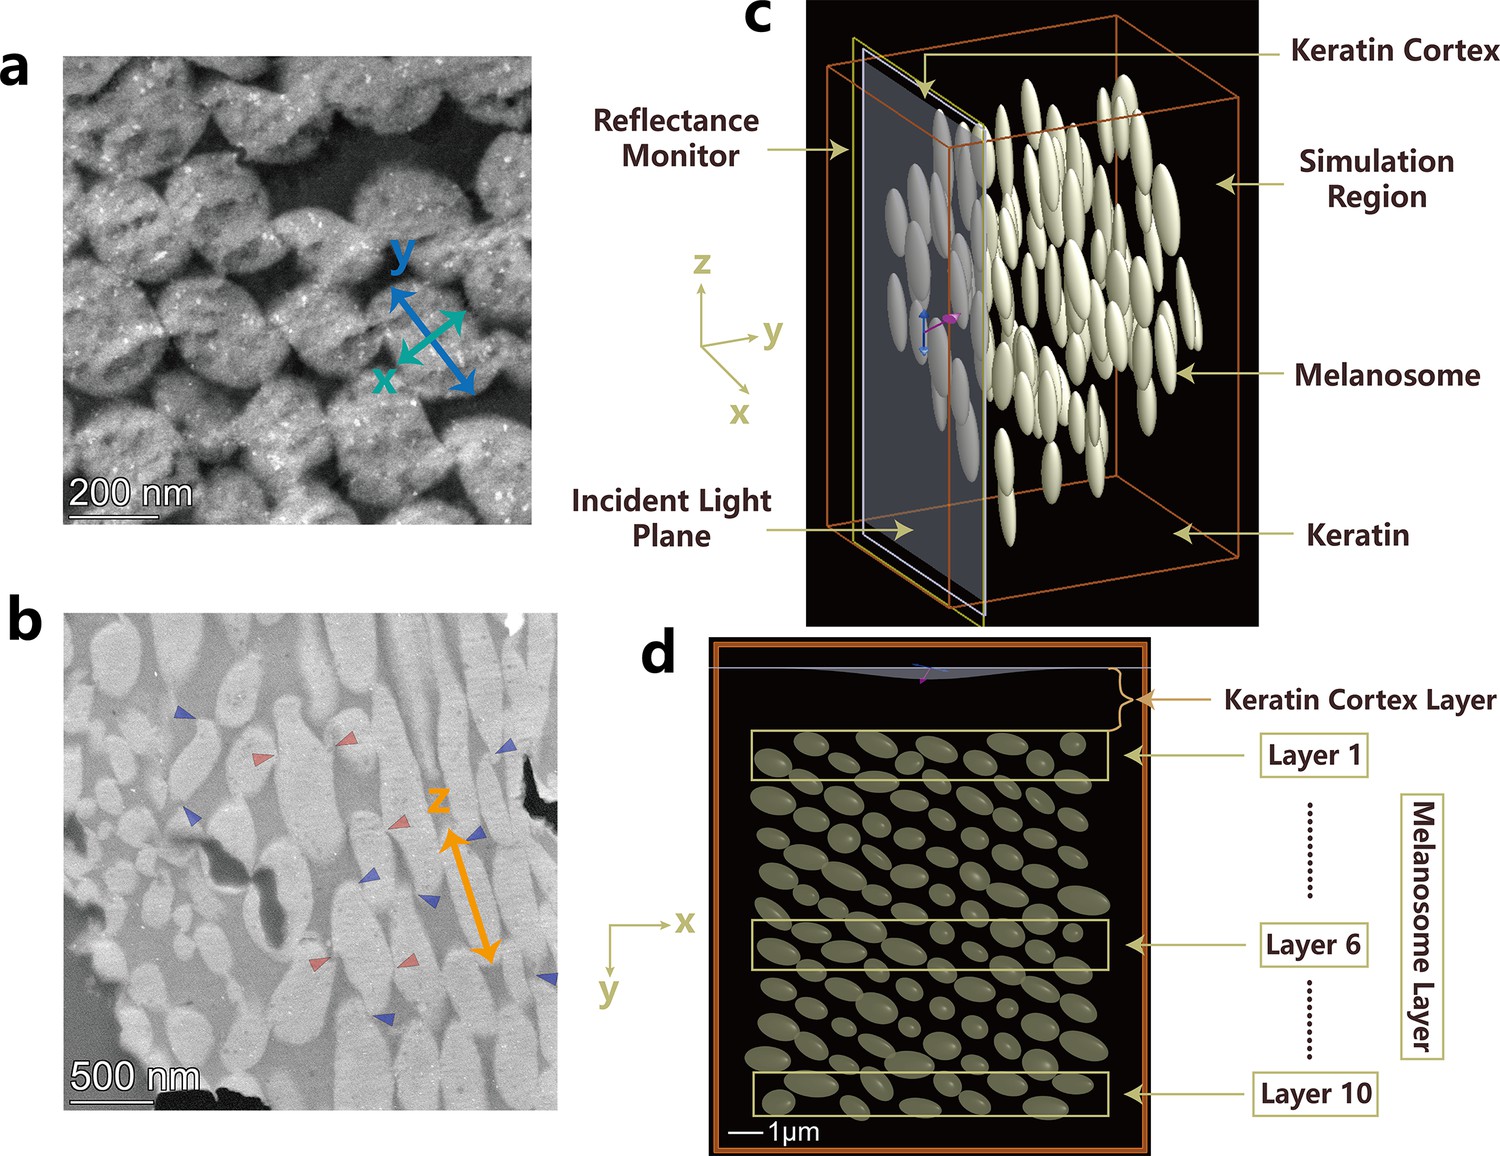
(a) Representative multilayer melanosome model; (b) Schematic drawing of the reflectance calculation setup of the feather barb. X-Y incident plane (blue) is perpendicular, and the Y-Z incident plane (orange) is parallel to the special melanosome longitudinal axis. and are incident angles in X-Y and Y-Z incident planes, respectively. The blue dashed box (R) indicates the area where the reflection spectra are simulated and calculated. (c) Angle-dependent reflectance spectra calculated for p- and s-polarized light by FDTD modeling with X-Y incident plane. (d) Angle-dependent reflectance spectra calculated for p- and s-polarized light by FDTD modeling with Y-Z incident plane. The keratin cortex layer was considered in the modeling.
Figure 4—figure supplement 1
STEM images obtained from feather barb slices with the reconstructed 3D model melanosome sets.
(a) Cross-sectional TEM image obtained from feather slice. x and y represent the length of minor and major principal axes of melanosome ellipsoid. (b) Longitudinal section TEM image. z represents the length of longitudinal axes of the melanosome ellipsoid. (c) Snapshots of the FDTD modeling for the multilayer crown feather. (d) Multilayer melanosome structures of the crown feather within the XY cross-section of the FDTD modeling. The thickness of the cortex layer modeled is about 1.8 μm.
Figure 4—figure supplement 2
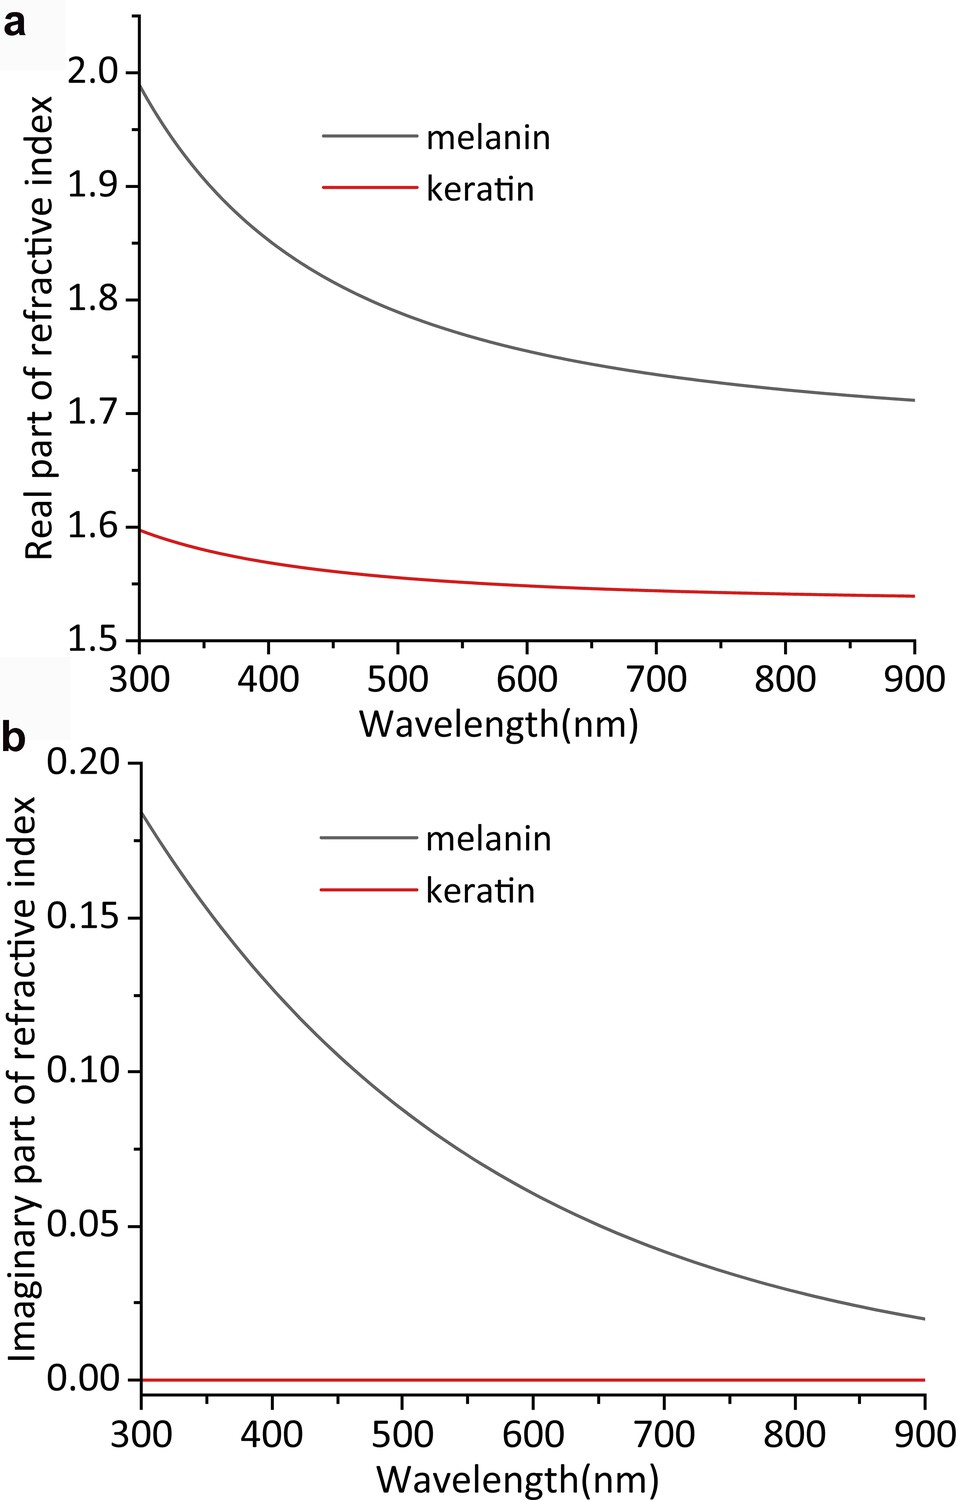
Refractive index dispersion.
The complex and wavelength-dependent refractive index () for melanin and keratin utilized in our FDTD modeling of the barb reflectance spectra. The dispersion of the real part of refractive index (a) and imaginary part (or extinction coefficient) (b) is shown.
Figure 4—figure supplement 3
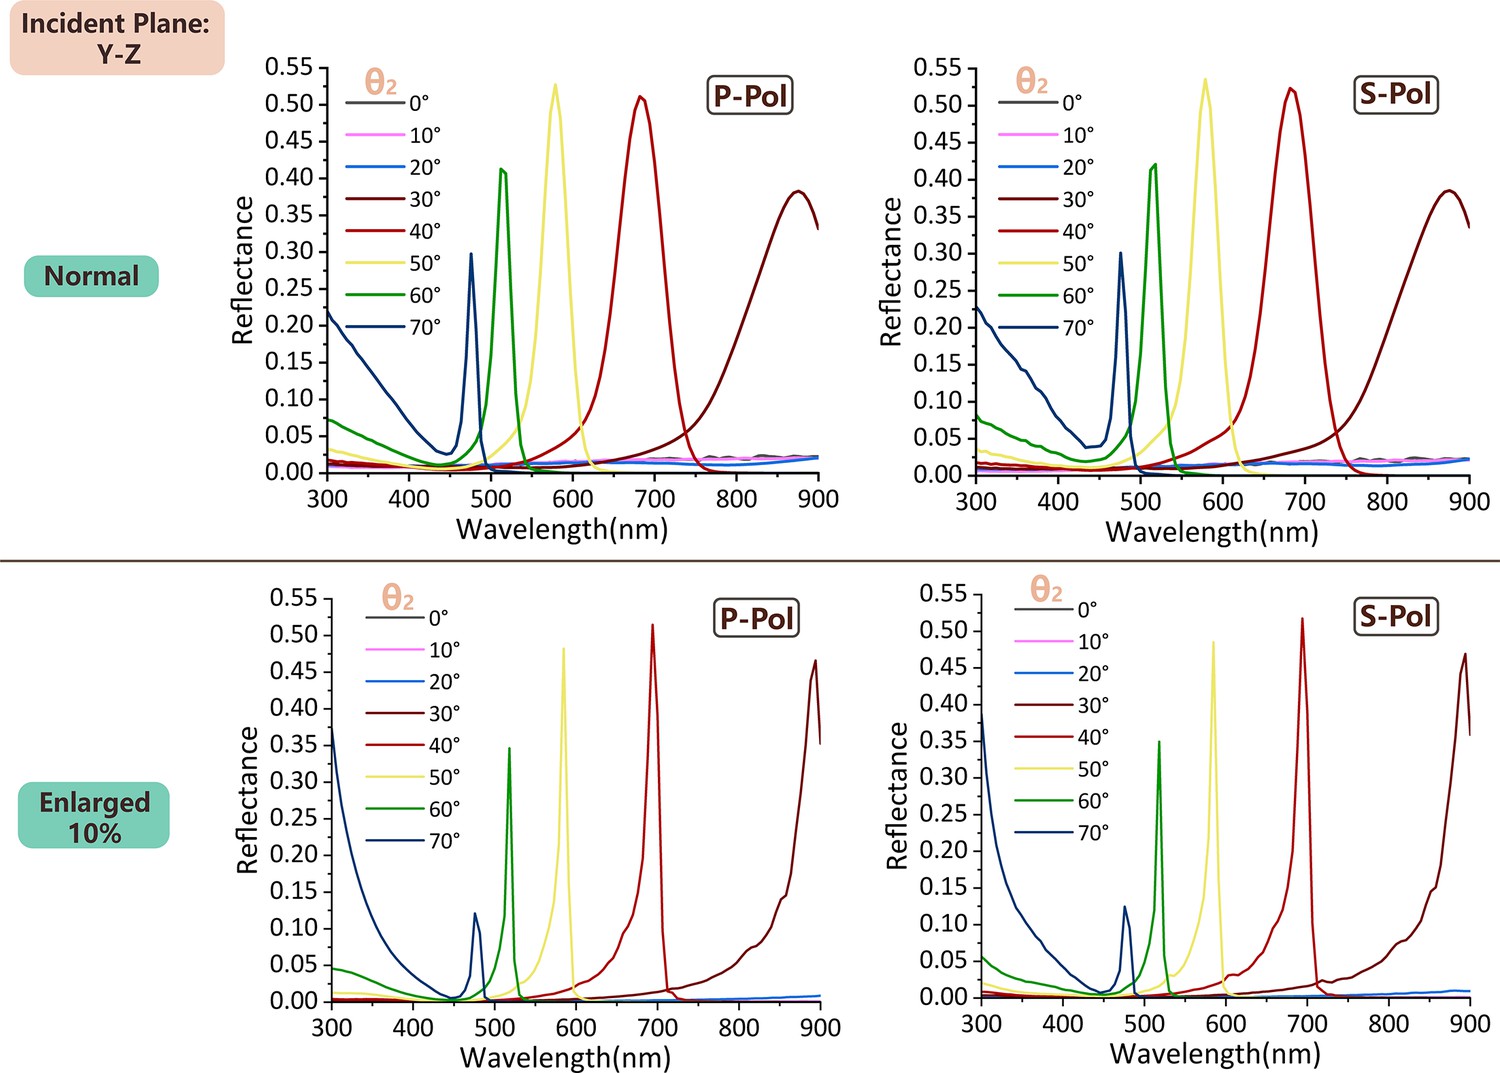
Comparison of angle-dependent reflectance spectra in the Y-Z incident plane for the normal and enlarged cases with consideration of melanosome shrinkage in taphonomy.
Author response image 1

Our new specimen with well-preserved and the feather crest were interpretated as the originally shaped;the cervical feather is largely absent or very short.
Tables
Appendix 1—table 1
Measurements of the hexagonal-packed ellipsoidal melanosome modeling obtained from partial cross- and longitudinal STEM images (see Figure 4—figure supplement 1).
| Parameters | Mean | Standard deviation | Hexagonal period |
|---|---|---|---|
| Length (x) | 186.17 nm | 33.53 nm | 406 nm |
| Length (y) | 283.49 nm | 46.44 nm | |
| Length (z) | 1774.03 nm | 269.21 nm |
Appendix 1—table 2
Measurements of major bone elements in IVPP V26899 (in mm).
| Skull length | 30.8 | |||
|---|---|---|---|---|
| Humerus length | left | 22.6 | right | 22.2 |
| Ulna length | left | 23.6 | right | 24.4 |
| Scapula length | left | 19.2 | ||
| Radius length | left | 23.6 | right | 23.3 |
| Metacarpal II length | left | 11.5 | ||
| Femur length | left | 21.2 | ||
| Metatarsal III length | left | 15.0 | right | 15.5 |
| Tibiotarsus length | left | 27.0 | right | 27.5 |
| Sternum midline length | 13.8 | |||
| Pubis length | 17.2 | |||
| Ilium length | 13.1 | |||
| Ischium length | 6.5 | |||
| Pygostyle length | 8.5 |
Appendix 1—table 3
Melanosome modeling employed in additional FDTD simulation (enlarged 10% compared to Appendix 1—table 1).
| Parameters | Mean | Standard deviation | Hexagonal period |
|---|---|---|---|
| Length (x) | 206.65 nm | 37.19 nm | 446 nm |
| Length (y) | 314.67 nm | 51.55 nm | |
| Length (z) | 1969.14 nm | 298.62 nm |
Appendix 1—table 4
Reflectance peak wavelengths at different incident angles for the normal and enlarged cases.
| Incident angle (degree) | Reflectance peak wavelength in original sets (nm) | Reflectance peak wavelength at 110% sized case (nm) |
|---|---|---|
| 30 | 875.76 | 893.94 |
| 40 | 681.82 | 693.94 |
| 50 | 578.79 | 584.85 |
| 60 | 518.18 | 519.20 |
| 70 | 475.76 | 475.60 |
Additional files
Download links
A two-part list of links to download the article, or parts of the article, in various formats.
Downloads (link to download the article as PDF)
Open citations (links to open the citations from this article in various online reference manager services)
Cite this article (links to download the citations from this article in formats compatible with various reference manager tools)
Iridescent structural coloration in a crested Cretaceous enantiornithine bird from the Jehol Biota
eLife 14:RP103628.
https://doi.org/10.7554/eLife.103628.3


