HNF4α-TET2-FBP1 axis contributes to gluconeogenesis and type 2 diabetes
- Tongji Hospital, Frontier Science Center for Stem Cell Research, Shanghai Key Laboratory of Signaling and Disease Research, School of Life Sciences and Technology, Tongji University, China
- MOE Key Laboratory of Metabolism and Molecular Medicine, Department of Biochemistry and Molecular Biology, School of Basic Medical Sciences, Fudan University, China
- Department of Radiation Oncology, Ruijin Hospital, Shanghai Jiaotong University School of Medicine, China
- Department of Endocrinology, Fifth People's Hospital of Shanghai, Fudan University, China
- Cellular and Molecular Biology Laboratory, Affiliated Zhoushan Hospital of Wenzhou Medical University, China
- Department of Biochemistry, Molecular Biology and Biophysics, University of Minnesota, United States
- Institute on the Biology of Aging and Metabolism, University of Minnesota, United States
Figures
Figure 1
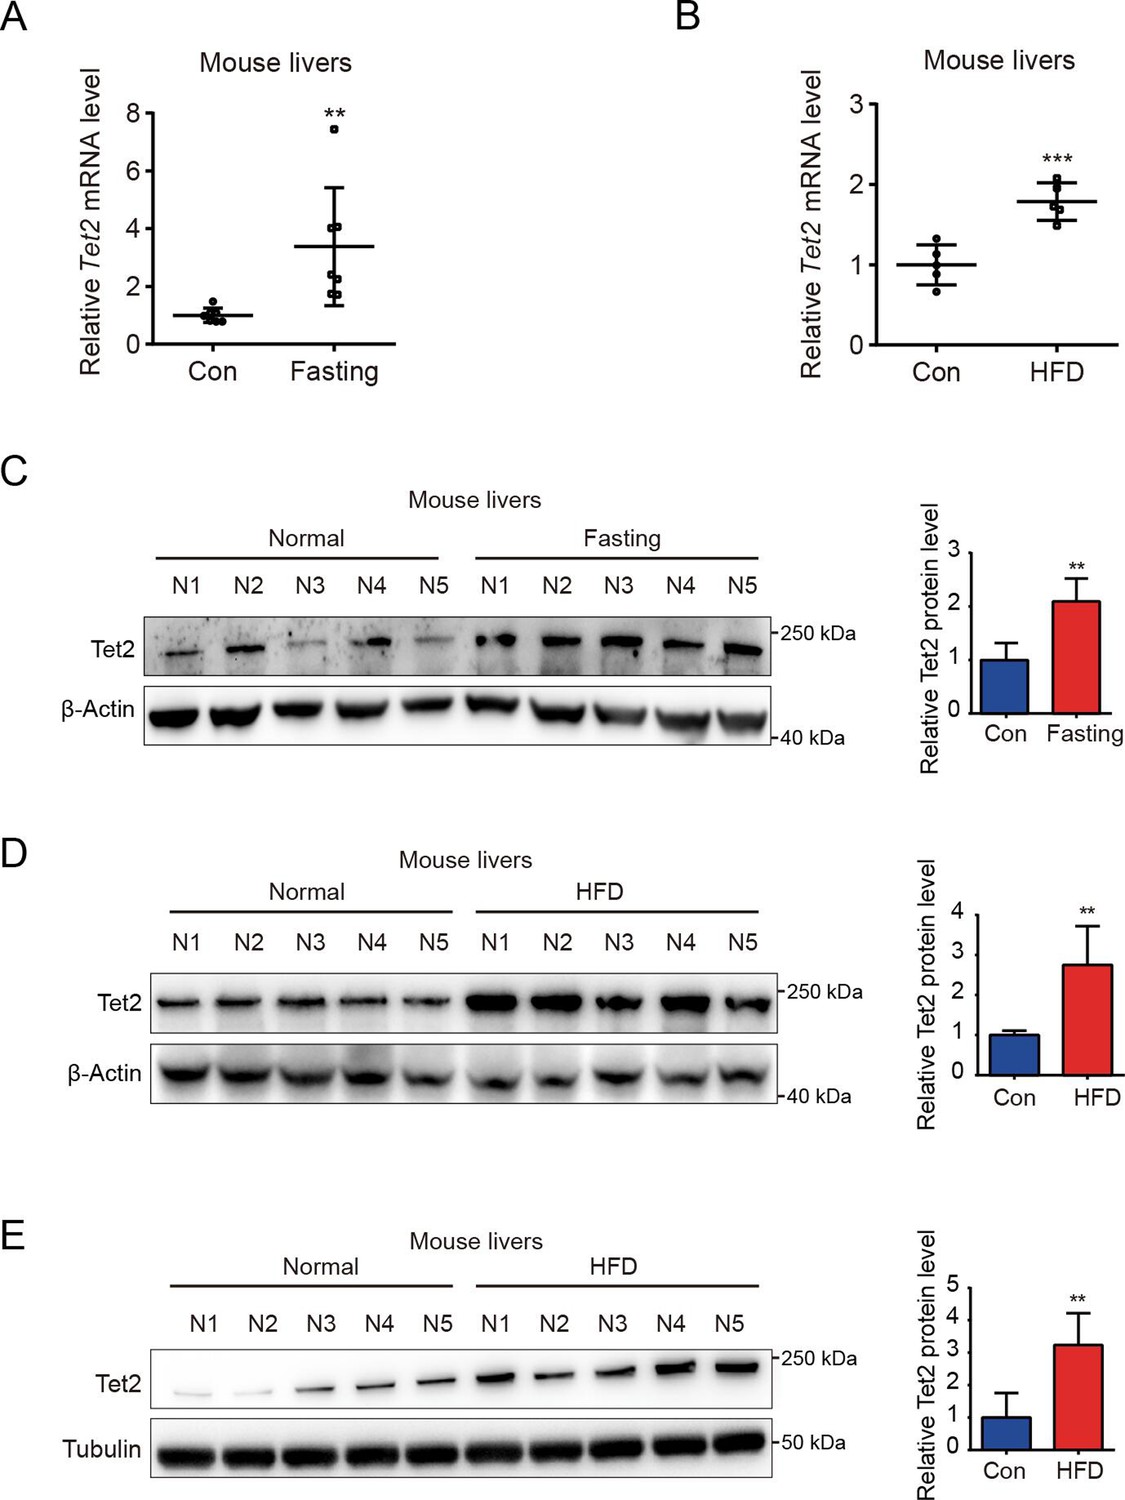
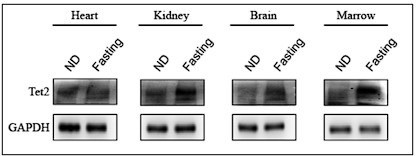
TET2 expression increases in fasting and high-fat diet (HFD) mouse livers.
(A) qRT-PCR analysis of Tet2 mRNA levels in mouse livers after 16 hr fasting treatment. The data are normalized to the Actb expression (n=7). (B) qRT-PCR analysis of Tet2 mRNA levels in mouse livers after HFD treatment for 11 days. The data are normalized to the Actb expression (n=7). (C) Western blot analysis and quantification of Tet2 protein levels in mouse livers following 16 hr fasting treatment (n=5). (D) Western blot analysis and quantification of Tet2 protein levels in mouse livers following the HFD treatment for 11 days (n=5). (E) Western blot analysis and quantification of Tet2 protein levels in mouse livers following the 12-week HFD treatment (n=5).Statistical significance was determined using a two-tailed Student’s t-test (**p < 0.01, ***p < 0.001). Data are represented as the mean ± SD.
-
Figure 1—source data 1
PDF file containing original western blots for Figure 1C, D, E, indicating the relevant bands and treatments.
- https://cdn.elifesciences.org/articles/103663/elife-103663-fig1-data1-v1.pdf
-
Figure 1—source data 2
Original files for western blot analysis displayed in Figure 1C, D, E.
- https://cdn.elifesciences.org/articles/103663/elife-103663-fig1-data2-v1.zip
Figure 2
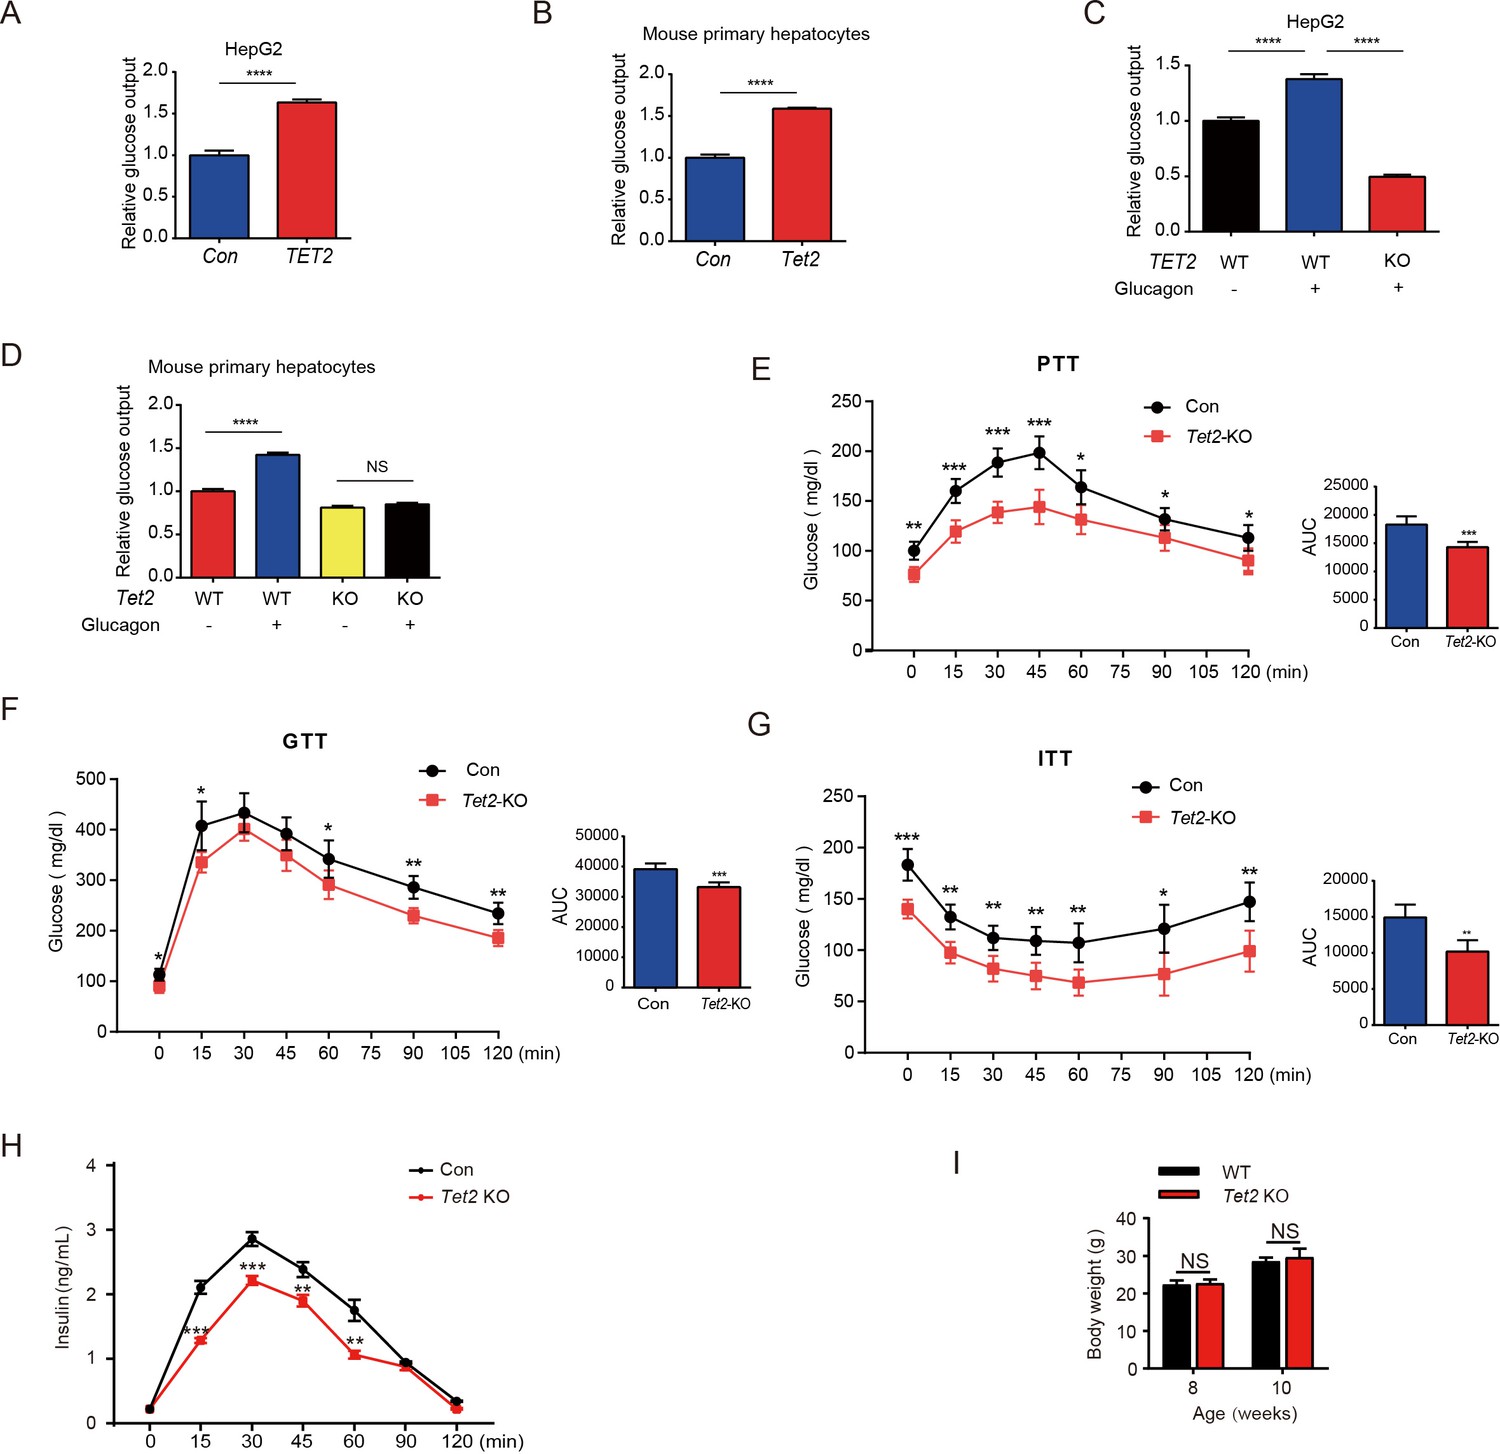
TET2 boosts gluconeogenesis.
(A) Glucose production assays were performed in HepG2 cells after TET2 overexpression. Data are represented as the mean ± SD (n=3). (B) Glucose production assays were performed in mouse primary hepatocytes after Tet2 overexpression. Data are represented as the mean ± SD (n=3). (C) Glucose production assays were performed in HepG2 cells pre-treated with 20 nM glucagon in wild-type (WT) and TET2 KO HepG2 cells. Data are represented as the mean ± SD (n=3). (D) Glucose production assays were performed in mouse primary hepatocytes pre-treated with 20 nM glucagon in WT and Tet2 KO cells. Data are represented as the mean ± SD (n=3). (E) Pyruvate tolerance test (PTT) was performed following a 16 hr fasting treatment and intraperitoneal (i.p.) injection of 1 g/kg sodium pyruvate (n = 5). (F) Glucose tolerance test (GTT) was performed after a 12 hr fasting treatment and i.p. injection of 2 g/kg glucose (n = 5). (G) Insulin tolerance test (ITT) was performed after a 4 hr fasting treatment and i.p. injection of 0.75 U/kg insulin (n = 5). (H) Glucose-stimulated insulin secretion was examined. After fasting and i.p. injection of 2 g/kg glucose, plasma insulin levels were measured at the indicated time points (n = 5). (I) Body weight of 8- or 10-week-old male WT mice and Tet2 KO mice on a normal chow diet (n = 5). Statistical significance was determined using a two-tailed Student’s t-test (*p < 0.05, **p < 0.01, ***p < 0.001 , and ****p < 0.0001).
Figure 3
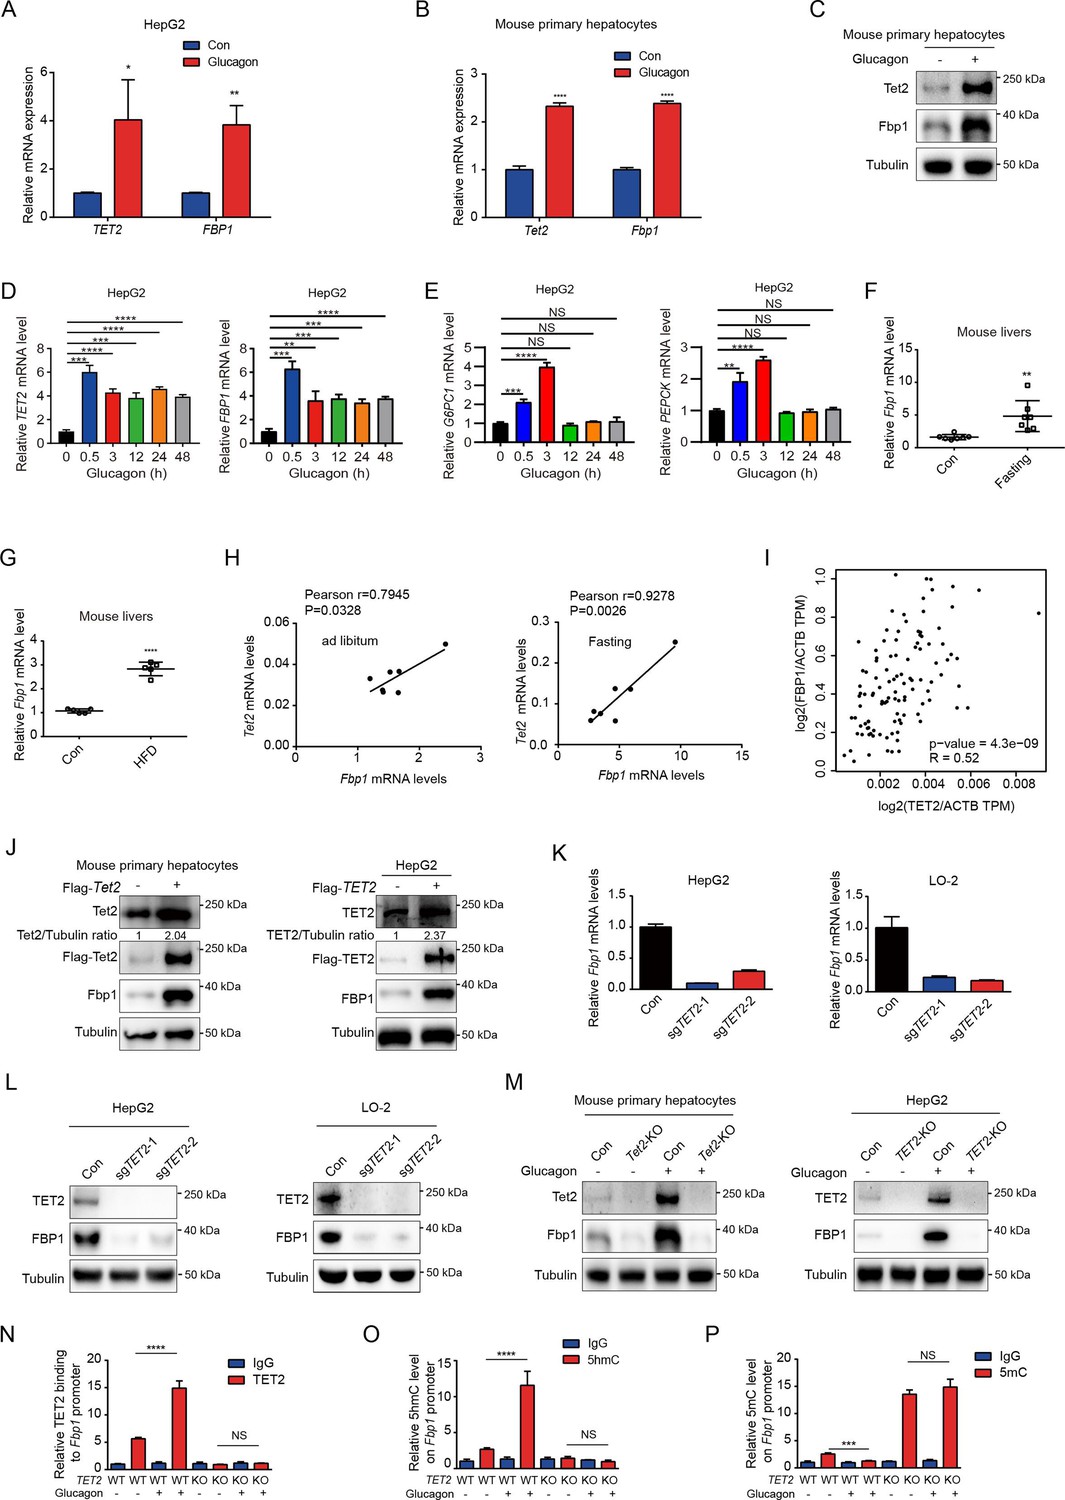
TET2 upregulates FBP1 expression in liver cells.
(A) qPCR analysis of TET2 and FBP1 mRNA expression levels after 20 nM glucagon treatment for 48 hr in HepG2 cells. Data are represented as the mean ± SD (n=3). Statistical significance was determined using a two-tailed Student’s t-test (*p < 0.05, **p < 0.01). (B) qPCR analysis of Tet2 and Fbp1 mRNA expression levels after 20 nM glucagon treatment for 48 hr in primary mouse hepatocytes. Data are represented as the mean ± SD (n=3). Statistical significance was determined using a two-tailed Student’s t-test (****p < 0.0001). (C) Western blot analysis of Tet2 and Fbp1 protein levels after 20 nM glucagon treatment in mouse primary hepatocyte cells. (D) qPCR analysis of TET2 and FBP1 mRNA expression levels after 20 nM glucagon treatment at the indicated time points (n = 3). Statistical significance was determined using a two-tailed Student’s t-test (**p < 0.01, ***p < 0.001 and ****p < 0.0001). (E) qPCR analysis of G6PC1 and PEPCK mRNA expression levels after 20 nM glucagon treatment at the indicated time points in HepG2 cells (n = 3). Statistical significance was determined using a two-tailed Student’s t-test (**p < 0.01,, ***p < 0.001 and ****p < 0.0001). (F) qPCR analysis of Fbp1 mRNA levels in mouse livers following fasting treatment (n=7). Statistical significance was determined using a two-tailed Student’s t-test (**p < 0.01). (G) qPCR analysis of Fbp1 mRNA levels in mouse livers following high-fat diet (HFD) treatment (n=5). Statistical significance was determined using a two-tailed Student’s t-test (****p < 0.0001). (H) Correlation analysis between TET2 and FBP1 levels using data from Figure 1A in mouse livers with or without fasting treatment. (I) Correlation analysis between TET2 and FBP1 levels in human livers. Data were collected from Gene Expression Profiling Interactive Analysis (GEPIA) (Tang et al., 2017). (J) Western blot analysis of TET2 and FBP1 expression after overexpression of Flag-TET2 in mouse primary hepatocytes and HepG2 cells. (K) qPCR analysis of FBP1 expression levels in control and TET2 knockout HepG2 and LO-2 cells. (L) Western blot analysis of TET2 and FBP1 protein levels in control and TET2 knockout HepG2 and LO-2 cells. (M) Western blot analysis of Tet2 and Fbp1 protein levels in control and Tet2 knockout mouse primary hepatocytes and HepG2 cells treated with or without 20 nM glucagon. (N) ChIP-qPCR analysis of TET2 binding to FBP1 promoter in response to glucagon stimulation in control and TET2 knockout HepG2 cells. (O) ChIP-qPCR analysis of 5-hydroxymethylcytosine (5hmC) levels in FBP1 promoter in response to glucagon stimulation in control and TET2 knockout HepG2 cells. (P) ChIP-qPCR analysis of 5-methylcytosine (5mC) levels in FBP1 promoter in response to glucagon stimulation in control and TET2 knockout HepG2 cells (n=3). N-P are presented as the mean ± SD using a Tukey’s post hoc test (***p < 0.001 and ****p < 0.0001).
-
Figure 3—source data 1
PDF file containing original western blots for Figure 3C, J, L and M, indicating the relevant bands and treatments.
- https://cdn.elifesciences.org/articles/103663/elife-103663-fig3-data1-v1.pdf
-
Figure 3—source data 2
Original files for western blot analysis displayed in Figure 3C, J, L and M.
- https://cdn.elifesciences.org/articles/103663/elife-103663-fig3-data2-v1.zip
Figure 4
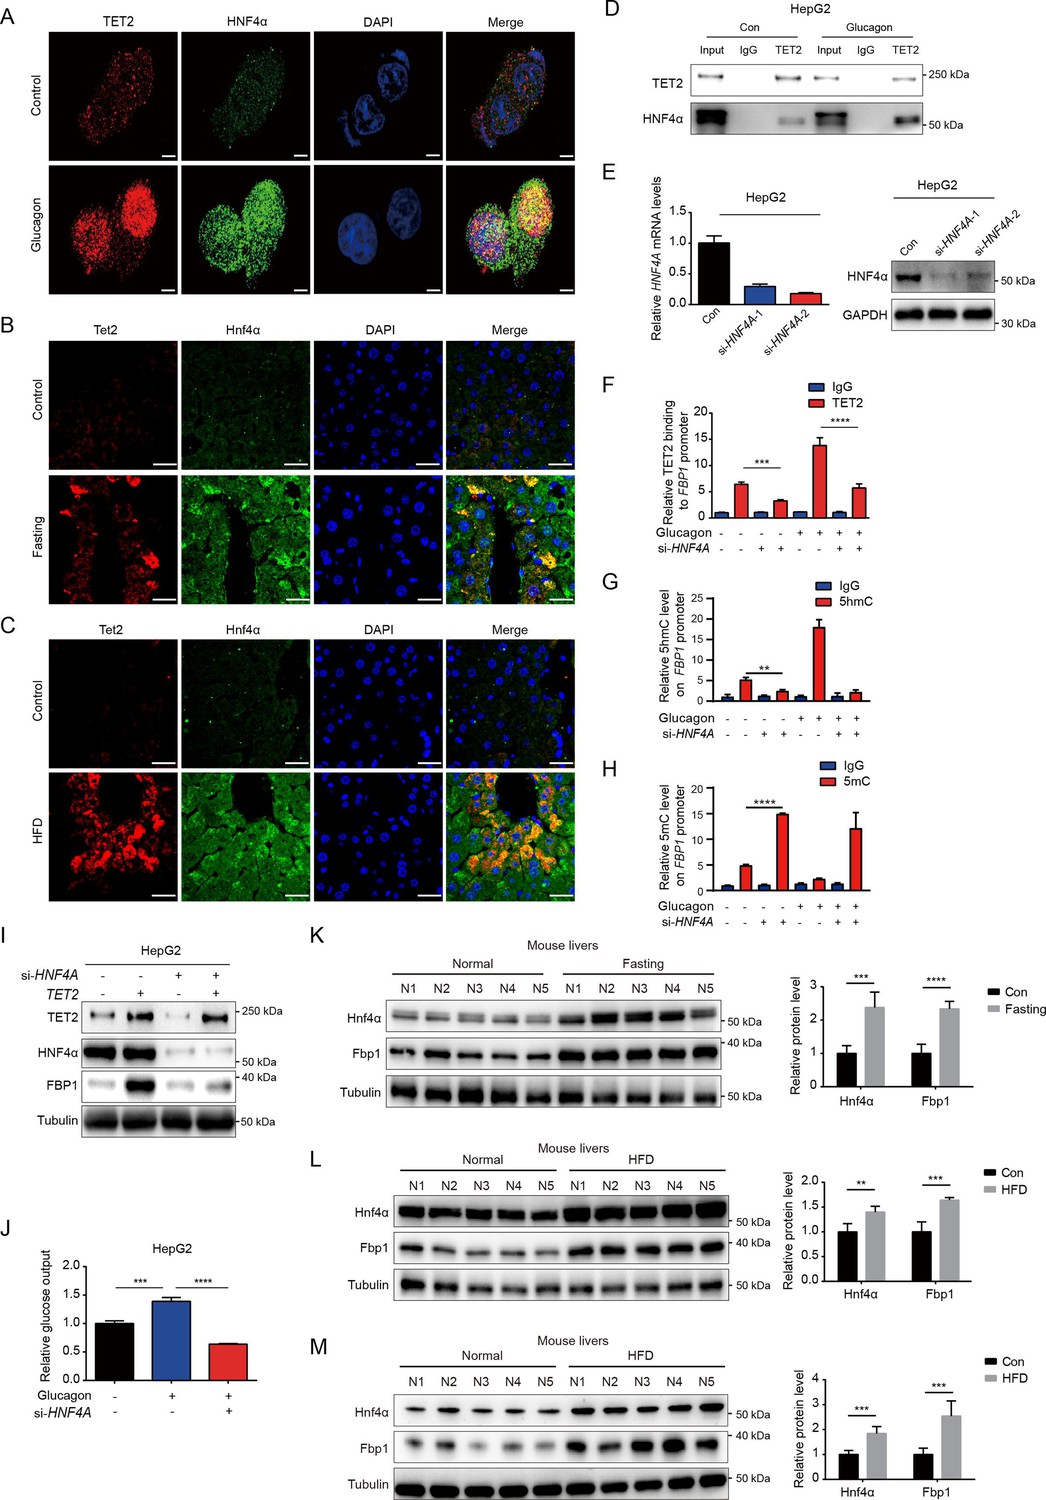
HNF4α is necessary for TET2-mediated FBP1 upregulation.
(A) Immunofluorescence analysis of TET2 and HNF4α co-localization in HepG2 cells after 20 nM glucagon treatment for 48 hr. Scale bar: 10 μm. (B) Immunofluorescence analysis of Tet2 and Hnf4α co-localization in liver sections from standard chow and fasting mice. Scale bar: 30 μm. (C) Immunofluorescence analysis of Tet2 and Hnf4α co-localization in liver sections from standard chow and high-fat diet (HFD) mice. Scale bar: 30 μm. (D) Endogenous co-immunoprecipitation followed by western blot analysis of the interaction between HNF4α and TET2 with or without glucagon treatment in HepG2 cells. (E) qRT-PCR and western blot analysis of HNF4α expression levels in HepG2 cells transfected with two specific siRNAs. (F) ChIP-qPCR analysis of TET2 binding to FBP1 promoter in HepG2 cells treated with siRNA targeting HNF4A and glucagon as indicated (n=3). Statistical significance was determined using a two-tailed Student’s t-test (***p < 0.001, ****p < 0.0001). (G) ChIP-qPCR analysis of 5-hydroxymethylcytosine (5hmC) levels in the FBP1 promoter in HepG2 cells treated with siRNA targeting HNF4A and glucagon as indicated (n=3). Statistical significance was determined using a two-tailed Student’s t-test (**p < 0.01). (H) ChIP-qPCR analysis of 5-methylcytosine (5mC) levels in the FBP1 promoter in HepG2 cells treated with siRNA targeting HNF4A and glucagon as indicated (n=3). Statistical significance was determined using a two-tailed Student’s t-test (****p < 0.0001). (I) Western blot analysis of FBP1 protein levels in HepG2 cells treated with TET2 overexpression and siRNA targeting HNF4A as indicated. (J) Glucose production assays were performed in HepG2 cells treated with glucagon and transfected with HNF4A siRNA as indicated (n=3). Statistical significance was determined using a two-tailed Student’s t-test (***p < 0.001, ****p < 0.0001). (K–M) Western blot analysis and quantification of Hnf4a and Fbp1 protein levels in mouse livers from the mice treated with 16 hr overnight fasting (K) or 11-day HFD (L), or 12-week HFD treatment (M). n=5. Statistical significance was determined using a two-tailed Student’s t-test (**p < 0.01, ***p < 0.001 and ****p < 0.0001).
-
Figure 4—source data 1
PDF file containing original western blots for Figure 4D, E, I, K, L and M, indicating the relevant bands and treatments.
- https://cdn.elifesciences.org/articles/103663/elife-103663-fig4-data1-v1.pdf
-
Figure 4—source data 2
Original files for western blot analysis displayed in Figure 4D, E, I, K, L and M.
- https://cdn.elifesciences.org/articles/103663/elife-103663-fig4-data2-v1.zip
Figure 5
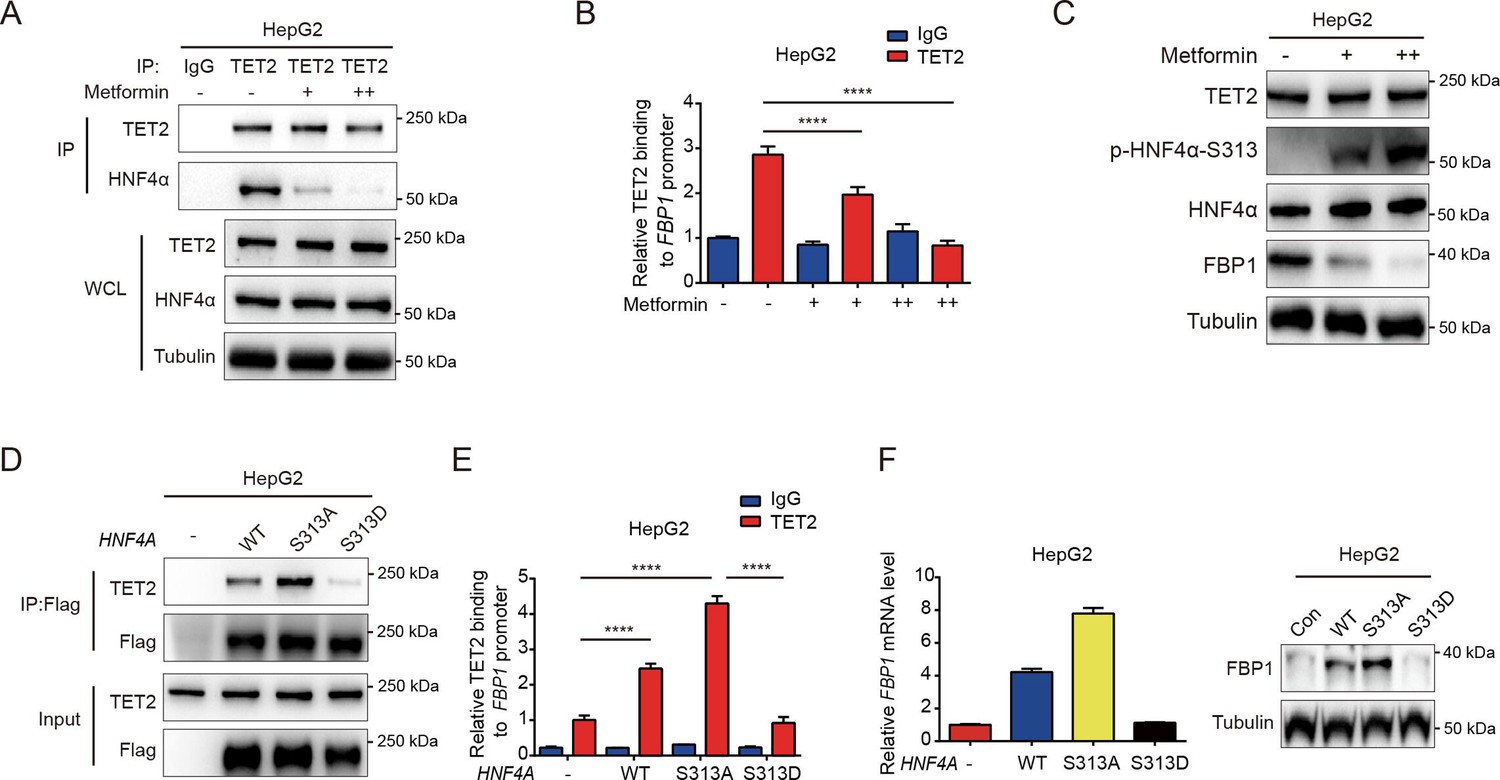
Metformin impairs the ability of HNF4α binding to TET2 and FBP1 expression.
(A) Endogenous co-immunoprecipitation followed by western blot analysis of the interaction between HNF4α and TET2 with or without metformin (10 mM) treatment in HepG2 cells. (B) ChIP-qPCR analysis of TET2 binding to FBP1 promoter in HepG2 cells treated with or without metformin (10 mM) (n=3). Statistical significance was determined using a two-tailed Student’s t-test (****p < 0.0001). (C) Western blot analysis of TET2, HNF4α, HNF4α phosphorylation at Ser 313 and FBP1 levels in HepG2 cells treated with metformin as indicated (+: 5 mM, ++: 10 mM). (D) Endogenous co-immunoprecipitation followed by western blot analysis of the interaction between TET2 and HNF4α wild-type and S313 mutants as indicated. (E) ChIP-qPCR analysis of TET2 binding to FBP1 promoter in HepG2 cells transfected with HNF4α wild-type and S313 mutants as indicated (n=3). Statistical significance was determined using ausing a Tukey’s post hoc test (****p < 0.0001). (F) qRT-PCR and western blot analysis of FBP1 levels in HepG2 cells transfected with HNF4α wild-type and S313 mutants as indicated.
-
Figure 5—source data 1
PDF file containing original western blots for Figure 5A, C, D and F, indicating the relevant bands and treatments.
- https://cdn.elifesciences.org/articles/103663/elife-103663-fig5-data1-v1.pdf
-
Figure 5—source data 2
Original files for western blot analysis displayed in Figure 5A, C, D and F.
- https://cdn.elifesciences.org/articles/103663/elife-103663-fig5-data2-v1.zip
Figure 6
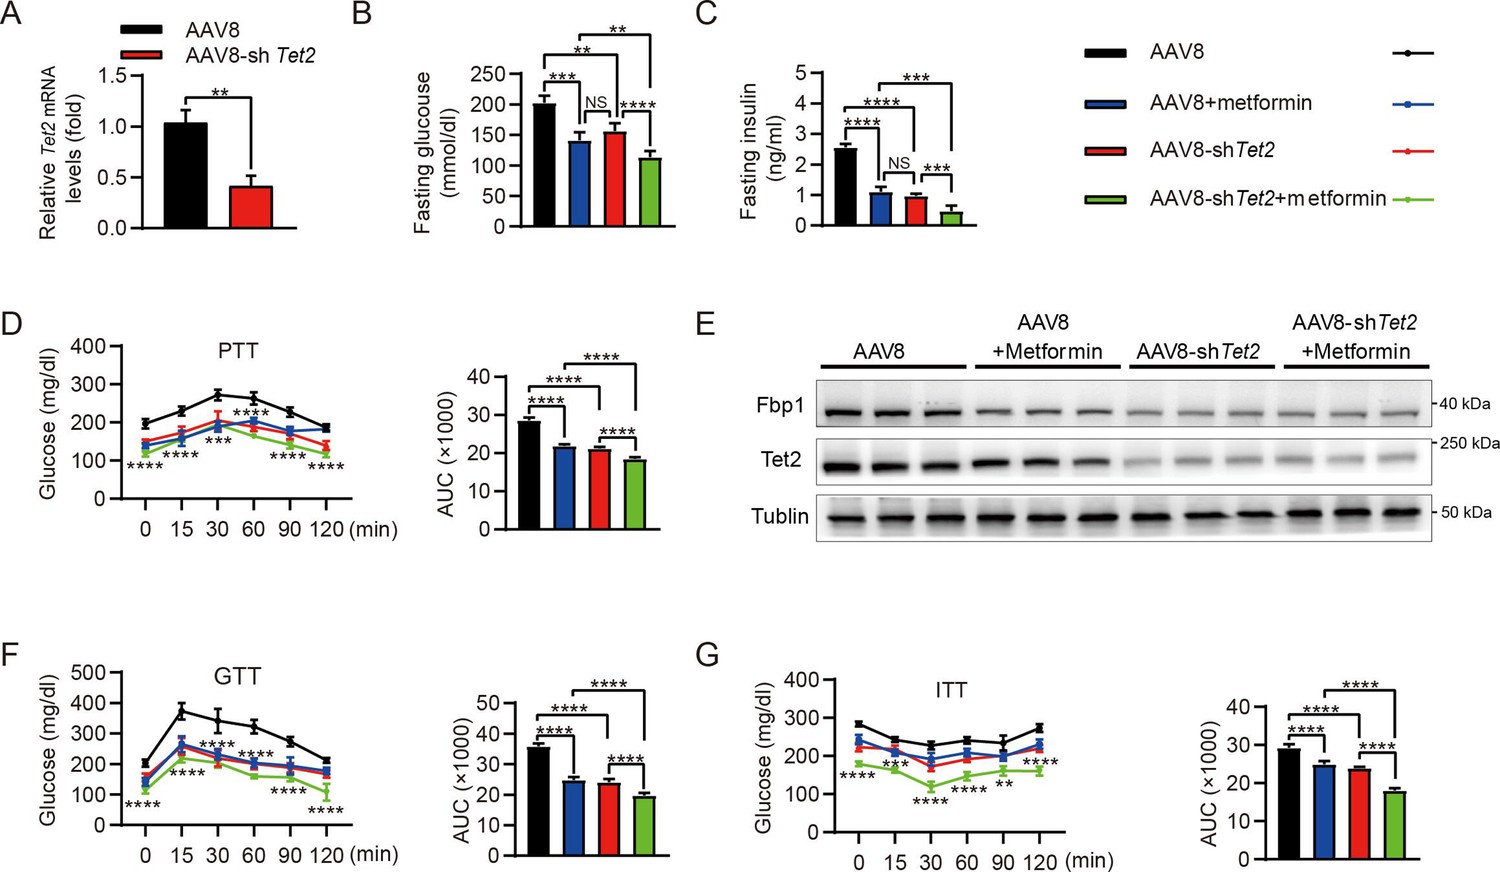
Targeting TET2 improves the efficacy of metformin in glucose metabolism in vivo.
(A) qRT-PCR analysis of Tet2 mRNA levels in mouse livers from the high-fat diet (HFD) mice infected with AAV8 or AAV8-shTet2 for 10 days (n=6). Statistical significance was determined using a two-tailed Student’s t-test (**p < 0.01) . (B, C) Analysis of fasting blood glucose (B) and plasma insulin (C) levels in the HFD mice infected with AAV8 or AAV8-shTet2 for 10 days, and treated with or without metformin (300 mg/kg/day) for another 10 days as indicated. n=6. Statistical significance was determined using ausing a Tukey’s post hoc test (**p < 0.01, ***p < 0.001, and ****p < 0.0001). (D) Pyruvate tolerance test (PTT) was performed in the HFD mice infected with AAV8 or AAV8-shTet2 for 10 days, and treated with or without metformin (300 mg/kg/day) for another 10 days as indicated (n=6). (E) Western blot analysis of Tet2 and Fbp1 levels in livers from the HFD mice infected with AAV8 or AAV8-shTet2 for 10 days, and treated with or without metformin (300 mg/kg/day) for another 10 days as indicated. (F, G) Glucose tolerance test (GTT) (F) and insulin tolerance test (ITT) (G) were performed in the HFD mice infected with AAV8 or AAV8-shTet2 for 10 days and treated with or without metformin (300 mg/kg/day) for another 10 days as indicated (n=6). (D, F and G) are determined using a two-tailed Student’s t-test for left panel and a Tukey’s post hoc test for right panel in each figure (**p < 0.01, ***p < 0.001, and ****p < 0.0001).
-
Figure 6—source data 1
PDF file containing original western blots for Figure 6E, indicating the relevant bands and treatments.
- https://cdn.elifesciences.org/articles/103663/elife-103663-fig6-data1-v1.pdf
-
Figure 6—source data 2
Original files for western blot analysis displayed in Figure 6E.
- https://cdn.elifesciences.org/articles/103663/elife-103663-fig6-data2-v1.zip
Author response image 1
Additional files
Download links
A two-part list of links to download the article, or parts of the article, in various formats.
Downloads (link to download the article as PDF)
Open citations (links to open the citations from this article in various online reference manager services)
Cite this article (links to download the citations from this article in formats compatible with various reference manager tools)
HNF4α-TET2-FBP1 axis contributes to gluconeogenesis and type 2 diabetes
eLife 13:RP103663.
https://doi.org/10.7554/eLife.103663.3


