Social rank-order stability of mice revealed by a novel food competition paradigm in combination with available space competition paradigms
- Guangdong Province Key Laboratory of Psychiatric Disorders, Department of Neurobiology, School of Basic Medical Sciences, Southern Medical University, China
- The National Key Clinic Specialty, The Engineering Technology Research Center of Education Ministry of China, Guangdong Provincial Key Laboratory on Brain Function Repair and Regeneration, Department of Neurosurgery, Zhujiang Hospital, Southern Medical University, China
- Key Laboratory of Mental Health of the Ministry of Education, Guangdong-Hong Kong-Macao Greater Bay Area Center for Brain Science and Brain-Inspired Intelligence, Department of Neurobiology, School of Basic Medical Sciences, Southern Medical University, China
Figures
Figure 1 with 8 supplements
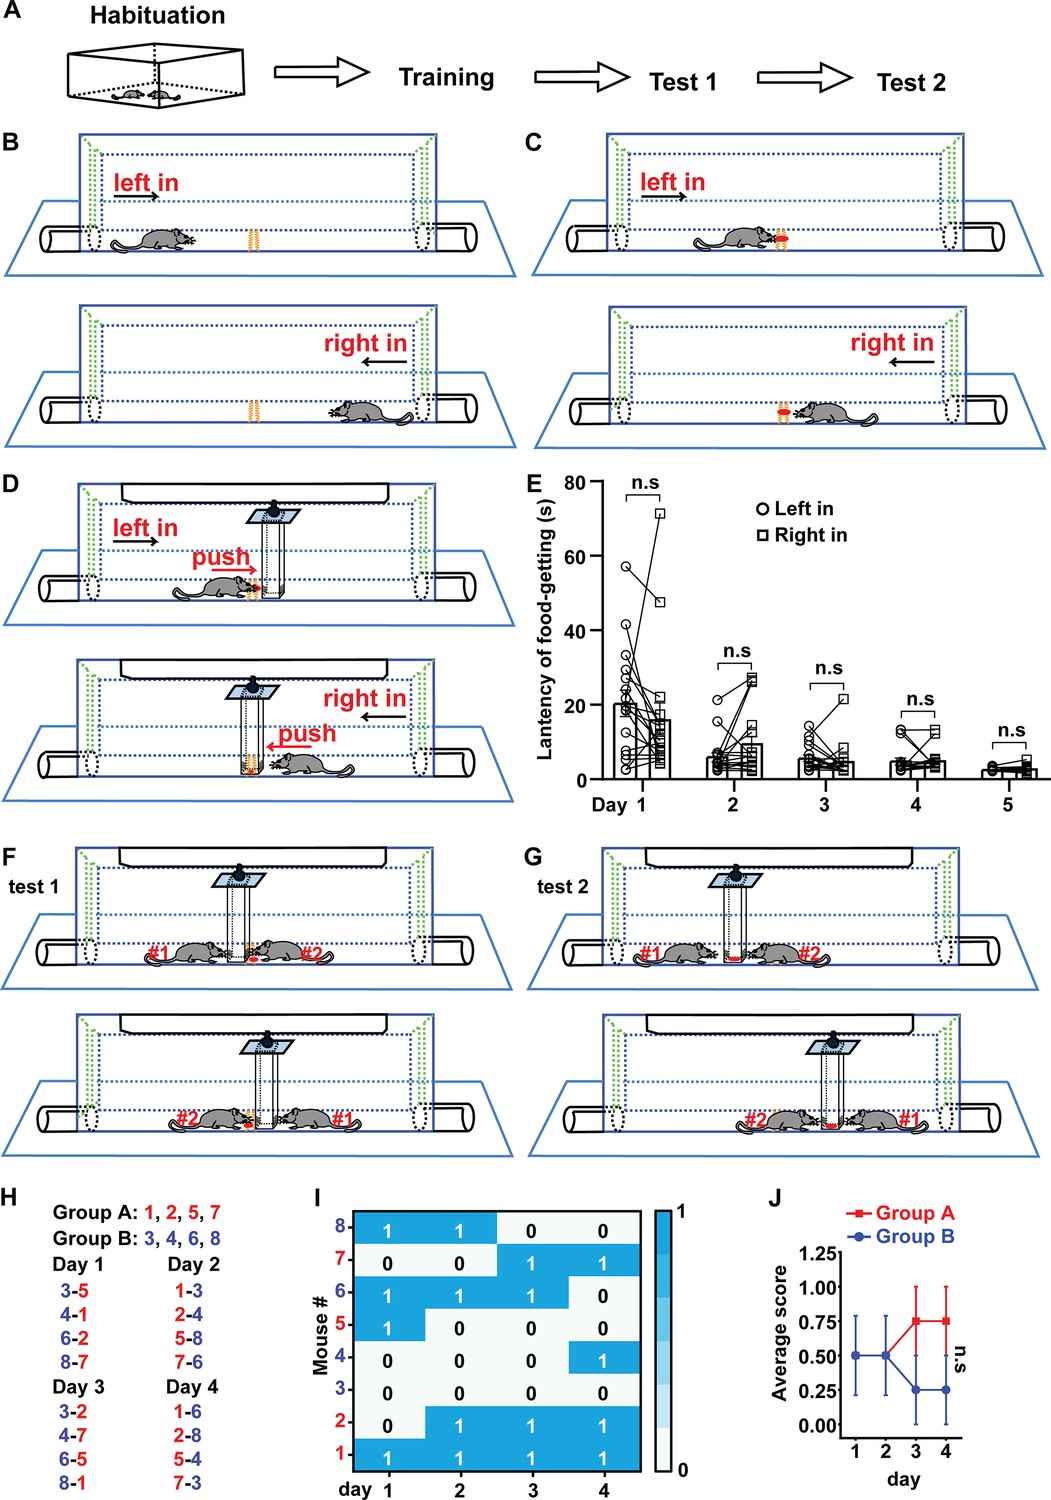
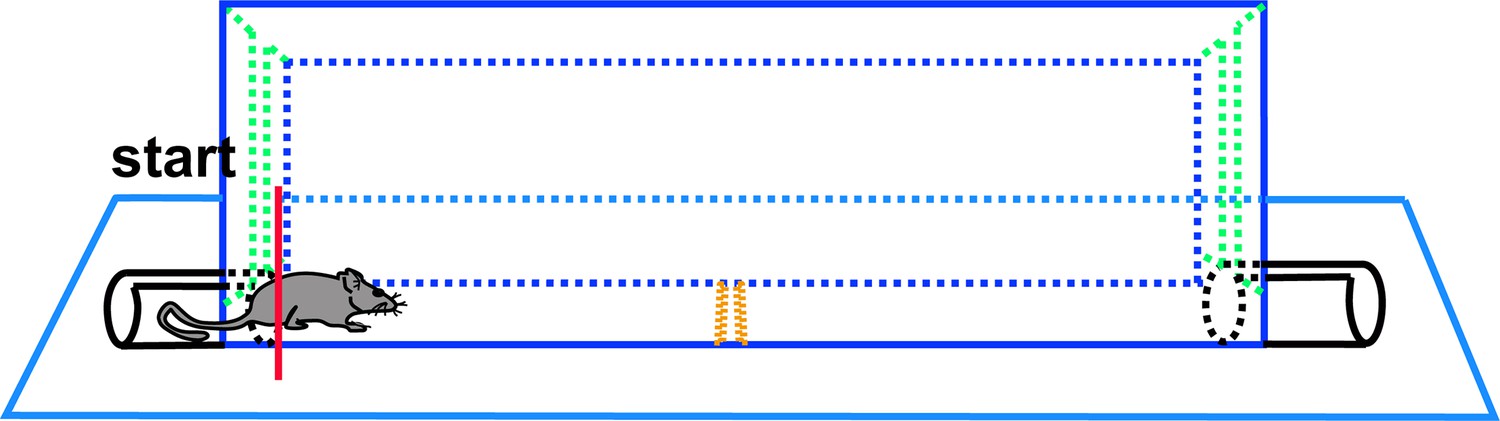
Schematic drawing of food pellet competition test (FPCT) procedure and measuring the non-cagemate male mice based on the winning/losing outcomes of FPCT.
(A) The overall procedure of FPCT experiment. (B) Habituation to the arena where the mice entered alternately from left and right sides. (C) Training to find food pellet without the existence of the movable block. (D) Training to get the food pellet placed under the movable block. (E) Statistical data of latency of food-getting (the time from entering the arena to eat the food) showing the progress of training in (D). Paired Student’s t-test, n=17, n.s. stands for nonsignificant difference. (F) Direct win-lose test via analyzing food occupation (test 1). (G) Indirect win-lose test via analyzing mouse’s attempt to gain the food (test 2). (H) Eight single-housed mice were numbered and randomly divided into groups A and B after being trained. One of the mice in group A matched only once with one of the mice in group B in the 4 days of test 1. The number listed on the left-right indicated the corresponding mice would enter the arena from left-right entry. Scores 1 and 0 indicated winning and losing the food competition, respectively. (I) Heatmap showing the competition outcomes of the non-cagemate male mice ranked with FPCT. (J) The scores acquired by each mouse in the competition were averaged in each day for the two groups. Unpaired Student’s t-test = 4, n.s. stands for nonsignificant difference. Data were represented as mean ± SEM.
-
Figure 1—source data 1
Statistical behavioral data.
- https://cdn.elifesciences.org/articles/103748/elife-103748-fig1-data1-v1.xlsx
Figure 1—figure supplement 1
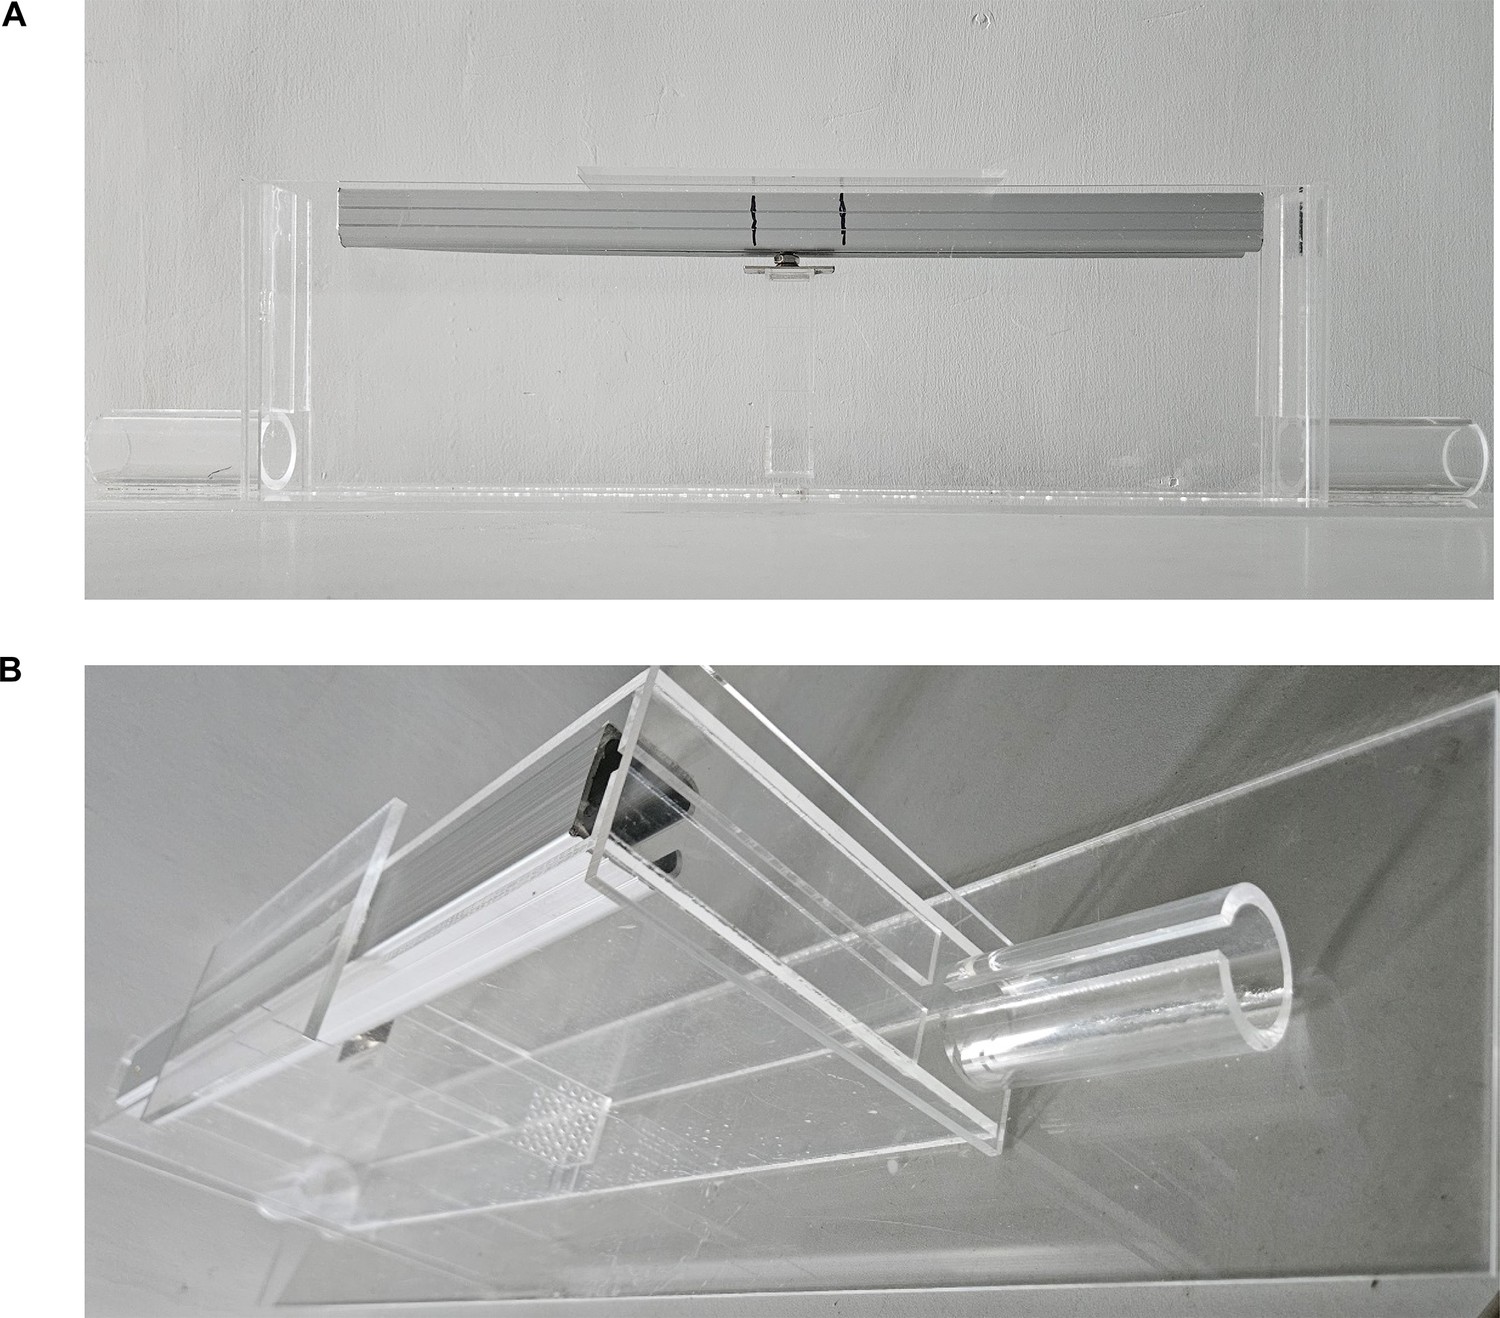
Photographs of food pellet competition test (FPCT) setup.
(A) Frontal view of the FPCT setup. (B) Side view of the FPCT setup.
Figure 1—figure supplement 2
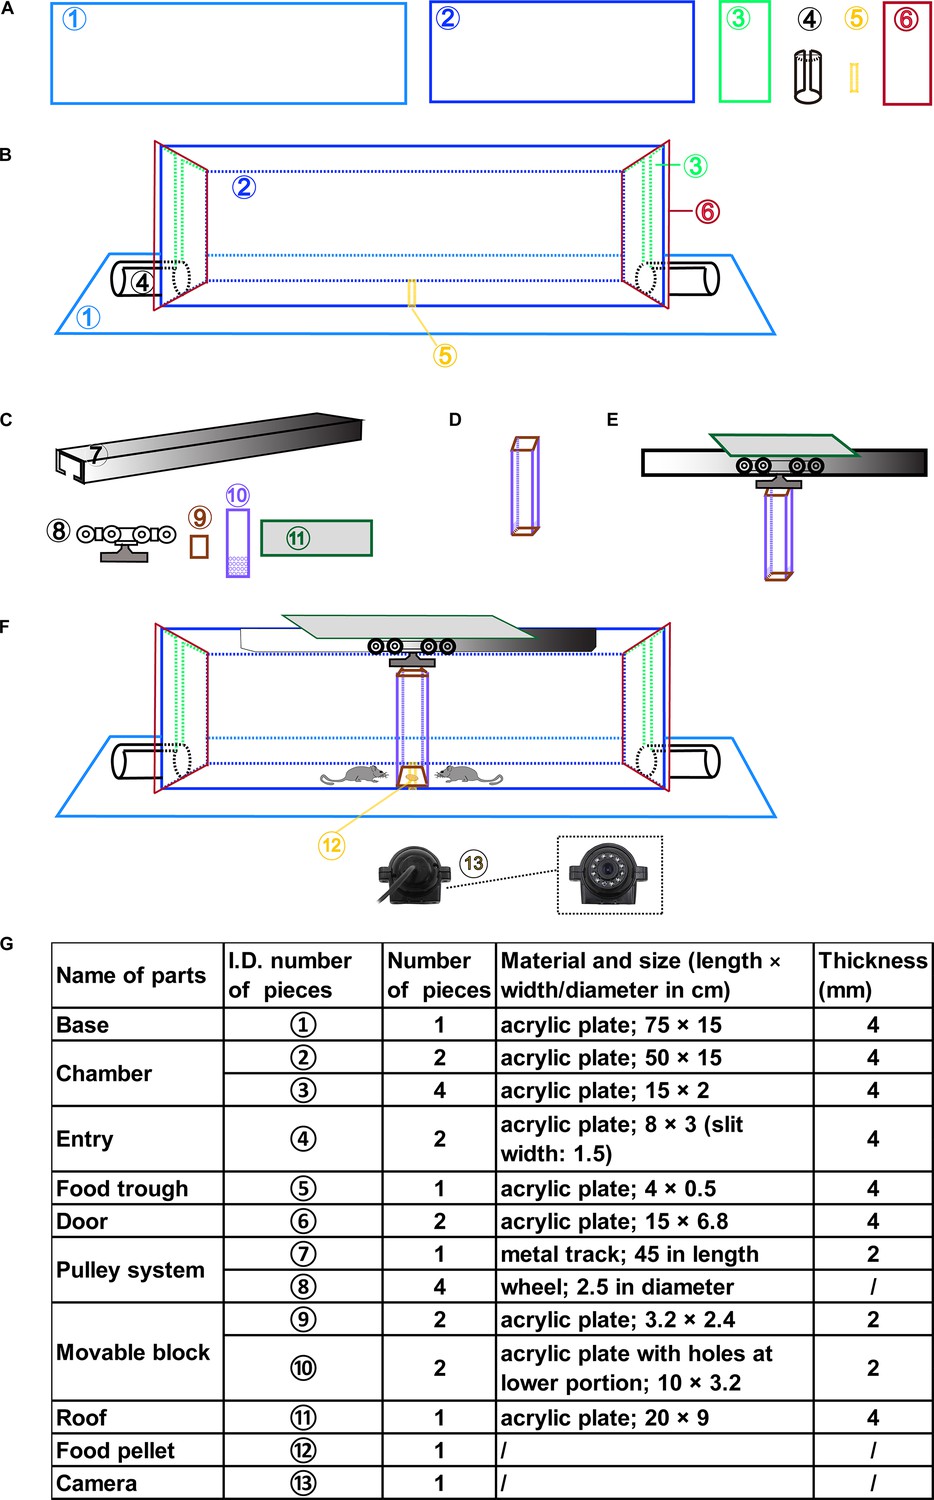
Schematic illustration of the assembling of the food pellet competition test (FPCT) setup.
(A, B) Depiction of the work pieces (A) to make up the main body of the arena (B). (C–E) Depiction of the work pieces (C) to make up the movable block (D) attached to the pulley system and the roof (E). (F) Cartoon demonstrating the FPCT setup and working model with the existence of food pellet and camera. (G) Detailed list of the work pieces and parts of the FPCT setup.
Figure 1—figure supplement 3
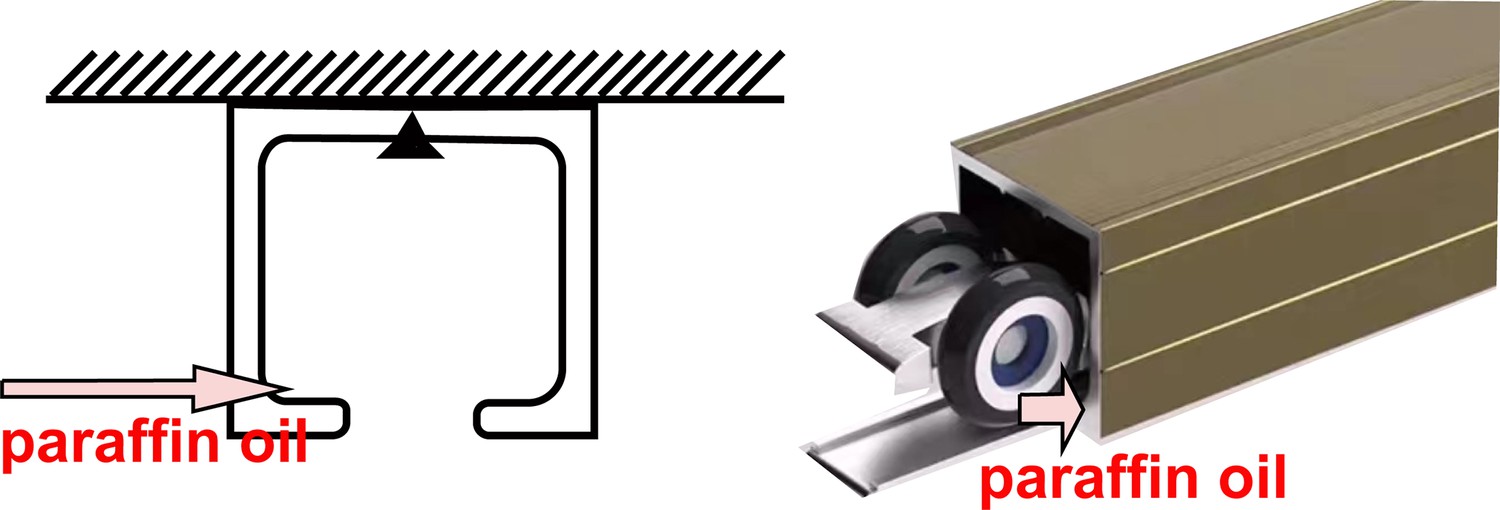
Schematic drawing to show a tip to reduce the friction between the pulley and the track.
Figure 1—figure supplement 4
Schematic drawing to show the marking of the starting state when the mouse’s four legs just entered the chamber arena.
Figure 1—video 1
In step 3 of training, the mouse was trained to know the position of the food pellet in the absence of the movable block.
Figure 1—video 2
In step 4 of training, the mouse was learning to get the food pellet placed in the trough of the chamber floor nearly under the movable block.
Figure 1—video 3
In the food pellet competition test (FPCT) test 1, the mice were competing for the food pellet.
Figure 1—video 4
In the food pellet competition test (FPCT) test 2, the mice were attempting to get the food pellet placed in the inner bottom of the block.
Figure 2
Ranking the two-cagemate male mice with food pellet competition test (FPCT) and tube test.
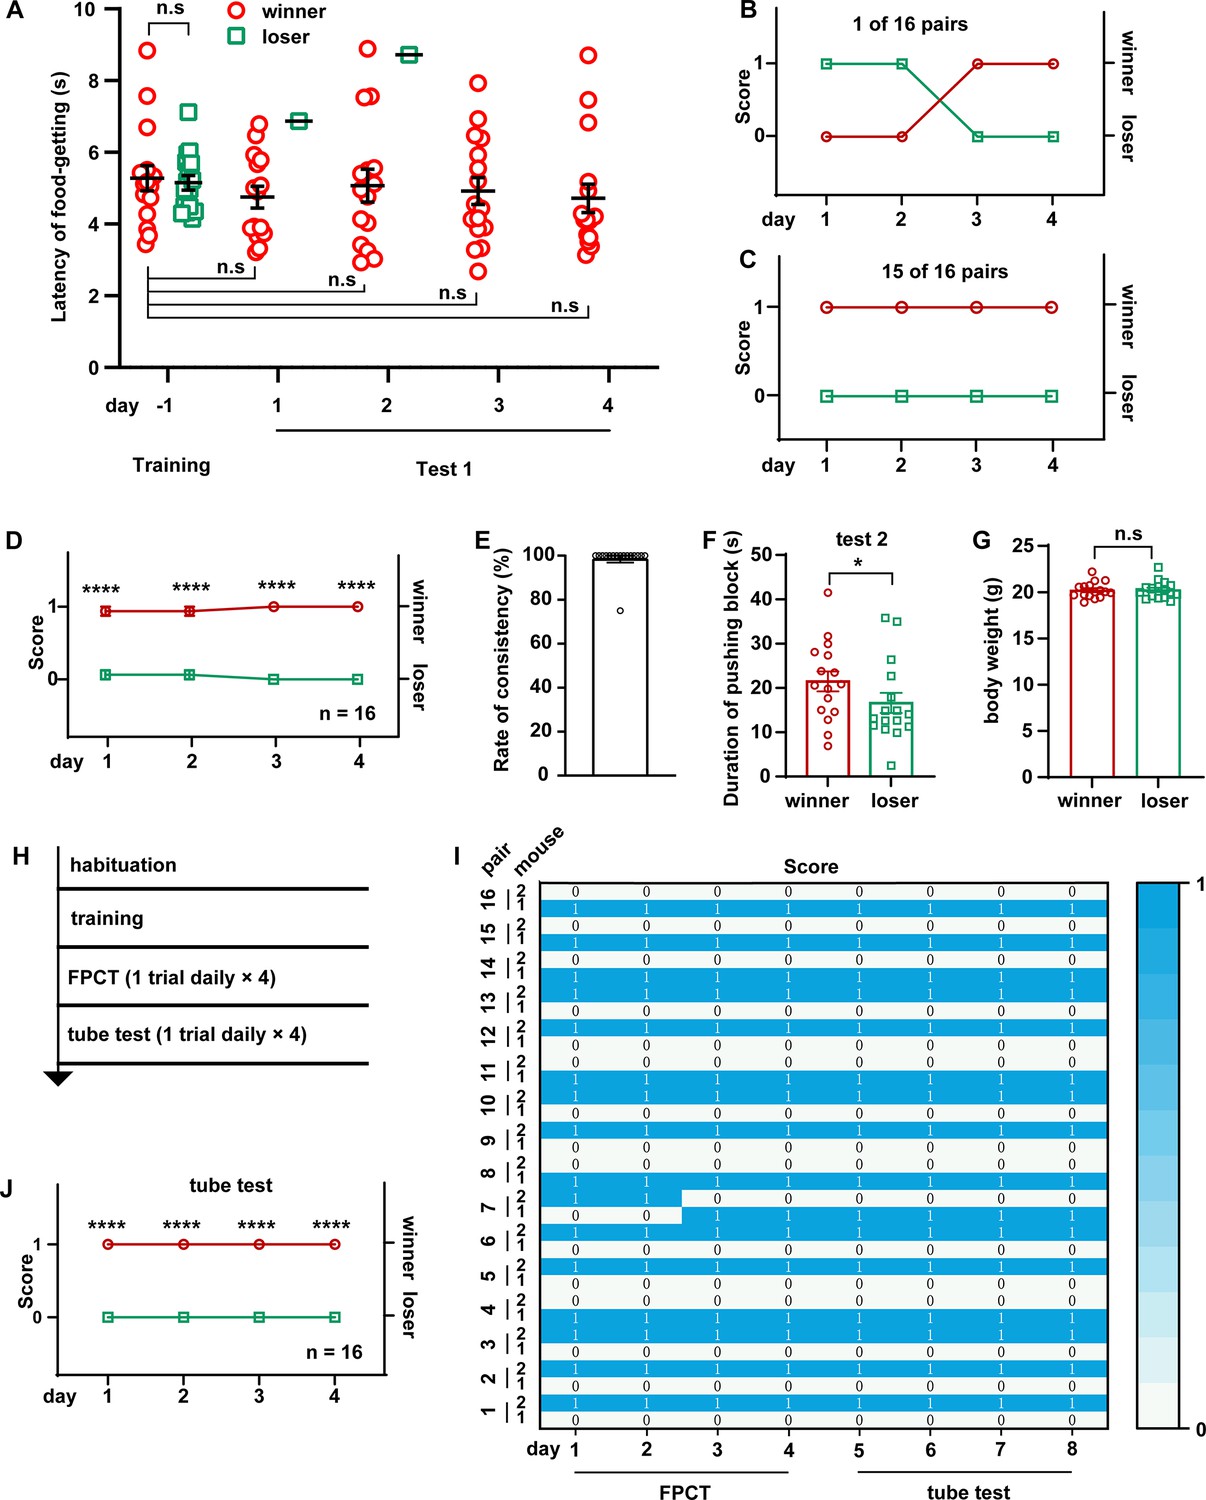
(A) Statistical data showing the latency of food-getting from the last day of training until the end of test 1. Two-way ANOVA multiple comparisons, n=16 pairs, n.s. stands for nonsignificant difference. (B) 1 of the 16 pairs of cagemate male mice exhibited alternating winning/losing outcome in FPCT test 1. (C) 15 of the 16 pairs of male mice exhibited fully congruent winning/losing outcome in FPCT test 1. (D) Statistics of ranking of male mice over four trials (one trial daily) of FPCT test 1. Two-way ANOVA, n=16, ****p<0.0001. (E) Average rate of consistency within trials. For each pair, the rate of consistency was calculated as the percentage of the number of trials (in all four trials) resulting in the outcome same as the fourth trial (n=16). (F) Statistics of duration spent on pushing block in FPCT test 2. The winner or loser identity was determined by the last trial of test 1. Paired Student’s t-test, *p<0.05, n=16. (G) Body weight of male mice measured after FPCT. Unpaired Student’s t-test, n.s. stands for nonsignificant difference, n=16. (H) Timeline of experiments showing tube test was conducted after FPCT. (I) Heatmap showing the outcomes of social competition of paired male mice ranked with FPCT and tube test. (J) Statistics of ranking of male mice over four trials (one trial daily) of tube test. Two-way ANOVA, n=16, ****p<0.0001. All statistical data were represented as mean ± SEM.
-
Figure 2—source data 1
Statistical behavioral data.
- https://cdn.elifesciences.org/articles/103748/elife-103748-fig2-data1-v1.xlsx
Figure 3
Ranking the two-cagemate female mice using food pellet competition test (FPCT), tube test, and warm spot test (WST).
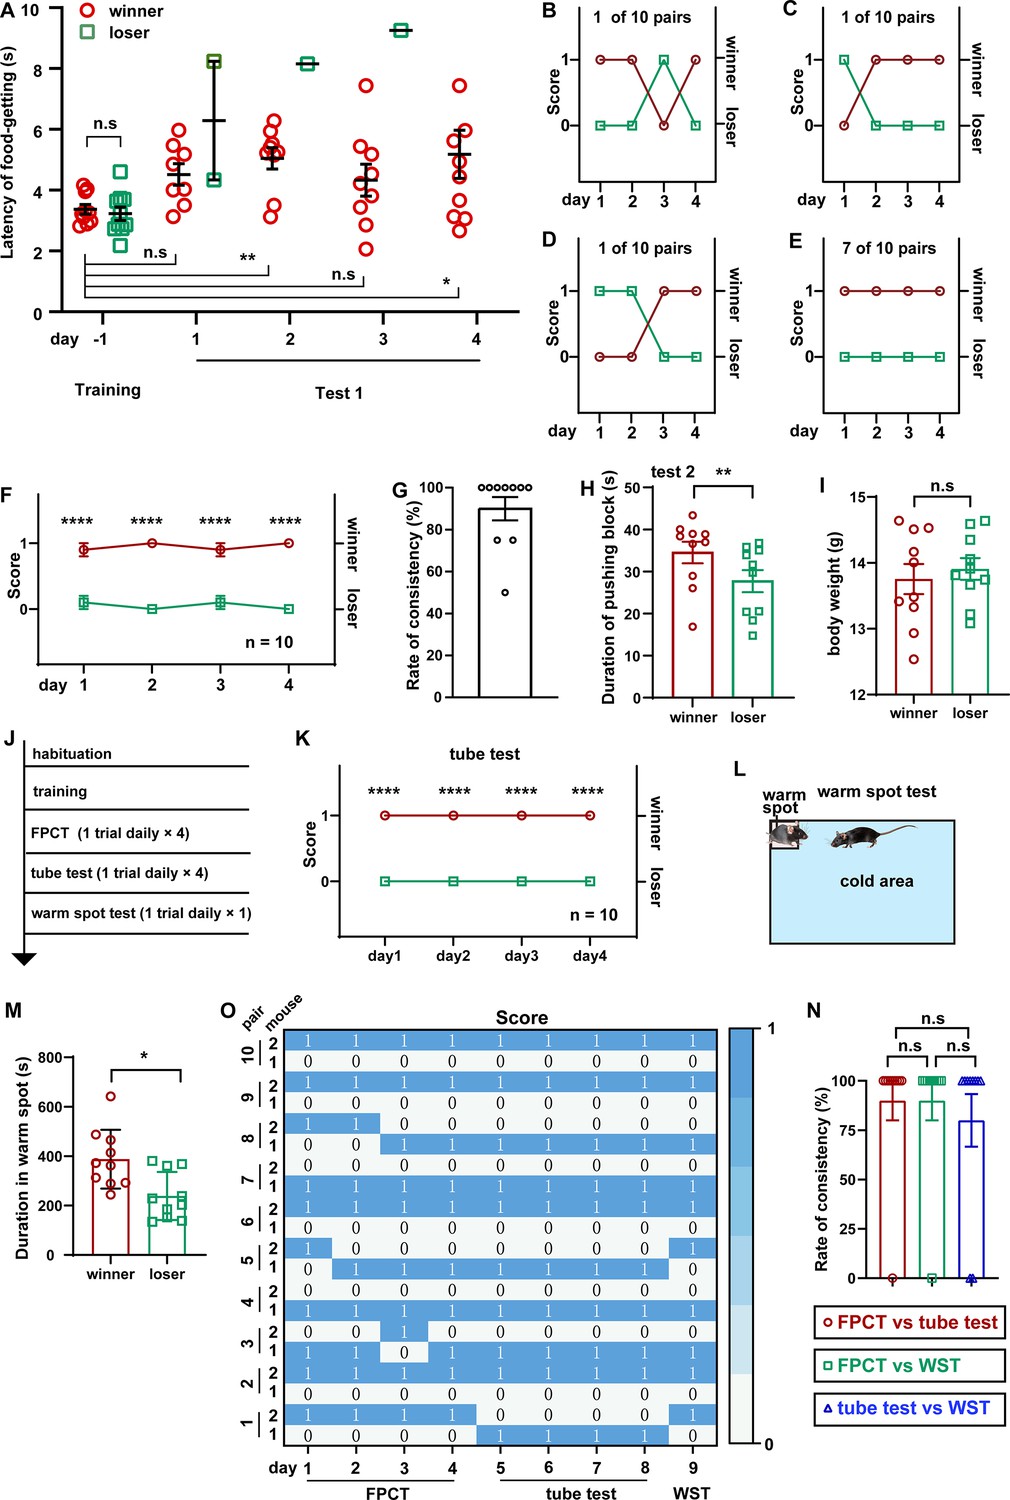
(A) Statistical data showing the latency of food-getting from the last day of training until the end of the test 1. Two-way ANOVA multiple comparisons, n=10 pairs; *p<0.05, **p<0.01, n.s. stands for nonsignificant difference. (B–D) 3 of the 10 pairs of cagemate female mice exhibited alternating winning/losing outcome in FPCT test 1. (E) 7 of the 10 pairs of female mice exhibited fully congruent winning/losing outcome in FPCT test 1. (F) Statistics of ranking of female mice over four trials (one trial daily) of FPCT test 1. Two-way ANOVA, n=10, ****p<0.0001. (G) Average rate of consistency within trials. For each pair, the rate of consistency was calculated as the percentage of the number of trials (in all four trials) resulting in the outcome same as the fourth trial (n=10). (H) Statistics of duration spent on pushing the block in FPCT test 2. The winner or loser identity was determined by the last trial of test 1. Paired Student’s t-test, *p<0.05, n=10. (I) Body weight of female mice measured after FPCT. Unpaired Student’s t-test, n.s. stands for nonsignificant difference, n=10. (J) Timeline of experiments showing tube test and WST was conducted after FPCT. (K) Statistics of ranking of female mice over four trials (one trial daily) of tube test. Two-way ANOVA, n=10, ****p<0.0001. (L) Schematic of the WST. (M) Cumulative duration of mice occupying the warm spot. The winner or loser identity was determined by the last trial of FPCT. Paired Student’s t test, n=10, *p<0.05. (O) Heatmap showing the outcomes of social competition of paired female mice ranked with FPCT, tube test, and WST. (P) Rate of consistency between FPCT and tube test (day 4 vs day 5), FPCT and WST (day 4 vs day 9), as well as tube test and WST (day 8 vs day 9). One-way ANOVA test, n=10, n.s. stands for nonsignificant difference. All statistical data were represented as mean ± SEM.
-
Figure 3—source data 1
Statistical behavioral data.
- https://cdn.elifesciences.org/articles/103748/elife-103748-fig3-data1-v1.xlsx
Figure 4
Ranking the triads of male mice using food pellet competition test (FPCT), tube test, and warm spot test (WST).
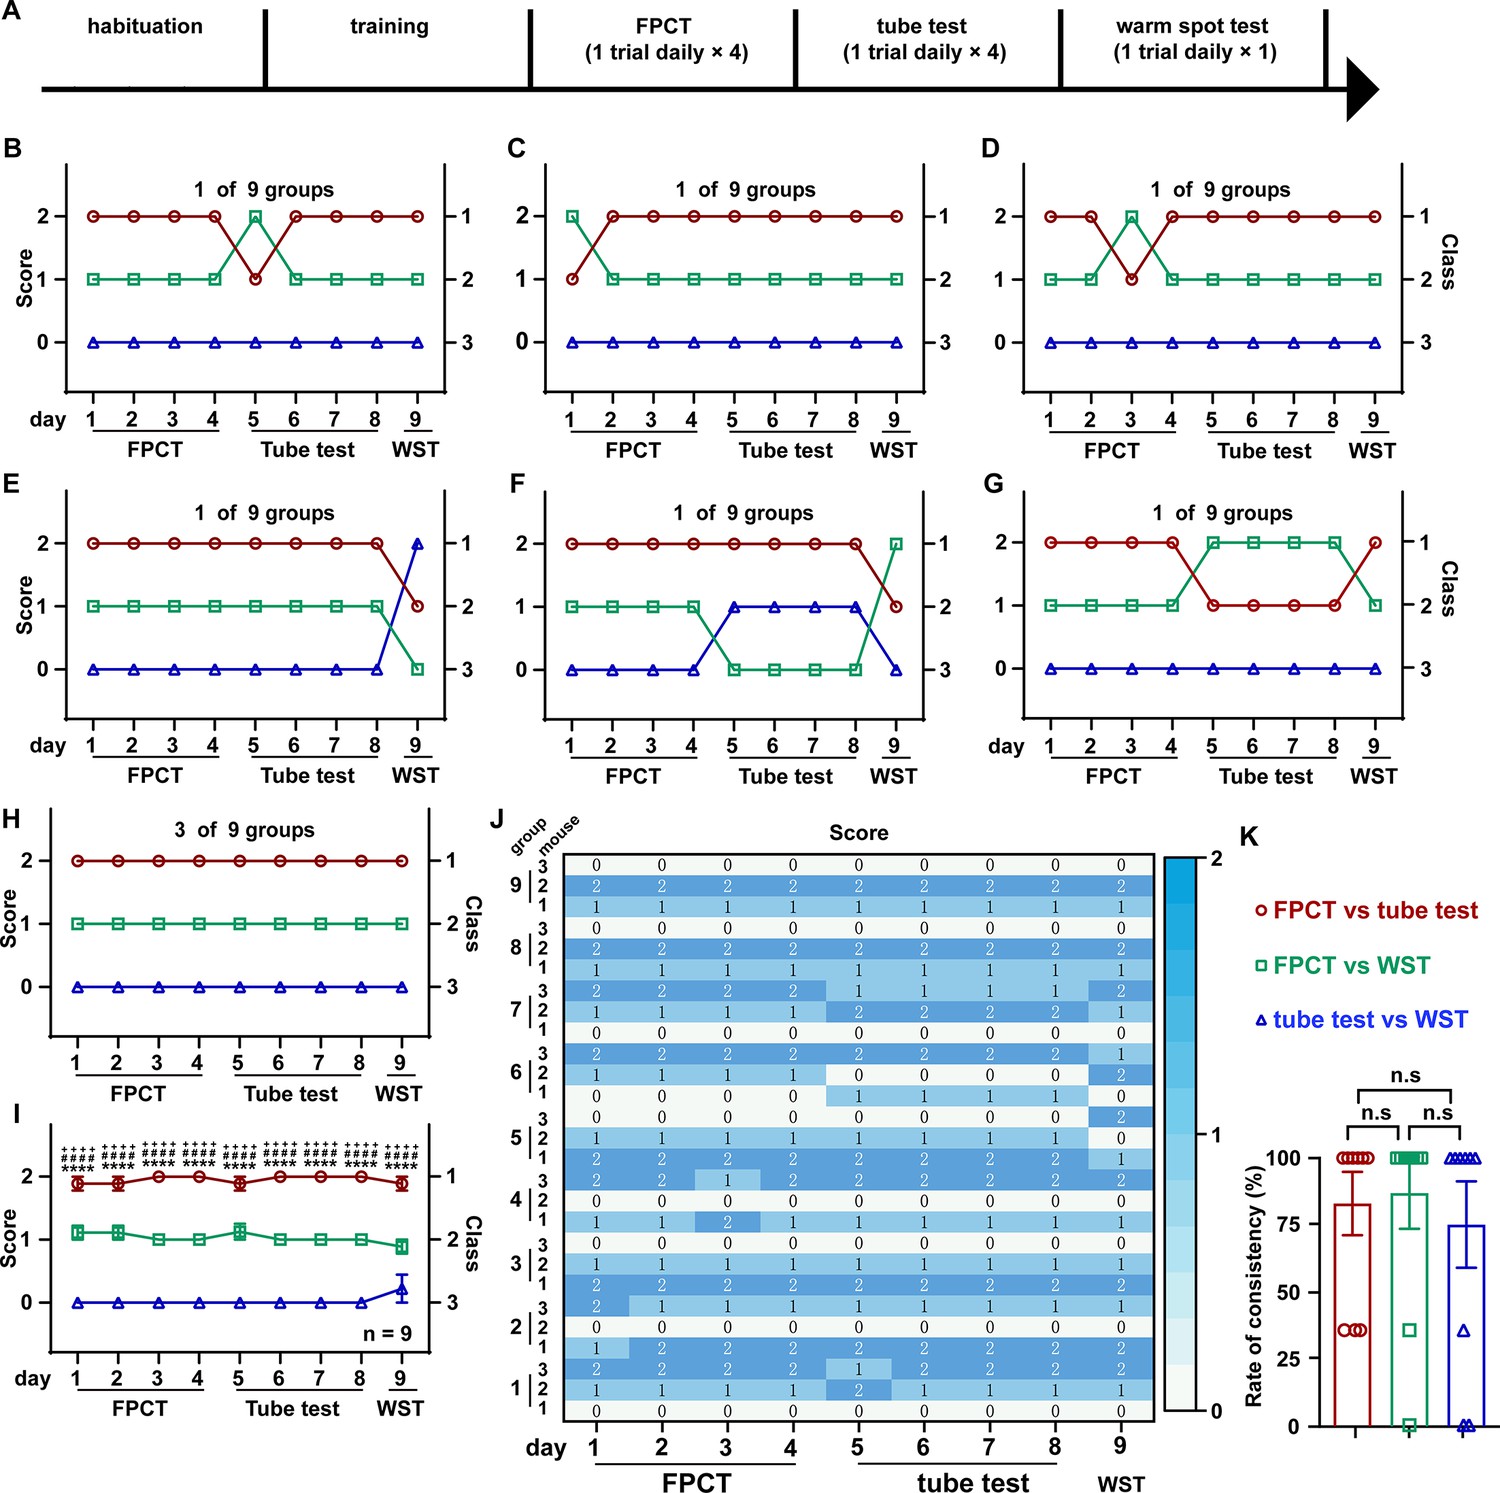
(A) Timeline of experiments to rank three-cagemate male mice using FPCT, tube test, and WST sequentially. In the FPCT and tube test, the mice contested in a round-robin style within each three-cagemate group. (B–G) 7 of the 10 groups of male mice exhibited alternating winning/losing outcomes during the whole competition tasks. (H) 3 of the 10 groups of male mice exhibited fully congruent winning/losing outcomes during the whole competition tasks. (I) Statistics of ranking of mice over the whole competition tasks. Two-way ANOVA test, n=10, ++++p<0.0001 comparing FPCT and tube test, ****p<0.0001 comparing FPCT and tube test, ####p<0.0001 comparing tube test and WST. (J) Rate of consistency between FPCT and tube test (day 4 vs day 5), FPCT and WST (day 4 vs day 9), as well as tube test and WST (day 8 vs day 9). One-way ANOVA test, n=10, n.s. stands for nonsignificant difference. (K) Heatmap showing the ranking outcomes of grouped male mice during the whole competition tasks. All statistical data were represented as mean ± SEM.
-
Figure 4—source data 1
Statistical behavioral data.
- https://cdn.elifesciences.org/articles/103748/elife-103748-fig4-data1-v1.xlsx
Additional files
Download links
A two-part list of links to download the article, or parts of the article, in various formats.
Downloads (link to download the article as PDF)
Open citations (links to open the citations from this article in various online reference manager services)
Cite this article (links to download the citations from this article in formats compatible with various reference manager tools)
Social rank-order stability of mice revealed by a novel food competition paradigm in combination with available space competition paradigms
eLife 14:RP103748.
https://doi.org/10.7554/eLife.103748.3


