Expanding automated multiconformer ligand modeling to macrocycles and fragments
- Department of Bioengineering and Therapeutic Sciences, University of California, San Francisco, United States
- Department of Pharmaceutical Chemistry, University of California, San Francisco, United States
- Atomwise Inc, United States
Figures
Figure 1 with 2 supplements

qFit-ligand algorithm workflow.
All ligands undergo three preliminary searches: unconstrained, fixed terminal atoms, and blob search, allowing varying degrees of freedom (A–C). If the ligand has short or long side chains, the algorithm progresses to more specialized searches: branch search for ligands with side chains of at least four atoms (D), and long chain search for those exceeding 30 atoms (E). The algorithm then determines the best fit of generated conformers to electron density through quadratic programming, followed by additional sampling with rotations and translations (F). The remaining conformers then undergo quadratic and mixed-integer quadratic programming to ensure that only the most well-supported conformers are included in the final model.
Figure 1—figure supplement 1
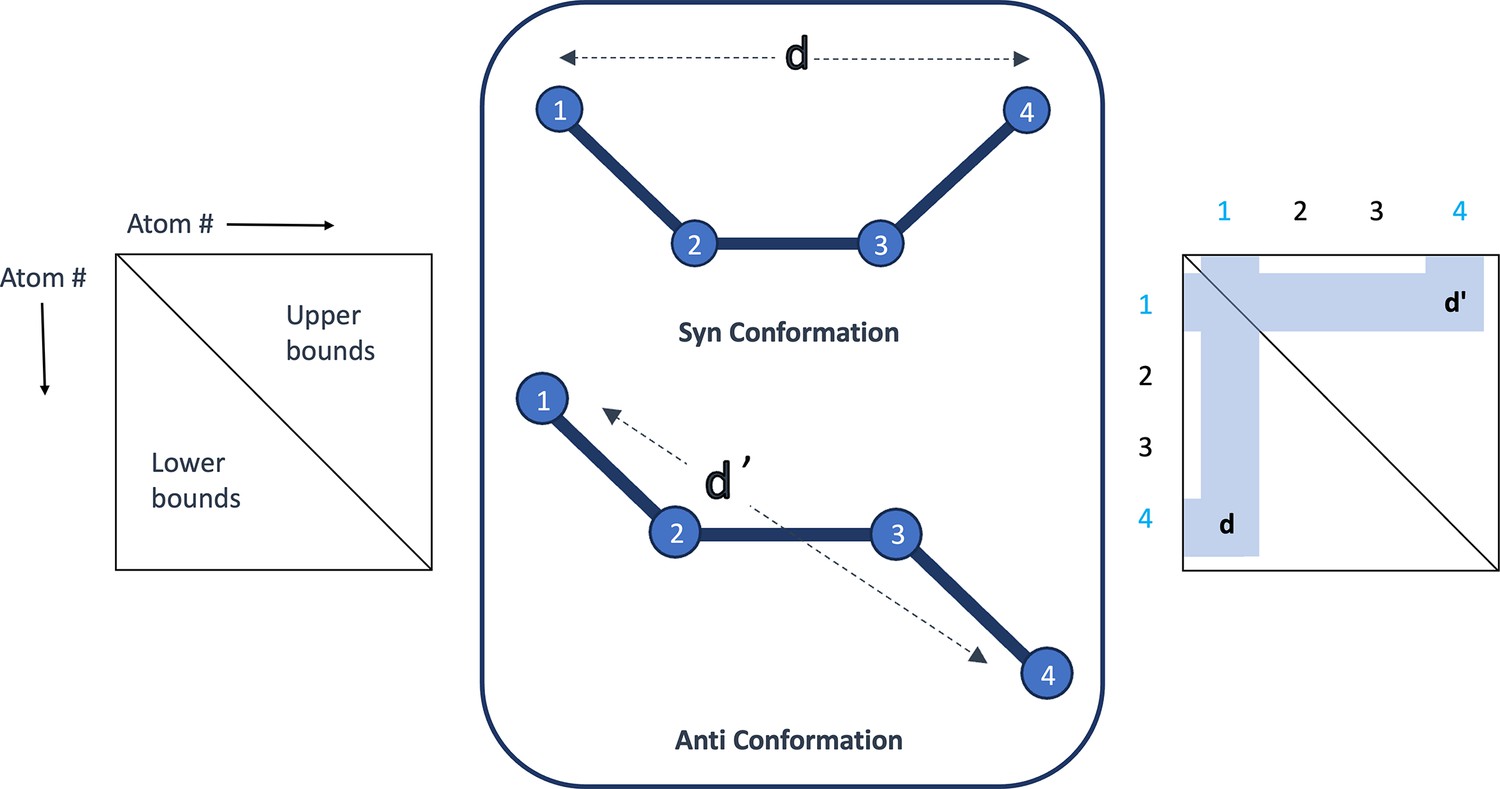
RDKit determines a distance bounds matrix for a molecule by establishing upper and lower bounds for interatomic distances.
These bounds are informed by experimental data and chemical knowledge of bond length, angle, and dihedral angle preferences obtained from the Cambridge Structural Database. Within a torsion angle formed by four atoms, the minimum distance between atoms 1 and 4 corresponds to the syn conformation, and the maximum distance corresponds to the anti conformation. These specific distances, d for syn and d’ for anti, are recorded in the bounds matrix as the lower and upper bounds, respectively. This is performed for every distance between each atom in the molecule. Randomly sampling these bounds with RDKit’s implementation of Experimental-Torsion Knowledge Distance Geometry (ETKDG) gives rise to different conformations of the torsion angle.
Figure 1—figure supplement 2
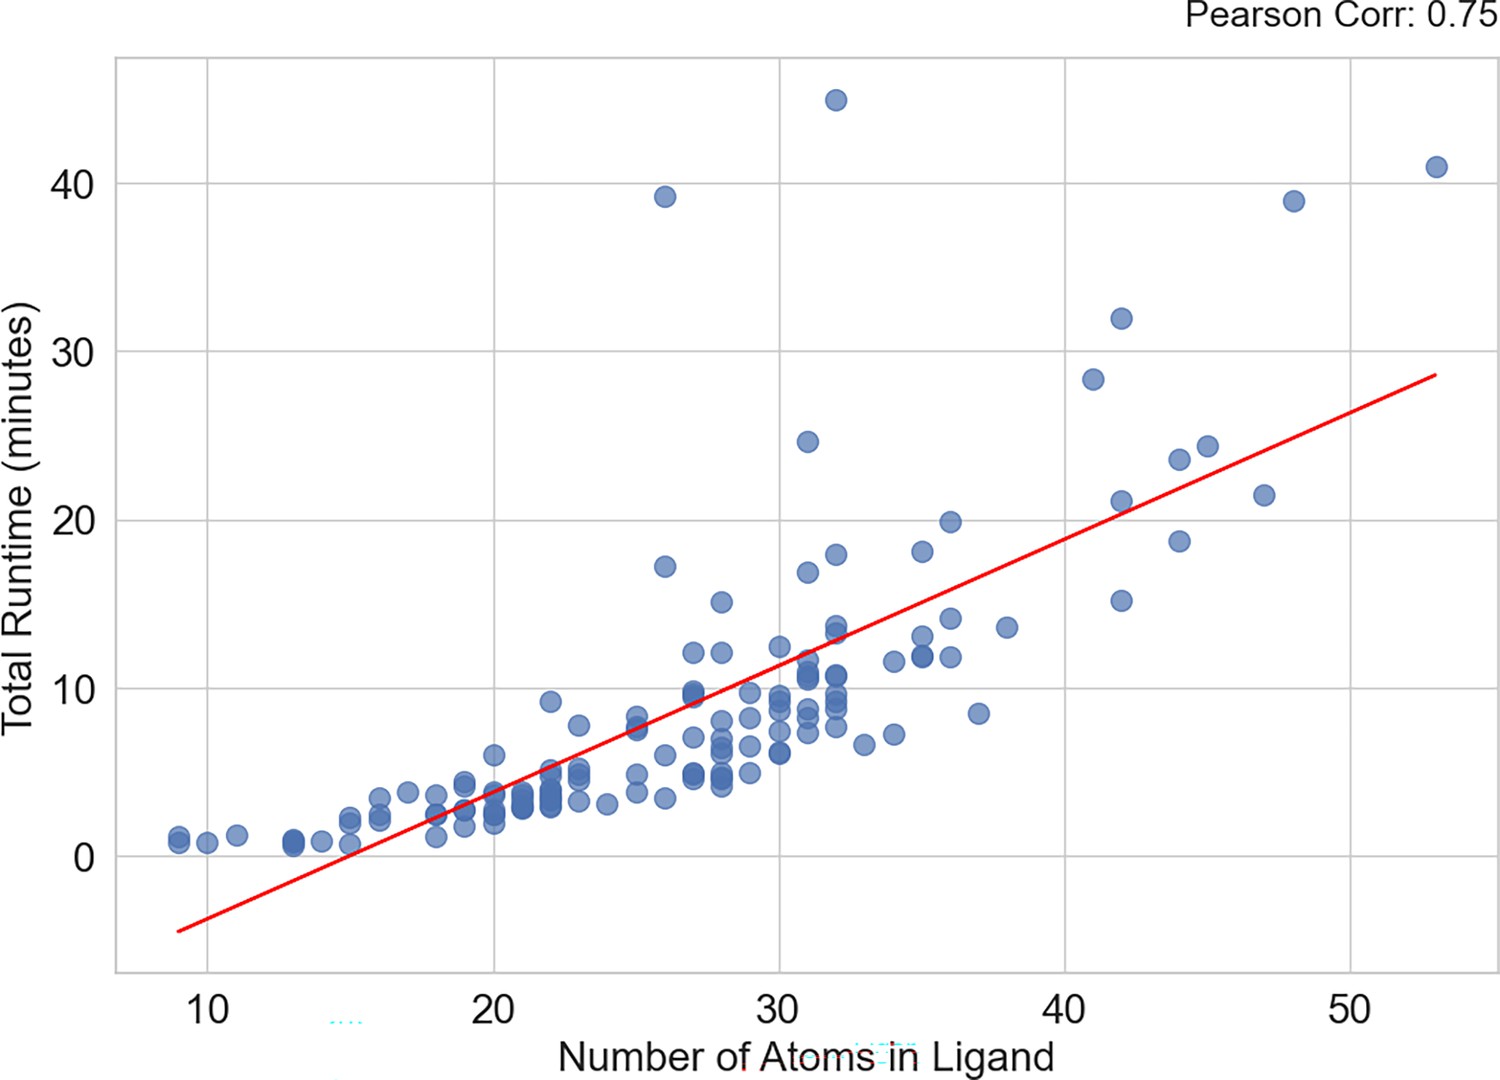
Correlation between the number of atoms in the input ligand and total qFit-ligand runtime.
A strong Pearson correlation of 0.75 indicates that as you increase the size of your input molecule, qFit-ligand will take longer to run.
Figure 2 with 5 supplements
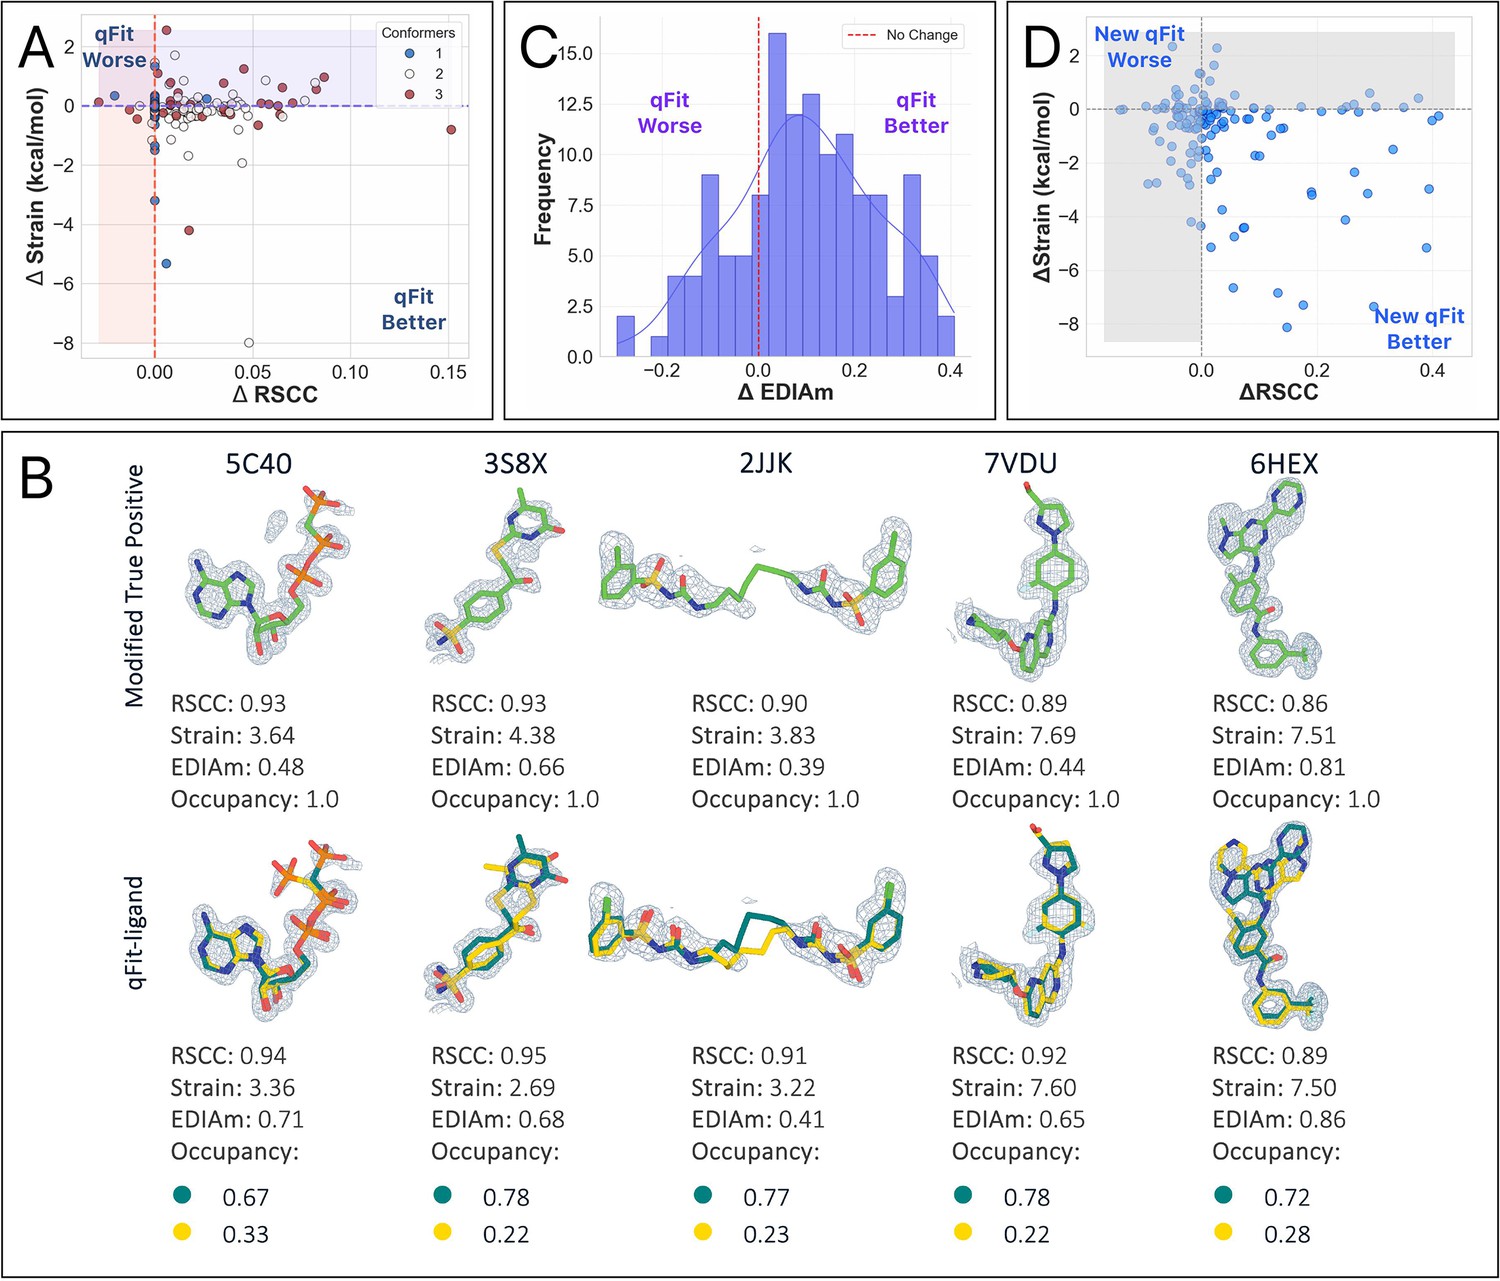
Analysis of ligand conformations generated by qFit-ligand.
(A) Differences in real space correlation coefficients (RSCC) (x-axis) and torsion strain (y-axis) between qFit-ligand predicted structures and modified true positives. The lower right quadrant shows structures for which we improve both RSCC and strain. (B) Gallery of examples for which the new qFit-ligand models have improved RSCC, strain, and EDIAm compared to the modified true positives. The composite omit density map is contoured at 1σ for every structure. (C) Differences in EDIAm between qFit-ligand models and modified true positives. Positive delta values indicate structures where the qFit-ligand model is a better fit to the experimental density. (D) Differences in RSCC and torsion strain between the new qFit-ligand and the prior qFit-ligand. The lower right quadrant shows structures for which we improve both RSCC and strain.
Figure 2—figure supplement 1
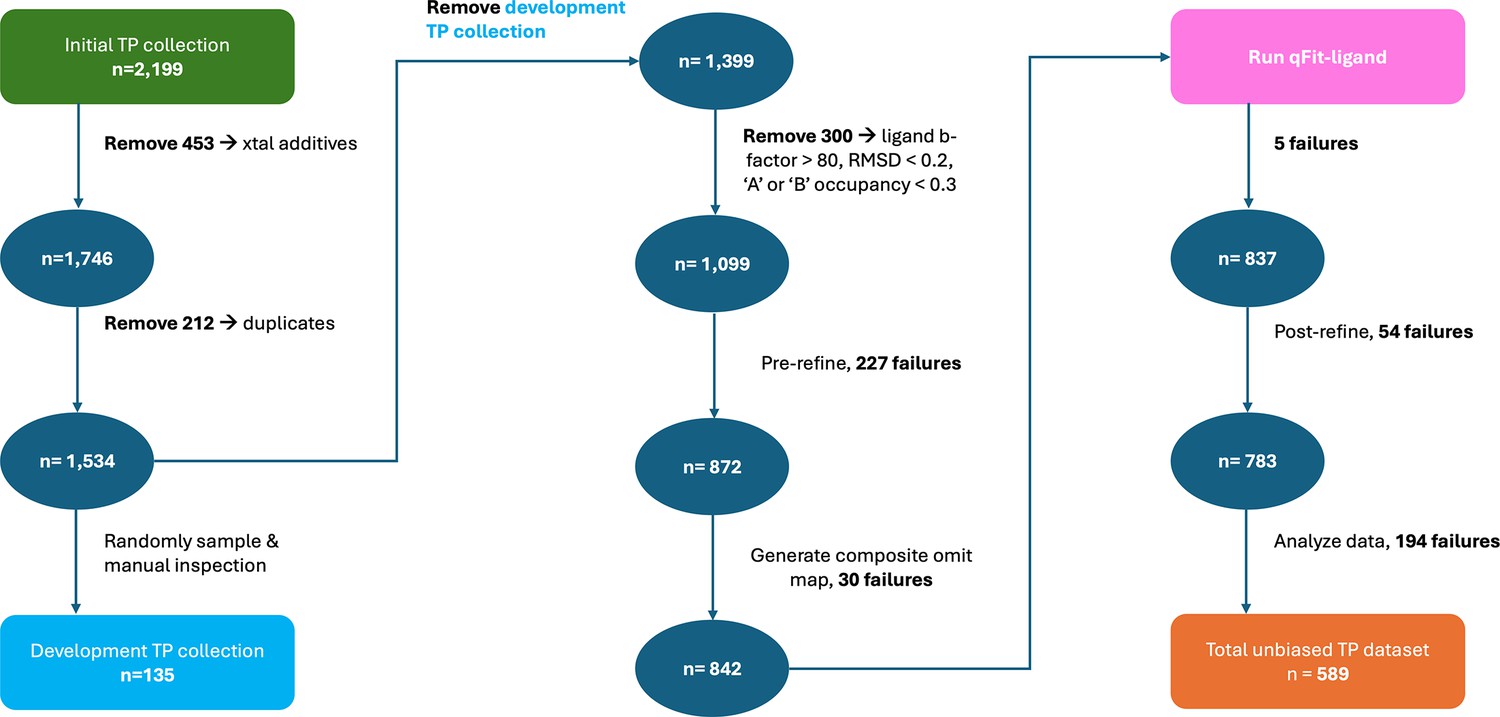
Construction of the development true positive dataset and the unbiased true positive dataset.
Figure 2—figure supplement 2
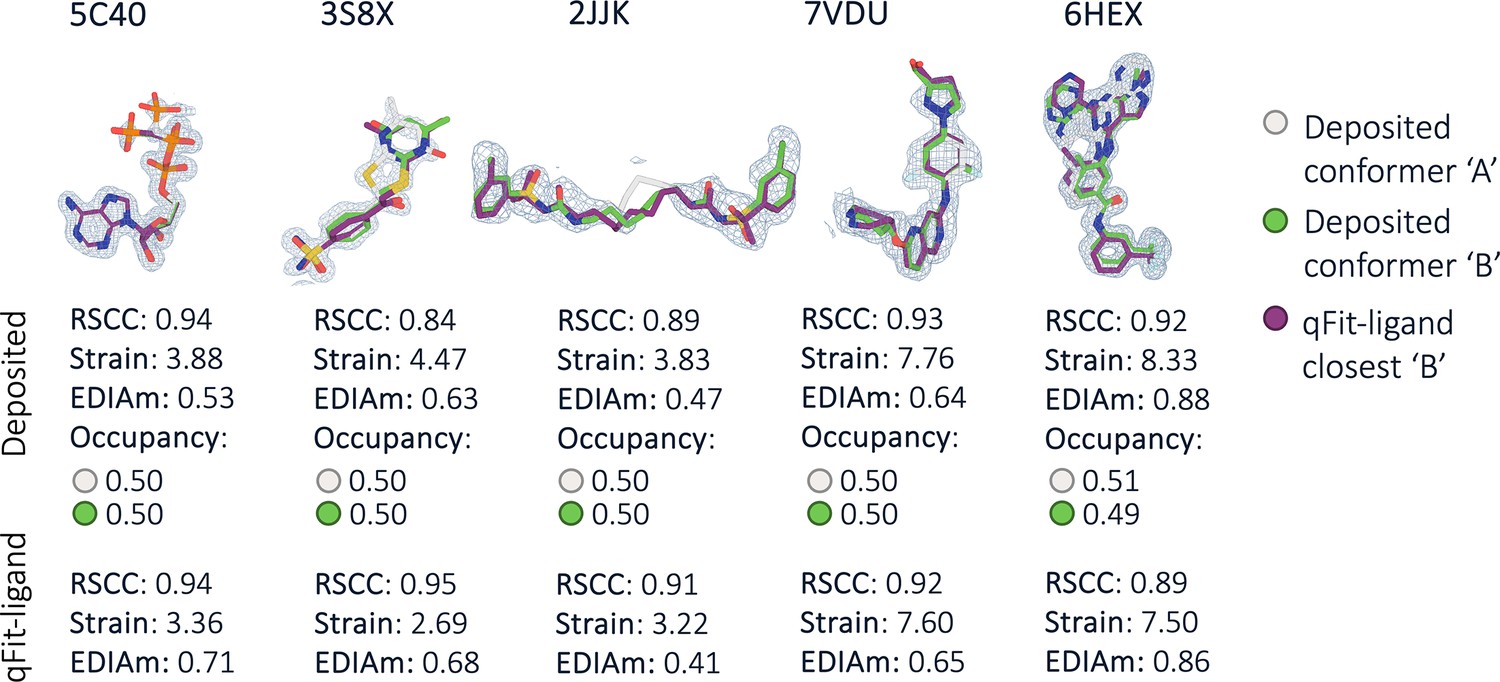
Original (unmodified) multiconformer true positives compared to qFit-ligand conformers.
The deposited ‘A’ conformer is shown in gray and the deposited ‘B’ conformer in green. The qFit-ligand conformer closest to the deposited ‘B’ is shown in purple. This demonstrates qFit-ligand’s ability to accurately recapitulate the original deposited multiconformer model. The composite omit density map is contoured at 1σ for every structure.
Figure 2—figure supplement 3
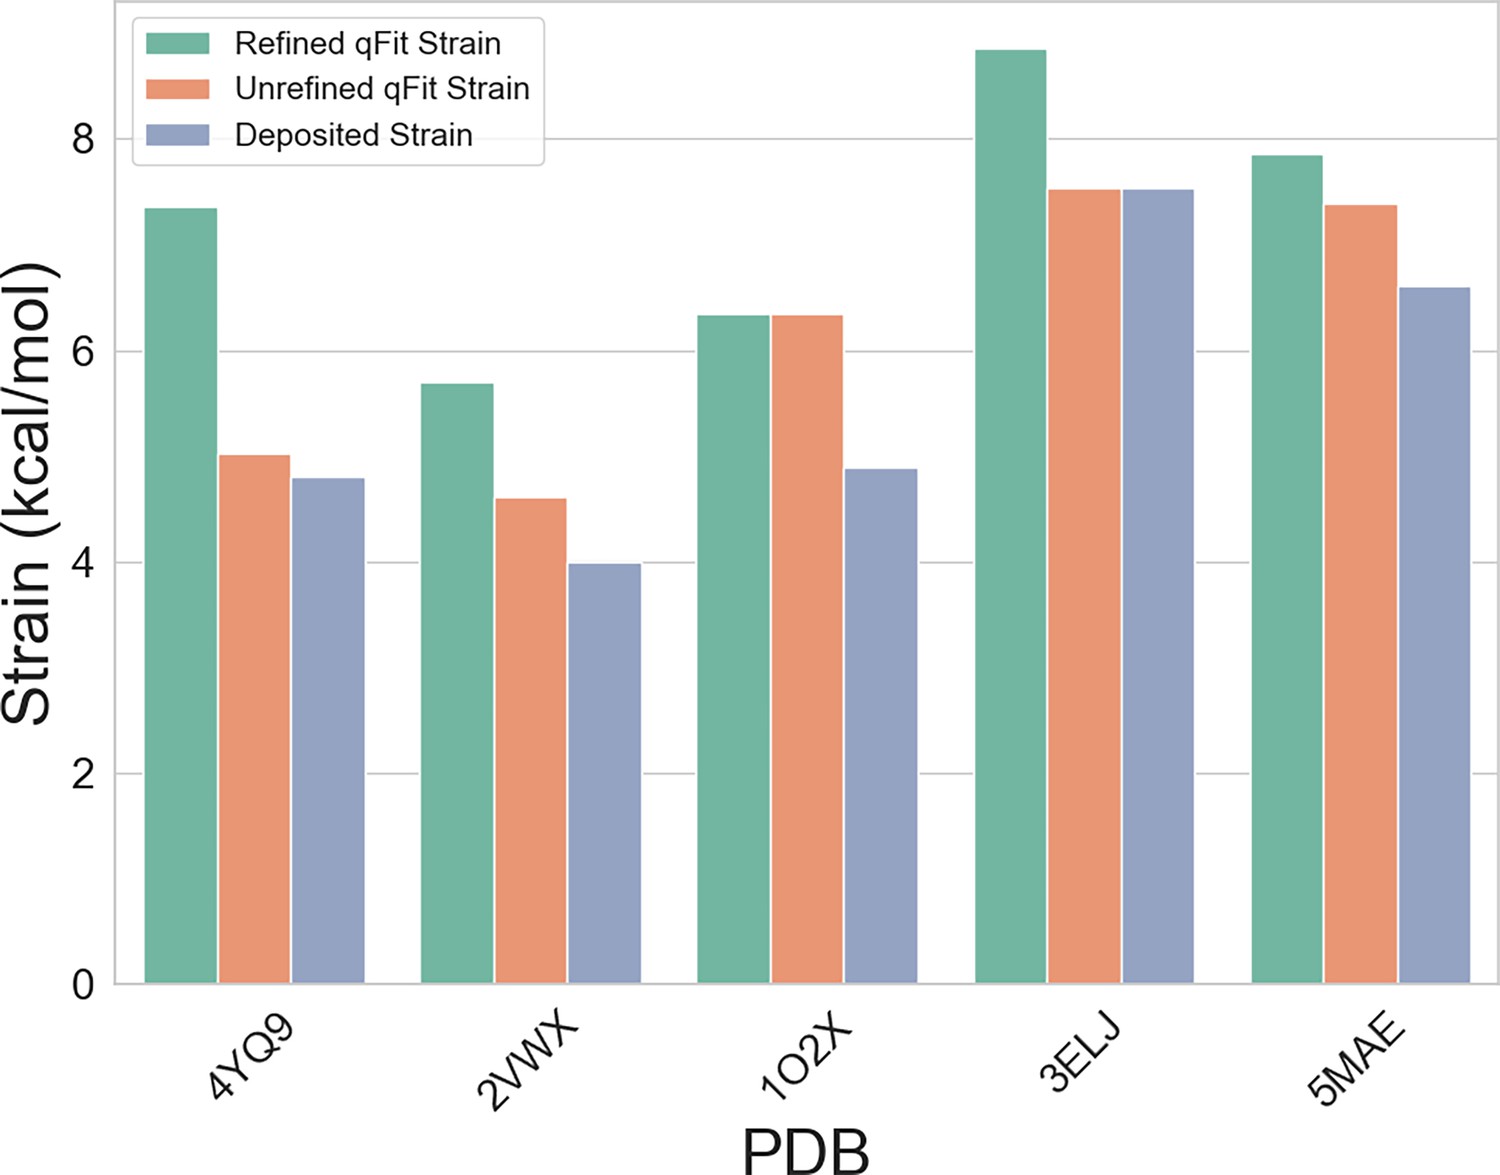
Comparison of torsion strain between qFit-ligand models before and after refinement, as well as the deposited structures.
The five structures for which the refined qFit-ligand model strain was most significantly increased from the deposited model strain are highlighted.
Figure 2—figure supplement 4
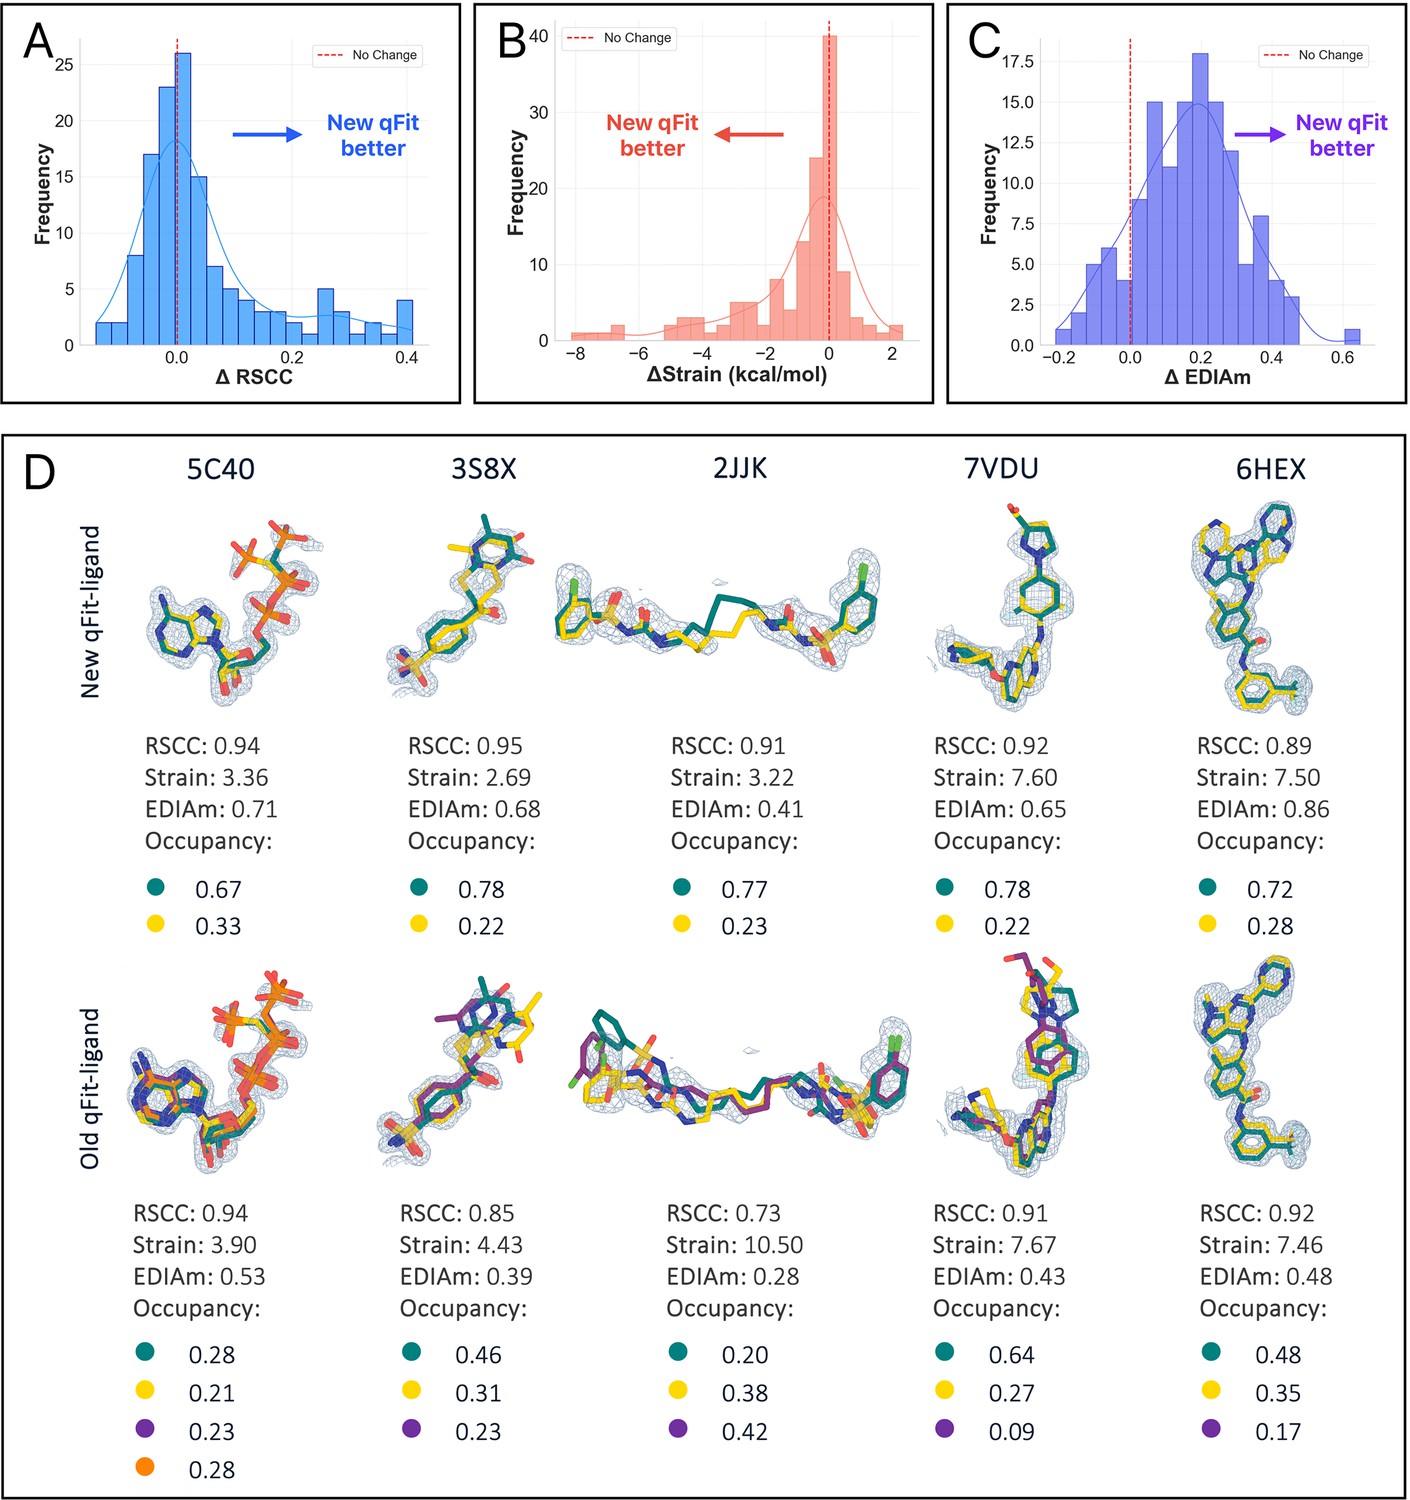
Performance comparison of new and prior qFit-ligand algorithms.
(A) Real space correlation coefficients (RSCC) of new versus prior qFit-ligand predicted conformations across the true positive dataset. Bars to the right of the vertical line are for structures where the new qFit-ligand model has a higher (better) RSCC. (B) Torsion strain of new versus prior qFit-ligand predicted conformations across the true positive dataset. Bars to the left of the vertical line are for structures where the new qFit-ligand model has improved (lower) internal strain. (C) EDIAm of new versus prior qFit-ligand predicted conformations. Bars to the right of the vertical line are for structures where the new qFit-ligand model has a higher (better) EDIAm. (D) Gallery of examples for which the new qFit-ligand models are both higher in RSCC/EDIAm and lower in strain compared to the prior qFit-ligand models. The composite omit density map is contoured at 1σ for every structure.
Figure 2—figure supplement 5
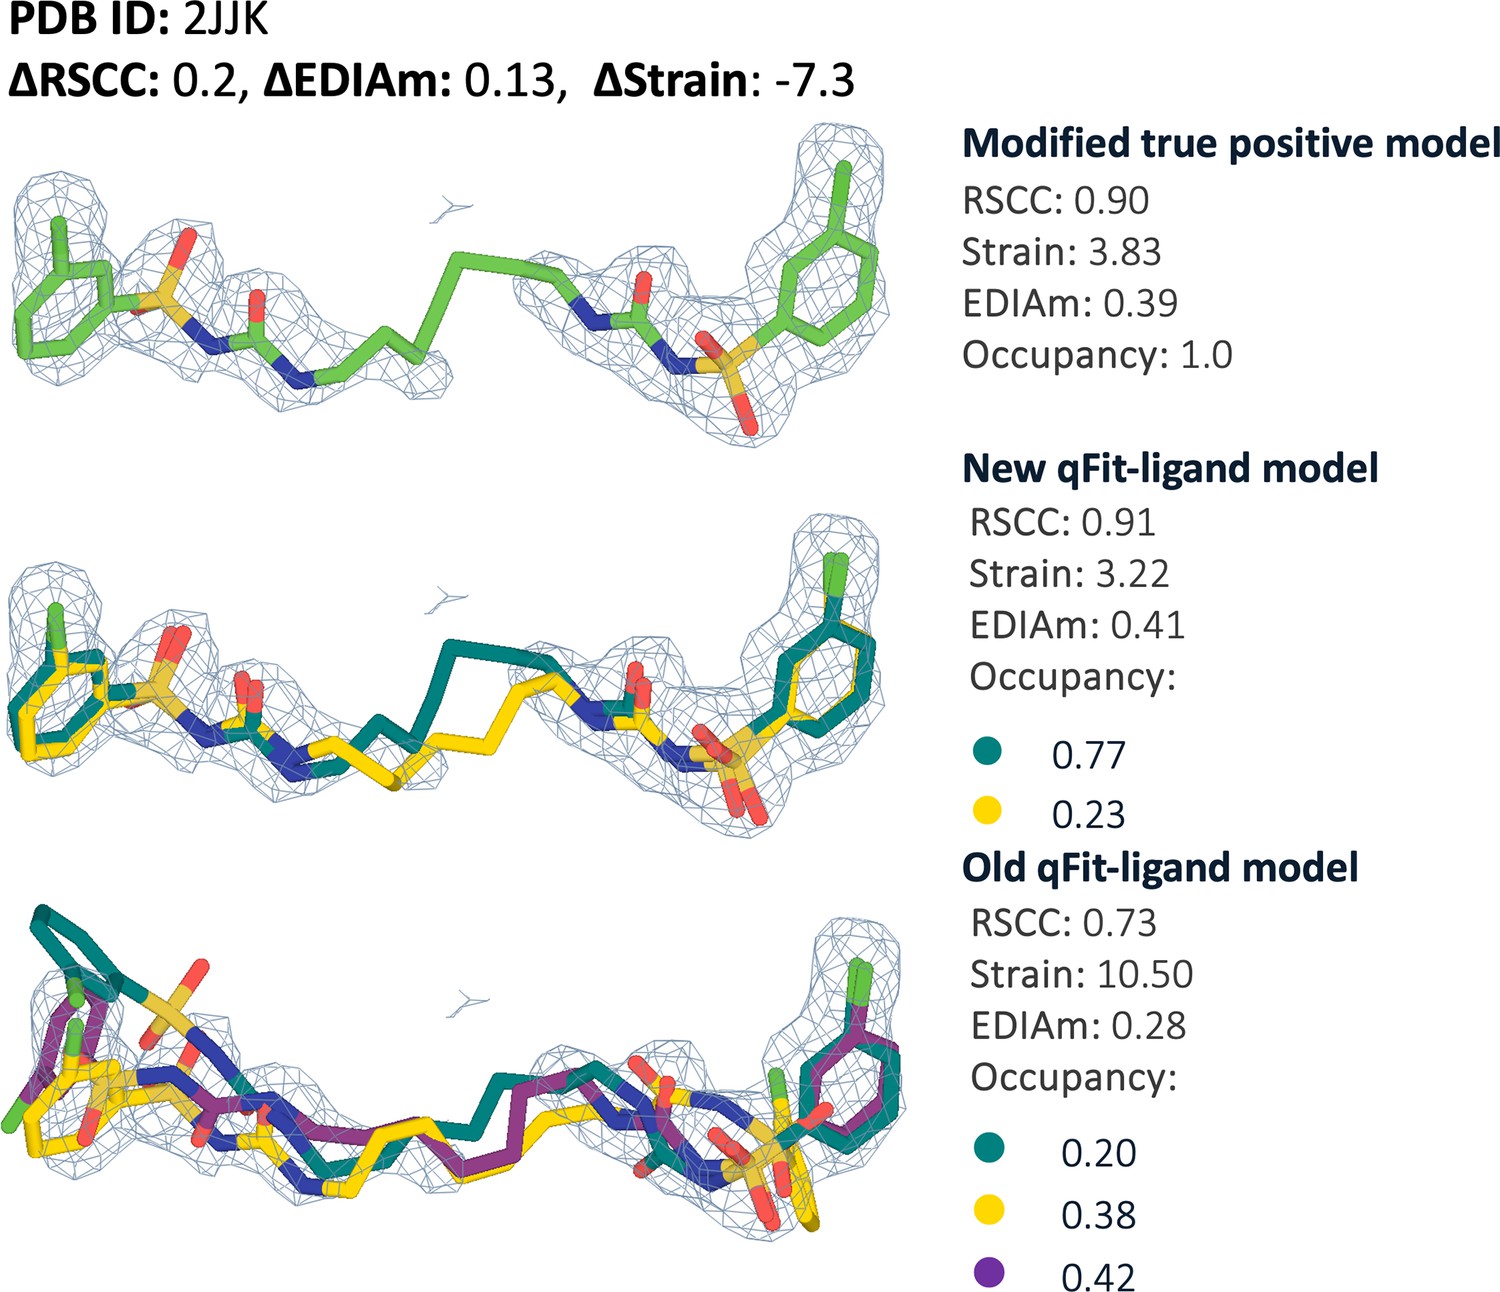
Modified true positive dataset comparison of new versus prior qFit-ligand outlier cases.
Modified true positive model (input for qFit-ligand), new qFit-ligand model, and prior qFit-ligand model for PDB 2JJK, showing their respective real space correlation coefficients (RSCC), strain, EDIAm, and conformer occupancies. Compared to the prior qFit-ligand model, the new model increased RSCC by 0.2, increased EDIAm by 0.1, and decreased strain by 7.3 kcal/mol. The composite omit density map is contoured at 1σ.
Figure 3 with 1 supplement

Resolution and occupancy limits of qFit-ligand.
(A) Real space correlation coefficients (RSCC) of the synthetic true benchmark structures plotted against map resolution (in Ångstroms) for different conformer occupancy ratios, showing a decrease in RSCC with deteriorating map resolution. (B) RSCC of qFit-ligand generated multiconformer models, plotted against map resolution and grouped by conformer occupancy split. (C) Root mean square deviation (RMSD) between the closest qFit-ligand conformer and the true ‘B’ conformer. (D, left) True structure and qFit-ligand predicted structure of 3SC multiconformer ligand with a map resolution of 0.8 Å and conformer occupancy split of 0.50/0.50. (D, right) True structure and qFit-ligand predicted structure of 3SC multiconformer ligand with a map resolution of 0.8 Å and conformer occupancy split of 0.80/0.20.
Figure 3—figure supplement 1
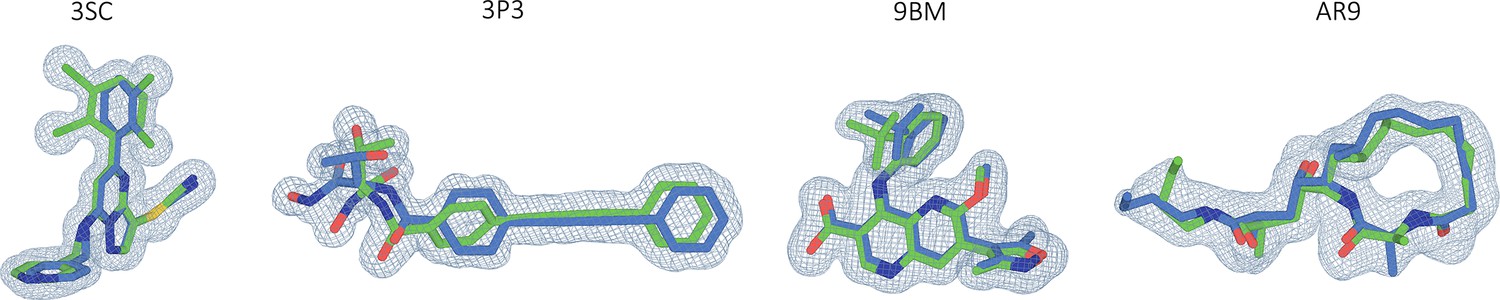
The four ligand multiconformer models from which our synthetic dataset was built.
Here, they are shown at a map resolution of 0.8 Å at 1σ.
Figure 4

Analysis of ligand conformations generated by qFit-ligand on the unbiased modified true positive dataset.
(A) Distribution of the number of conformers output by qFit-ligand. (B) Differences in real space correlation coefficients (RSCC) and torsion strain between the qFit-ligand models and the modified true positives. The lower right quadrant shows structures for which we improve both RSCC and strain. (C) Differences in EDIAm values between the qFit-ligand models and the modified true positives. Bars to the right of the vertical axis represent structures where the qFit-ligand model fits better to the electron density map.
Figure 5 with 1 supplement

qFit-ligand improves fit of highly strained deposited molecules.
(A) Distribution of the number of conformers modeled by qFit-ligand across 191 deposited structures with ligand torsional strain >10 kcal/mol. (B) Real space correlation coefficients (RSCC) and strain differences in the refined deposited models and the qFit-ligand predicted models. The lower right quadrant shows structures for which we improve both RSCC and strain. (C, top) Differences in torsion strain between the qFit-ligand models and the refined deposited models for structures where qFit-ligand predicted a single-conformer model. Negative delta values, all bars to the left of the vertical axis, represent structures for which the qFit-ligand model has a lower strain. (C, bottom) Differences in torsion strain between the qFit-ligand models and the refined deposited models for structures where qFit-ligand predicted a multiconformer model. Negative delta values, all bars to the left of the vertical axis, represent structures for which the qFit-ligand model has a lower strain. (D) Gallery of examples for which qFit-ligand successfully recovers well-fitting alternate conformers, and therefore reduces strain. The composite omit density map is contoured at 1σ for every structure.
Figure 5—figure supplement 1
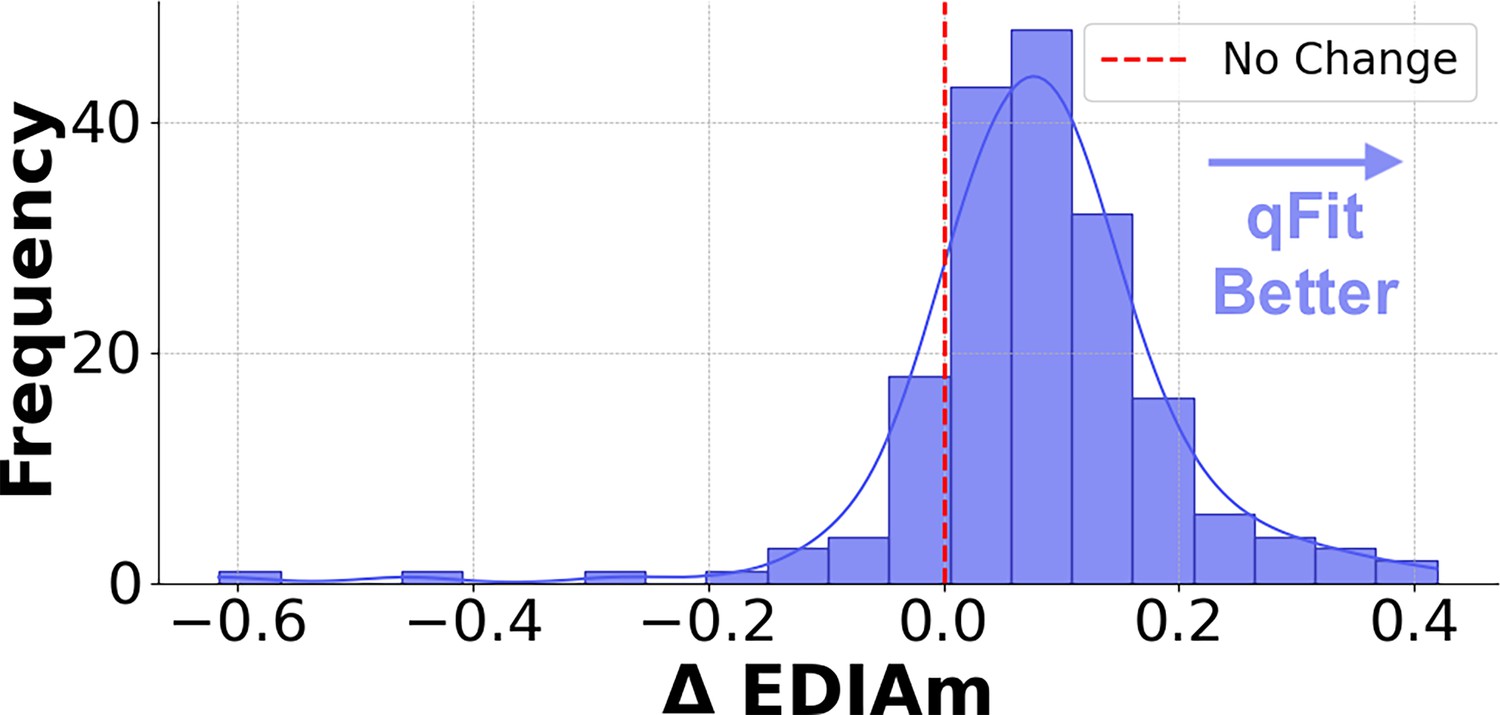
Differences in EDIAm between the qFit-ligand models and the refined deposited models.
Positive delta values, all bars to the right of the vertical axis, represent structures for which the qFit-ligand model has a higher EDIAm.
Figure 6 with 1 supplement

Evaluation of qFit-ligand predicted macrocycle conformations.
(A) Differences in real space correlation coefficients (RSCC) and torsion strain between qFit-ligand predicted structures and refined deposited single-conformer macrocycles. The lower right quadrant shows structures for which we improve both RSCC and strain. (B) Differences in EDIAm values between the qFit-ligand and deposited models. Bars to the right of the vertical axis represent structures where the qFit-ligand model fits better to the electron density map. (C) Gallery of examples for which the qFit-ligand models have improved RSCC and strain compared to the deposited single-conformer macrocycle ligand. The composite omit density map is contoured at 1σ for every structure.
Figure 6—figure supplement 1
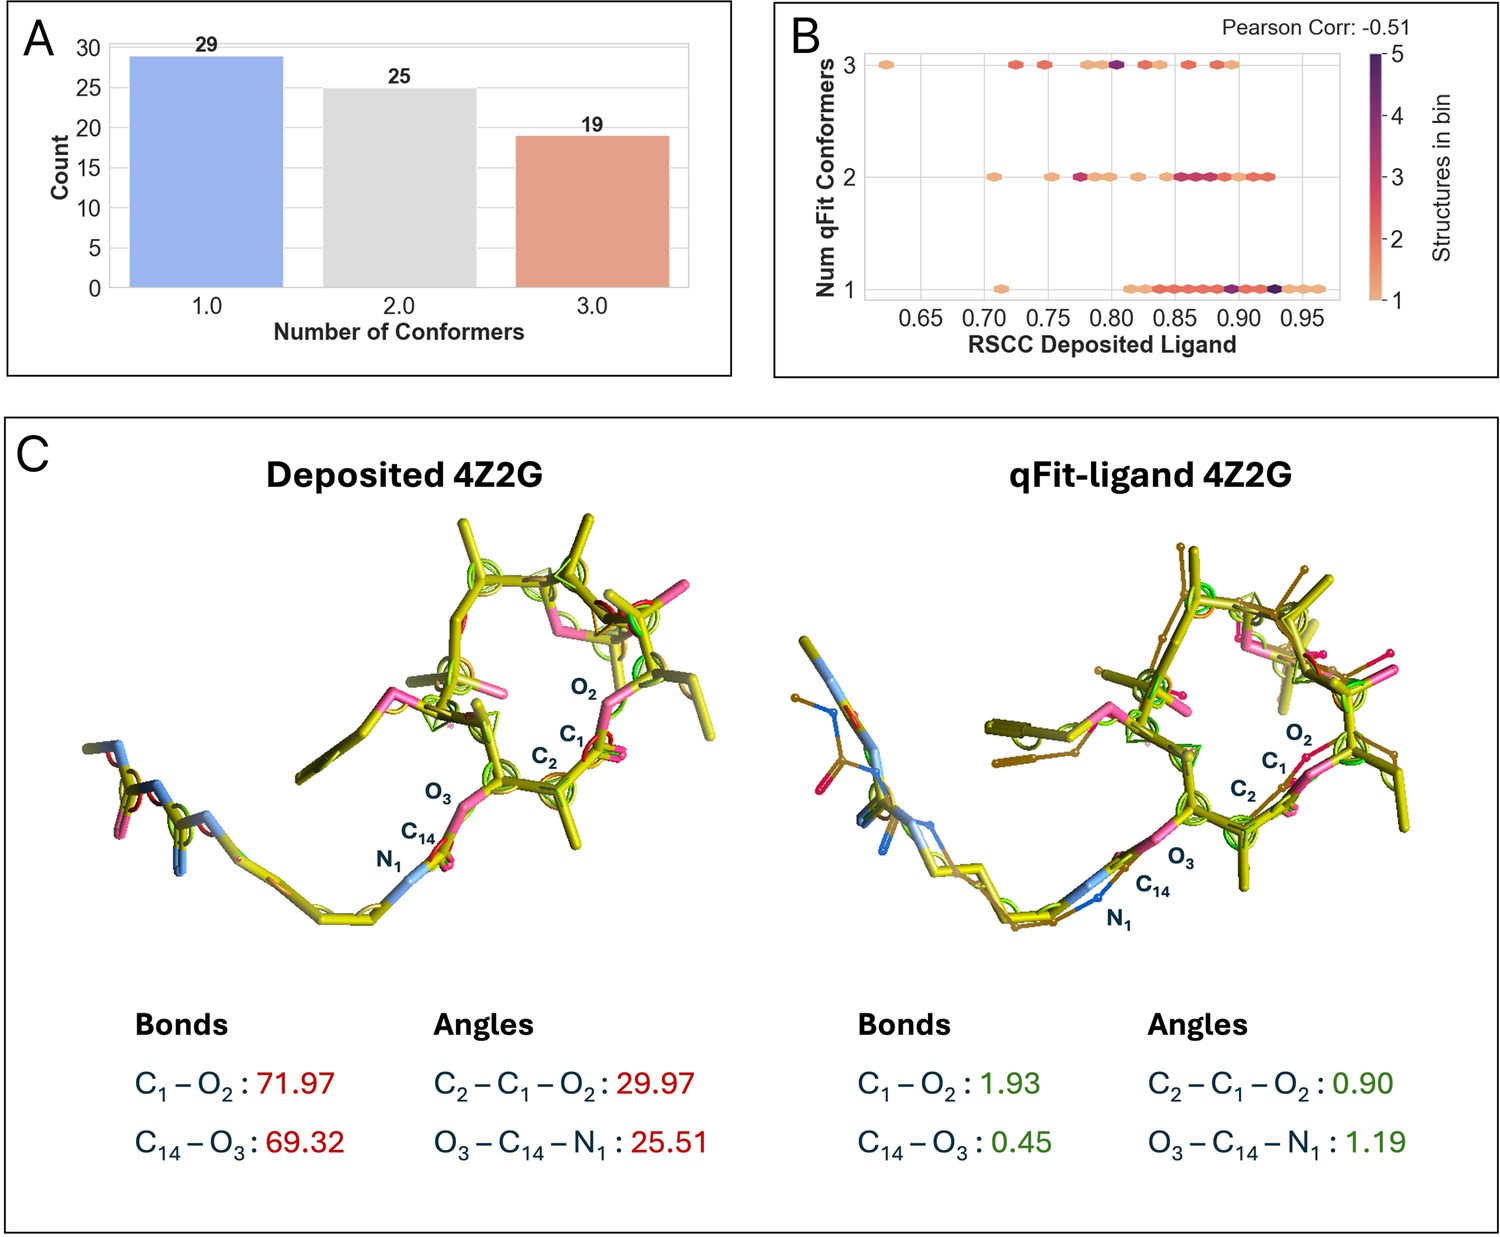
The number of macrocycle alternative conformers produced per PDB and their relationship to fit to density.
(A) Distribution of the number of conformers in qFit-ligand output models, showing varied conformer presence with a median of two conformers per structure. (B) Correlation between the number of conformers output by qFit-ligand and the real space correlation coefficients (RSCC) of the input model. Higher input RSCC tends to yield a lower number of qFit-ligand conformers. (C) Comparison of strain between the single conformer deposited macrocycle and the qFit-ligand ‘B’ conformer for PDB 4Z2G using the COOT ligand distortion tool. The penalty scores for the two most distorted bonds and angles in the deposited model (left), compared to the same bonds and angles in the qFit-ligand ‘B’ conformer (right), demonstrating reduced strain in the alternate conformation. The deposited conformer is highly strained, with the highest bond penalty scores of 71.97 (C1–O2) and 69.32 (C14–O3), and the highest angle penalty scores of 29.97 (C2–C1–O2) and 25.5 (O3–C14–N1). The qFit-ligand ‘B’ conformer is significantly less distorted at these locations. For the same bonds and angles, it produces a penalty score of 1.93 (C1–O2), 0.45 (C14–O3), 0.90 (C2–C1–O2), and 1.19 (O3–C14–N1).
Figure 7 with 2 supplements
Evaluation of qFit-ligand on fragments in PanDDA maps.
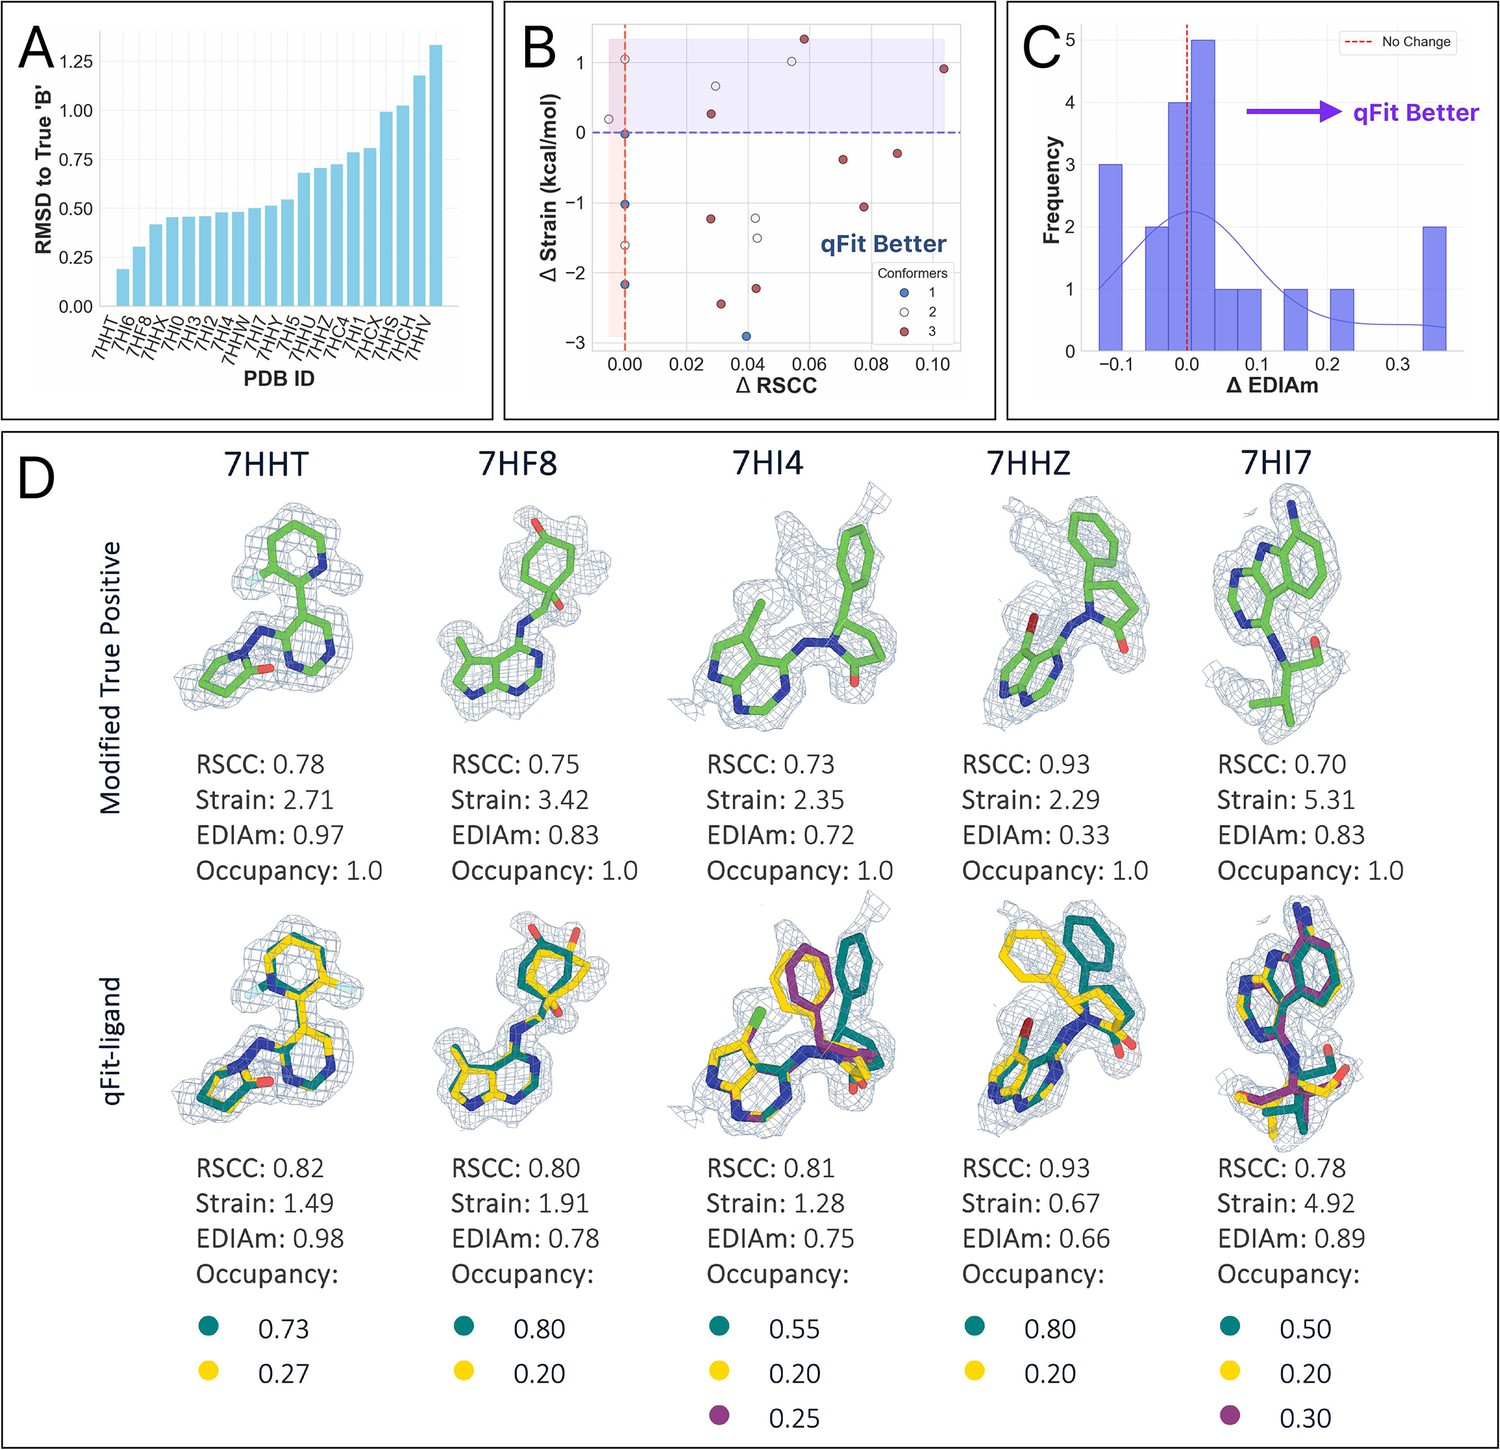
(A) Root mean square deviation (RMSD) between the deposited ‘B’ conformer and the closest qFit-ligand conformer. Lower values correlate with a closer recapitulation of the deposited heterogeneity. (B) Real space correlation coefficients (RSCC) and torsion strain differences in the deposited models and the qFit-ligand predicted models. The lower right quadrant shows structures for which we improve both RSCC and strain. (C) Differences in EDIAm values between the qFit-ligand and modified true positive models. Bars to the right of the vertical axis represent structures where the qFit-ligand model fits better to the event map. (D) Gallery of examples for which qFit-ligand successfully recovers well-fitting alternate conformers. The composite omit density map is contoured at 1σ for every fragment.
Figure 7—figure supplement 1
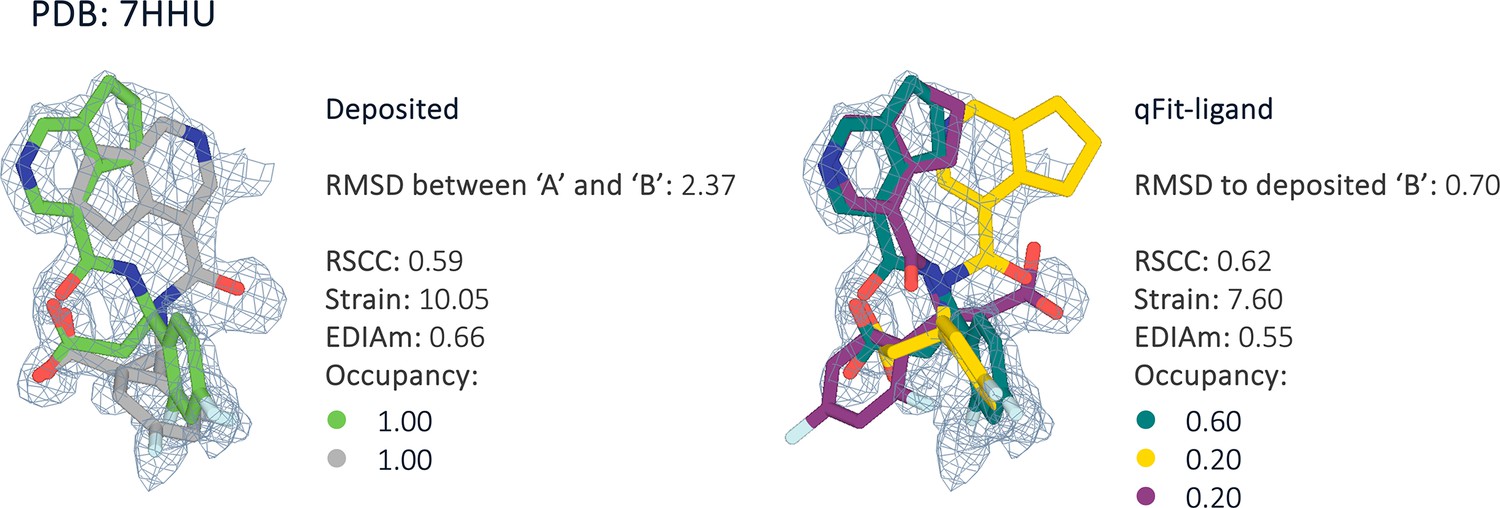
PDB 7HHU represents the structure with the highest root mean square deviation (RMSD) between its deposited ‘A’ (green) and ‘B’ (gray) conformers.
Due to qFit-ligand’s sampling bias toward the input structure, we largely fail to recover the known heterogeneity of this sample, with an RMSD of 0.70 Å between the qFit model and the deposited ‘B’. qFit real space correlation coefficients (RSCC) and strain show improvements over the single conformer modified true positive, but EDIAm worsens. The event density map is contoured at 1σ for both structures.
Figure 7—figure supplement 2
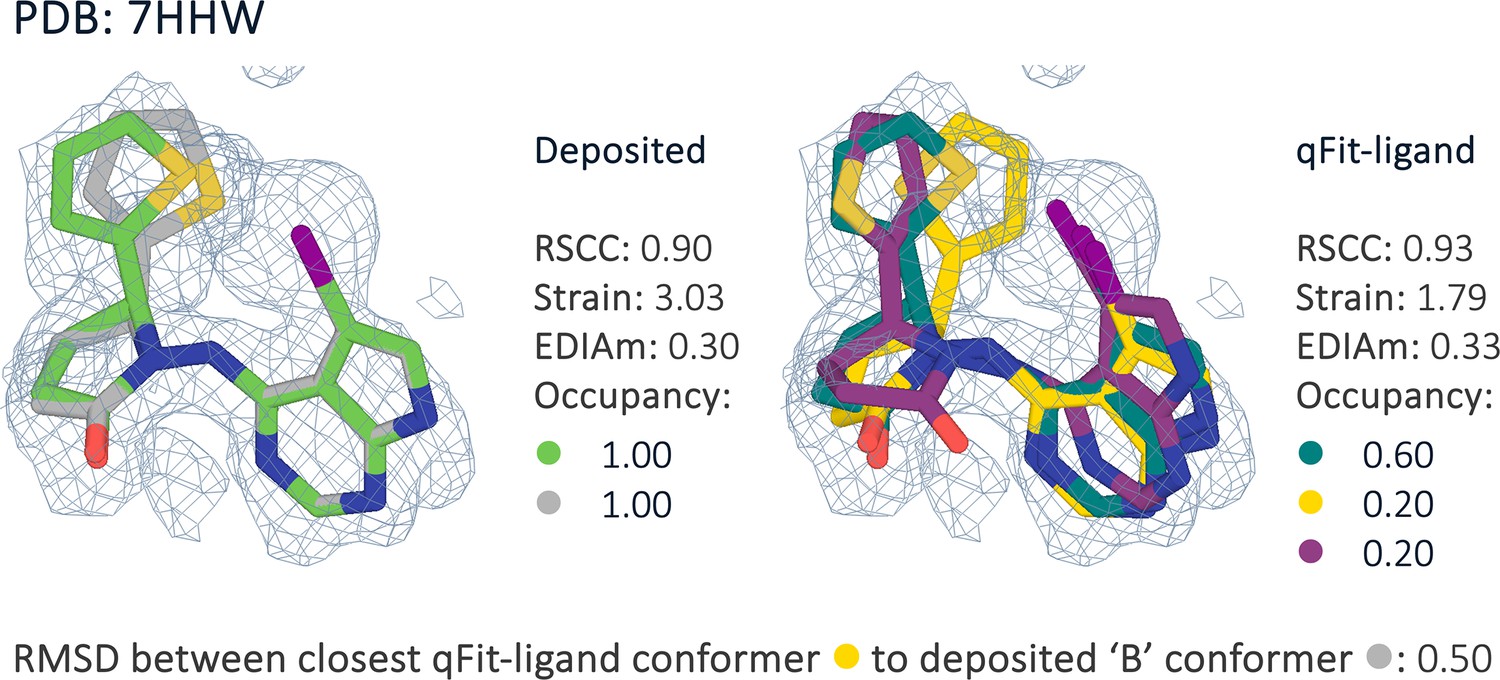
Comparison of deposited conformers ‘A’ (green), ‘B’ (gray), and qFit-ligand conformers for PDB 7HHW.
qFit-ligand generates a multiconformer model with a relatively high root mean square deviation (RMSD) (0.5 Å) to the deposited ‘B’ conformer. The closest qFit-ligand conformer (yellow) shares an extremely similar atomic space with the deposited ‘B’, differing primarily due to a flipped Thiophene, resulting in the high RMSD. Despite this, the qFit-ligand model has an improved fit to the electron density, indicating that multiple distinct conformations can accurately explain the experimental data.
Figure 8

Gallery of the four cryo-electron microscopy (cryo-EM) structures with deposited model, modified true positive, and qFit-ligand structure.
In each case, the qFit-ligand model outperforms the modified true positive model in all validation metrics. The EDM density map is contoured at 1σ for every structure.
Additional files
-
MDAR checklist
- https://cdn.elifesciences.org/articles/103797/elife-103797-mdarchecklist1-v1.pdf
-
Supplementary file 1
Test set PDBs and associated statistics.
- https://cdn.elifesciences.org/articles/103797/elife-103797-supp1-v1.xlsx
-
Supplementary file 2
High strain PDBs and associated statistics.
- https://cdn.elifesciences.org/articles/103797/elife-103797-supp2-v1.xlsx
-
Supplementary file 3
Macrocycle PDBs and associated statistics.
- https://cdn.elifesciences.org/articles/103797/elife-103797-supp3-v1.xlsx
-
Supplementary file 4
Removed Macrocycle PDBs.
- https://cdn.elifesciences.org/articles/103797/elife-103797-supp4-v1.xlsx
-
Supplementary file 5
Fragment PDBs and associated statistics.
- https://cdn.elifesciences.org/articles/103797/elife-103797-supp5-v1.xlsx
-
Supplementary file 6
X-ray data collection settings and statistics.
- https://cdn.elifesciences.org/articles/103797/elife-103797-supp6-v1.xlsx
-
Supplementary file 7
CryoEM PDBs.
- https://cdn.elifesciences.org/articles/103797/elife-103797-supp7-v1.xlsx
Download links
A two-part list of links to download the article, or parts of the article, in various formats.
Downloads (link to download the article as PDF)
Open citations (links to open the citations from this article in various online reference manager services)
Cite this article (links to download the citations from this article in formats compatible with various reference manager tools)
Expanding automated multiconformer ligand modeling to macrocycles and fragments
eLife 14:RP103797.
https://doi.org/10.7554/eLife.103797.3


