Flower/FLWR-1 regulates neuronal activity via the plasma membrane Ca2+ ATPase to promote recycling of synaptic vesicles
- Buchmann Institute for Molecular Life Sciences, Goethe-University, Germany
- Institute for Biophysical Chemistry, Department of Biochemistry, Chemistry, and Pharmacy, Goethe-University, Germany
- Institute of Cell Biology and Neuroscience, Goethe-University, Germany
Figures
Figure 1 with 3 supplements
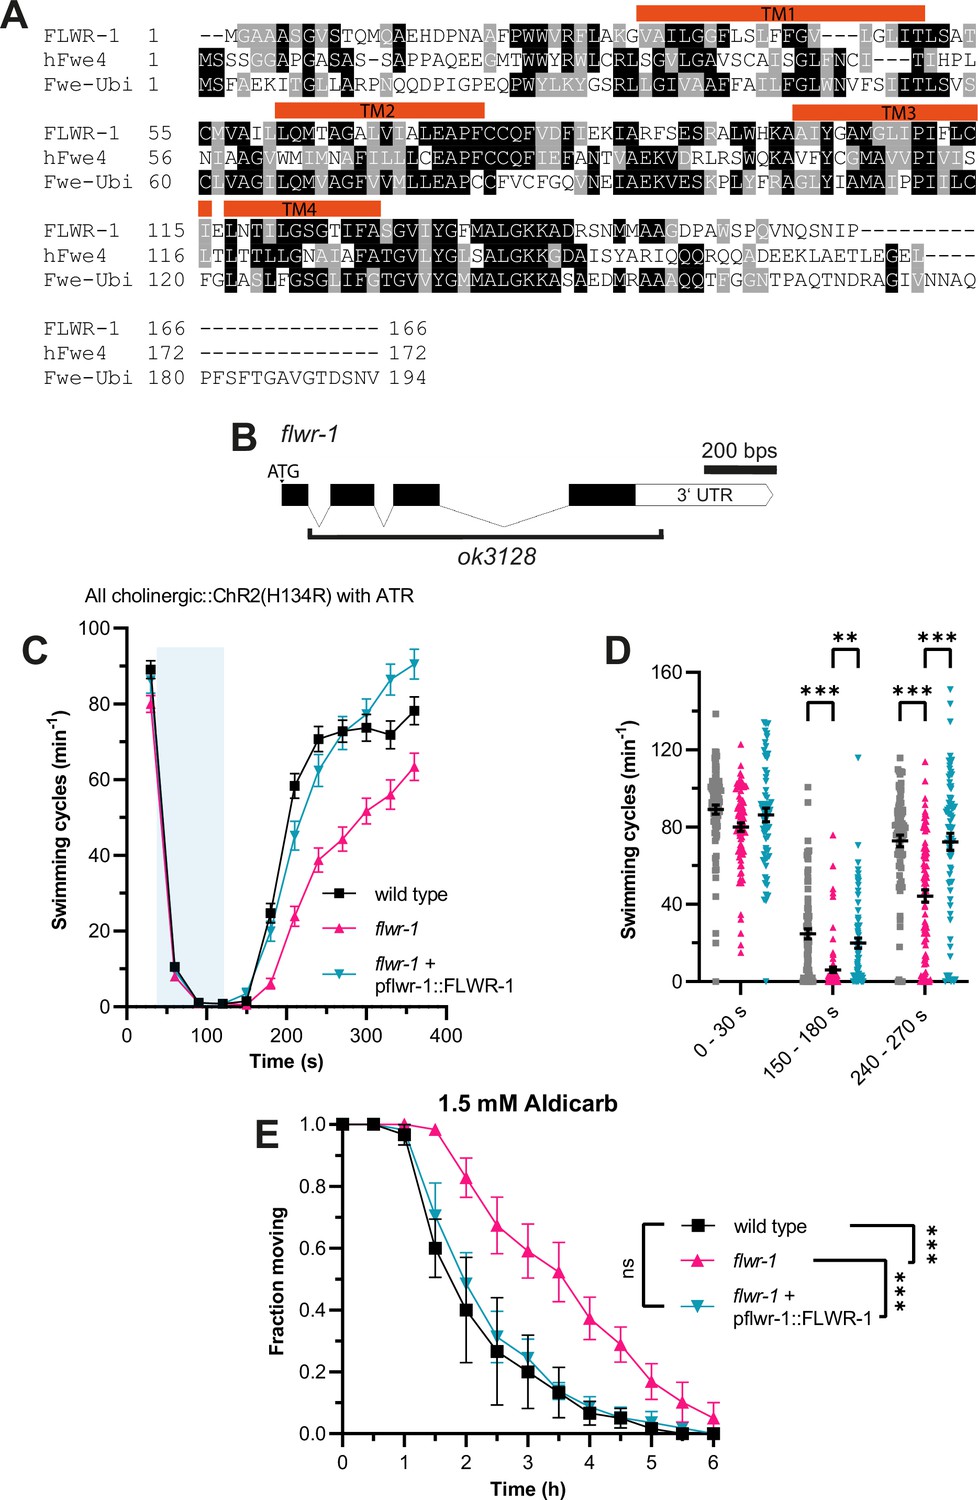
Loss of FLWR-1 induces defects in neurotransmission following intense stimulation.
(A) Alignment of the amino acid sequences of FLWR-1 to hFwe4 (H. sapiens) and Fwe-Ubi/FweA (D. melanogaster). Shading depicts evolutionary conservation of amino acid residues (identity – black; homology – gray). Position of TM helices indicated in red refers to the FLWR-1 sequence. (B) Schematic representation of the flwr-1/F20D1.1 gene locus and the size of the ok3128 deletion. Bars represent exons and connecting lines introns. (C) Mean (± SEM) swimming cycles of animals expressing ChR2(H134R) in cholinergic motor neurons (unc-17 promoter). All animals were treated with all-trans retinal (ATR). A 90 s light pulse (470 nm, 1 mW/mm2) was applied after 30 s as indicated by the blue shade. Number of animals accumulated from N=3 biological replicates: wild type = 80–88, flwr-1 = 80–91, FLWR-1 rescue = 62–75. (D) Statistical analysis of swimming speed at different time points as depicted in (C). Mean (± SEM). Each dot represents a single animal. Mixed-effects model analysis with Tukey’s correction. Only statistically significant differences are depicted. **p<0.01, ***p<0.001. (E) Mean (± SEM) fraction of moving animals after exposure to 1.5 mM aldicarb. N=4 biological replicates. Two-way ANOVA with Tukey’s correction. ns, not significant, p>0.05, ***p<0.001.
-
Figure 1—source data 1
Raw data for Figure 1C-E.
- https://cdn.elifesciences.org/articles/103870/elife-103870-fig1-data1-v1.xlsx
Figure 1—figure supplement 1
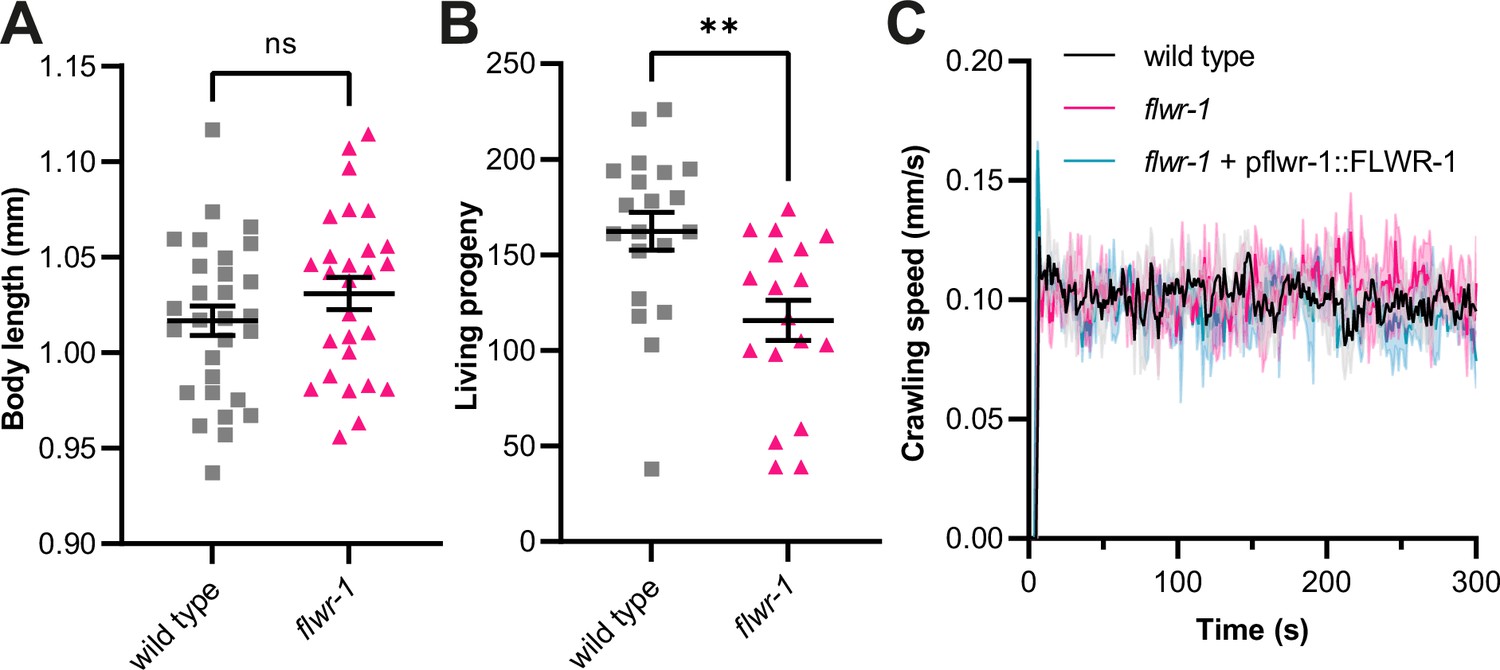
Loss of FLWR-1 does not change body length or locomotion speed but reduces the number of living progeny.
(A) Mean (± SEM) body length of wild type and flwr-1(ok3128) mutants in mm. Unpaired t-test. ns, not significant. Number of animals accumulated from N=4 biological replicates: wild type = 29, flwr-1=27. (B) Mean (± SEM) number of living progeny per animal. Unpaired t-test. **p<0.01. Number of animals accumulated from N=4 biological replicates: wild type = 20, flwr-1=18. (C) Mean (± SEM) crawling speed. N=2 biological replicates.
-
Figure 1—figure supplement 1—source data 1
Raw data for Figure 1—figure supplement 1A-C.
- https://cdn.elifesciences.org/articles/103870/elife-103870-fig1-figsupp1-data1-v1.xlsx
Figure 1—figure supplement 2
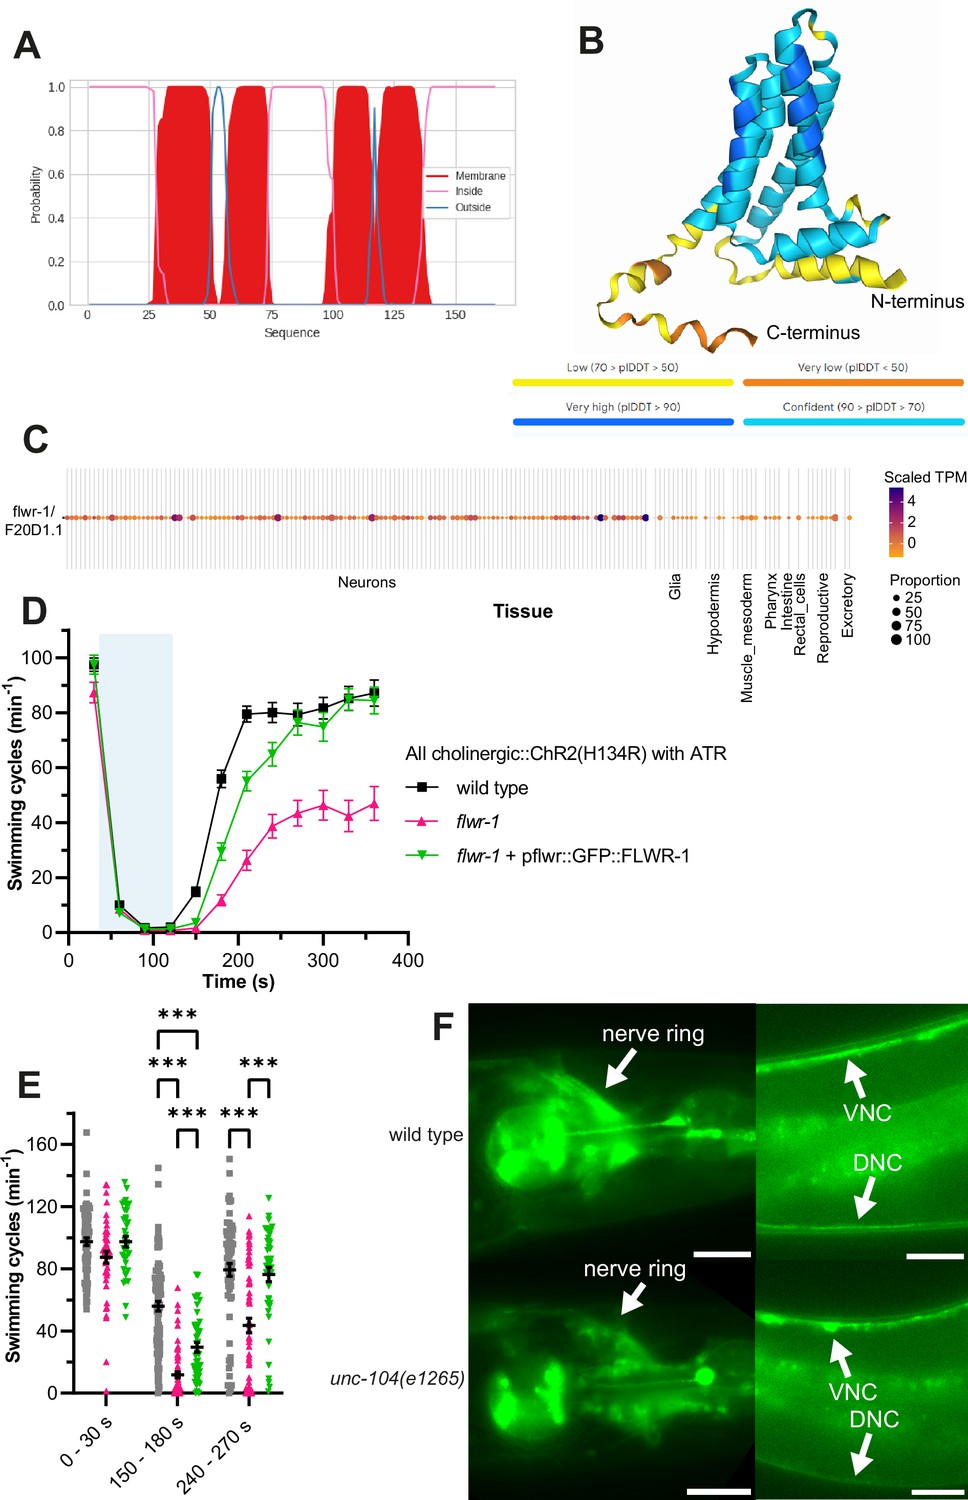
FLWR-1 is predicted to be a tetraspan transmembrane protein and is transported by UNC-104 kinesin.
(A) Graphical representation of the results of DeepTMHMM prediction of membrane orientation of the FLWR-1 protein based on its amino acid sequence. The red shapes indicate the presence of four transmembrane domains. (B) AlphaFold3 prediction of FLWR-1 protein structure. The coloring represents the calculated predicted local distance difference test (plDDT) as shown below the structure. Higher plDDT values indicate a higher confidence of correct prediction. (C) Heatmap plot depicting flwr-1(F20D1.1) single-cell RNAseq data generated by the CeNGEN database. Coloring indicates transcripts per million (TPM) per tissue normalized to the average expression as indicated in the legend. The size of the dots represents the percentage of cells of this cell type expressing the gene. (D) Mean (± SEM) swimming cycles of animals expressing ChR2(H134R) in cholinergic motor neurons (unc-17 promoter). All animals were treated with all-trans retinal (ATR). A 90 s light pulse (470 nm, 1 mW/mm2) was applied after 30 s as indicated by the blue shade. Number of animals accumulated from N=2 biological replicates: wild type = 63–99, flwr-1=48–66, GFP::FLWR-1 rescue = 37–52. (E) Statistical analysis of swimming speed at different time points as depicted in (D). Mean (± SEM). Each dot represents a single animal. Mixed-effects model analysis with Tukey’s correction. Only statistically significant differences are depicted. ***p<0.001. (F) Example images depicting GFP::FLWR-1 fluorescence in nerve ring and nerve cords in wild type and unc-104(e1265) mutants. Scale bar, 20 µm.
-
Figure 1—figure supplement 2—source data 1
Raw data for Figure 1—figure supplement 2D and E.
- https://cdn.elifesciences.org/articles/103870/elife-103870-fig1-figsupp2-data1-v1.xlsx
Figure 1—figure supplement 3
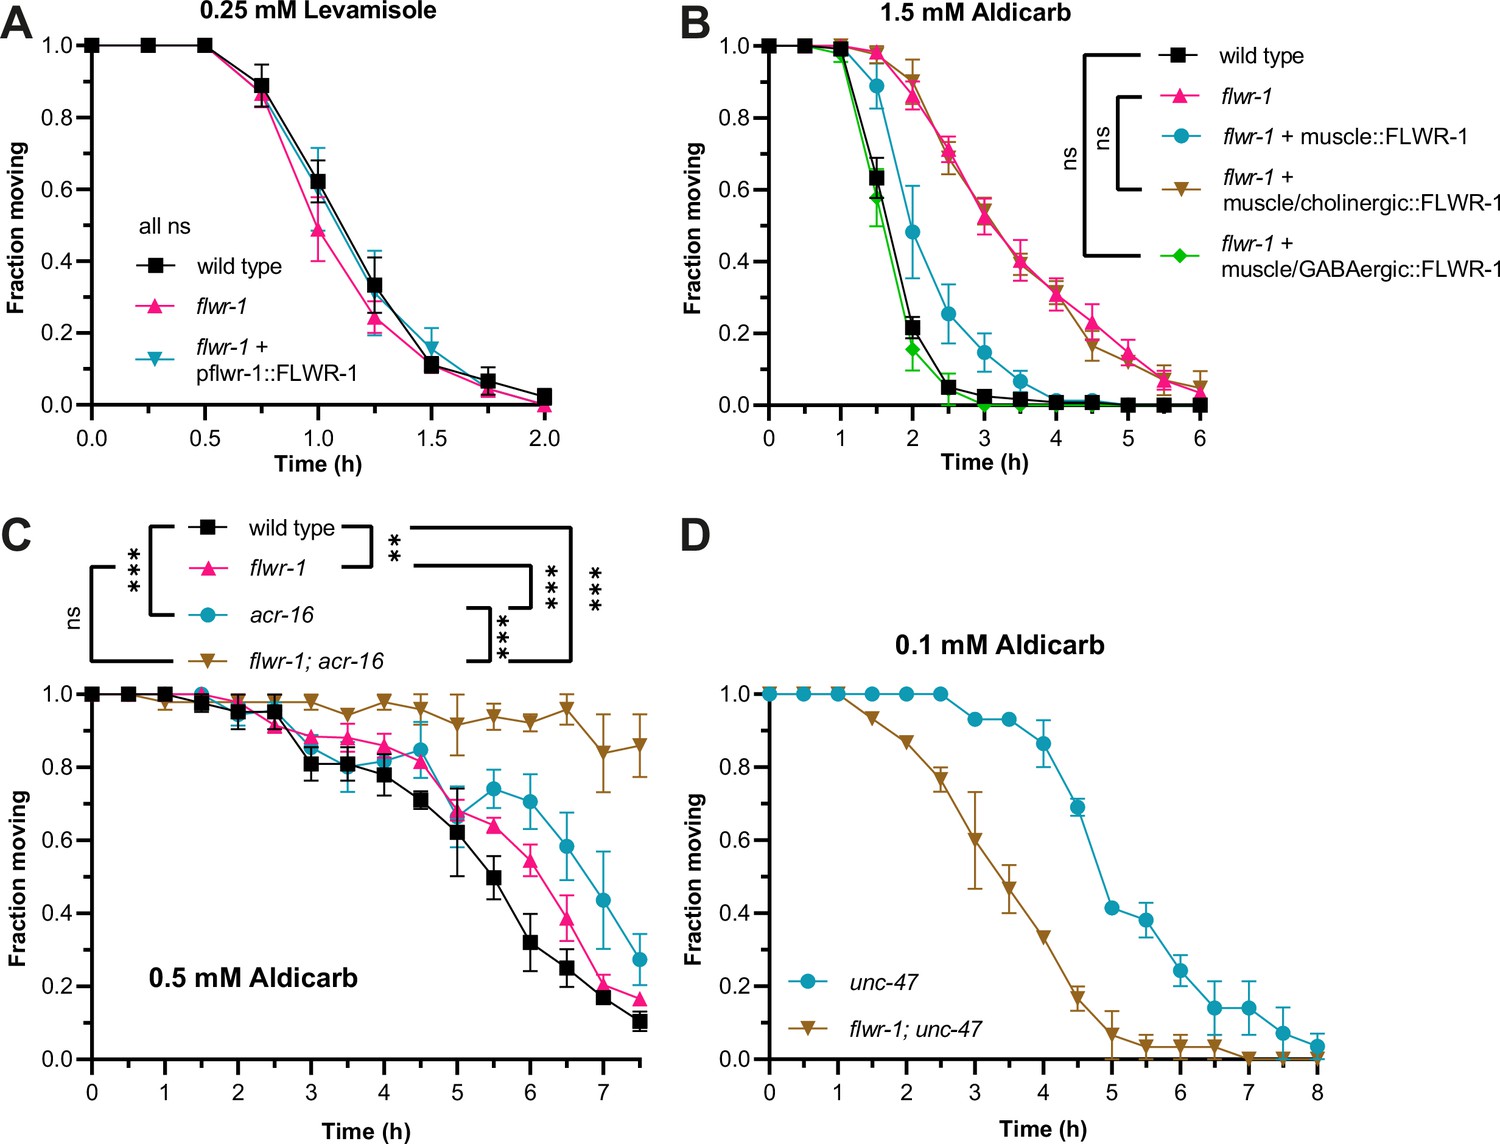
FLWR-1 expression in body wall muscle (BWM) cells partially rescues aldicarb resistance of flwr-1 mutants, but aldicarb resistance is not affected through ACh receptors (AChRs).
(A) Mean (± SEM) fraction of moving animals after exposure to 0.25 mM levamisole. N=3 biological replicates. Two-way ANOVAs with Tukey’s correction. No significant differences were found. (B) Mean (± SEM) fraction of moving animals after exposure to 1.5 mM aldicarb. FLWR-1 is optionally expressed in BWMs (pmyo-3) only or combined with expression in cholinergic (unc-17p) or GABAergic (unc-47p) neurons in a flwr-1(ok3128) mutant background. N=3–8 biological replicates. Two-way ANOVAs with Tukey’s correction. Only nonsignificant differences are depicted. For all other comparisons, p<0.001. (C) Mean (± SEM) fraction of moving animals after exposure to 0.5 mM aldicarb, compared in wild type, flwr-1(ok3128), acr-16(ok789), and flwr-1; acr-16 double mutants. N=3 biological replicates. Two-way ANOVAs with Tukey’s correction. (D) Loss of GABAergic transmission conveys aldicarb hypersensitivity in flwr-1 mutants. Mean (± SEM) fraction of moving animals after exposure to 0.1 mM aldicarb. N=3 biological replicates.
-
Figure 1—figure supplement 3—source data 1
Raw data for Figure 1—figure supplement 3A-D.
- https://cdn.elifesciences.org/articles/103870/elife-103870-fig1-figsupp3-data1-v1.xlsx
Figure 2
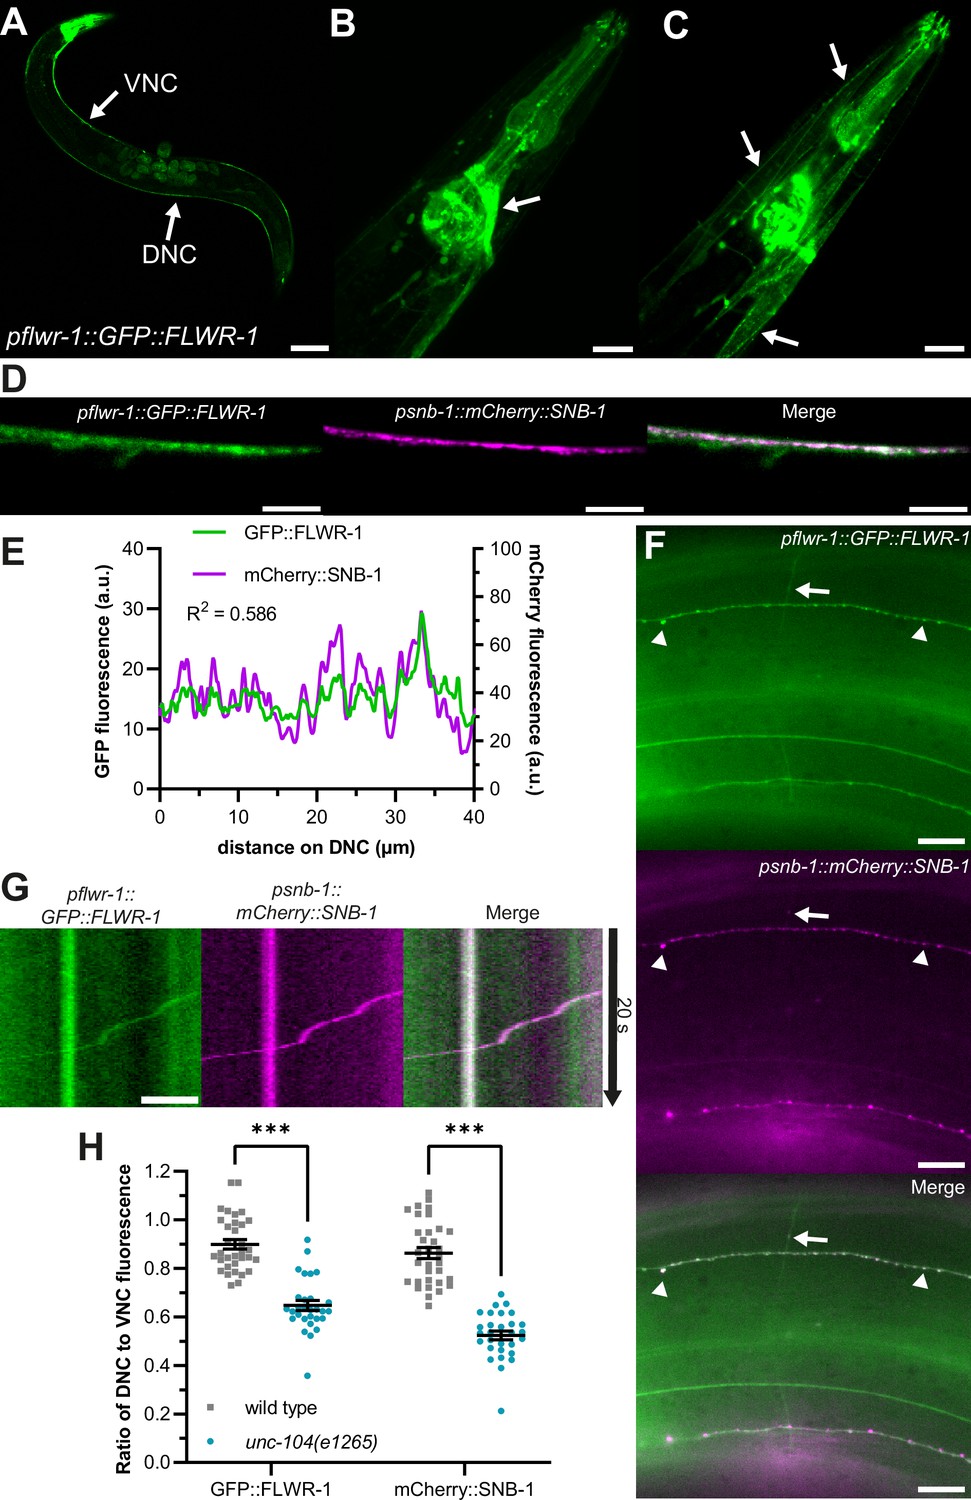
FLWR-1 is expressed in neurons and localizes to synaptic vesicles and the plasma membrane.
(A–D) Confocal micrographs (maximum projection of z-stacks or single plane) of animals co-expressing flwr-1p::GFP::FLWR-1 and psnb-1::mCherry::SNB-1. (A) Overview of GFP::FLWR-1 expression. Arrows indicate dorsal and ventral nerve cords (DNC and VNC, respectively). Scale bar, 100 µm. (B) GFP::FLWR-1 in head neurons and pharynx. Scale bar, 20 µm. (C) Animal depicted in (B), single plane showing neck muscle cells. Arrows indicate GFP::FLWR-1 localization to the plasma membrane. Scale bar, 20 µm. (D) GFP and mCherry fluorescence in the DNC. Scale bar, 10 µm. (E) Line scan analysis of colocalization of GFP::FLWR-1 and mCherry::SNB-1 along the DNC as represented in (D). R2 as determined by Pearson correlation. a.u.=arbitrary units of fluorescence intensity. (F) Micrograph depicting GFP::FLWR-1 and mCherry::SNB-1 fluorescence in sublateral nerve cords and commissures. Arrowheads indicate synaptic puncta. Arrow points toward synaptic vesicle (SV) precursor traveling along commissure as shown in Video 1. Scale bar, 10 µm. (G) Kymograph representing the SV precursor indicated in (F) traveling along commissures. Scale bar, 2 µm. (H) Comparison of the ratio of DNC to VNC fluorescence of GFP::FLWR-1 and mCherry::SNB-1 in wild type and unc-104(e1265) mutant background. Mean (± SEM). Each dot represents a single animal. Two-way ANOVA with Šídák’s correction. ***p<0.001. Number of animals imaged in N=3 biological replicates: wild type = 33, unc-104 = 29.
-
Figure 2—source data 1
Raw data for Figure 2.
- https://cdn.elifesciences.org/articles/103870/elife-103870-fig2-data1-v1.xlsx
Figure 3 with 1 supplement
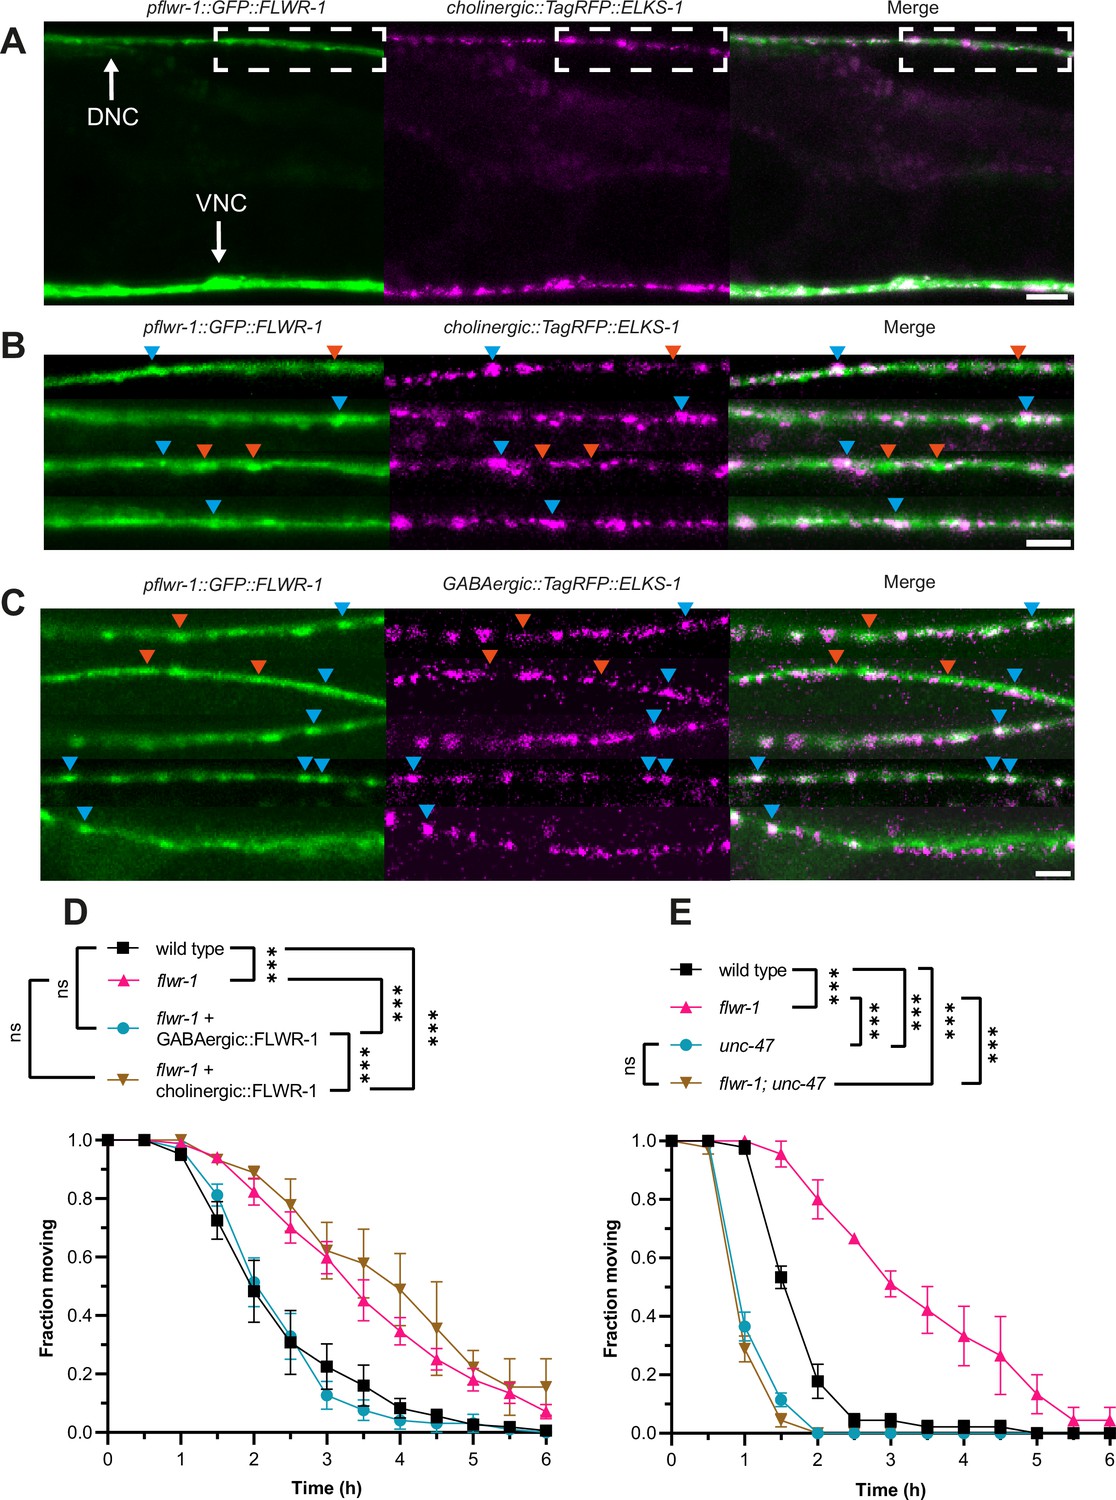
GABAergic signaling is increased in flwr-1 knockout mutants.
(A) Representative confocal micrographs of an animal co-expressing flwr-1p::GFP::FLWR-1 and TagRFP::ELKS-1 in cholinergic motor neurons (unc-17(short) promoter). The region in the dorsal nerve cord (DNC) used to acquire images shown in (B) and (C) is indicated; this position is posterior to the vulva, anterior is left. Scale bar, 10 µm. (B, C) DNCs in animals co-expressing flwr-1p::GFP::FLWR-1 and TagRFP::ELKS-1 in cholinergic motor neurons (unc-17(short) promoter) or in GABAergic neurons (unc-47 promoter; C), respectively. Scale bar, 5 µm. Examples of fluorescent puncta which contain either both FLWR-1 and ELKS-1 (blue arrowheads), or FLWR-1 only (red arrowheads) are indicated. The same puncta are indicated in the respective analysis of signal density along the DNC in Figure 3—figure supplement 1A and B. (D) Mean (± SEM) fraction of moving animals after exposure to 1.5 mM aldicarb with cholinergic (unc-17p) and GABAergic (unc-47p) expression of FLWR-1 in flwr-1(ok3128) mutant background. N=3–8 biological replicates. (E) Mean (± SEM) fraction of moving animals after exposure to 1.5 mM aldicarb with unc-47(e307) and unc-47(e307); flwr-1(ok3128) double mutants. N=3 biological replicates. Two-way ANOVA with Tukey’s correction in D, E. ns, not significant, ***p<0.001.
-
Figure 3—source data 1
Raw data for Figure 3D and E.
- https://cdn.elifesciences.org/articles/103870/elife-103870-fig3-data1-v1.xlsx
Figure 3—figure supplement 1

FLWR-1 localizes to cholinergic and GABAergic active zones.
(A) Line scan analysis of colocalization of GFP::FLWR-1 and TagRFP::ELKS-1 along the dorsal nerve cord (DNC) as represented in the same order in Figure 3B. R2 as determined by Pearson correlation. a.u.=arbitrary units of fluorescence intensity. (B) Line scan analysis of colocalization of GFP::FLWR-1 and TagRFP::ELKS-1 along the DNC as represented in the micrographs in the same order in Figure 3C. R2 as determined by Pearson correlation. a.u.=arbitrary units of fluorescence intensity. (A+B) Examples for fluorescent puncta which contain either both FLWR-1 and ELKS-1 (blue arrowheads), or only FLWR-1 (red arrowheads) are indicated. The same puncta are indicated in the respective micrographs in Figure 3B+C. (C) Comparison of Pearson correlation coefficients of line scans along DNCs represented in Figure 3. Mean (± SEM). Unpaired t-test.
-
Figure 3—figure supplement 1—source data 1
Raw data for Figure 3—figure supplement 1A-C.
- https://cdn.elifesciences.org/articles/103870/elife-103870-fig3-figsupp1-data1-v1.xlsx
Figure 4 with 1 supplement
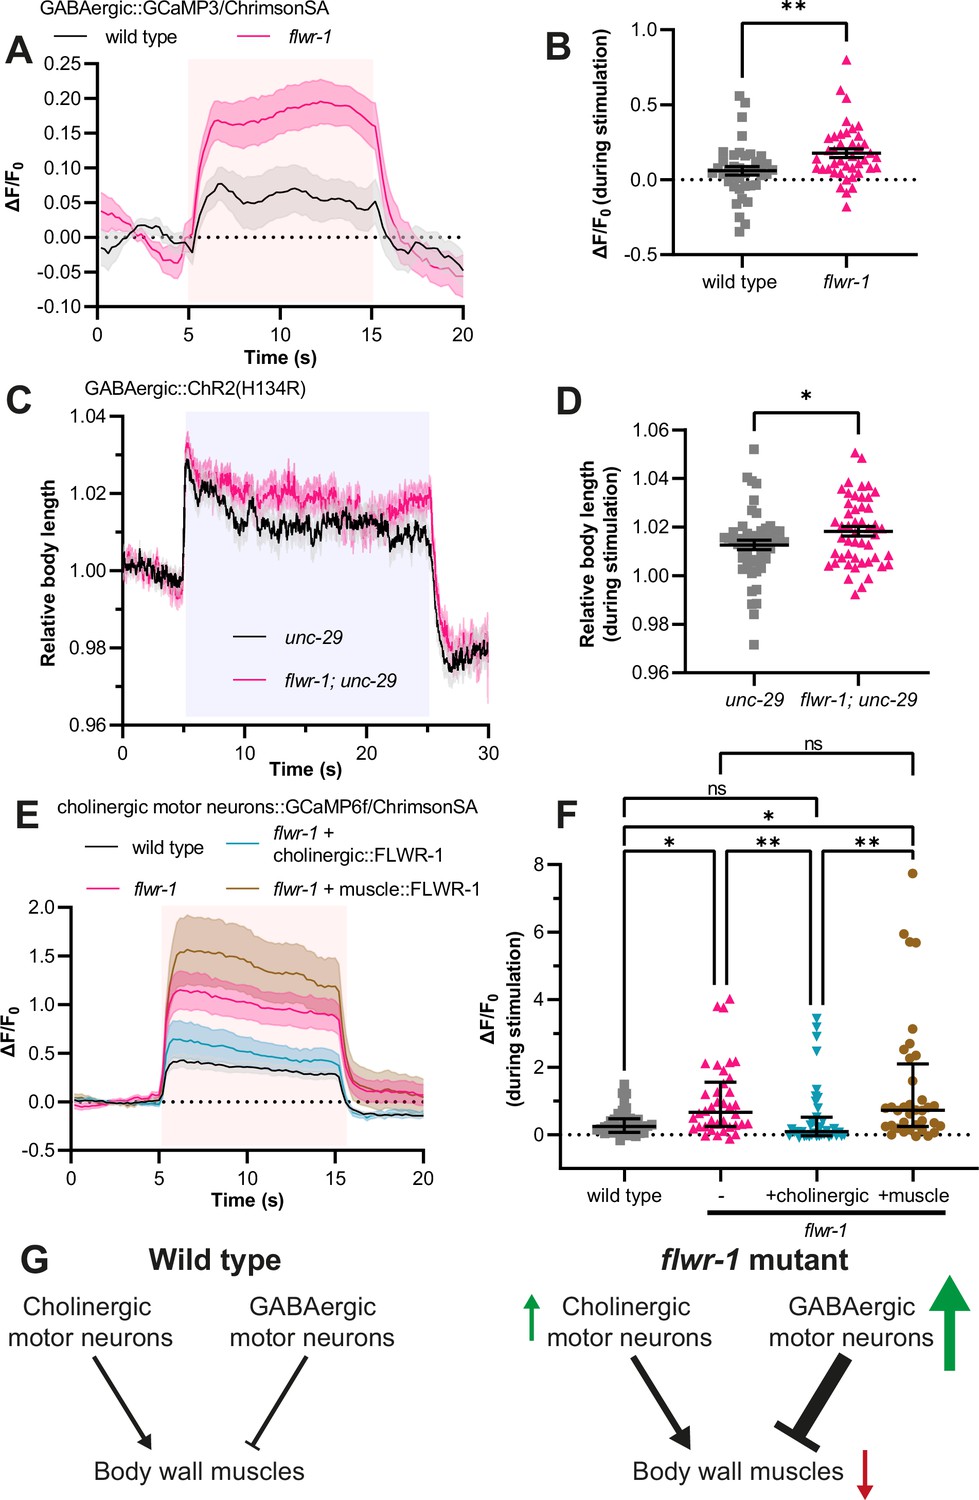
Loss of FLWR-1 leads to increased Ca2+ levels during stimulation.
(A) Mean (± SEM) normalized fluorescence in synaptic puncta of the dorsal nerve cord (DNC) of animals expressing GCaMP3 and ChrimsonSA in GABAergic neurons (unc-25 promoter). All animals were supplemented with all-trans retinal (ATR). A 10 s light pulse (590 nm, 40 µW/mm2) was applied after 5 s as indicated by the red shade. (B) Mean (± SEM) normalized fluorescence during stimulation (seconds 6–14) as depicted in (A). Each dot indicates a single animal. Unpaired t-test. **p<0.01. (A+B) Number of animals imaged in N=5 biological replicates: wild type = 40, flwr-1 = 41. Outliers were removed from both datasets as detected by the iterative Grubb’s method (GraphPad Prism). (C) Mean (± SEM) body length of animals expressing ChR2(H134R) in GABAergic neurons (unc-47 promoter) in the unc-29(e1072) mutant background, normalized to the average before stimulation. All animals were supplemented with ATR. A 20 s light pulse (470 nm, 100 µW/mm2) was applied after 5 s as indicated by the blue shade. (D) Mean (± SEM) relative body length during stimulation (seconds 6–24) as depicted in (C). Each dot indicates a single animal. Unpaired t-test. *p<0.05. Number of animals measured in N = 4 biological replicates: wild type = 51, flwr-1 = 49. (E) Mean (± SEM) normalized fluorescence in synaptic puncta of the DNC of animals expressing GCaMP6f and ChrimsonSA in cholinergic motor neurons (unc-17b promoter). All animals were supplemented with ATR. A 10 s light pulse (590 nm, 40 µW/mm2) was applied after 5 s as indicated by the red shade. (F) Median (with interquartile range [IQR]) normalized fluorescence during stimulation (seconds 6–14) as depicted in (E). Each dot indicates a single animal. Kruskal-Wallis test. Only statistically significant differences are depicted. *p<0.05, **p<0.01. (E+F) Number of animals imaged in N = 5 biological replicates: wild type = 40, flwr-1 = 38, cholinergic rescue = 39, muscle rescue = 36. No outliers were detected by the iterative Grubb’s method. (G) Schematic representation of motor neuron innervation of body wall muscles (BWMs). Arrows indicate the putatively increased (green) or decreased (red) neurotransmission/excitation of the involved cell types in flwr-1 mutants compared to wild type.
-
Figure 4—source data 1
Raw data for Figure 4A-F.
- https://cdn.elifesciences.org/articles/103870/elife-103870-fig4-data1-v1.xlsx
Figure 4—figure supplement 1
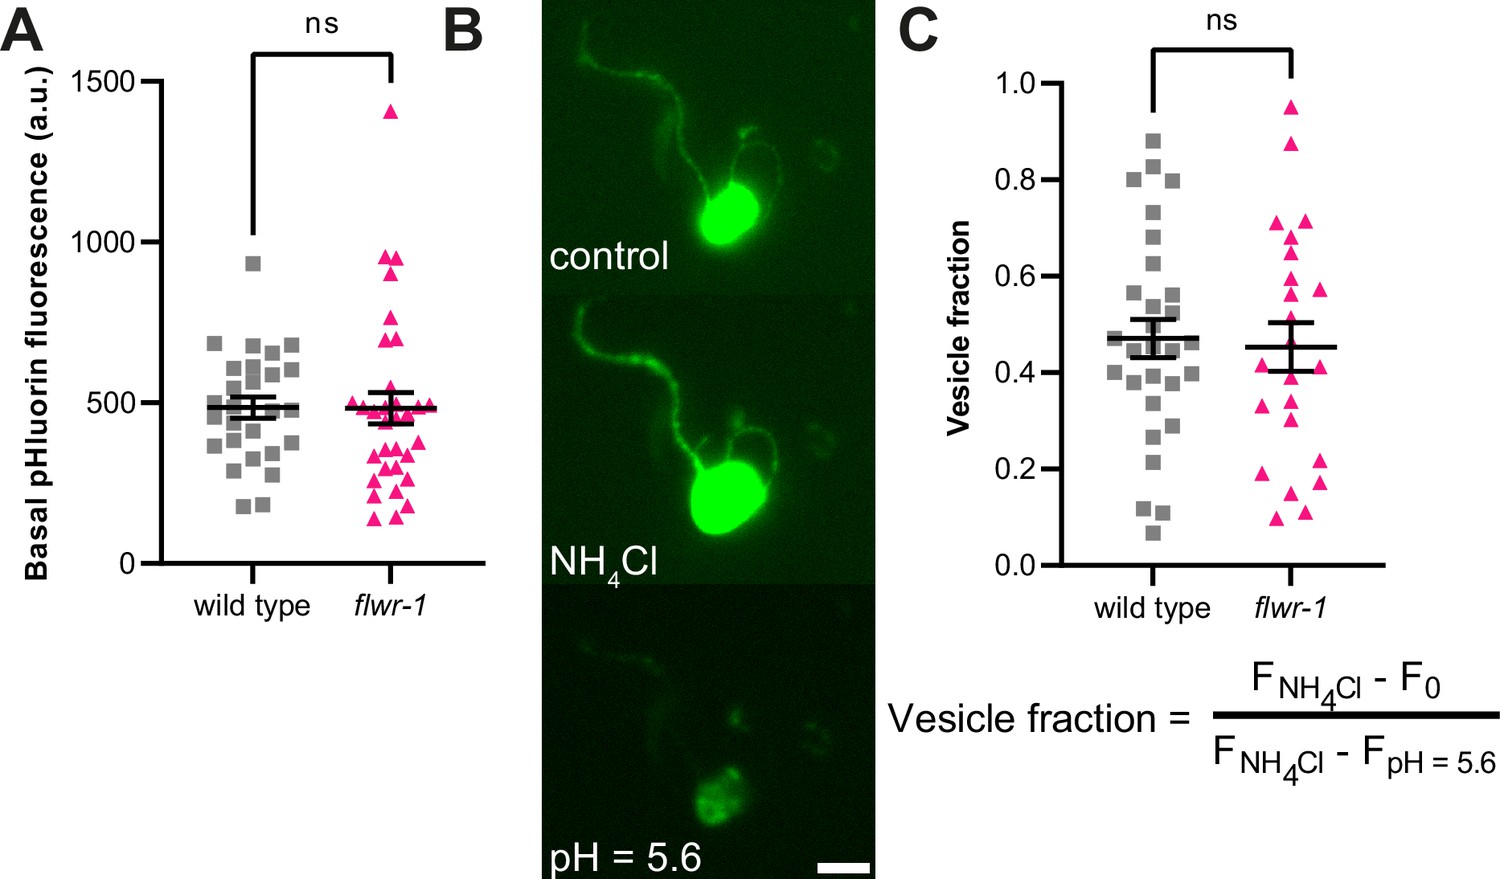
Basal SNG-1::pHluorin fluorescence and cell surface fraction are unchanged in flwr-1 mutants.
(A) Mean (± SEM) pHluorin fluorescence before stimulation as depicted in Figure 5. Number of animals imaged in N=5 biological replicates: wild type = 27, flwr-1=32. Unpaired t-test. ns, not significant p>0.05. (B) Representative images of a primary neuronal cell expressing SNG-1::pHluorin when exposed to different buffers as indicated. Scale bar, 5 µm. (C) Number of cells imaged in N=2 biological replicates: wild type = 29, flwr-1=23. Unpaired t-test. ns, not significant p>0.05.
-
Figure 4—figure supplement 1—source data 1
Raw data for Figure 4—figure supplement 1A and C.
- https://cdn.elifesciences.org/articles/103870/elife-103870-fig4-figsupp1-data1-v1.xlsx
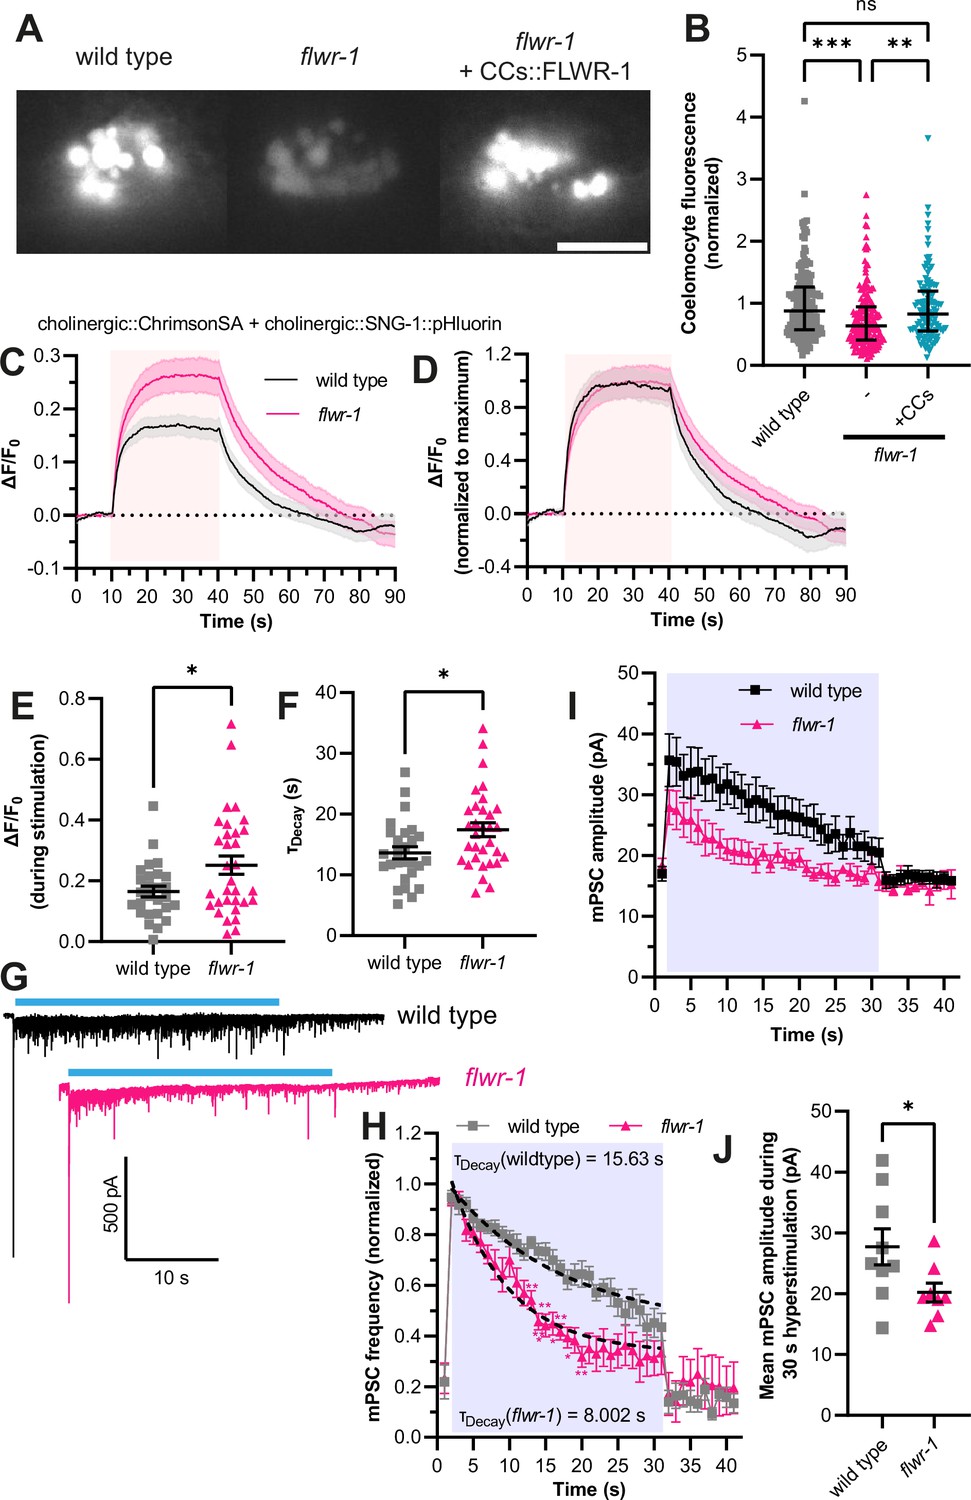
Figure 5 with 1 supplement
FLWR-1 facilitates endocytosis in non-neuronal and neuronal cells.
(A) Exemplary images of the coelomocytes (CCs) in wild type, flwr-1(ok3128) and in flwr-1 mutants expressing FLWR-1 in CCs (unc-122 promoter). GFP containing a secretion signal sequence (ssGFP) was expressed in body wall muscles (BWMs) (myo-3 promoter). Scale bar, 10 µm. (B) Median (with interquartile range [IQR]) normalized fluorescence of CCs. Each dot indicates a single CC. Kruskal-Wallis test. **p<0.01, ***p<0.001. Number of CCs imaged in N = 3 biological replicates: wild type = 158, flwr-1 = 185, rescue = 113. (C) Mean (± SEM) normalized dorsal nerve cord (DNC) fluorescence of animals expressing SNG-1::pHluorin and ChrimsonSA in cholinergic neurons (unc-17 promoter). All animals were supplemented with all-trans retinal (ATR). A 30 s light pulse (590 nm, 40 µW/mm2) was applied after 10 s as indicated by the red shade. (D) Mean (± SEM) pHluorin fluorescence as depicted in (C) but additionally normalized to the maximum value of each dataset. (E) Mean (± SEM) normalized fluorescence during stimulation (seconds 15–35) as depicted in (C). Each dot indicates a single animal. Unpaired t-test. (F) Mean (± SEM) calculated exponential decay constants of fluorescence decline after stimulation. Each dot indicates a single animal. Unpaired t-test. (C–F) Number of animals imaged in N=5 biological replicates: wild type = 27, flwr-1 = 32. *p<0.05. (G) Representative voltage-clamp recordings of currents in BWMs. Animals expressing ChR2(H134R) in cholinergic motor neurons (unc-17 promoter, transgene zxIs6) were treated with ATR. A 30 s light stimulus (470 nm, 8 mW/mm2) was applied as indicated by blue bars. (H) Normalized miniature postsynaptic current (mPSC) frequency in BWMs. All animals were treated with ATR. A 30 s light pulse (470 nm, 8 mW/mm2) was applied as indicated by the blue shade. Dashed lines indicate one-phase exponential regression analysis fitted to the mean mPSC frequencies during stimulation. Calculated time constants of decay are shown. Two-way ANOVA with Šidák’s correction. All significant differences to wild type are depicted. (I) mPSC amplitude in BWMs of animals measured in (G+H). (J) Mean (± SEM) mPSC amplitude during light stimulation as indicated in (I). Unpaired t-test. *p<0.05. (G–J) Number of animals: wild type = 9, flwr-1 = 8.
-
Figure 5—source data 1
Raw data for Figure 5B-J.
- https://cdn.elifesciences.org/articles/103870/elife-103870-fig5-data1-v1.xlsx
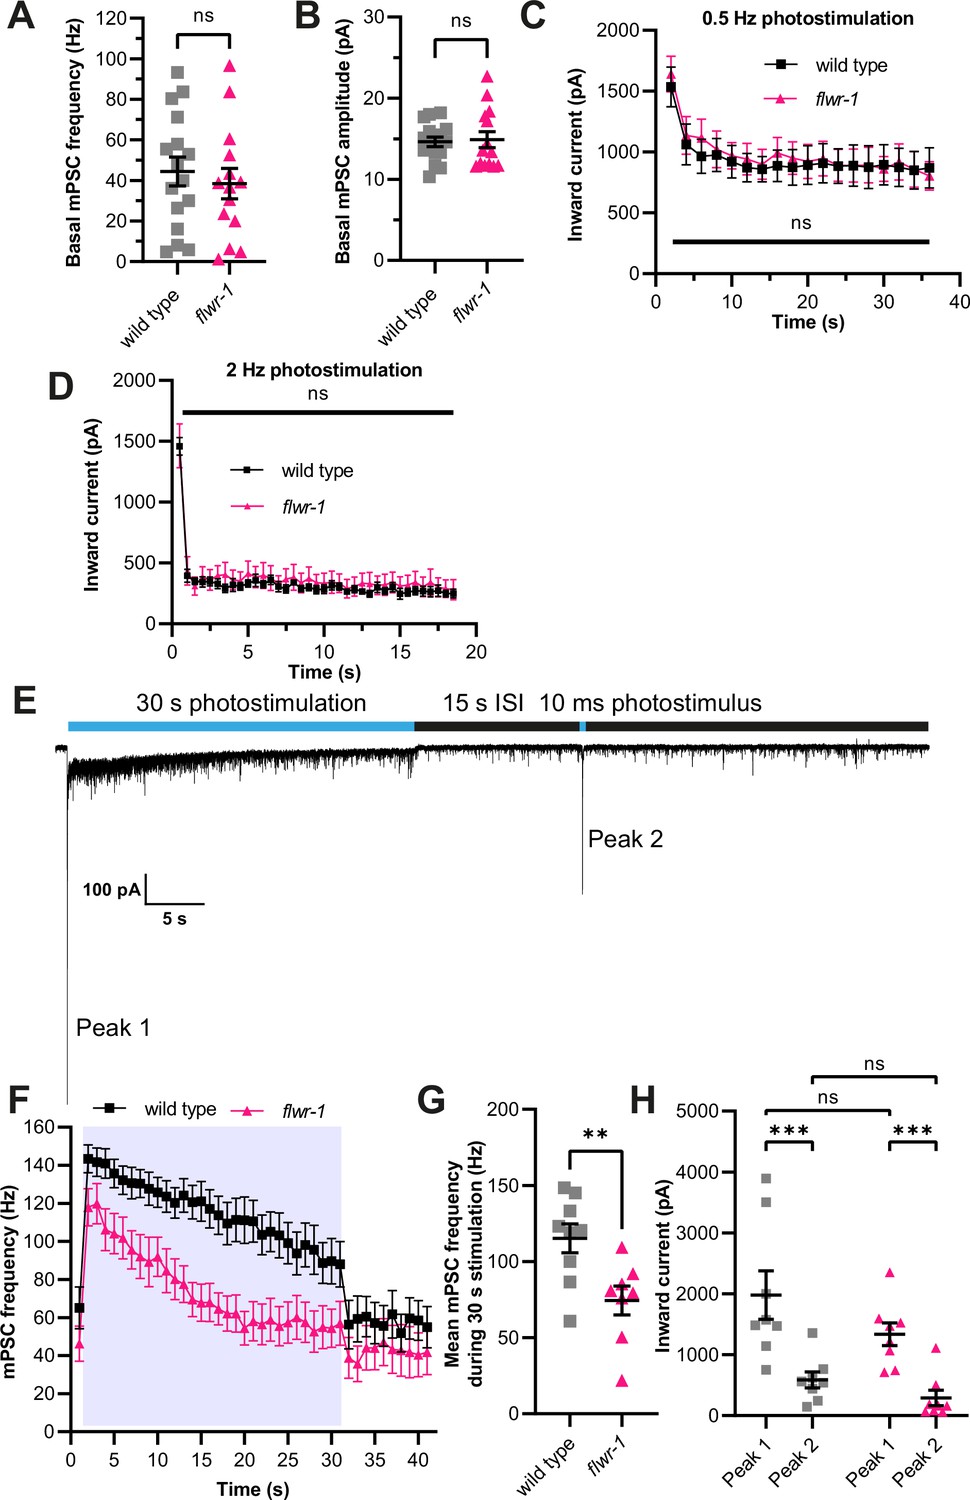
Figure 5—figure supplement 1
flwr-1 mutants show defective cholinergic neurotransmission only during continuous stimulation.
(A, B) Mean (± SEM) miniature postsynaptic current (mPSC) frequency and amplitude, respectively, before stimulation. Unpaired t-test. ns, not significant. Number of animals: wild type = 16, flwr-1=14. (C) Mean (± SEM) inward currents of body wall muscles (BWMs) recordings induced by 10 ms light pulses (470 nm, 8 mW/mm2) applied every 2 s (0.5 Hz). Two-way ANOVA with Šidák’s correction for multiple comparisons. ns, not significant. Number of animals: wild type = 9, flwr-1=8. (D) As in (C), but 2 Hz stimulation. ns, not significant. Number of animals: wild type = 7, flwr-1=7. (E) Representative voltage-clamp recording of currents detected in BWMs. This wild type animal expresses ChR2(H134R) in cholinergic motor neurons (unc-17 promoter) and has been treated with all-trans retinal (ATR). A 30 s light stimulus (470 nm, 8 mW/mm2) as well as a 10 ms pulse after a 15 s interstimulus interval (ISI) was applied as indicated by blue bars. (F) Mean (± SEM) mPSC frequency in BWMs of animals expressing ChR2(H134R) in cholinergic motor neurons (unc-17 promoter). All animals have been treated with ATR. A 30 s light pulse (470 nm, 8 mW/mm2) was applied as indicated by blue shade. (G) Mean (± SEM) mPSC frequency during 30 s stimulation. Unpaired t-test. **p<0.01. (H) Analysis of the amplitude of the first peak during 30 s photostimulation and the second peak after 15 s ISI as indicated in (E). Two-way ANOVA with Tukey’s correction for multiple comparisons. ns, not significant, ***p<0.001. (F–H) Number of animals: wild type = 9, flwr-1=8.
-
Figure 5—figure supplement 1—source data 1
Raw data for Figure 5—figure supplement 1A-D, G, H.
- https://cdn.elifesciences.org/articles/103870/elife-103870-fig5-figsupp1-data1-v1.xlsx
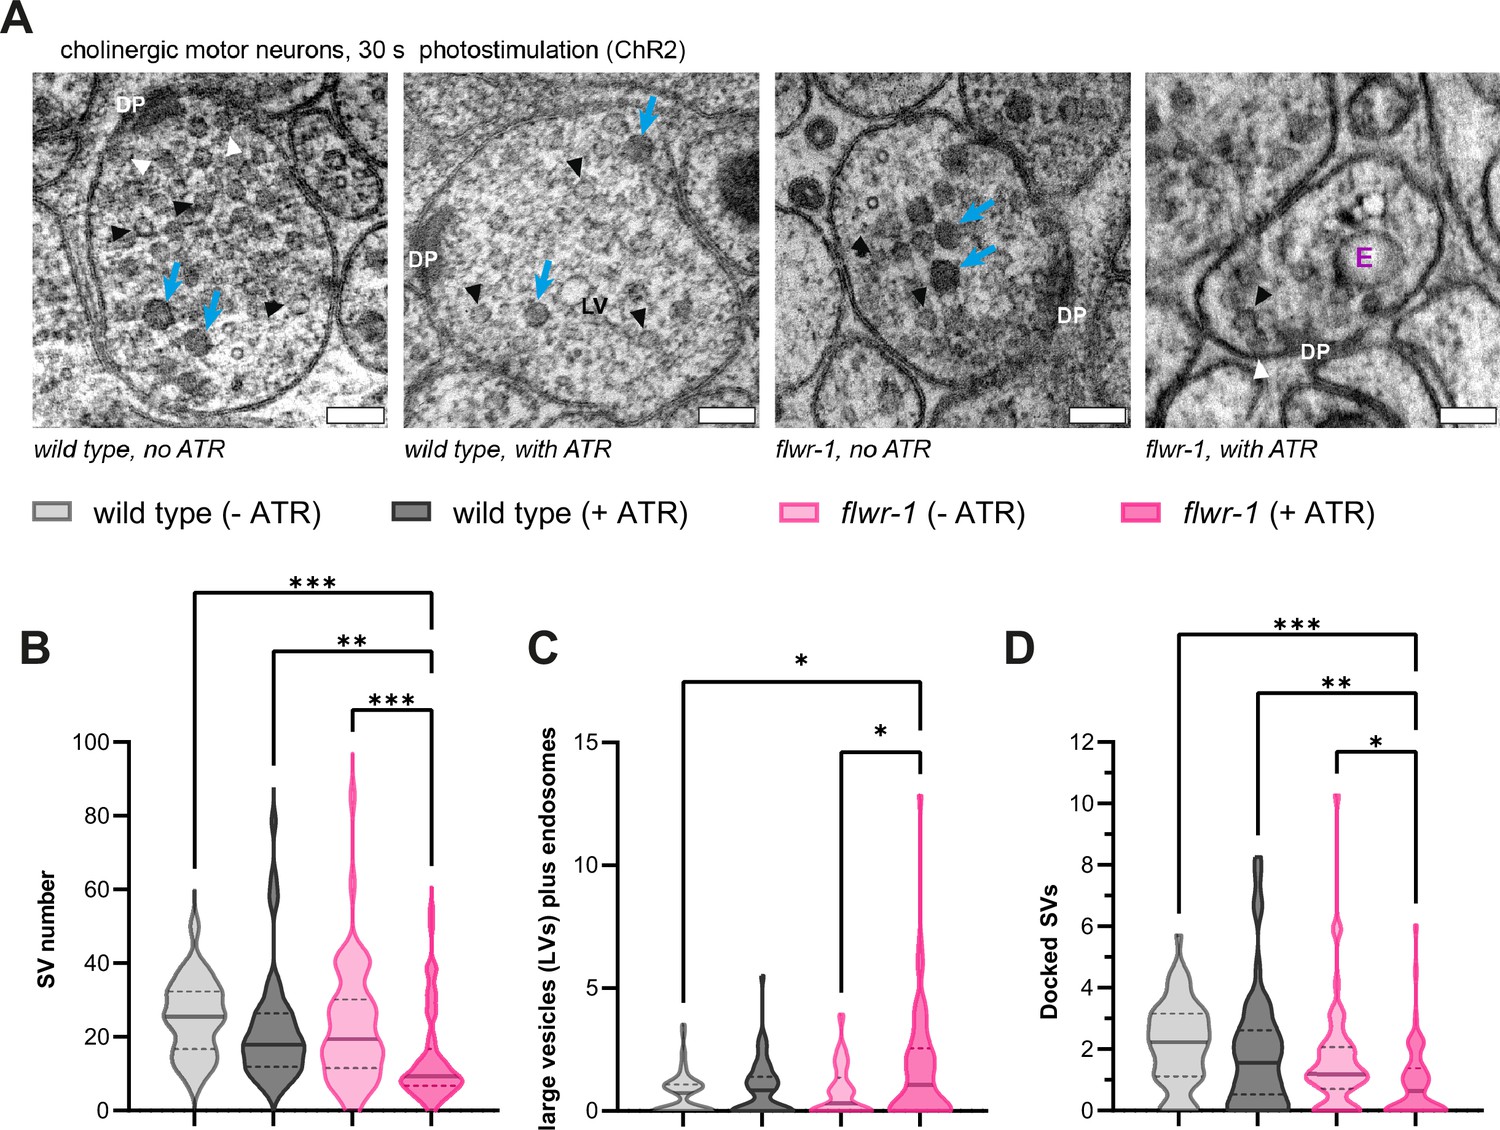
Figure 6 with 1 supplement
Ultrastructural analysis reveals defective recycling of synaptic vesicles (SVs) after stimulation in flwr-1 mutants.
(A) Representative transmission electron microscopy (TEM) micrographs of cholinergic en-passant synapses in wild type and flwr-1(ok3128) animals expressing ChR2(H134R) in cholinergic neurons (unc-17 promoter). Animals were optionally treated with all-trans retinal (ATR) as indicated. Dense projections (DP), endosomes (abbreviated as E), dense core vesicles (blue arrows), SVs (black arrowheads), docked vesicles (white arrowheads), and large vesicles (LVs) are indicated. Scale bars, 100 nm. (B) Violin plot depicting the number of SVs counted per synaptic profile. (C) Violin plot depicting the number of large endocytic vesicles and ‘endosomes’ per synapse. (D) Violin plot depicting the number of docked vesicles observed per synaptic profile. (B–D) Bold line represents the median, and the dashed lines the interquartile range (IQR). Kruskal-Wallis test. Only statistically significant differences are depicted. *p<0.05, **p<0.01, ***p<0.001. Number of synaptic profiles imaged: wild type (-ATR) = 56, wild type (-ATR) = 51, flwr-1 (-ATR) = 55, flwr-1 (+ATR) = 59.
-
Figure 6—source data 1
Raw data for Figure 6B-D.
- https://cdn.elifesciences.org/articles/103870/elife-103870-fig6-data1-v1.xlsx
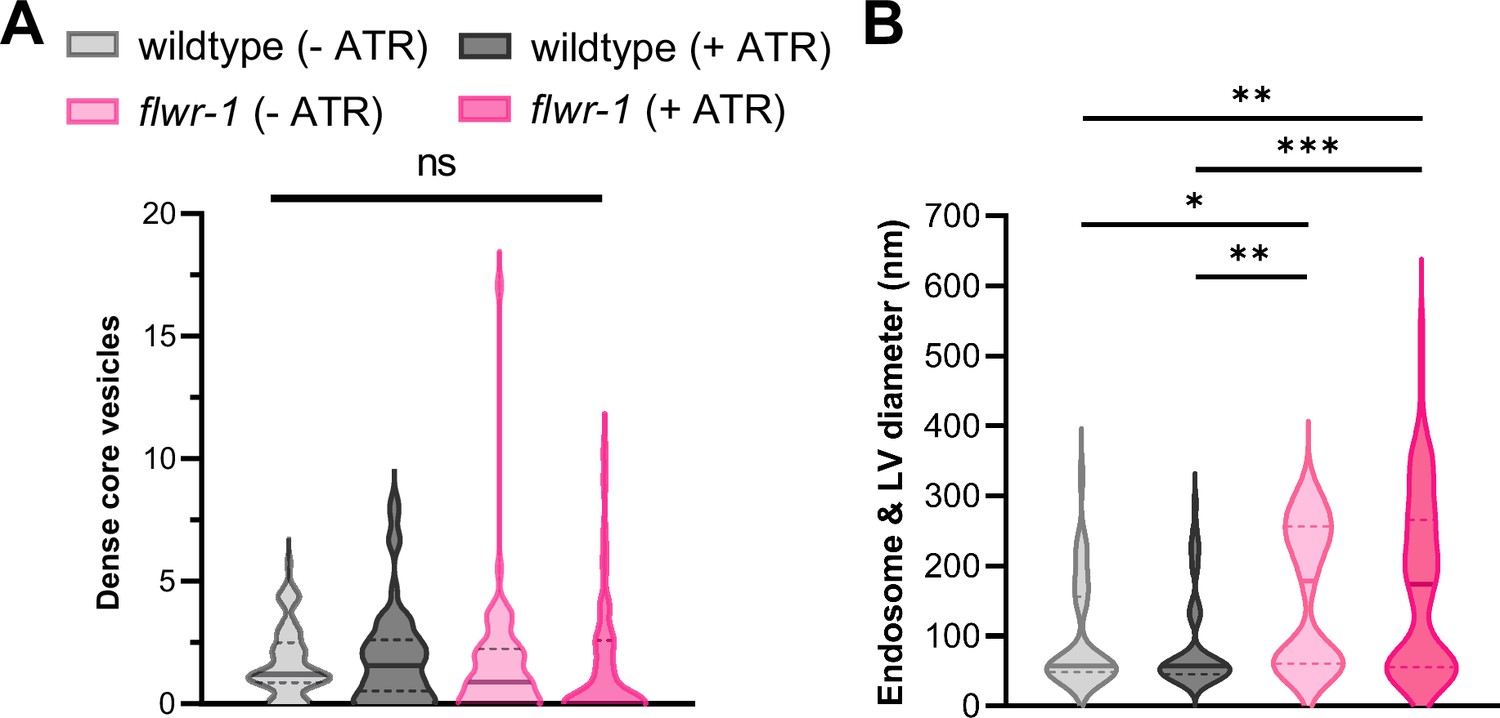
Figure 6—figure supplement 1
flwr-1 mutants have a normal number of dense core vesicles before and after stimulation, but increased size endosomes and large vesicles (LVs).
(A) Violin plot depicting the number of dense core vesicles counted per synaptic profile. (B) Diameters of endosomes and LVs combined. Bold line represents the median, and the dashed lines the interquartile range (IQR). Kruskal-Wallis test. ns, not significant. Number of synaptic profiles imaged: wild type (-ATR)=56, wild type (-ATR)=51, flwr-1 (-ATR)=55, flwr-1 (+ATR)=59.
-
Figure 6—figure supplement 1—source data 1
Raw data for Figure 6—figure supplement 1.
- https://cdn.elifesciences.org/articles/103870/elife-103870-fig6-figsupp1-data1-v1.xlsx
Figure 7 with 1 supplement
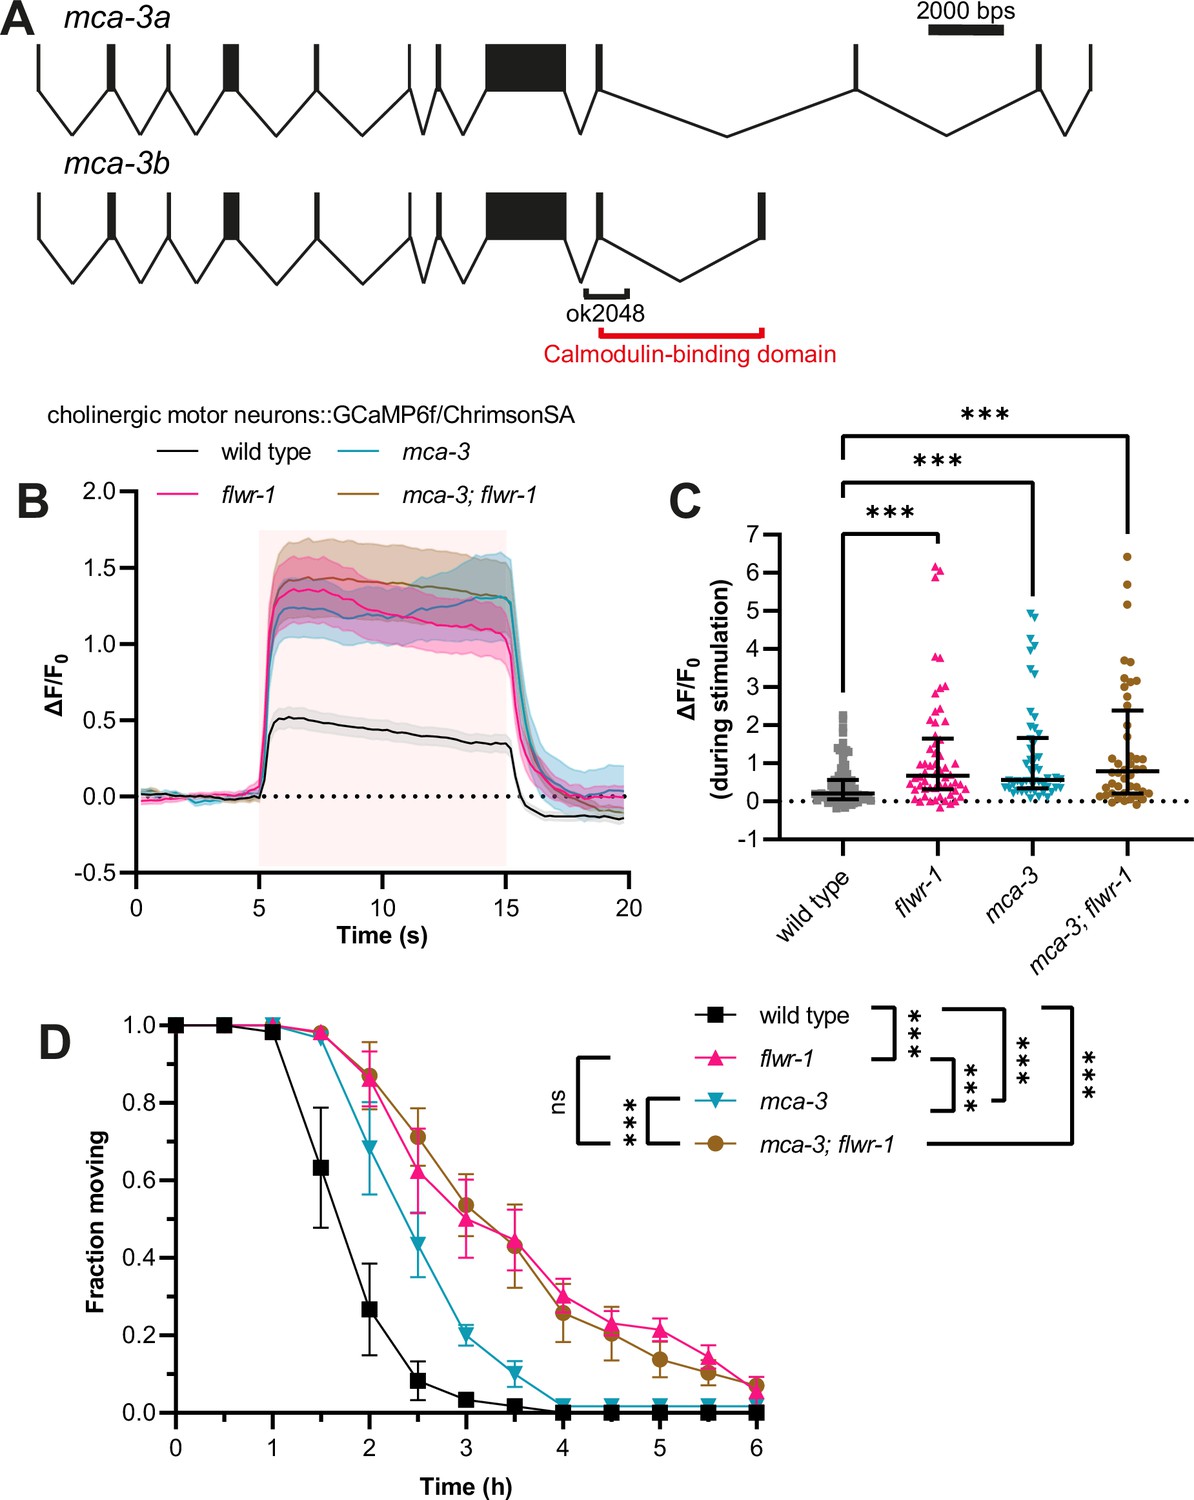
Increased Ca2+ levels in flwr-1 mutants may be caused by negative regulation of MCA-3.
(A) Schematic representation of the mca-3 gene locus including exon/intron structure of isoforms mca-3a and mca-3b. Bars represent exons, and connecting lines introns. The size of the ok2048 deletion as well as the putative calmodulin-binding domain is indicated. (B) Mean (± SEM) normalized fluorescence in synaptic puncta of the dorsal nerve cord (DNC) of animals expressing GCaMP6f and ChrimsonSA in cholinergic motor neurons (unc-17b promoter). All animals were supplemented with all-trans retinal (ATR). A 10 s light pulse (590 nm, 40 µW/mm2) was applied after 5 s as indicated by the red shade. (C) Median (with interquartile range [IQR]) normalized fluorescence during stimulation (seconds 6–14) as depicted in (B). Each dot indicates a single animal. Kruskal-Wallis test. Only statistically significant differences are depicted. **p<0.01, ***p<0.001. Number of animals imaged in (B+C): wild type = 83, flwr-1 = 58, mca-3 = 50, mca-3; flwr-1 = 44. Outliers were removed from all datasets as detected by iterative Grubb’s method (GraphPad Prism). (D) Mean (± SEM) fraction of moving animals after exposure to 1.5 mM aldicarb. Two-way ANOVA with Tukey’s correction. ns, not significant, ***p<0.001.
-
Figure 7—source data 1
Raw data for Figure 7B-D.
- https://cdn.elifesciences.org/articles/103870/elife-103870-fig7-data1-v1.xlsx
Figure 7—figure supplement 1
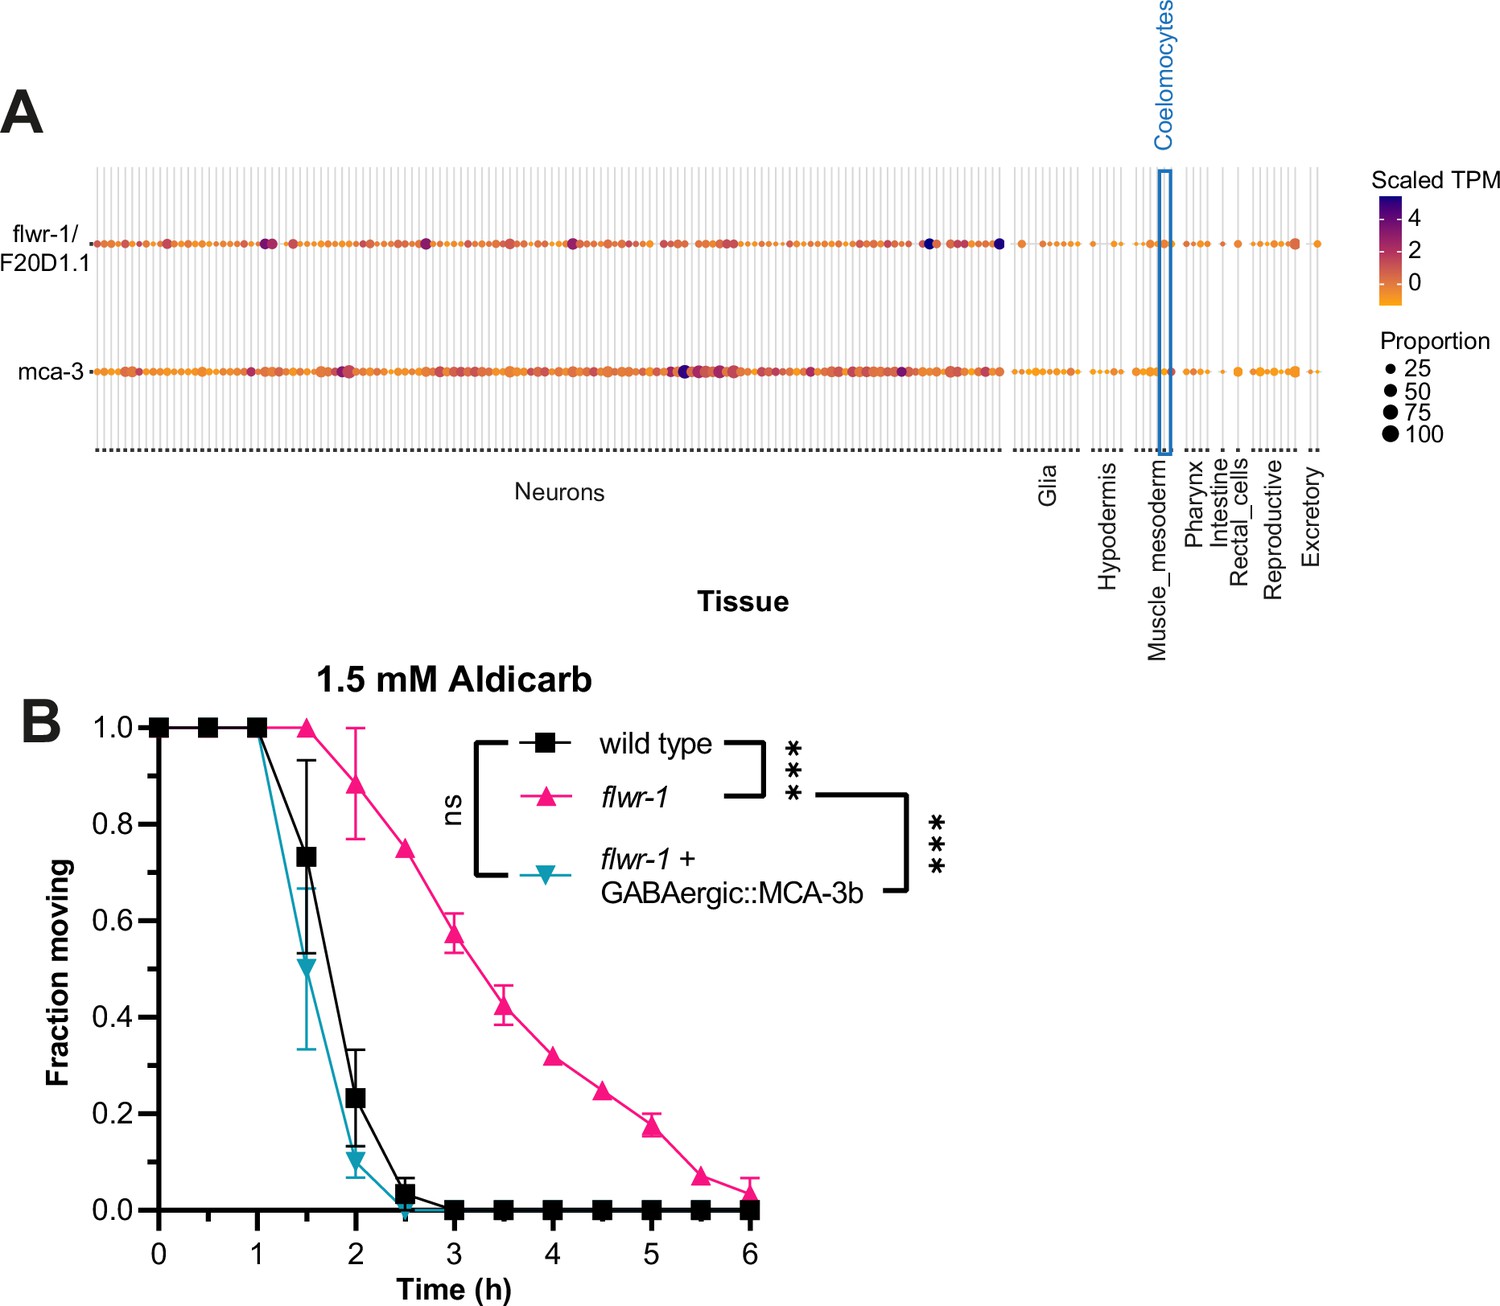
Comparison of flwr-1 and mca-3 expression by single-cell RNAseq data.
(A) Heatmap plot depicting flwr-1(F20D1.1) and mca-3 single-cell RNAseq data generated by the CeNGEN database (https://cengen.shinyapps.io/CengenApp/). Coloring indicates transcripts per million (TPM) per tissue normalized to the average expression as indicated in the legend. The size of the dots represents the percentage of cells of this cell type expressing the gene. Coelomocyte data is highlighted by the blue box. (B) Mean (± SEM) fraction of moving animals after exposure to 1.5 mM aldicarb. MCA-3b is expressed in GABAergic neurons of flwr-1(ok3128) mutant animals (unc-47 promoter). Two-way ANOVA with Tukey’s correction. N=3 biological replicates. ns, not significant. p>0.05, ***p<0.001.
-
Figure 7—figure supplement 1—source data 1
Raw data for Figure 7—figure supplement 1B.
- https://cdn.elifesciences.org/articles/103870/elife-103870-fig7-figsupp1-data1-v1.xlsx
Figure 8 with 1 supplement

Basic amino acid residues on the intracellular surface of FLWR-1 may be involved in PI(4,5)P2 lipid binding.
(A) Partial alignment of the amino acid sequences of FLWR-1, hFwe4 (H. sapiens), and Fwe-Ubi/FweA (D. melanogaster). Shading depicts evolutionary conservation of amino acid residues (black – identity; gray – homology). (B) Mean (± SEM) fraction of moving animals after exposure to 1.5 mM aldicarb. Two-way ANOVA with Tukey’s correction. Selected comparisons are depicted. N=3 biological replicates. ***p<0.001. (C) Exemplary images of coelomocytes (CCs) in wild type and flwr-1(ok3128) animals expressing GFP fused to the PH domain of PLCδ in CCs. Scale bar, 10 µm. (D) Mean (± SEM) corrected GFP fluorescence. Membrane fluorescence was estimated by measuring the perimeter of CCs and subtracting the fluorescence in the interior of cells. Each dot indicates a single CC. a.u.=arbitrary units of fluorescence intensity. Kruskal-Wallis test. Only statistically significant differences are depicted. *p<0.05, **p<0.01, ***p<0.001. Number of animals imaged in N=3 biological replicates: wild type = 27, flwr-1=25.
-
Figure 8—source data 1
Raw data for Figure 8B and D.
- https://cdn.elifesciences.org/articles/103870/elife-103870-fig8-data1-v1.xlsx
Figure 8—figure supplement 1
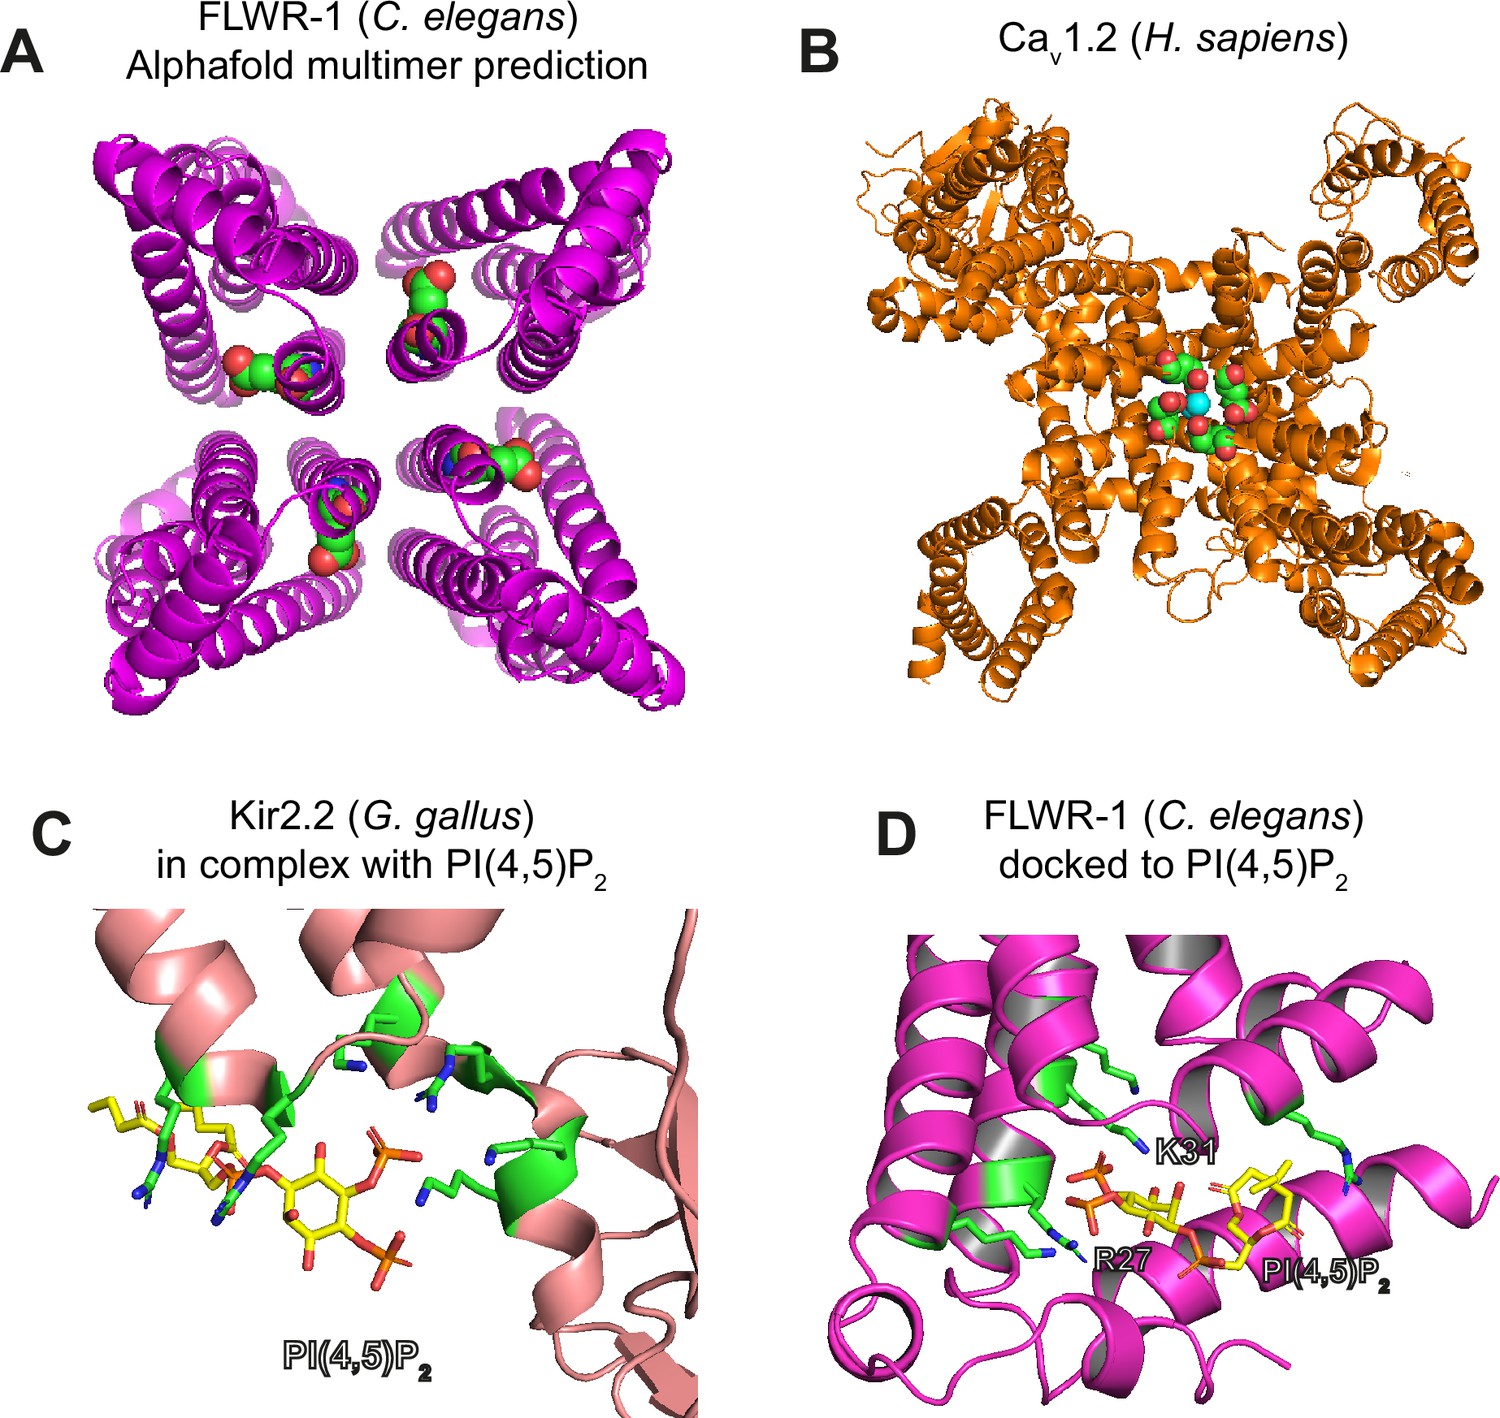
Structural analysis of important amino acid residues in FLWR-1 and other proteins.
(A) Top view of an AlphaFold3 prediction of a tetrameric FLWR-1 structure. Glutamate 74 is indicated as colored spheres in each monomer. (B) Cryo-electron microscopy (cryo-EM) structure of the human L-type voltage-gated calcium channel Cav1.2 (PDB: 8EOG) (Chen et al., 2023). Glutamate residues in the central pore are indicated as spheres. Ca2+ ions within the pore are depicted as turquoise spheres. (C) X-ray structure of the Kir2.2 potassium channel in a complex with phosphatidylinositol-4,5-bisphosphate (PI(4,5)P2) (PDB: 3SPI) (Hansen et al., 2011). Basic amino acid residues in the proximity of PI(4,5)P2 are depicted as sticks. (D) PI(4,5)P2 was docked to the AlphaFold3 structure of FLWR-1 using AutoDock Vina (Eberhardt et al., 2021). Basic amino acid residues in the proximity of PI(4,5)P2 are depicted as sticks. Arginine 27 and lysine 31 are indicated.
Figure 9 with 1 supplement
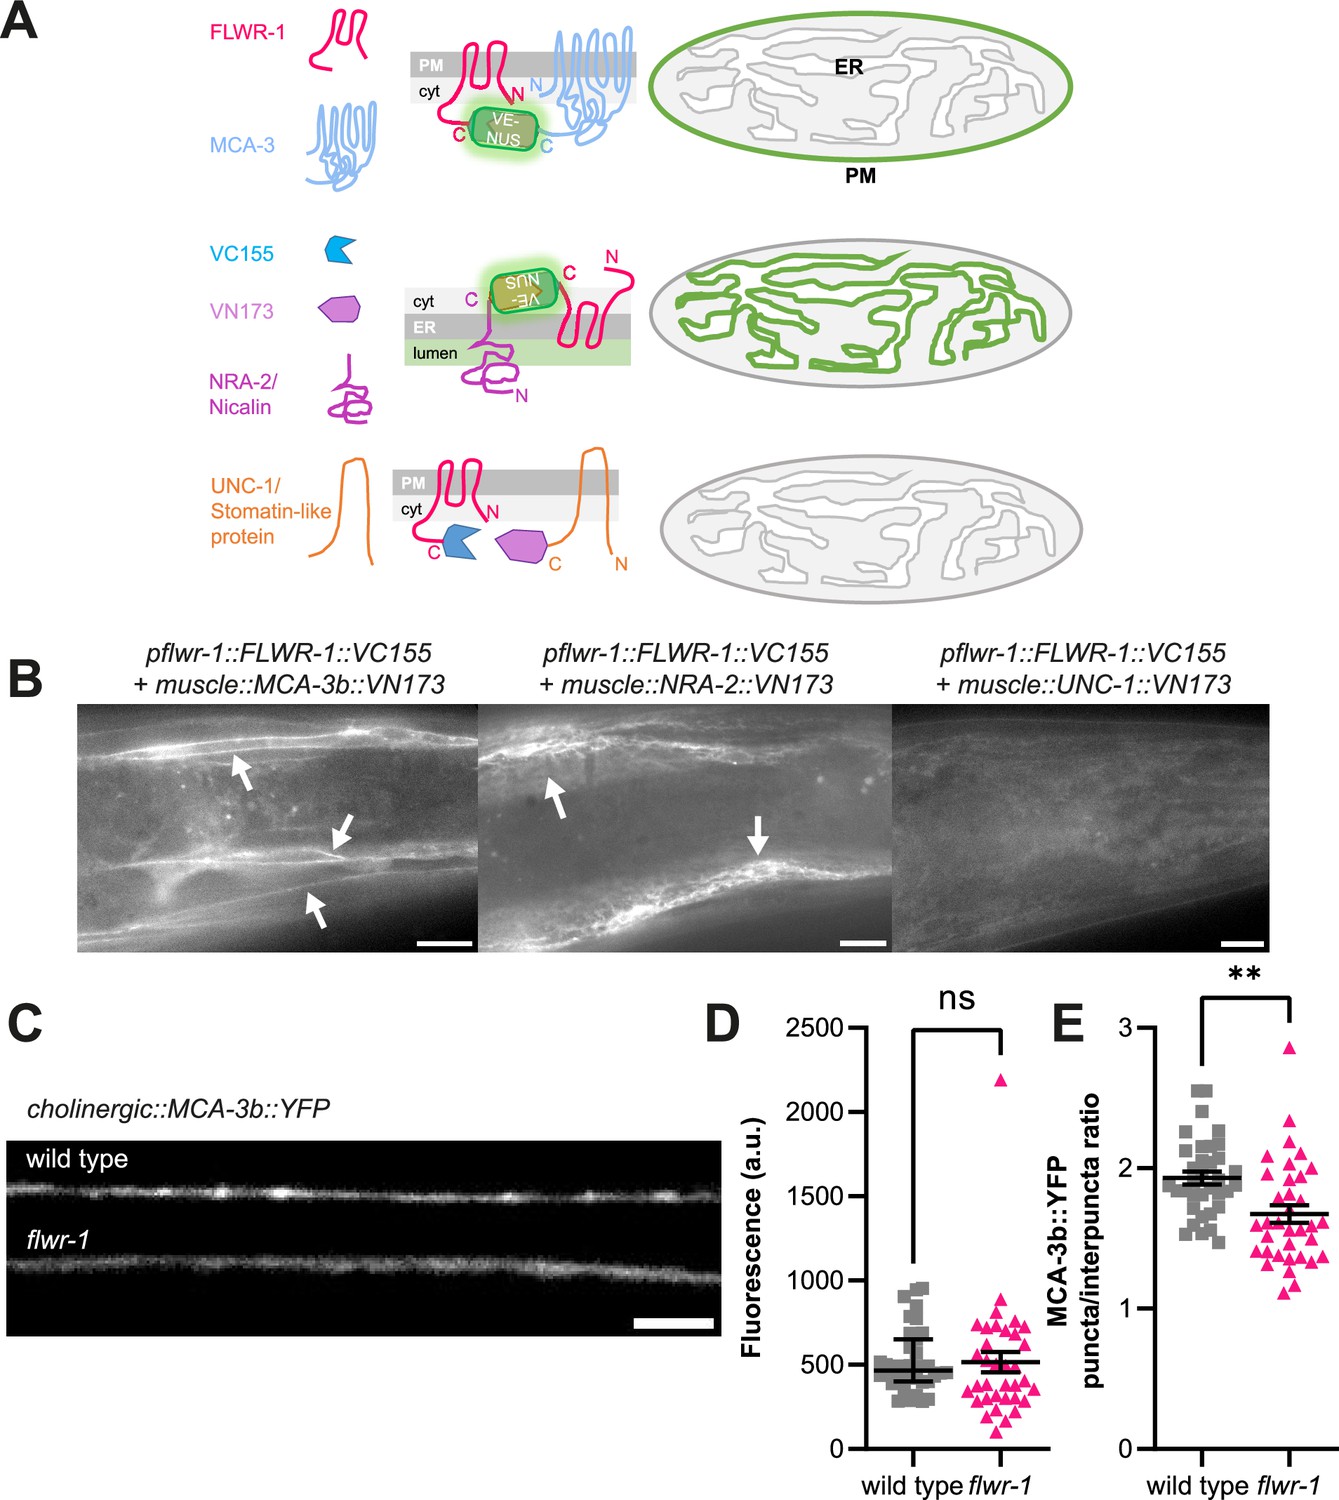
FLWR-1 is physically close to MCA-3 in the plasma membrane of body wall muscles (BWMs) and promotes synaptic localization of MCA-3.
(A) Schematic representation of the bimolecular fluorescence complementation (BiFC) assay. (B) Representative micrographs of animals expressing FLWR-1 fused to one fragment of mVenus (VN173) and either MCA-3b, NRA-2/Nicalin, or UNC-1 stomatin, interacting with gap junctions, respectively, fused to the other fragment of mVenus (VC155). Scale bar, 10 µm. (C) Representative micrographs of the dorsal nerve cord (DNC) of animals expressing MCA-3b::YFP in cholinergic neurons (unc-17 promoter). Scale bar, 5 µm. (D, E) Analysis of MCA-3b::YFP fluorescence (mean ± SEM) along the nerve cord (D) and as the ratio of fluorescence in synaptic puncta over fluorescence in the interpuncta regions (E). Each dot represents a single animal. Number of animals imaged in N=3 biological replicates: wild type = 35, flwr-1 = 35. Unpaired t-test. **p<0.01.
-
Figure 9—source data 1
Raw data for Figure 9D and E.
- https://cdn.elifesciences.org/articles/103870/elife-103870-fig9-data1-v1.xlsx
Figure 9—figure supplement 1
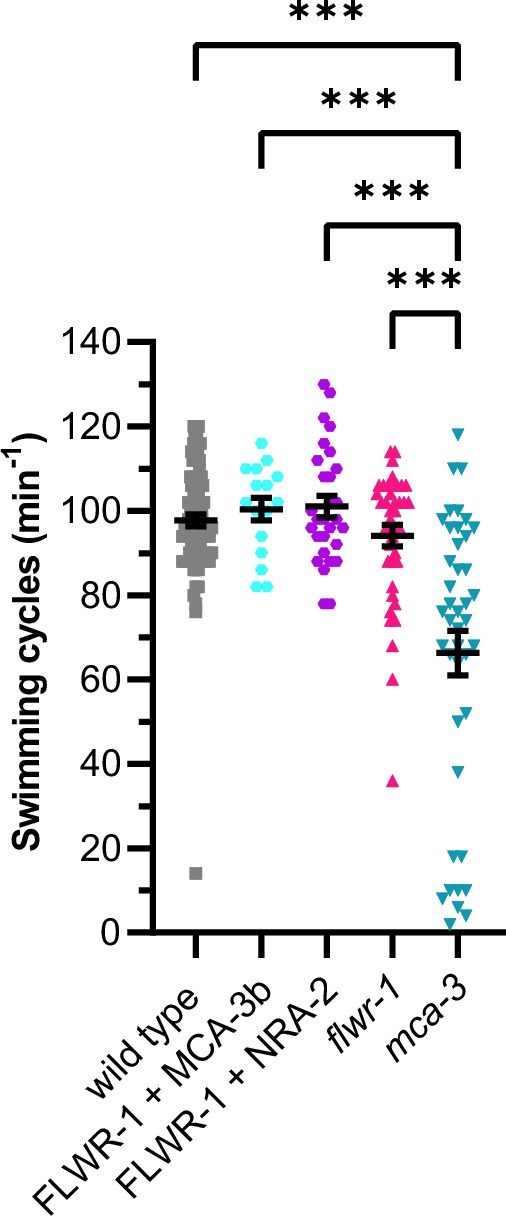
Expression of FLWR-1 and MCA-3b for bimolecular fluorescence complementation (BiFC) does not affect locomotion behavior: mean (±SEM) swimming cycles of animals analyzed by BiFC as depicted in Figure 8B.
N2 wild type animals were used as a control strain, as well as flwr-1(ok3128) and mca-3(ok2048) mutants. Number of animals accumulated from N=4 (wild type) or N=2 (all other strains) biological replicates: wild type = 90, FLWR-1/MCA-3b=16, FLWR-1/NRA-2=29, flwr-1=40, mca-3=42. One-way ANOVA with Tukey’s correction. ns, not significant p>0.05, ***p<0.001.
-
Figure 9—figure supplement 1—source data 1
Raw data for Figure 9—figure supplement 1.
- https://cdn.elifesciences.org/articles/103870/elife-103870-fig9-figsupp1-data1-v1.xlsx
Figure 10

Model summarizing findings made in this study.
For details, see Discussion.
Author response image 1
Videos
Video 1
Time series of a particle containing GFP::FLWR-1 and mCherry::SNB-1 traveling along commissures.
Scale bar, 2 µm.
Additional files
-
Supplementary file 1
Plasmids used in this study.
- https://cdn.elifesciences.org/articles/103870/elife-103870-supp1-v1.xlsx
-
Supplementary file 2
Strains used in this study.
- https://cdn.elifesciences.org/articles/103870/elife-103870-supp2-v1.xlsx
-
Supplementary file 3
CeNGEN expression data of flwr-1/F20D1.1 and mca-3 single-cell RNAseq data as described in Taylor et al., 2021.
The threshold was set to ‘All Cells Unfiltered’. Cell types were sorted alphabetically. Where CeNGEN did not produce any results, cells were left blank.
- https://cdn.elifesciences.org/articles/103870/elife-103870-supp3-v1.csv
-
MDAR checklist
- https://cdn.elifesciences.org/articles/103870/elife-103870-mdarchecklist1-v1.docx
Download links
A two-part list of links to download the article, or parts of the article, in various formats.
Downloads (link to download the article as PDF)
Open citations (links to open the citations from this article in various online reference manager services)
Cite this article (links to download the citations from this article in formats compatible with various reference manager tools)
Flower/FLWR-1 regulates neuronal activity via the plasma membrane Ca2+ ATPase to promote recycling of synaptic vesicles
eLife 13:RP103870.
https://doi.org/10.7554/eLife.103870.4


