Elevated ubiquitin phosphorylation by PINK1 contributes to proteasomal impairment and promotes neurodegeneration
- Department of Pharmacology, Zhejiang University School of Medicine, China
- The First People’s Hospital of Jingzhou, First Affiliated Hospital of Yangtze University, China
- Department of Biomedical Informatics, School of Basic Medical Sciences, Peking University Health Science Center, China
- Beijing National Laboratory for Molecular Sciences, College of Chemistry and Molecular Engineering, Center for Quantitate Biology, Center for Life Science, Academy for Advanced Interdisciplinary Studies, Peking University, China
- Zhejiang Key Laboratory of Precision Psychiatry, China
Figures
Figure 1 with 1 supplement
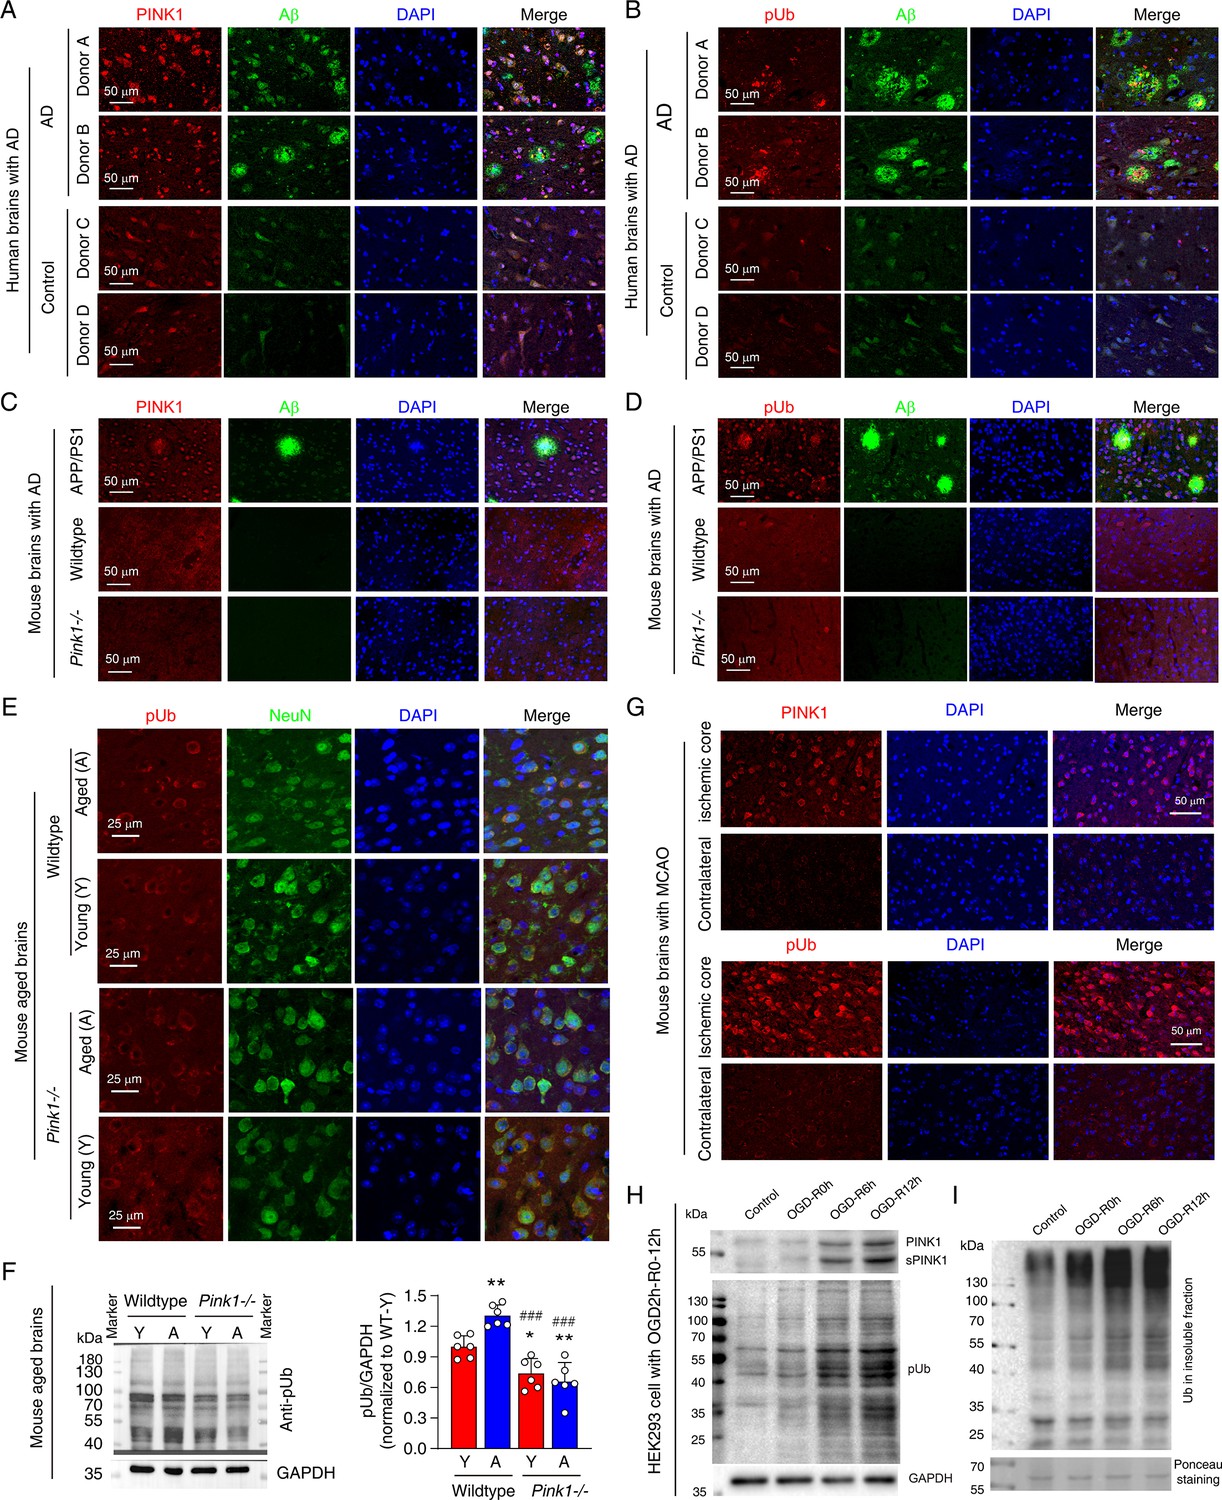
Elevated phosphorylated ubiquitin (pUb) levels are widespread across neurodegenerative conditions.
(A, B) Double immunofluorescence staining showing the distribution of PTEN-induced kinase 1 (PINK1) and Aβ (A), and pUb and Aβ (B), within the cingulate gyrus brain region of Alzheimer's disease (AD) patients compared to similar brain regions from age-matched controls. Detailed donor information is provided in Figure 1—source data 1. (C, D) Double immunofluorescence staining of PINK1 and Aβ (C), and pUb and Aβ (D) in the brains of wild-type, Pink1-/-, and APP/PS1 transgenic mice. The images were taken for the neocortex of APP/PS1, wild-type, and Pink1-/- mice. (E) Double immunofluorescence staining for pUb and the neuronal marker NeuN in the neocortex of young and aged brains of both wild-type and Pink1-/- mice. The images were taken for the layer III-IV of neocortex. (F) Western blot analysis of pUb levels in the cortex of young (Y) and aged (A) wild-type and Pink1-/- mouse brains, quantitatively comparing protein levels across ages and genotypes. N=6, *p<0.05, **p<0.01 for comparisons with young wild-type mice; ###p<0.001 for comparisons with aged wild-type mice, one-way ANOVA. (G) Immunofluorescence staining for PINK1 and pUb in the contralateral and penumbra of mouse brains subjected to middle cerebral artery occlusion (MCAO) for 2 hr, followed by 24 hr of reperfusion. Locations of the analyzed brain regions are shown in Figure 1—figure supplement 1. (H) Western blot analysis of PINK1 and pUb levels in HEK293 cells subjected to oxygen-glucose deprivation (OGD) for 2 hr, followed by reperfusion at 0, 6, and 12 hr. (I) Western blot analysis of ubiquitin in the insoluble fraction of HEK293 cells post 2 hr OGD and subsequent 0, 6, 12 hr of reperfusion.
-
Figure 1—source data 1
Word file of a table containing the clinical and pathological characteristics of brain donors.
- https://cdn.elifesciences.org/articles/103945/elife-103945-fig1-data1-v1.docx
-
Figure 1—source data 2
PDF file containing original western blots for Figure 1F, indicating the relevant bands and treatments.
- https://cdn.elifesciences.org/articles/103945/elife-103945-fig1-data2-v1.pdf
-
Figure 1—source data 3
Original files for western blot analysis displayed in Figure 1F.
- https://cdn.elifesciences.org/articles/103945/elife-103945-fig1-data3-v1.zip
Figure 1—figure supplement 1
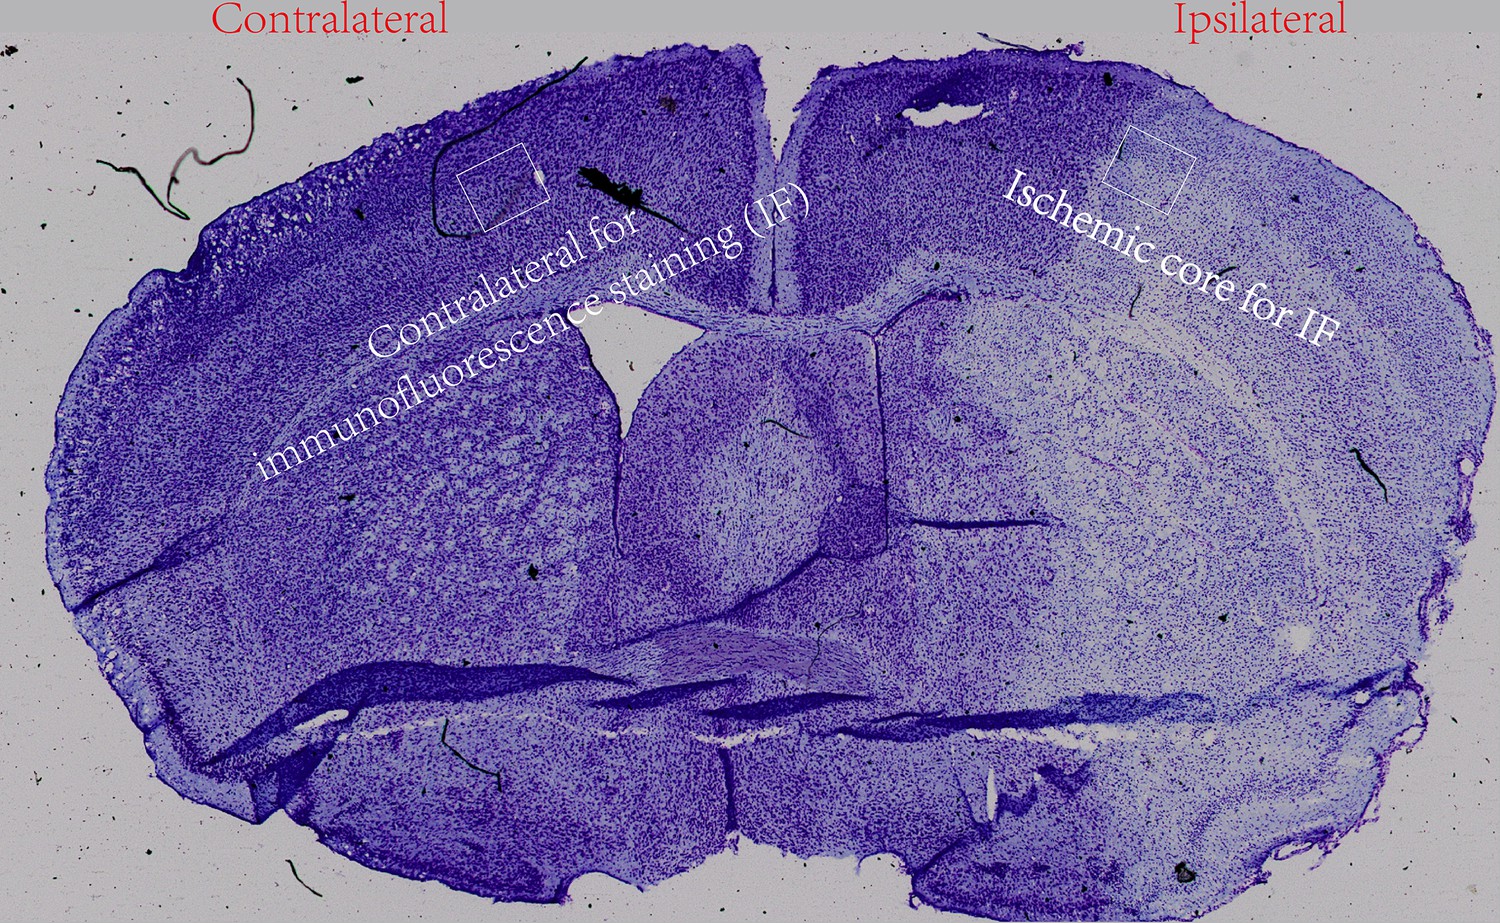
Nissl staining brain section from a mouse with middle cerebral artery occlusion (MCAO) to show the brain regions.
The frames show the contralateral and ipsilateral for immunofluorescence staining shown in Figure 1G.
Figure 2
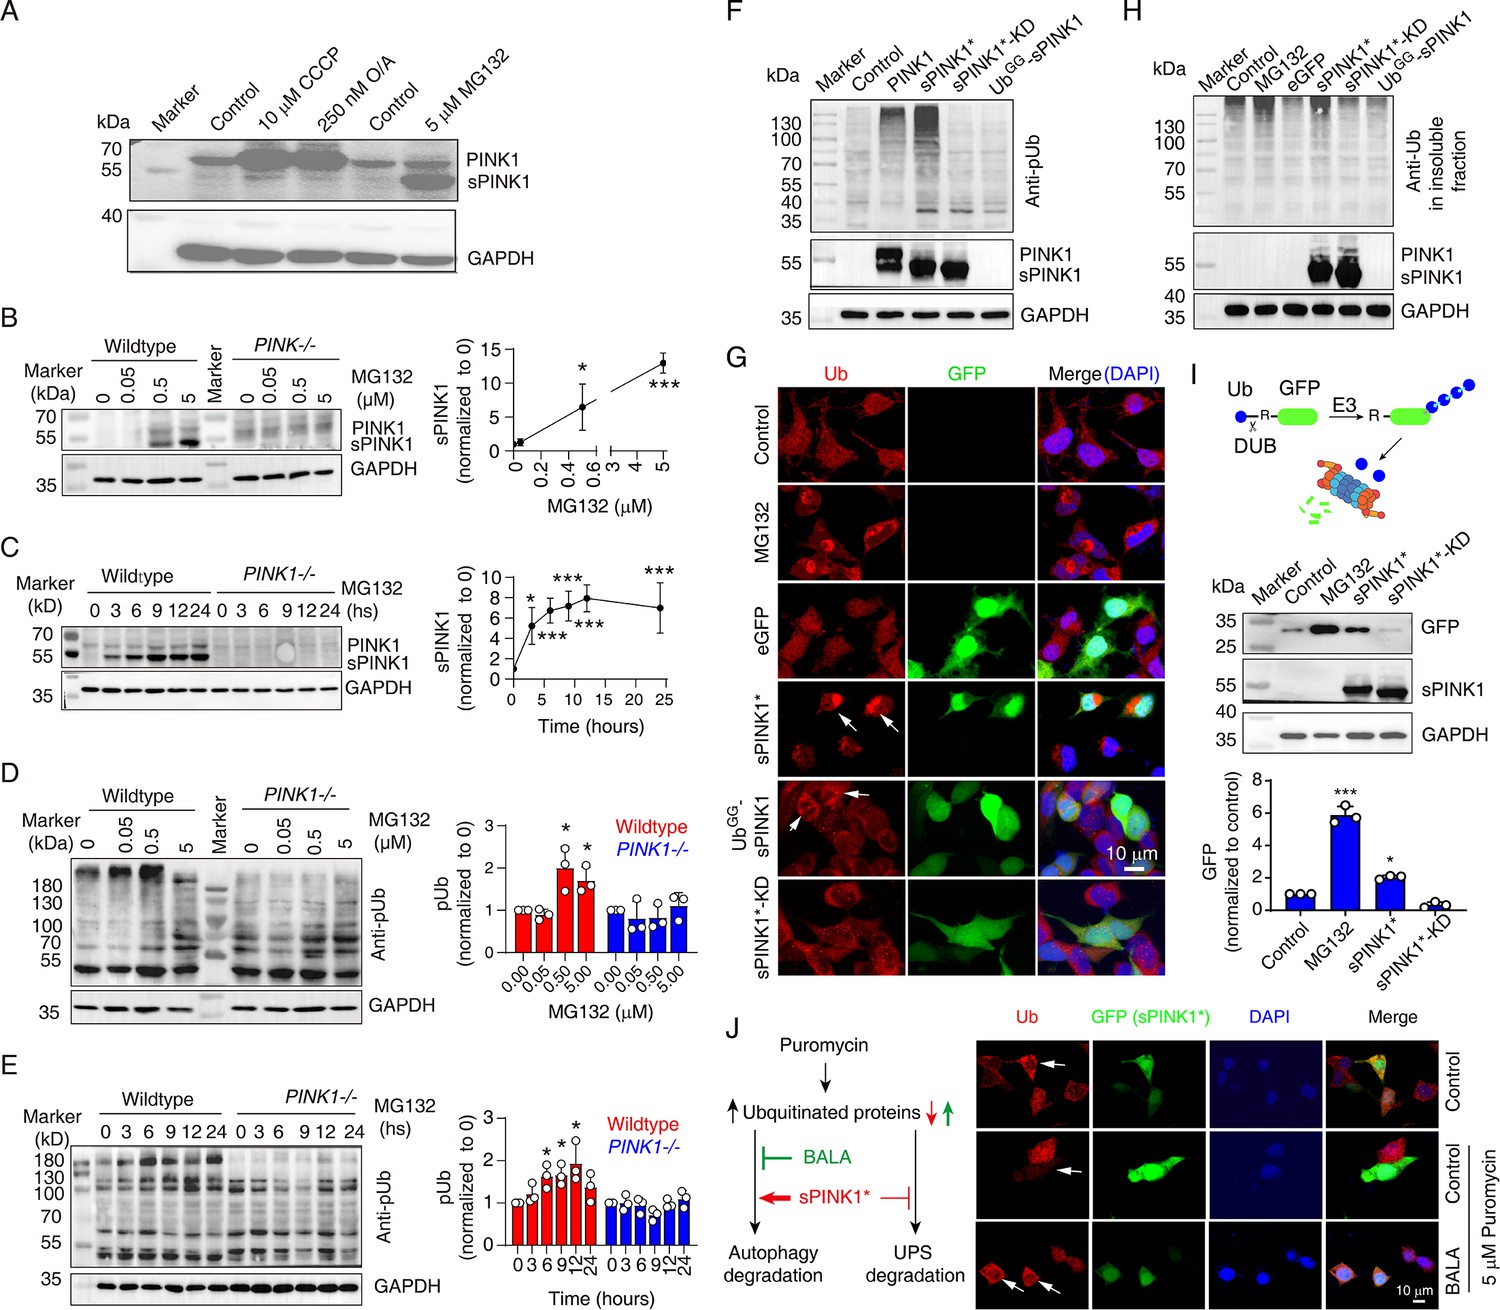
Ubiquitin phosphorylation by sPINK1 affects proteasomal activity in HEK293 cells.
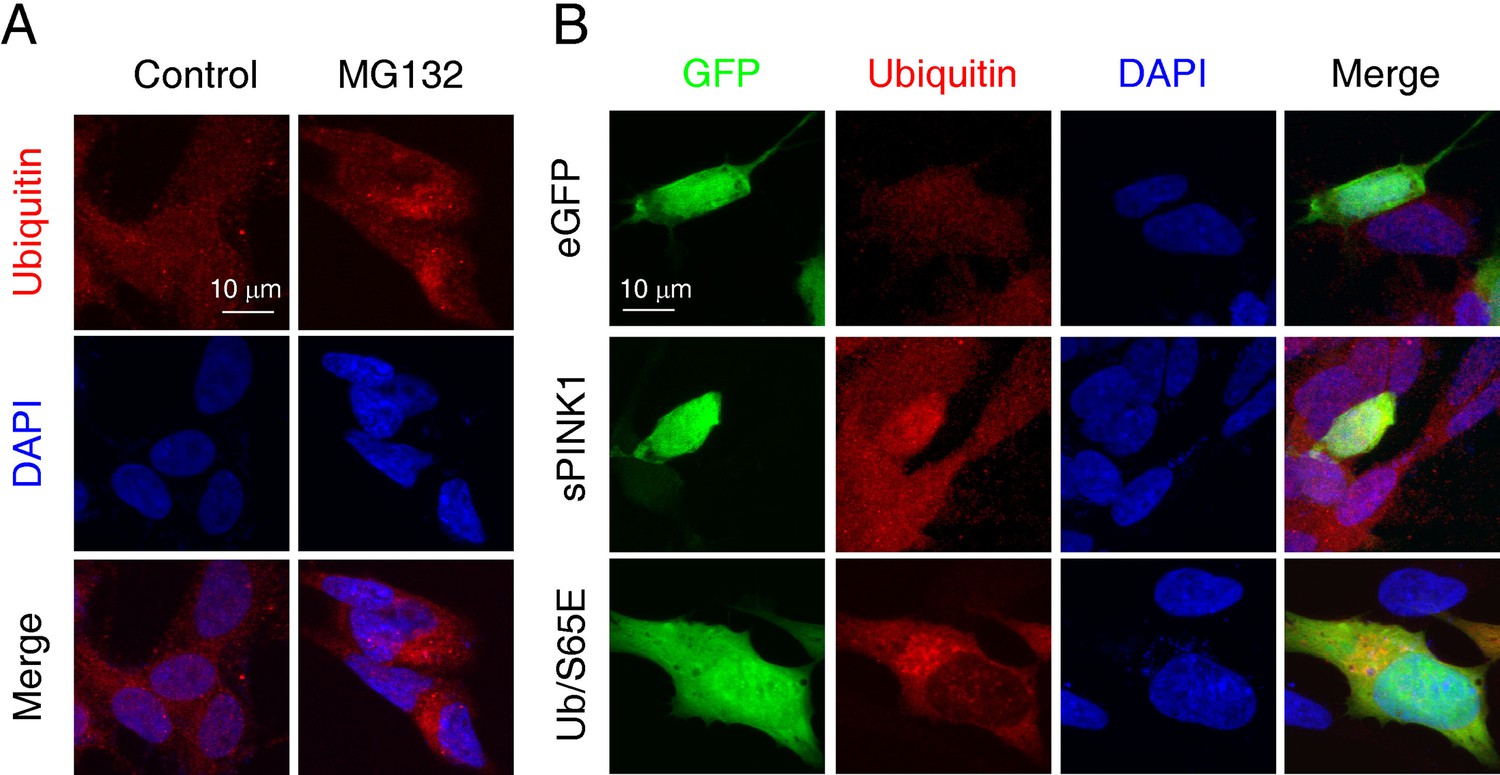
(A) Representative Western blot showing the levels of PINK1 following the administration of CCCP, O/A, or MG132. The CCCP was treated for 12 hr, O/A was treated for 2 hr, and the MG132 was treated for 8 hr. (B) Western blot analysis showing the concentration-dependent effect of MG132 (0–5 µM) over an 8 hr period on PINK1 level. N=3; *p<0.05, ***p<0.001, compared to 0 µM MG132, one-way ANOVA. (C) Western blot analysis showing the time-dependent effect of 5 µM MG132 on PINK1 levels in 0–24 hr. N=4; *p<0.05, ***p<0.001, compared to 0 hr, one-way ANOVA. (D) Western blot analysis of phosphorylated ubiquitin (pUb) levels under a concentration gradient of MG132 (0–5 µM) for 8 hr. N=3; *p<0.05, compared to 0 µM MG132, one-way ANOVA. (E) Western blot analysis of pUb levels over a time course of 0–24 hr with 5 µM MG132 treatment. N=3; *p<0.05, compared to 0 hr, one-way ANOVA. (F) Representative Western blot image showing the levels of pUb and PINK1 at 24 hr post-transfection with different PINK1 constructs: sPINK1* (PINK1/F101M/L102-L581), sPINK1*-KD (kinase-dead sPINK1* with additional K219A/D362A/D384A mutations), and UbGG-sPINK1 (a short-lived version of native sPINK1 with an appended N-terminal Ub). (G) Representative immunofluorescence images of ubiquitin staining in cells treated with 5 µM MG132 for 8 hr or transfected with different sPINK1 constructs, highlighting differences in ubiquitin localization and aggregation. The white arrows indicate positively transfected cells. (H) Representative Western blot image of ubiquitin in the insoluble protein fraction of cells. The cells were collected at 8 hr after treatment with 5 µM MG132, or collected at 24 hr after transfection with different sPINK1 constructs. (I) Western blot analysis showing GFP degradation in HEK293 cells transfected with Ub-R-GFP. Cells were harvested at 8 hr after 5 µM MG132 treatment, or 24 hr following sPINK1* or sPINK1*-KD transfection. N=3; *p<0.05, ***p<0.001, compared to the control, one-way ANOVA. (J) Immunofluorescence staining of ubiquitin illustrating how sPINK1 overexpression impacts on proteasomal and autophagic degradation. Puromycin blocks protein synthesis at the translation elongation stage, leading to the production of truncated proteins; BALA (bafilomycin A1, a v-ATPase inhibitor) blocks the degradation of autophagic cargo by inhibiting autophagosome-lysosome fusion, as illustrated in the left panel. Puromycin (5 µg/ml) was applied for 2 hr before harvesting with or without the treatment of 0.1 µM BALA. The white arrows indicate positively transfected cells.
-
Figure 2—source data 1
PDF file containing original western blots for Figure 2B, indicating the relevant bands and treatments.
- https://cdn.elifesciences.org/articles/103945/elife-103945-fig2-data1-v1.pdf
-
Figure 2—source data 2
Original files for western blot analysis displayed in Figure 2B.
- https://cdn.elifesciences.org/articles/103945/elife-103945-fig2-data2-v1.zip
-
Figure 2—source data 3
PDF file containing original western blots for Figure 2C, indicating the relevant bands and treatments.
- https://cdn.elifesciences.org/articles/103945/elife-103945-fig2-data3-v1.pdf
-
Figure 2—source data 4
Original files for western blot analysis displayed in Figure 2C.
- https://cdn.elifesciences.org/articles/103945/elife-103945-fig2-data4-v1.zip
-
Figure 2—source data 5
PDF file containing original western blots for Figure 2D, indicating the relevant bands and treatments.
- https://cdn.elifesciences.org/articles/103945/elife-103945-fig2-data5-v1.pdf
-
Figure 2—source data 6
Original files for western blot analysis displayed in Figure 2D.
- https://cdn.elifesciences.org/articles/103945/elife-103945-fig2-data6-v1.zip
-
Figure 2—source data 7
PDF file containing original western blots for Figure 2E, indicating the relevant bands and treatments.
- https://cdn.elifesciences.org/articles/103945/elife-103945-fig2-data7-v1.pdf
-
Figure 2—source data 8
Original files for western blot analysis displayed in Figure 2E.
- https://cdn.elifesciences.org/articles/103945/elife-103945-fig2-data8-v1.zip
-
Figure 2—source data 9
PDF file containing original western blots for Figure 2I, indicating the relevant bands and treatments.
- https://cdn.elifesciences.org/articles/103945/elife-103945-fig2-data9-v1.pdf
-
Figure 2—source data 10
Original files for western blot analysis displayed in Figure 2I.
- https://cdn.elifesciences.org/articles/103945/elife-103945-fig2-data10-v1.zip
Figure 3 with 4 supplements
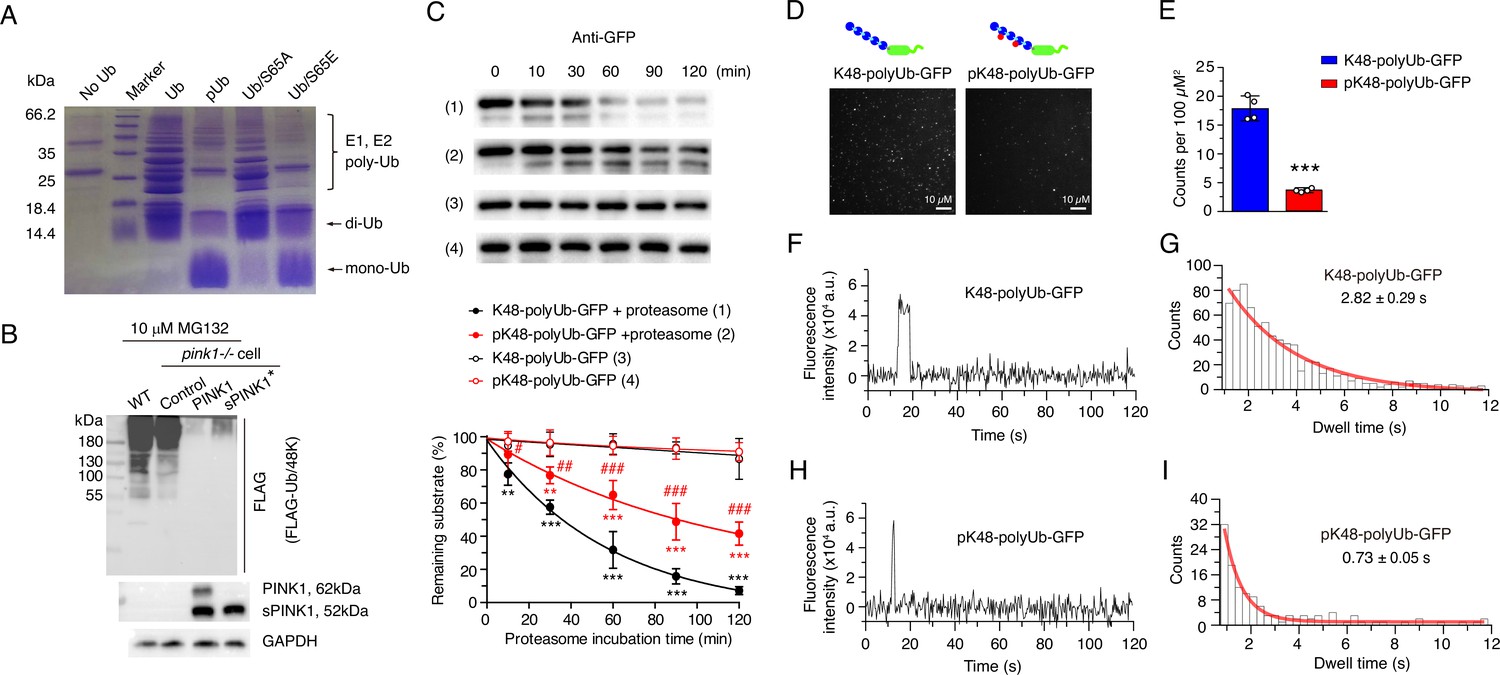
Ubiquitin phosphorylation inhibits both ubiquitin chain elongation and ubiquitin proteasome interactions.
(A) Coomassie blue staining showing ubiquitin chain formation/elongation using different ubiquitin variants as building blocks: wild-type ubiquitin, phosphorylated ubiquitin (pUb), phospho-null Ub/S65A, and phospho-mimic Ub/S65E. (B) Western blot showing the formation of K48-linked ubiquitin chain in wild-type (WT) and pink1-/- HEK293 cells without or with PINK1 and sPINK1* transfection. Cells were transfected with FLAG-tagged Ub/48 K to form K48-linked ubiquitin chain only, and 10 µM MG132 was applied at 12 hr post-transfection to prevent the degradation of ubiquitinated substrates. (C) Western blot analysis of in vitro proteasomal degradation of GFP modified with K48-linked ubiquitin chains (K48-polyUb-GFP) and GFP modified with phosphorylated K48-linked ubiquitin chains (pK48-polyUb-GFP). N=3; **p<0.01, ***p<0.001 compared to respective controls without added proteasome; #p<0.05, ##p<0.01, ###p<0.001 compared to K48-polyUb-GFP with proteasome, two-way ANOVA. (D) Representative TIRF microscopy images showing single-molecule association of K48-polyUb-GFP (left) and pK48-polyUb-GFP (right) to the surface-immobilized proteasomes, visualized as bright puncta. Details of total internal reflection fluorescence (TIRF) single-molecule visualization is shown in Figure 3—figure supplement 3. (E) Quantitative analysis of puncta density from TIRF images comparing the number of puncta of K48-polyUb-GFP and pK48-polyUb-GFP associated with surface-immobilized proteasomes. N=4; ***p<0.001 compared to K48-polyUb-GFP, using a paired t-test. (F, H) Representative fluorescence time traces of a single punctum for proteasomal bind K48-polyUb-GFP (F) and pK48-polyUb-GFP (H). More representative figures of single-molecule fluorescence are shown in Figure 3—figure supplement 4. (G, I) Analysis of GFP fluorescence dwell time for K48-polyUb-GFP (G) and pK48-polyUb-GFP (I) associated with the proteasome. Data were binned and modeled with a single exponential decay curve (red line).
-
Figure 3—source data 1
PDF file containing original western blots for Figure 3C, indicating the relevant bands and treatments.
- https://cdn.elifesciences.org/articles/103945/elife-103945-fig3-data1-v1.pdf
-
Figure 3—source data 2
Original files for western blot analysis displayed in Figure 3C.
- https://cdn.elifesciences.org/articles/103945/elife-103945-fig3-data2-v1.zip
Figure 3—figure supplement 1
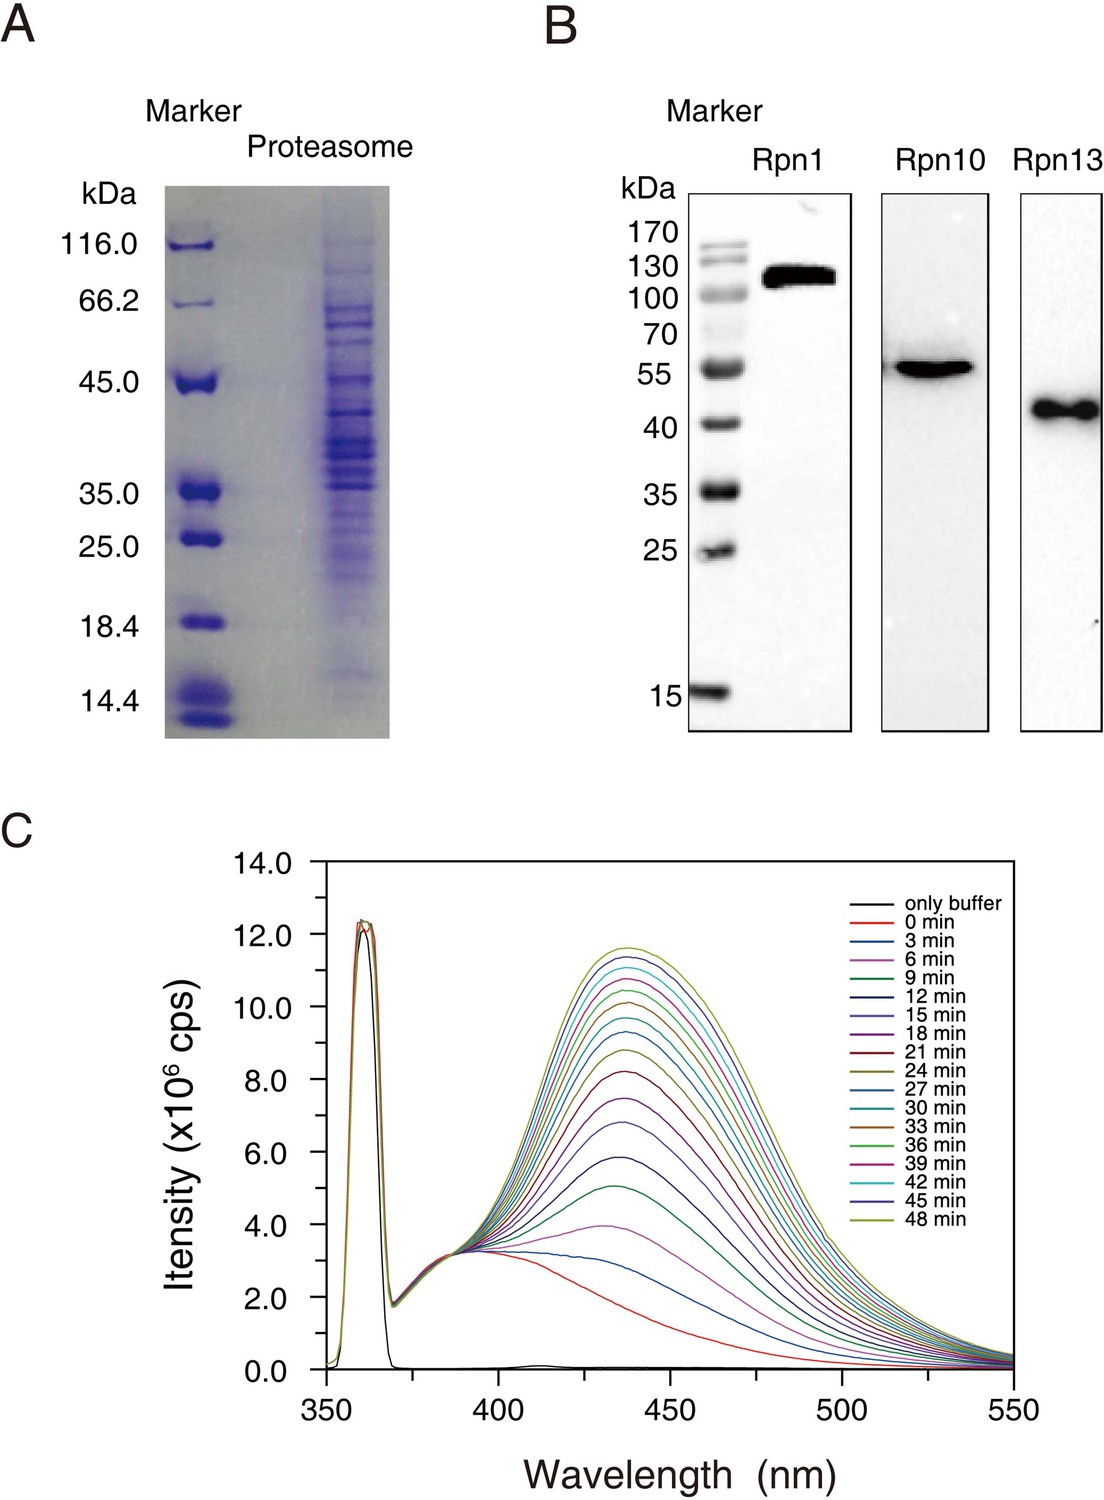
Preparation of the 26 S proteasome for in vitro degradation of proteins.
(A) Coomassie blue staining of proteins that make up the proteasome. (B) Western blot identification of the three Ub receptors in the 26 S proteasome, including Rpn1, Rpn10, and Rpn13. (C) The determination of in vitro proteasome degradation activity using a fluorogenic peptide.
Figure 3—figure supplement 2
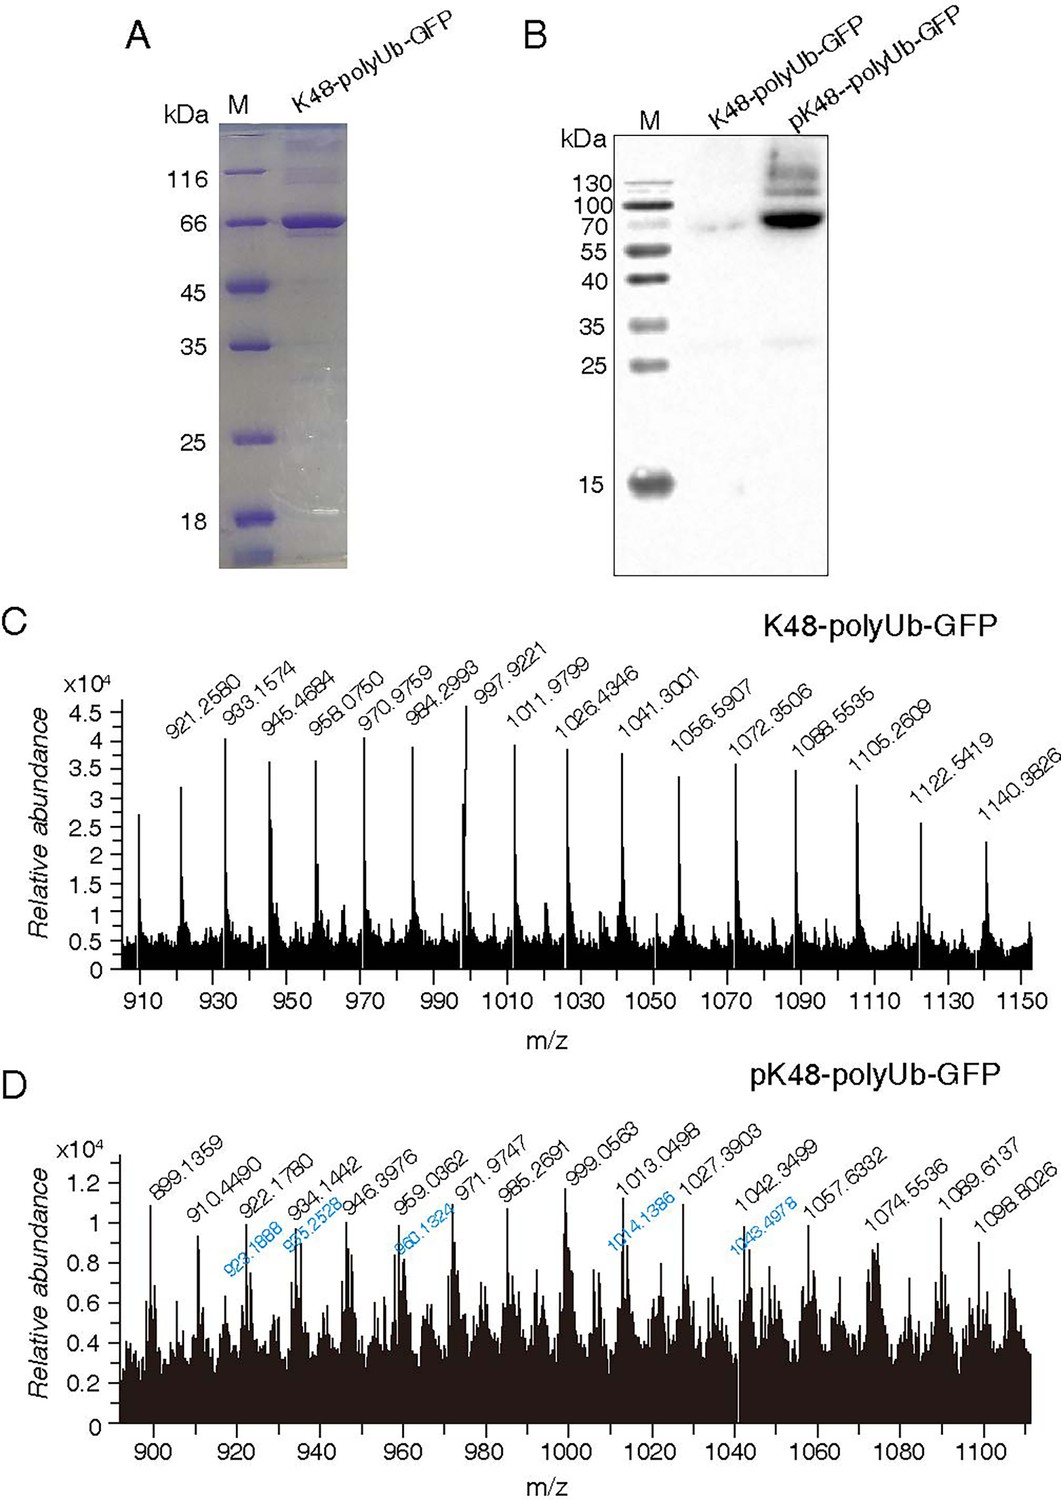
Preparation of GFP substrate protein modified with ubiquitin (Ub) chain.
The K48-linked tetraubiquitin was covalently attached to Ub-GFP fusion protein through a K48 isopeptide bond through the catalysis of E2-25K. (A) Identification of K48-polyUb-GFP with SDS-PAGE and Coomassie blue staining. (B) Identification of pK48-polyUb-GFP with pUb Western blot. (C and D) ESI-MS analysis of K48-polyUb-GFP and pK48-polyUb-GFP, respectively. The m/z profile indicates that the protein carries 1–2 phosphoryl groups, denoted with black and blue labels.
Figure 3—figure supplement 3
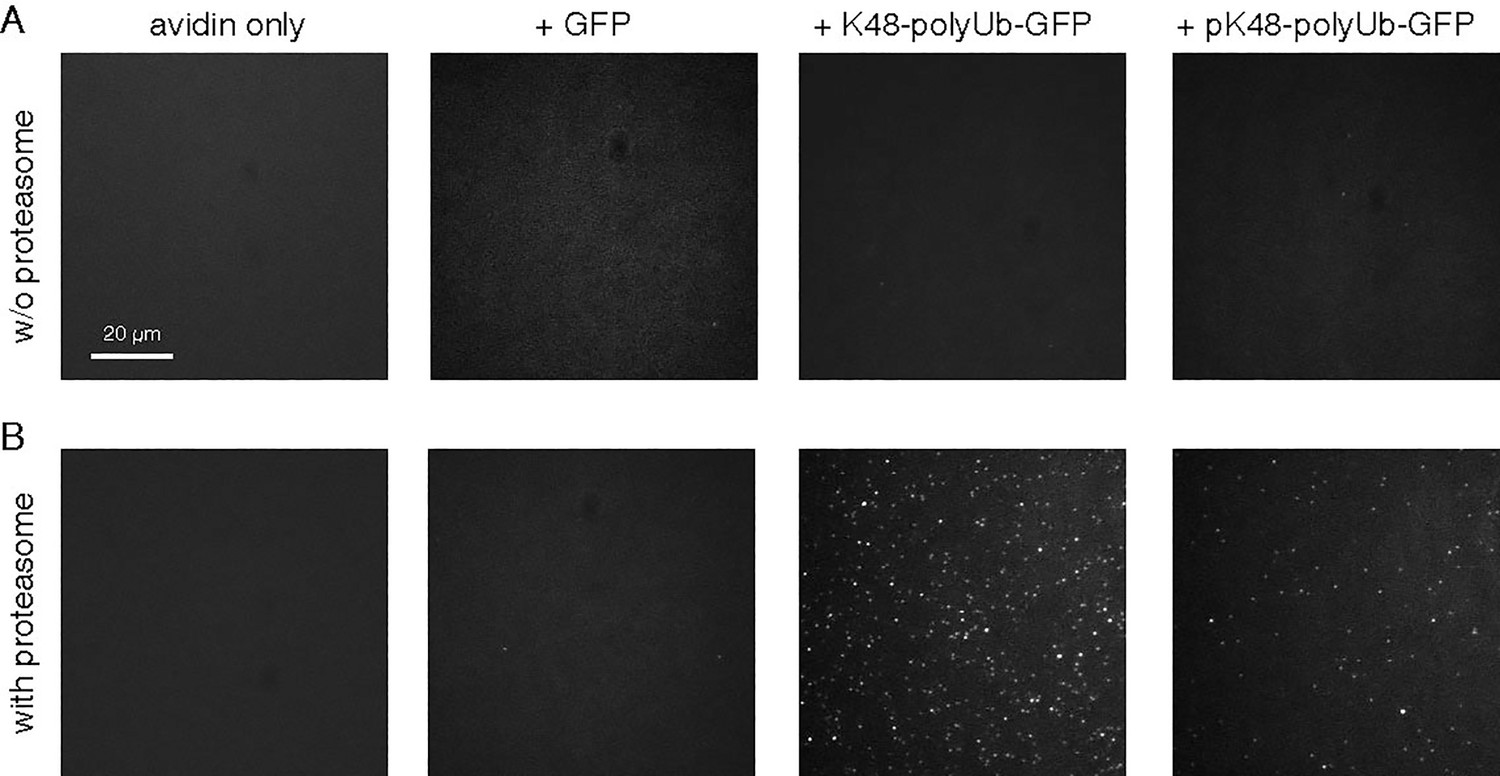
Visualization of proteasome-associated ubiquitin (Ub)-modified GFP using total internal reflection fluorescence (TIRF).
(A) Representative TIRF images without the proteasome immobilized on the coverslip. (B) Representative TIRF images with the proteasome immobilized on the coverslip. The immobilized proteasome alone or the application of GFP protein alone could not be visualized. K48-polyUb-GFP can be visualized with TIRF as discrete puncta upon binding to the immobilized proteasome.
Figure 3—figure supplement 4
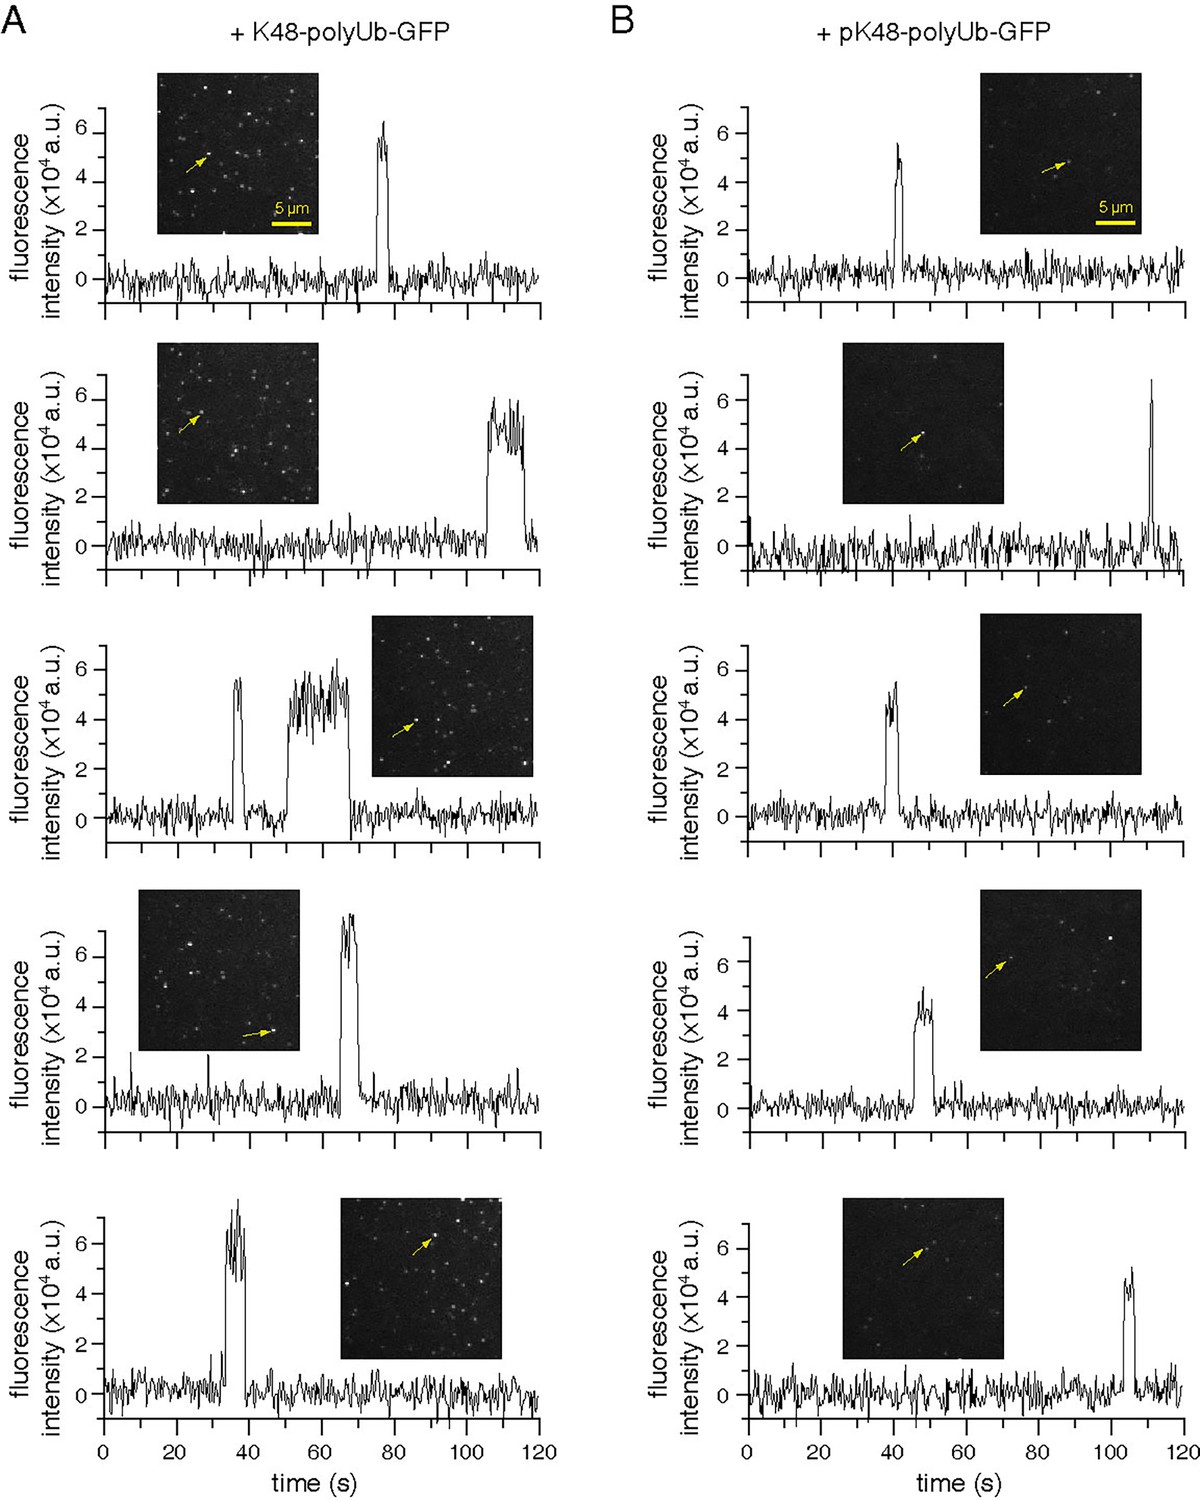
Time traces of polyUb-tagged GFP substrate visualized with total internal reflection fluorescence (TIRF).
From top to bottom, five representative time traces for K48-polyUb-GFP and pK48-polyUb-GFP, respectively, associated with the immobilized proteasome. The analyzed puncta are indicated with an arrow.
Figure 4
Pink1 knockout mitigates protein aggregation upon proteasomal inhibition.
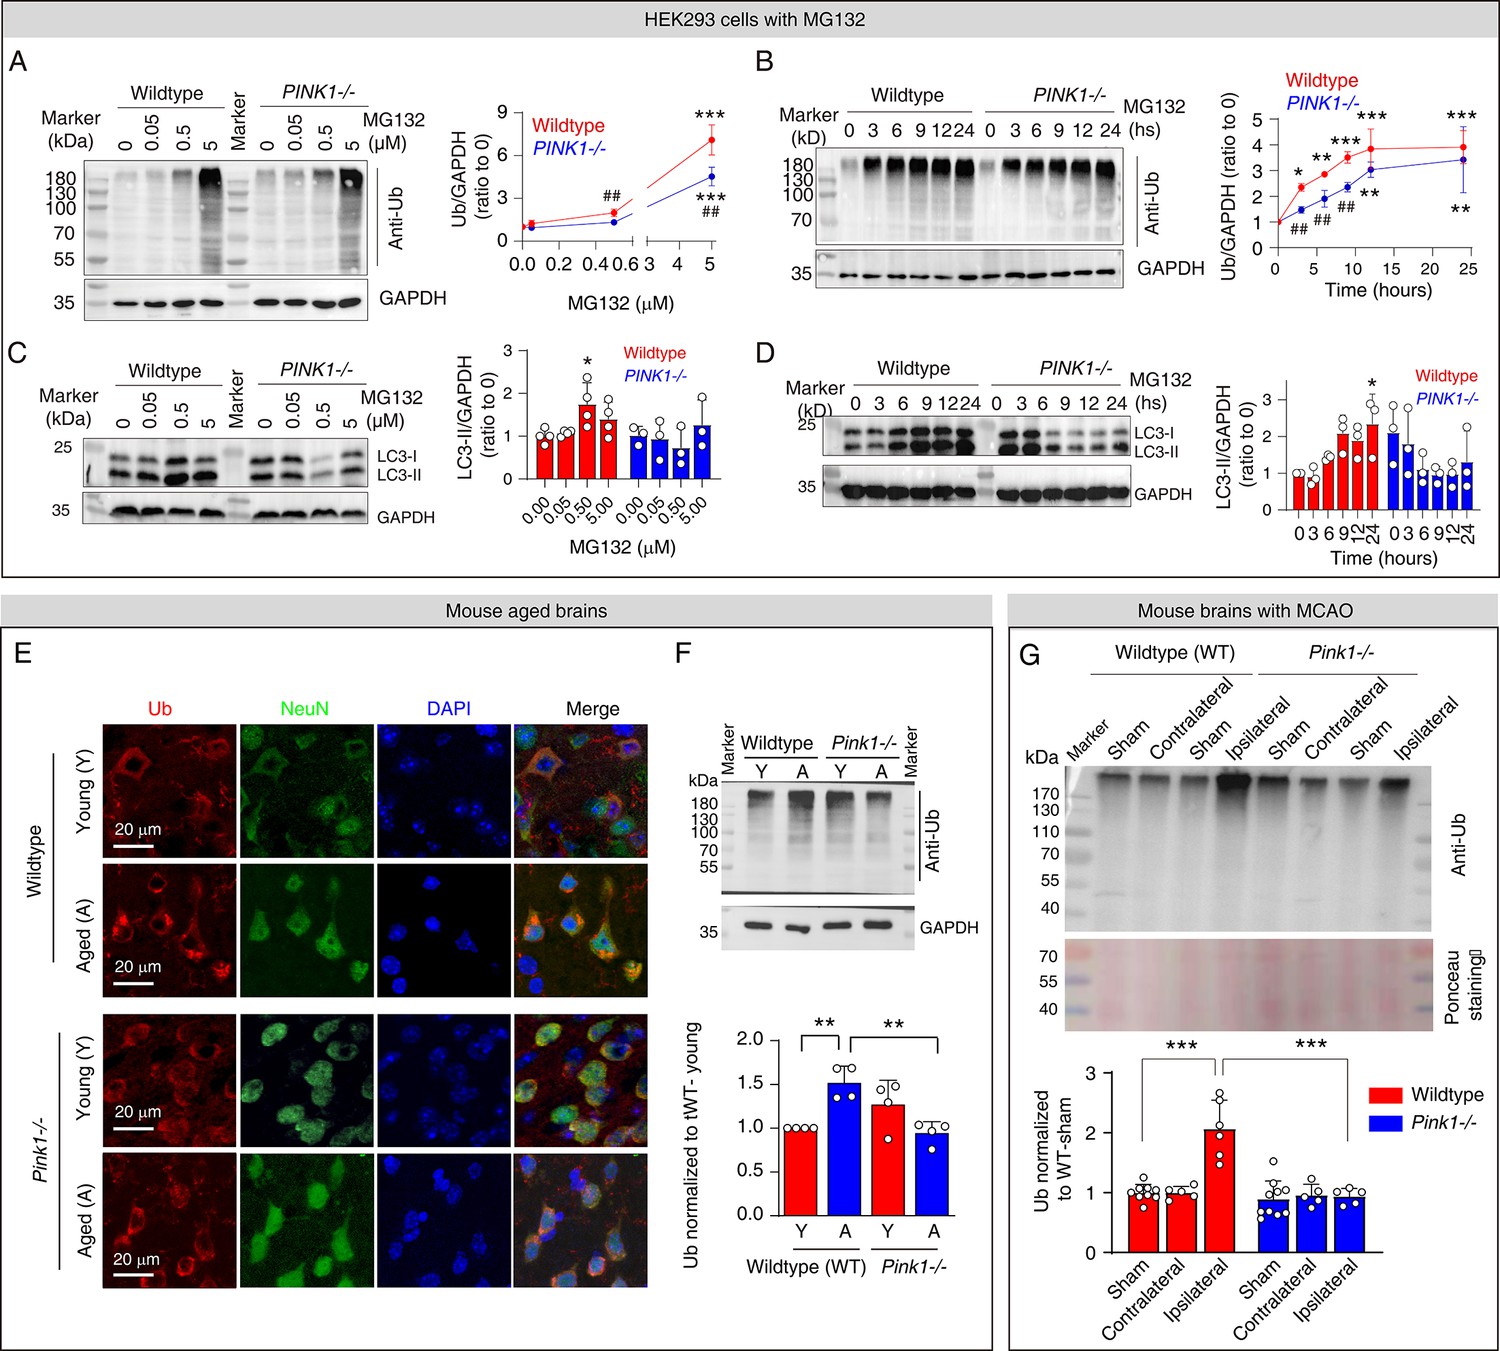
(A) Western blot analysis of ubiquitin levels in the insoluble protein fraction of HEK293 cells following the treatment with 0–5 µM MG132 for 8 hr. N=5; ***p<0.001 compared to 0 µM MG132; ##p<0.01 compared with wild-type cells, one-way ANOVA. (B) Western blot analysis of ubiquitin levels in the insoluble protein fraction of HEK293 cells following the treatment with 5 µM MG132 over 24 hr period. N=3; *p<0.05, **p<0.01, ***p<0.001 compared to 0 µM MG132; ##p<0.01 compared with wild-type cells, one-way ANOVA. (C) Western blot analysis of LC3 levels in HEK293 cells following the treatment with 0–5 µM MG132 for 8 hr. N=3–4; *P<0.05 compared to 0 µM MG132, one-way ANOVA. (D) Western blot analysis of LC3 levels in HEK293 cells following the treatment with 5 µM MG132 treatment over 24 hr. N=3; *p<0.05 compared to 0 µM MG132, one-way ANOVA. (E) Immunofluorescence staining of ubiquitin taken from layer III-IV in the neocortex of brains from young and aged wild-type and Pink1-/- mice. (F) Western blot analysis quantifying ubiquitin in the insoluble protein fraction of the cortex from young and aged mouse brains. N=4; **p<0.01, one-way ANOVA. (G) Western blot analysis of ubiquitin in the insoluble protein fraction of wild-type and Pink1-/- mouse brains subjected to middle cerebral artery occlusion (MCAO) for 2 hr followed by 24 hr of reperfusion. Comparison includes the sham-operated group (same procedure without occlusion). Locations of the analyzed regions (contralateral and ipsilateral) are indicated in Figure 1—figure supplement 1. N=5–9, ***p<0.001, one-way ANOVA.
-
Figure 4—source data 1
PDF file containing original western blots for Figure 4A, indicating the relevant bands and treatments.
- https://cdn.elifesciences.org/articles/103945/elife-103945-fig4-data1-v1.pdf
-
Figure 4—source data 2
Original files for western blot analysis displayed in Figure 4A.
- https://cdn.elifesciences.org/articles/103945/elife-103945-fig4-data2-v1.zip
-
Figure 4—source data 3
PDF file containing original western blots for Figure 4B, indicating the relevant bands and treatments.
- https://cdn.elifesciences.org/articles/103945/elife-103945-fig4-data3-v1.pdf
-
Figure 4—source data 4
Original files for western blot analysis displayed in Figure 4B.
- https://cdn.elifesciences.org/articles/103945/elife-103945-fig4-data4-v1.zip
-
Figure 4—source data 5
PDF file containing original western blots for Figure 4C, indicating the relevant bands and treatments.
- https://cdn.elifesciences.org/articles/103945/elife-103945-fig4-data5-v1.pdf
-
Figure 4—source data 6
Original files for western blot analysis displayed in Figure 4C.
- https://cdn.elifesciences.org/articles/103945/elife-103945-fig4-data6-v1.zip
-
Figure 4—source data 7
PDF file containing original western blots for Figure 4D, indicating the relevant bands and treatments.
- https://cdn.elifesciences.org/articles/103945/elife-103945-fig4-data7-v1.pdf
-
Figure 4—source data 8
Original files for western blot analysis displayed in Figure 4D.
- https://cdn.elifesciences.org/articles/103945/elife-103945-fig4-data8-v1.zip
-
Figure 4—source data 9
PDF file containing original western blots for Figure 4F, indicating the relevant bands and treatments.
- https://cdn.elifesciences.org/articles/103945/elife-103945-fig4-data9-v1.pdf
-
Figure 4—source data 10
Original files for western blot analysis displayed in Figure 4F.
- https://cdn.elifesciences.org/articles/103945/elife-103945-fig4-data10-v1.zip
-
Figure 4—source data 11
PDF file containing original western blots for Figure 4G, indicating the relevant bands and treatments.
- https://cdn.elifesciences.org/articles/103945/elife-103945-fig4-data11-v1.pdf
-
Figure 4—source data 12
Original files for western blot analysis displayed in Figure 4G.
- https://cdn.elifesciences.org/articles/103945/elife-103945-fig4-data12-v1.zip
Figure 5 with 4 supplements
Proteomics analysis of the mouse hippocampus at 30-and 70 days post-transfection.
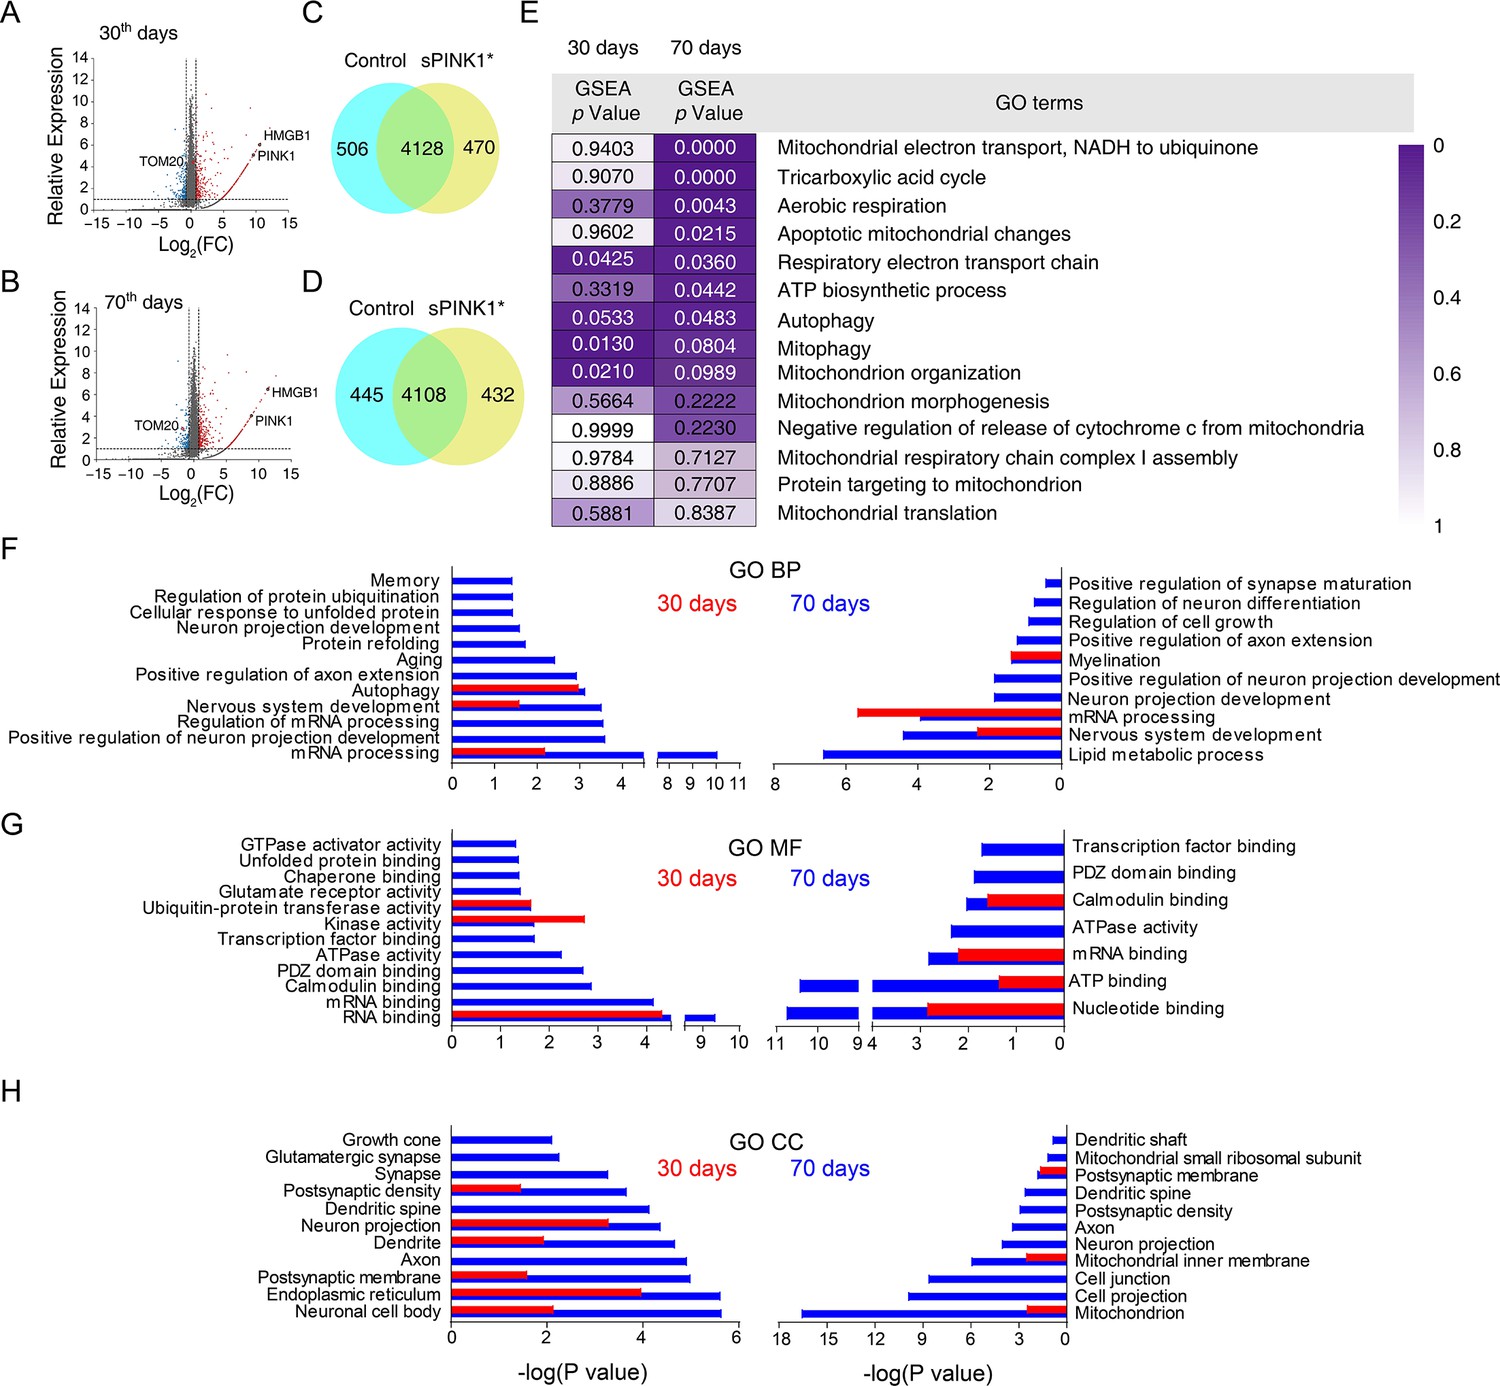
(A and B) Volcano plot of the proteomics data from the mouse brains at 30- and 70 days post-transfection, respectively. (C and D) Proteomic analysis revealed differential set of proteins upon sPINK1* over-expression. (E) The GSEA analysis of mitochondria-related GO terms based on the proteomic data, with the statistical significance values color-coded. (F–H) Gene ontology (GO) term analysis of the proteomics data for biological process (BP) (F), molecular function (MF) (G), and cellular component (CC) (H), respectively. Red columns denote the data at 30 days and blue columns at 70 days post-transfection. Left panels denote proteins up-regulated by twofold or more, and right panels down-regulated by 50% or more.
-
Figure 5—source data 1
Excel file containing original proteomic data for Figure 5 indicating the relative protein expression levels upon sPINK1 over-expression in mouse hippocampus.
- https://cdn.elifesciences.org/articles/103945/elife-103945-fig5-data1-v1.xlsx
Figure 5—figure supplement 1
Overexpression of sPINK1 induced protein aggregation in SH-SY5Y cells.
(A) Representative images of immunofluorescent staining of ubiquitin at 24 hr after the treatment of 5 μM MG132. (B) Representative images of immunofluorescent staining of ubiquitin at 24 hr after the overexpression of sPINK1 and Ub/S65E.
Figure 5—figure supplement 2
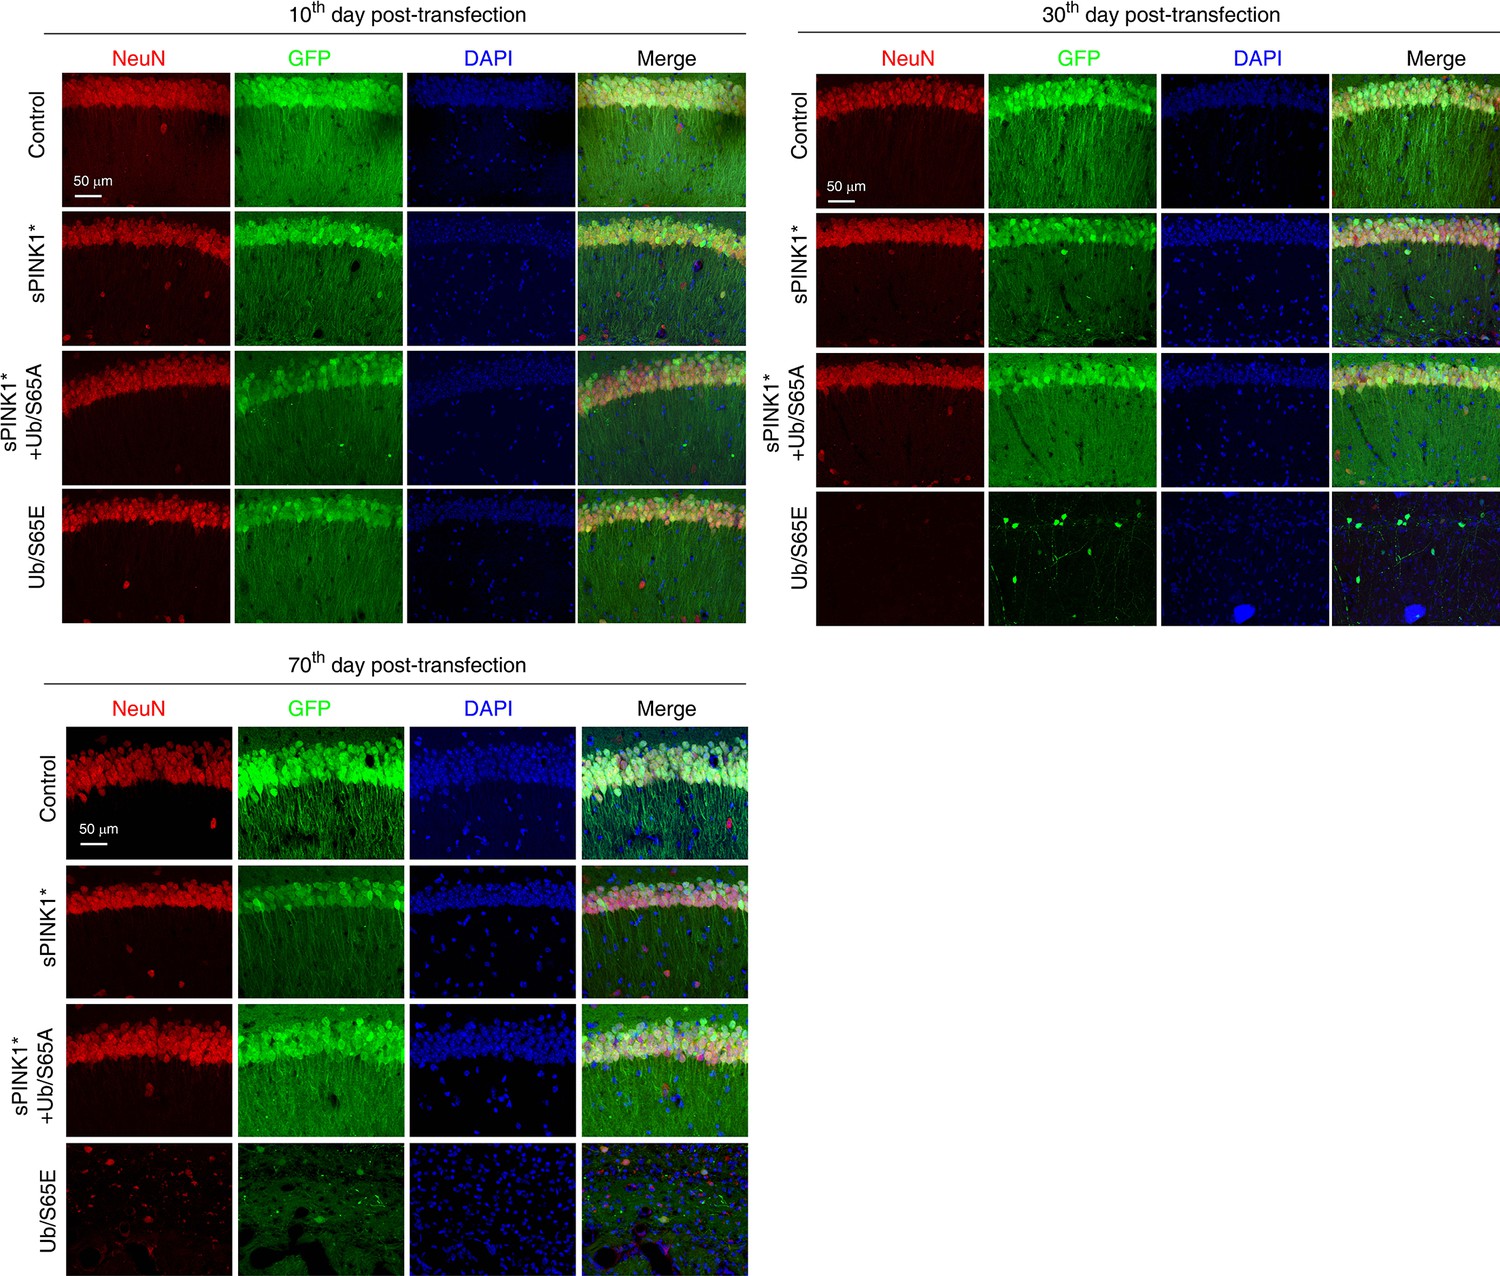
Representative immunofluorescence images of the hippocampus CA1 regions using anti-adeno-associated virus NeuN antibody.
Mice were sacrificed at 10, 30, and 70 days post-transfection. The GFP was introduced to monitor the neurons with AAV transfection.
Figure 5—figure supplement 3
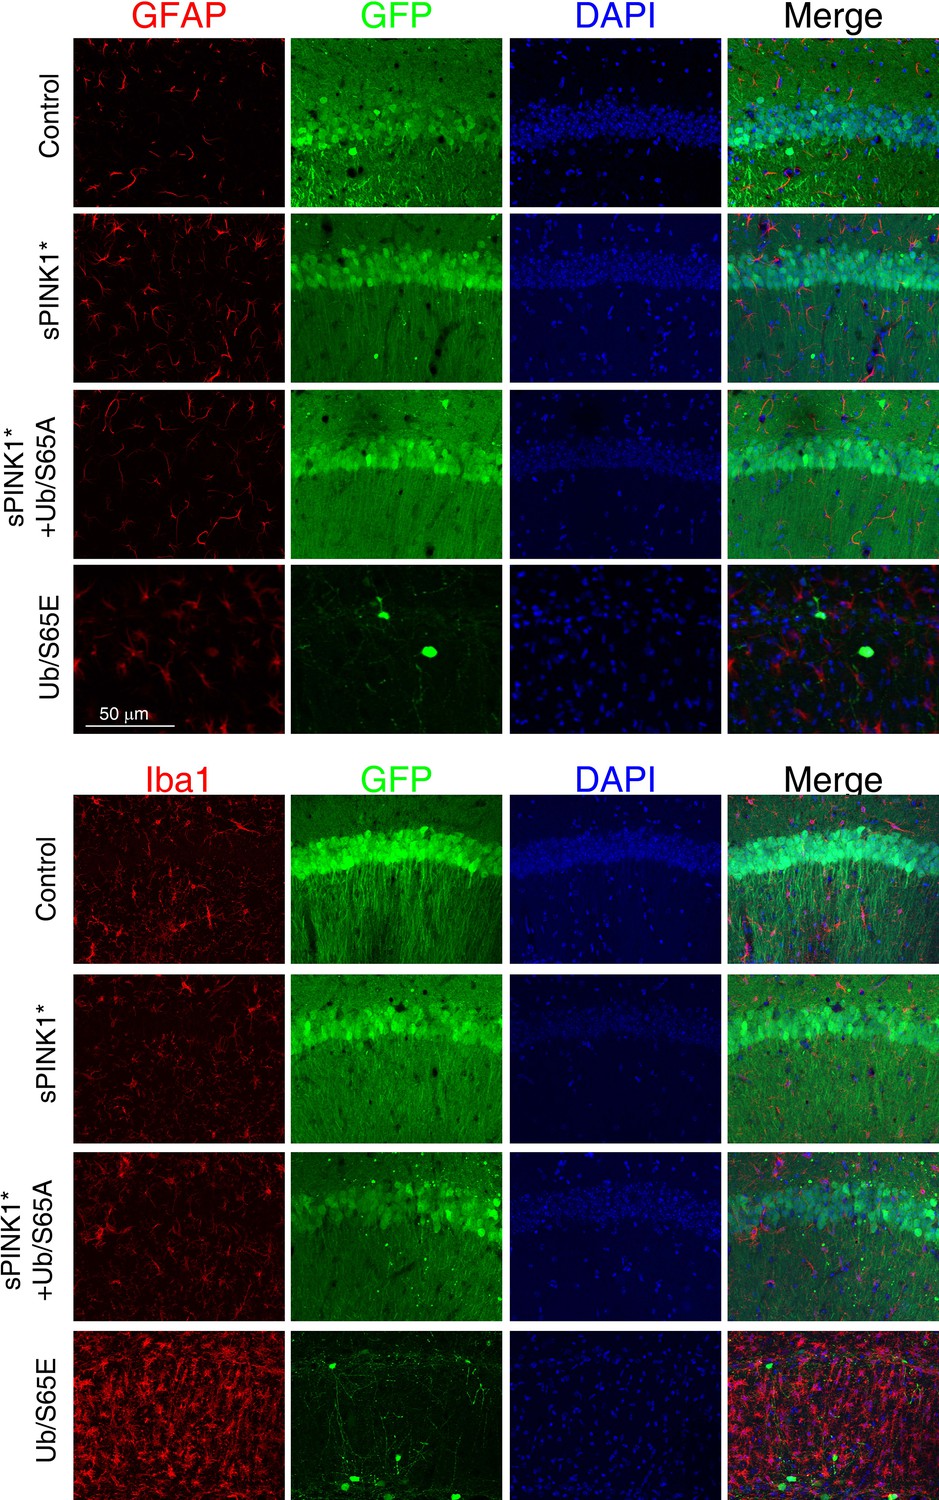
Representative immunofluorescence images of the hippocampus CA1 regions using anti-GFAP and anti-Iba1 antibody.
Mice were sacrificed at 30 days post-transfection. GFP was introduced to the neurons with adeno-associated virus (AAV) transfection.
Figure 5—figure supplement 4
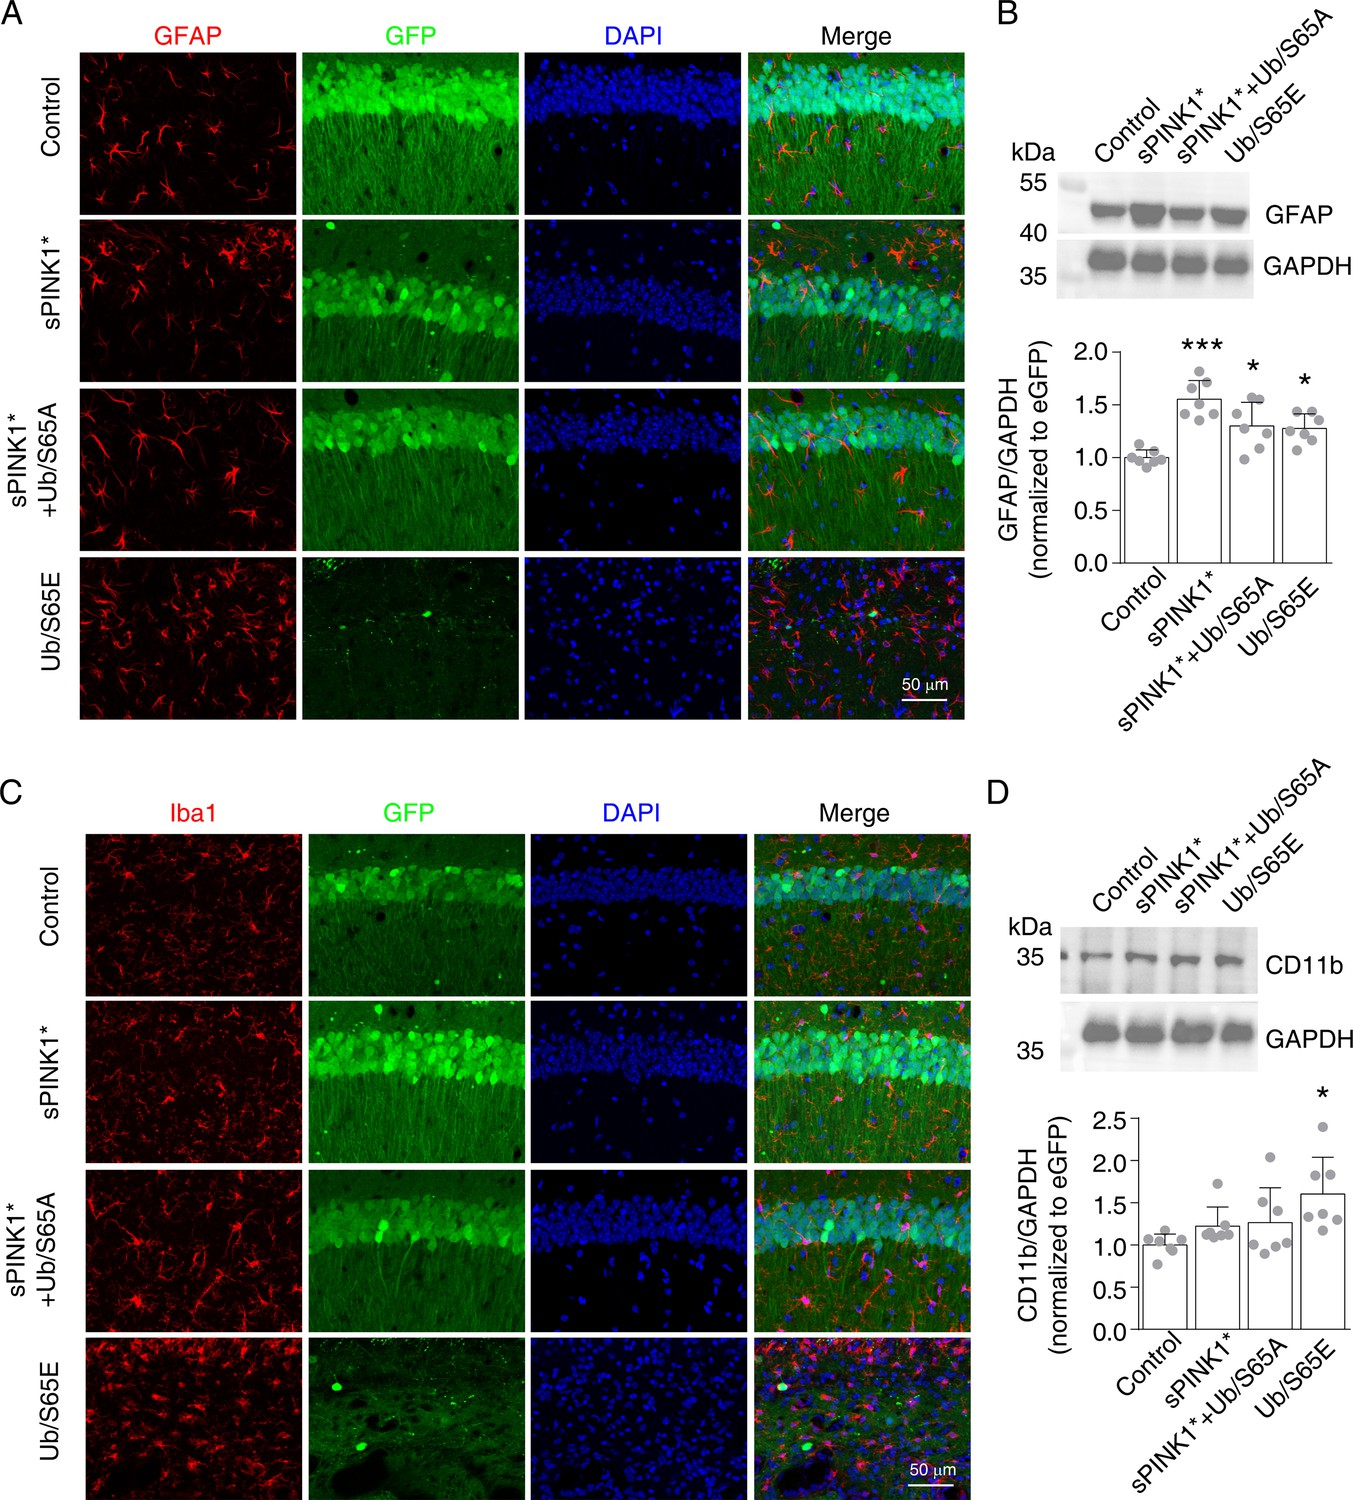
Overexpression of sPINK1* induced gliosis at 70 days post-transfection.
(A) Representative immunofluorescence images of the hippocampus CA1 regions using anti-GFAP antibody. (B) Western blot analysis of GFAP protein. *p<0.05, ***p<0.001, compared with control, one-way ANOVA. (C) Representative immunofluorescence images of hippocampus CA1 regions immunofluorescent using anti-Iba1 antibody. (D) Western blot analysis of CD11b protein level. *p<0.05, compared with control, one-way ANOVA. GFP was introduced to the neurons with adeno-associated virus (AAV) transfection.
Figure 6 with 1 supplement
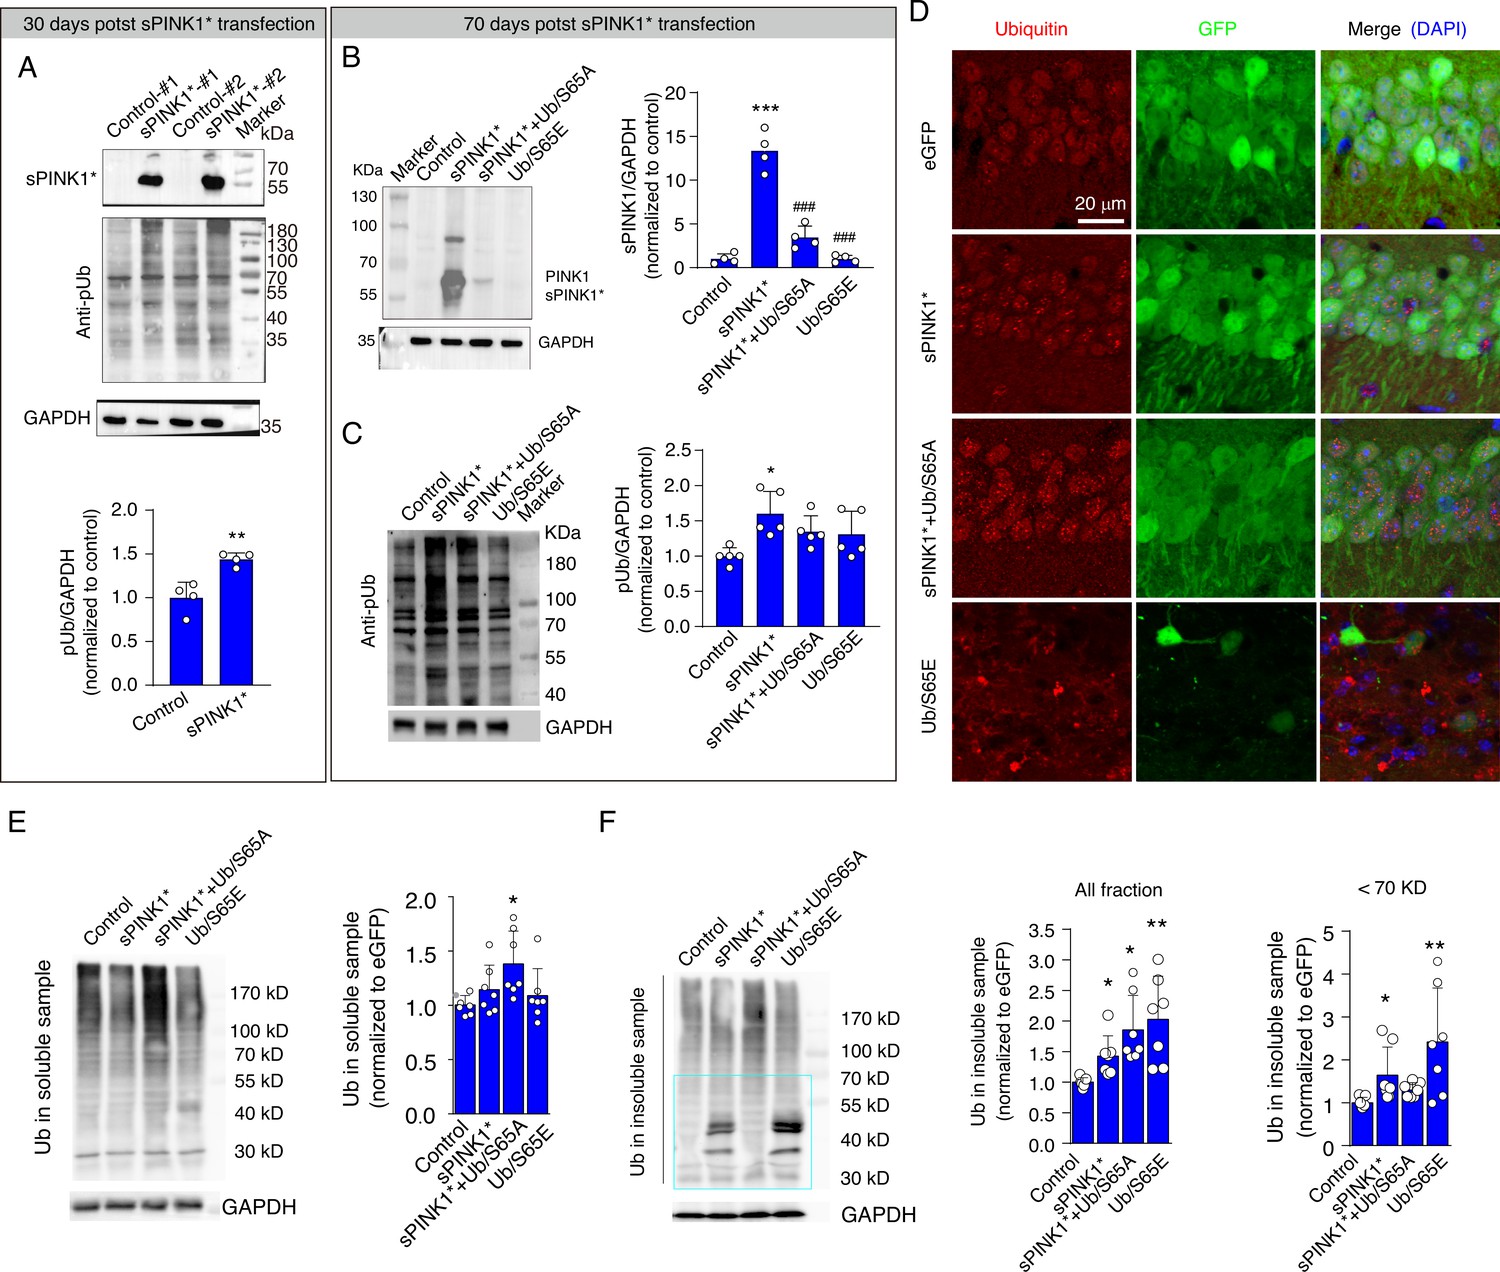
Elevated phosphorylated ubiquitin (pUb) levels induce protein aggregation in mouse hippocampal neurons.
(A) Western blot analysis showing the levels of PINK1 and pUb in mouse hippocampus at 30 days post-transfection. N=4; **p<0.01 compared with control, one-way ANOVA. (B) Western blot analysis of PINK1 in the mouse hippocampus at 70 days post-transfection. N=4; **p<0.001 compared with control; ###p<0.001 compared with sPINK1, one-way ANOVA. (C) Western blot analysis of pUb in the mouse hippocampus at 70 days post-transfection. N=5; *p<0.05 compared with control, one-way ANOVA. (D) Representative immunofluorescence images depicting ubiquitin staining in the CA1 neurons of the mouse hippocampus at 70 days post-transfection. (E) Western blot analysis of ubiquitin in the soluble protein fraction of hippocampal lysates at 70 days post-transfection. N=7; *p<0.05 compared with control, one-way ANOVA. (F) Western blot analysis of ubiquitin in the insoluble protein fraction of hippocampal lysates at 70 days post-transfection. Quantitative analysis was conducted for total protein at all molecular weight and for proteins with molecular weight <70 kDa. N=7; *p<0.05, **p<0.001 compared with control, one-way ANOVA.
-
Figure 6—source data 1
PDF file containing original western blots for Figure 6A, indicating the relevant bands and treatments.
- https://cdn.elifesciences.org/articles/103945/elife-103945-fig6-data1-v1.pdf
-
Figure 6—source data 2
Original files for western blot analysis displayed in Figure 6A.
- https://cdn.elifesciences.org/articles/103945/elife-103945-fig6-data2-v1.zip
-
Figure 6—source data 3
PDF file containing original western blots for Figure 6B, indicating the relevant bands and treatments.
- https://cdn.elifesciences.org/articles/103945/elife-103945-fig6-data3-v1.pdf
-
Figure 6—source data 4
Original files for western blot analysis displayed in Figure 6B.
- https://cdn.elifesciences.org/articles/103945/elife-103945-fig6-data4-v1.zip
-
Figure 6—source data 5
PDF file containing original western blots for Figure 6C, indicating the relevant bands and treatments.
- https://cdn.elifesciences.org/articles/103945/elife-103945-fig6-data5-v1.pdf
-
Figure 6—source data 6
Original files for western blot analysis displayed in Figure 6C.
- https://cdn.elifesciences.org/articles/103945/elife-103945-fig6-data6-v1.zip
-
Figure 6—source data 7
PDF file containing original western blots for Figure 6E, indicating the relevant bands and treatments.
- https://cdn.elifesciences.org/articles/103945/elife-103945-fig6-data7-v1.pdf
-
Figure 6—source data 8
Original files for western blot analysis displayed in Figure 6E.
- https://cdn.elifesciences.org/articles/103945/elife-103945-fig6-data8-v1.zip
-
Figure 6—source data 9
PDF file containing original western blots for Figure 6F, indicating the relevant bands and treatments.
- https://cdn.elifesciences.org/articles/103945/elife-103945-fig6-data9-v1.pdf
-
Figure 6—source data 10
Original files for western blot analysis displayed in Figure 6F.
- https://cdn.elifesciences.org/articles/103945/elife-103945-fig6-data10-v1.zip
Figure 6—figure supplement 1
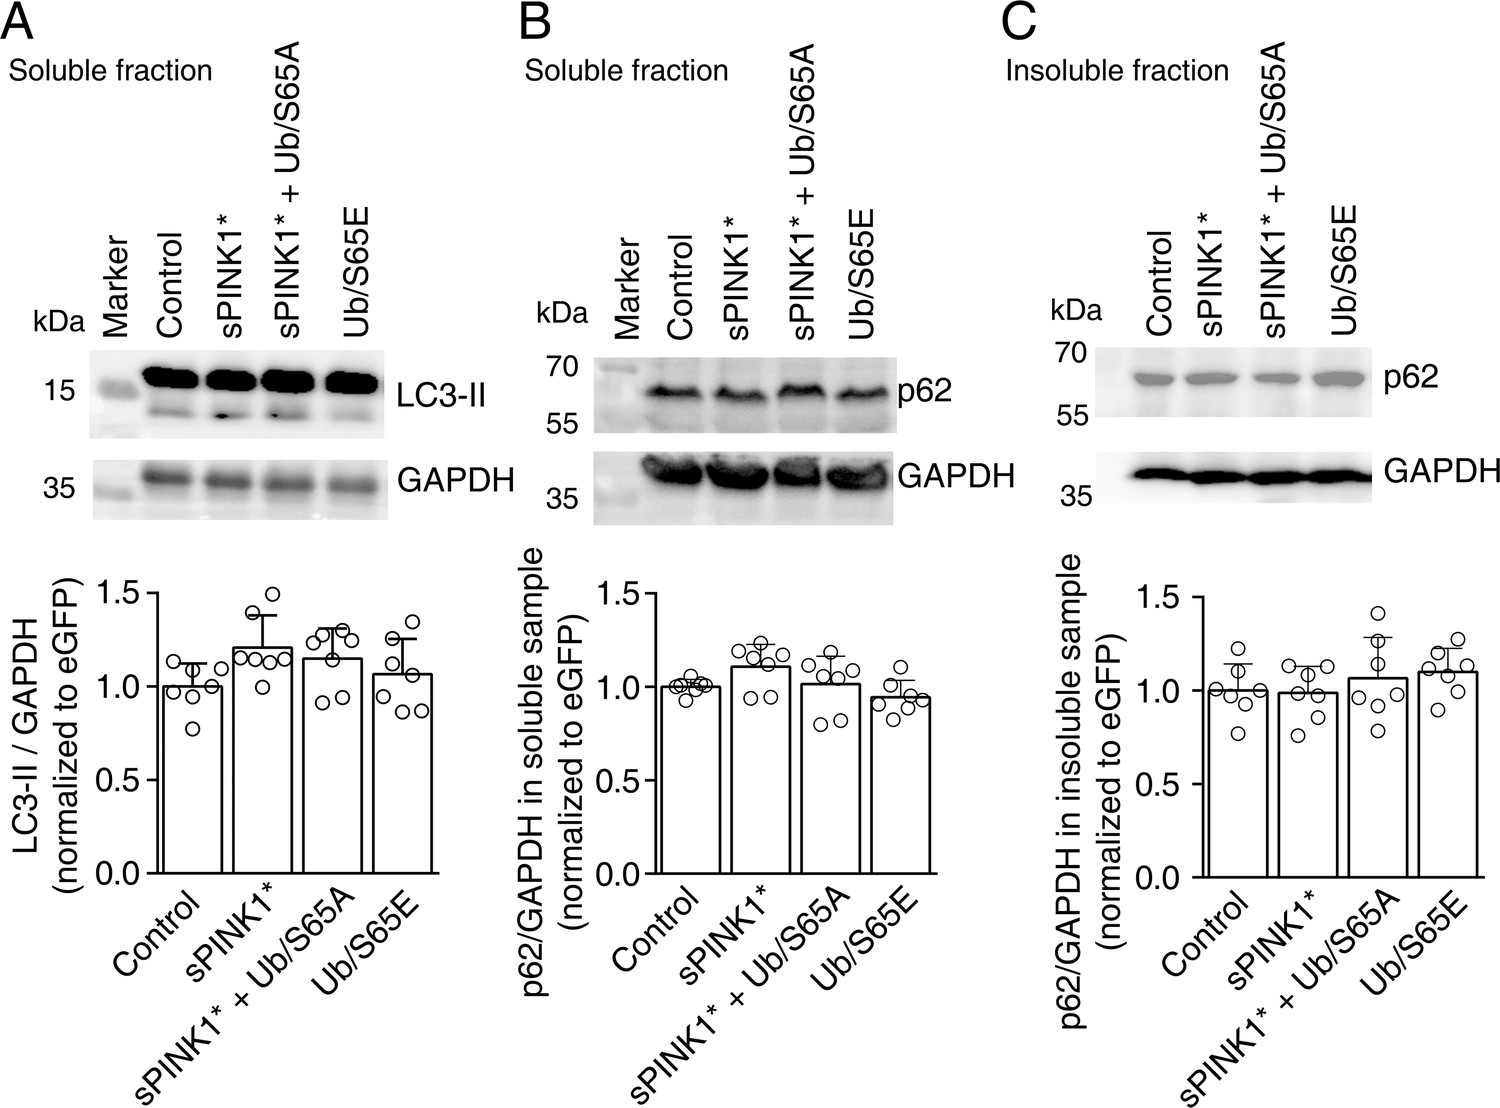
Elevated phosphorylated ubiquitin (pUb) level in mouse hippocampus neurons did not perturb the autophagy flow.
Mice were sacrificed on the 70th day post-transfection. The proteins from mouse hippocampus were pooled as soluble samples (A and B) and insoluble sample (C). (A) The level of LC3 in the soluble sample upon adeno-associated virus (AAV) transfection of the indicated protein. (B and C) The level of p62 in the soluble (B) and insoluble (C) fractions, respectively. Western blot analysis revealed no statistical differences between the transfections of the different set of proteins.
Figure 7
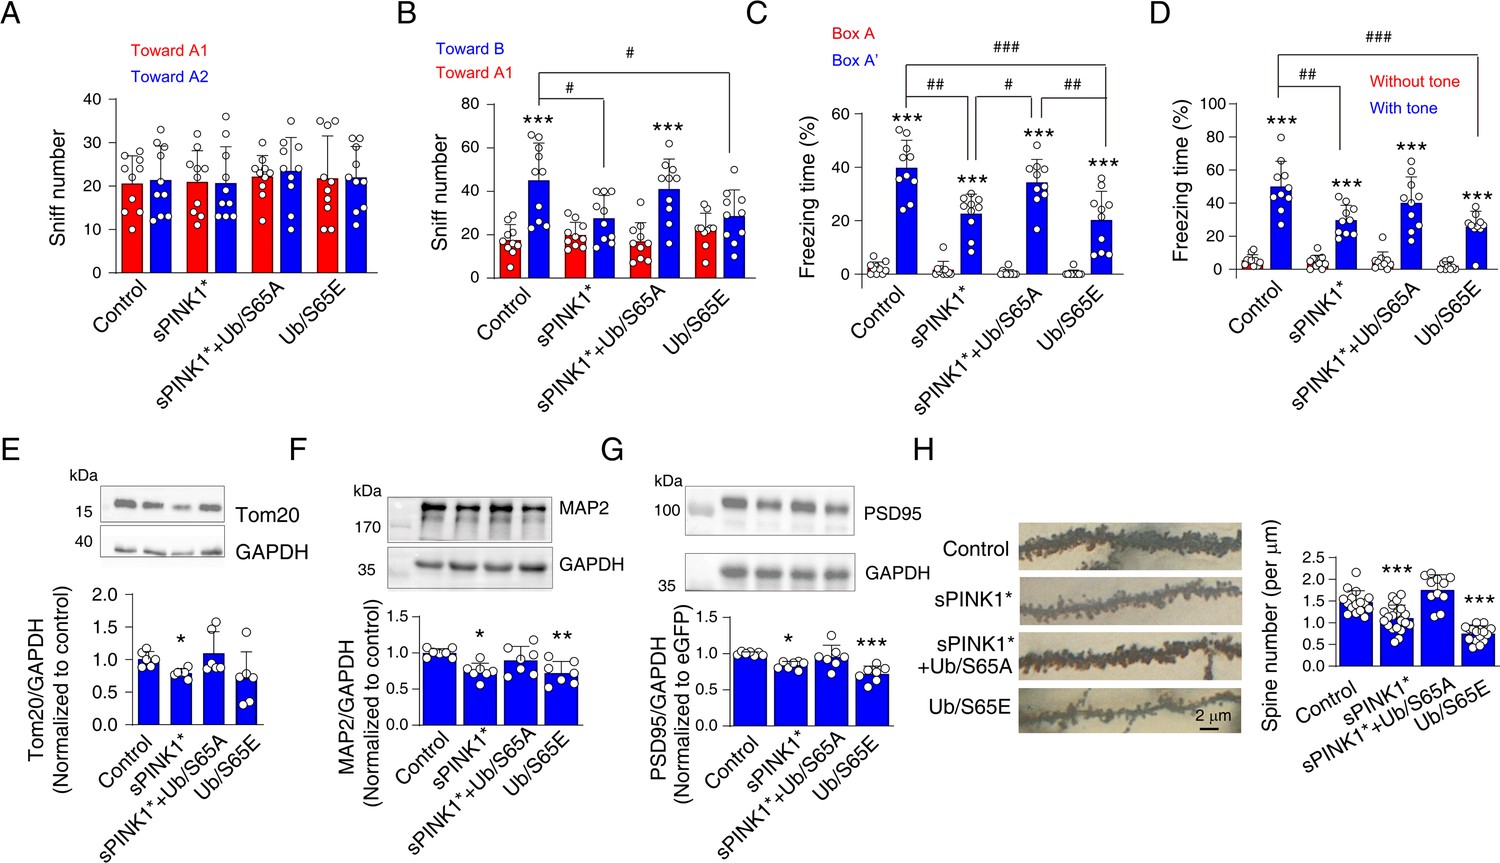
Elevated phosphorylated ubiquitin (pUb) levels induce neuronal injury in mouse brains at 70 days post-transfection.
(A) Novel object recognition test showing the number of sniffs toward two distinct objects in the training phase. N=10. (B) Novel object recognition test showing the number of sniffs toward the old object (A1) and the novel object (B) in the testing phase. N=10; ***p<0.001 compared with the sniff number toward A1 object, paired t-test. #p<0.05, one-way ANOVA. (C, D) The percentage of freezing time in fear conditioning tests for the evaluation of contextual (C) and cued (D) memory. For contextual memory, the mice were put in the box and received foot shock. For cued memory, the mice were put in a new box, and the same tone accompanying the foot shock was applied. N=10; ***p<0.001 compared with Box A (contextual) or absence of tone (cued), paired t-test. #p<0.05, ##p<0.01, ###p<0.001, one-way ANOVA. (E–G) Western blot analyses to assess levels of mitochondrial, dendritic, and synaptic markers: Tom20 (E), MAP2 (F), and PSD95 (G) in the mouse hippocampus. N=7; *p<0.05, **p<0.01, ***p<0.001 compared with control, one-way ANOVA. (H) Golgi staining to assess the number of neuronal spines in hippocampal neurons. The left panel shows representative images, and the right panel provides a statistical analysis of spine density on hippocampal neuron dendrites. N=11–20 dendrites from three mice for each group. ***p<0.001 compared with control, one-way ANOVA.
-
Figure 7—source data 1
PDF file containing original western blots for Figure 7E, indicating the relevant bands and treatments.
- https://cdn.elifesciences.org/articles/103945/elife-103945-fig7-data1-v1.pdf
-
Figure 7—source data 2
Original files for western blot analysis displayed in Figure 7E.
- https://cdn.elifesciences.org/articles/103945/elife-103945-fig7-data2-v1.zip
-
Figure 7—source data 3
PDF file containing original western blots for Figure 7F, indicating the relevant bands and treatments.
- https://cdn.elifesciences.org/articles/103945/elife-103945-fig7-data3-v1.pdf
-
Figure 7—source data 4
Original files for western blot analysis displayed in Figure 7F.
- https://cdn.elifesciences.org/articles/103945/elife-103945-fig7-data4-v1.zip
-
Figure 7—source data 5
PDF file containing original western blots for Figure 7G, indicating the relevant bands and treatments.
- https://cdn.elifesciences.org/articles/103945/elife-103945-fig7-data5-v1.pdf
-
Figure 7—source data 6
Original files for western blot analysis displayed in Figure 7G.
- https://cdn.elifesciences.org/articles/103945/elife-103945-fig7-data6-v1.zip
Figure 8
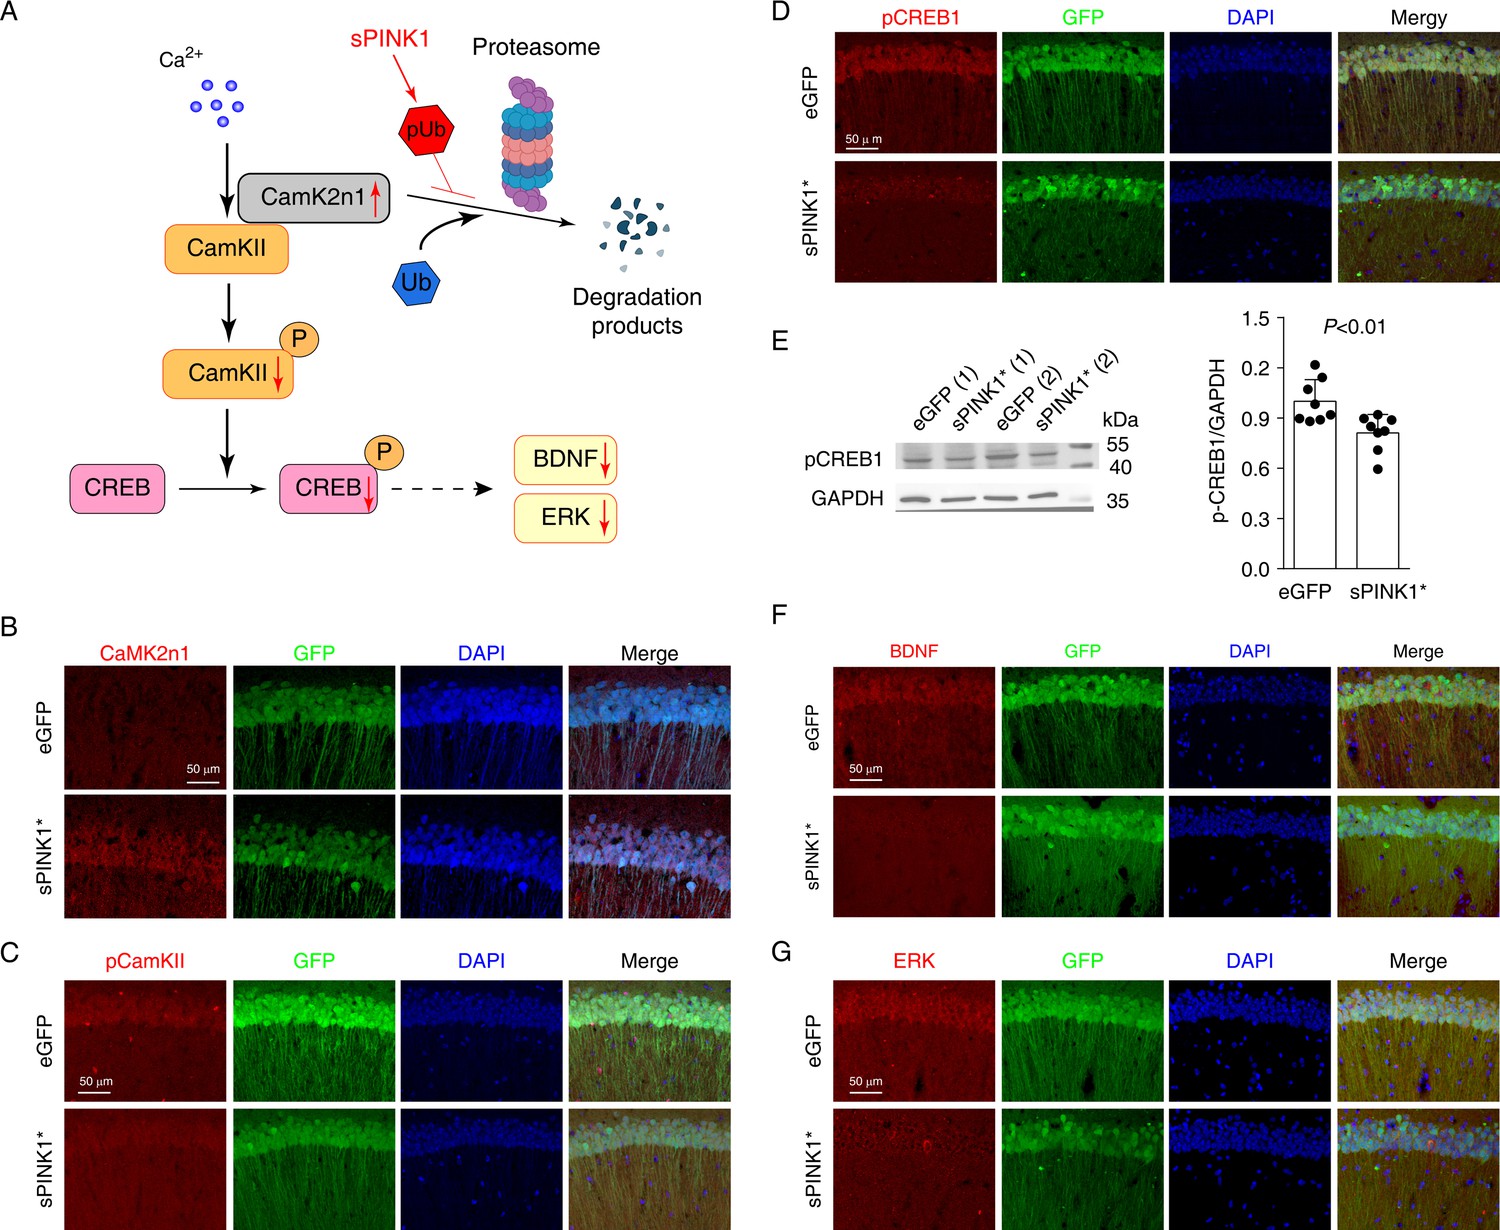
Elevated phosphorylated ubiquitin (pUb) levels inhibit CamKII-CREB signaling in mouse hippocampal neurons.
(A) An illustration of the inhibitory effect on CamK2n1 in the CamKII-CREB1 signaling pathway. (B–D) Immunofluorescence staining of CamK2n1 (B), pCamKII (C), and pCREB1 (D) in the CA1 region of hippocampus of mice at 70 days post-transfection. (E) Western blot analysis of pCREB1 in mouse hippocampi. N=8, independent t-test. (F and G) The immunofluorescence staining of BDNF (F) and ERK (G) in the CA1 region of mouse hippocampus.
-
Figure 8—source data 1
PDF file containing original western blots for Figure 8E, indicating the relevant bands and treatments.
- https://cdn.elifesciences.org/articles/103945/elife-103945-fig8-data1-v1.pdf
-
Figure 8—source data 2
Original files for western blot analysis displayed in Figure 8E.
- https://cdn.elifesciences.org/articles/103945/elife-103945-fig8-data2-v1.zip
Tables
Appendix 1—key resources table
| Reagent type (species) or resource | Designation | Source or reference | Identifiers | Additional information |
|---|---|---|---|---|
| Genetic reagent (Mus musculus) | eGFP(rAAV-EF1a-EGFP-WPRE-hGH-pA) | This paper | sPINK1* and GFP | 5.41E+12vg/ml |
| Genetic reagent (Mus musculus) | eGFP +sPINK1(rAAV-EF1a-PINK1(102–581) P2A-EGFP-WPRE-hGH pA) | This paper | sPINK1* and GFP | 2.52E+12vg/ml |
| Genetic reagent (Mus musculus) | eGFP +sPINK1+Ub/S65A(rAAV-EF1a-UbS65A-P2A-PINK1(102–581) P2A-EGFP-WPRE-hGH pA) | This paper | Ub/S65A, sPINK1, and GFP | 2.05E+12vg/ml |
| Genetic reagent (Mus musculus) | eGFP +Ub/S65E(rAAV-EF1a-UbS65E-P2A-EGFP-WPRE-hGH pA) | This paper | Ub/S65E and GFP | 2.16E+12vg/ml |
| Cell line (Homo sapiens) | HEK293 cells | National Collection of Authenticated Cell Cultures | SCSP-5500 | |
| Cell line (Homo sapiens) | SH-SY5Y | National Collection of Authenticated Cell Cultures | TCHu97 | |
| Antibody | mouse anti-ubiquitin antibody | Santa Cruz Biotechnology | SC-8017 | WB 1:800; IF 1:200 |
| Antibody | rabbit anti-pUb antibody | Millipore | ABS1513 | WB 1:1000; IF 1:200 |
| Antibody | rabbit anti-PINK1 antibody | Novus | BC100-494 | WB 1:1000; IF 1:200 |
| Antibody | mouse anti-GFAP antibody | CST | #3670 | WB 1:1000; IF 1:1000 |
| Antibody | rabbit anti-Iba1 antibody | FUJIFILM Wako Pure Chemical Corporation | 019–19741 | WB 1:1000; IF 1:1000 |
| Antibody | rabbit anti-NeuN antibody | CST | #36662 | WB 1:1000; IF 1:1000 |
| Antibody | mouse anti-Aβ | Biolegend | SIG-39320 | IF 1:500 |
| Antibody | rabbit anti-pCREB antibody | ABclonal Technology | AP0019 | WB 1:1000; IF 1:1000 |
| Antibody | rabbit anti-ERK1/2 antibody | ABclonal Technology | E-AB-31374 | IF 1:200 |
| Antibody | rabbit anti-pCamKII antibody | ABclonal Technology | AP0255 | IF 1:200 |
| Antibody | rabbit anti-CamK2n1 | Thermo Fisher | PA5-23740 | IF 1:200 |
| Antibody | and rabbit anti-BDNF antibody | ABclonal Technology | A11028 | IF 1:200 |
| Antibody | rabbit anti-Tom20 antibody | CST | 42406 S | WB 1:1000 |
| Antibody | rabbit anti-CD11b antibody | Abcam | ab133357 | WB 1:1000 |
| Antibody | mouse anti-GAPDH antibody | Proteintech | 60004–1-Ig | WB 1:5000 |
| Antibody | mouse anti-FLAG antibody | TransGen Biotech | HT201-01 | WB 1:10000 |
| Antibody | mouse anti-MAP2 antibody | Millipore | AB5622 | WB 1:2000 |
| Antibody | rabbit anti-PSD95 antibody | CST | 3450 S | WB 1:1000 |
| Antibody | rabbit anti-GFP antibody | Abcam | ab183735 | WB 1:1000 |
| Antibody | rabbit anti-LC3 antibody | Sigma | L7543 | WB 1:1000 |
| Antibody | rabbit anti-p62 antibody | Abcam | ab109012 | WB 1:1000 |
| Antibody | HRP-conjugated goat anti-rabbit IgG | Jackson ImmunoResearch | 111-035-003 | WB 1:10000 |
| Antibody | HRP-conjugated goat anti-mouse IgG | CST | 7076 S | WB 1:3000 |
| Antibody | Cy3 AffiniPure Donkey Anti-Mouse IgG (H+L) | Jackson ImmunoResearch | 715-605-150 | IF 1:200 |
| Antibody | Cy3 AffiniPure Goat Anti-Rabbit IgG (H+L) | Jackson ImmunoResearch | 111-165-003 | IF 1:200 |
| Antibody | Alexa Fluor488 AffiniPure Goat Anti-Rabbit IgG (H+L) | Jackson ImmunoResearch | 111-545-003 | IF 1:200 |
| Antibody | Alexa Fluor488 AffiniPure Goat Anti-Rabbit IgG (H+L) | Jackson ImmunoResearch | 715-545-150 | IF 1:200 |
| Recombinant DNA reagent | PRK5/sPINK1/IRES/EGFP(plasmid) | This paper | sPINK1* and GFP | |
| Recombinant DNA reagent | PRK5/EGFP(plasmid) | This paper | GFP | |
| Recombinant DNA reagent | PRK5/UbS65E/IRES/EGFP(plasmid) | This paper | Ub/S65E and GFP | |
| Recombinant DNA reagent | PRK5/sPINK1-P2A-UbS65A/IRES/EGFP(plasmid) | This paper | Ub/S65A, sPINK1, and GFP | |
| Recombinant DNA reagent | FLAG-Ub/48 K(plasmid) | This paper | Ub/48 K | |
| Recombinant DNA reagent | pcDNA3.1/sPINK1(plasmid) | This paper | sPINK1* and GFP | |
| Recombinant DNA reagent | pcDNA3.1/PINK1(plasmid) | This paper | PINK1 | |
| Recombinant DNA reagent | pRK5-sPINK1(K219A,D362A,D384A)-IRES-EGFP(plasmid) | This paper | sPINK1(K219A,D362A,D384A) and GFP | |
| Recombinant DNA reagent | pRK5-PINK1-IRES-EGFP(plasmid) | This paper | PINK1 and GFP | |
| Recombinant DNA reagent | pIRES2-Ub-GG-sPINK1-EGFP(plasmid) | This paper | Ub-GG-sPINK1+EGFP | |
| Recombinant DNA reagent | pEGFP-N2-Ub-R-GFP(plasmid) | This paper | Ub-R-GFP | |
| Commercial assay or kit | Dulbecco’s modified essential medium (DMEM) | Gibco by Thermo Fisher Scientific | C11995500BT | |
| Commercial assay or kit | Fetal bovine serum | Zhejiang Tianhang Biotechnology | 11011–8611 | |
| Commercial assay or kit | Fetal bovine serum | Gibco by Thermo Fisher Scientific | 10099–141 | |
| Commercial assay or kit | MEM Non-Essential Amino Acids | Gibco by Thermo Fisher Scientific | 11140–050 | |
| Commercial assay or kit | Lipo3000 | Invitrogen Corp. | L3000001 | |
| Commercial assay or kit | Opti-MEM | Gibco by Thermo Fisher Scientific | 31985062 | |
| Commercial assay or kit | purple crystal | Yuanhang Reagent Factory | YHSJ-01–92 | |
| Commercial assay or kit | ProLong Gold Antifade Mountant with DAPI | Invitrogen Corp. | P36931 | |
| Commercial assay or kit | ECL kit | MultiSciences Biotech | P1425 | |
| Commercial assay or kit | Ponceau staining solution | Beyotime Biotechnology Research Institute | P0022 | |
| Commercial assay or kit | RIPA lysis buffer | Beyotime Biotechnology Research Institute | P0013B | |
| Commercial assay or kit | protease inhibitor | Beyotime Biotechnology Research Institute | P1005 | |
| Commercial assay or kit | phosphatase inhibitor | Beyotime Biotechnology Research Institute | P1081 | |
| Commercial assay or kit | Ponceau staining solution | Beyotime Biotechnology Research Institute | P0022 | |
| Commercial assay or kit | BCA protein assay kit | Beyotime Biotechnology Research Institute | P0009 | |
| Commercial assay or kit | MG132 | MedChemExpress | HY-13259 | |
| Commercial assay or kit | Puromycin | Thermo Fisher Scientific | A1113802 | |
| Commercial assay or kit | bafilomycin A1 (BALA) | Sigma-Aldrich | 508409 | |
| Commercial assay or kit | Golgi-cox staining solution | Servicebio | G1069 | |
| Commercial assay or kit | Sudan black B | Aladdin Biochemical Technology Co. | S109070-25g, | |
| Commercial assay or kit | protein kinase | Sangon Biotech (Shanghai) Co. | B600452 | |
| Commercial assay or kit | Streptavidin | VWR Life Science | 97062–808 |
Additional files
Download links
A two-part list of links to download the article, or parts of the article, in various formats.
Downloads (link to download the article as PDF)
Open citations (links to open the citations from this article in various online reference manager services)
Cite this article (links to download the citations from this article in formats compatible with various reference manager tools)
Elevated ubiquitin phosphorylation by PINK1 contributes to proteasomal impairment and promotes neurodegeneration
eLife 14:RP103945.
https://doi.org/10.7554/eLife.103945.4


