Targeting SLC7A11-mediated cysteine metabolism for the treatment of trastuzumab-resistant HER2-positive breast cancer
- Department of Oncology, The First Affiliated Hospital of Nanjing Medical University, China
- Gusu School, Suzhou Municipal Hospital, The Affiliated Suzhou Hospital of Nanjing Medical University, China
- Department of General, Visceral and Pediatric Surgery, University Medical Center Göttingen, Germany
- Department of General Surgery, The First Affiliated Hospital of Nanjing Medical University, China
- Jiangsu Key Lab of Cancer Biomarkers, Prevention and Treatment, Collaborative Innovation Center for Personalized Cancer Medicine, Nanjing Medical University, China
Figures
Figure 1 with 1 supplement
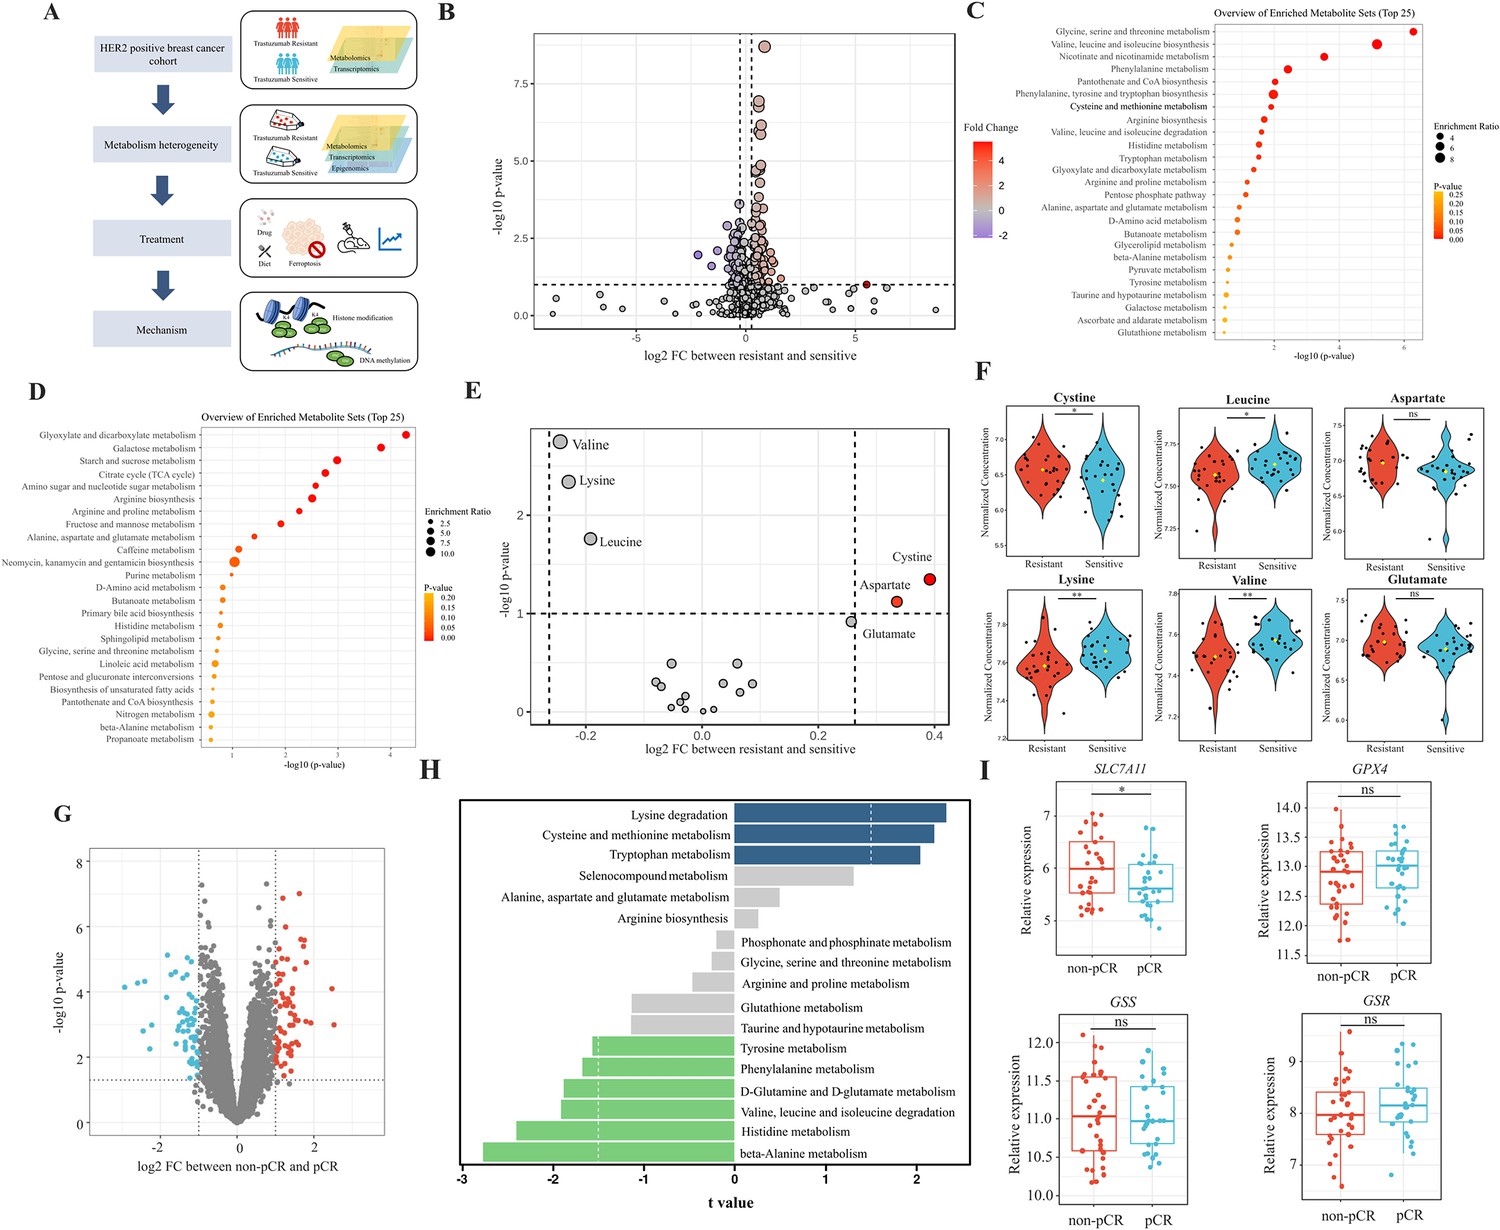
Analyses of amino acids metabolic patterns in trastuzumab primary-resistant and sensitive human epidermal growth factor receptor 2 (HER2)-positive breast cancer patients.
(A) Workflow of analyses performed in this study. (B) Volcano plot of different circulating metabolites in the comparison between trastuzumab primary-resistant and sensitive patients. (C) Enrichment analysis of circulating metabolites downregulated in trastuzumab primary-resistant patients. (D) Enrichment analysis of circulating metabolites upregulated in trastuzumab primary-resistant patients. (E, F) Volcano plot (E) and violin plots (F) of different circulating protein-construction amino acids in the comparison between trastuzumab primary-resistant and sensitive patients. (G) Volcano plot of different genes between non-pathological complete response (pCR) and pCR patients in trastuzumab-based neoadjuvant treatment (I-SPY2, GSE181574). (H) Amino acids metabolic pathway analysis of non-pCR and pCR patients. (I) Relations between cysteine metabolic genes and trastuzumab treatment outcomes. Significances were determined by two-tailed unpaired t-test (F, I). ns, p≥0.05; *p<0.05; **p<0.01; ***p<0.001.
Figure 1—figure supplement 1
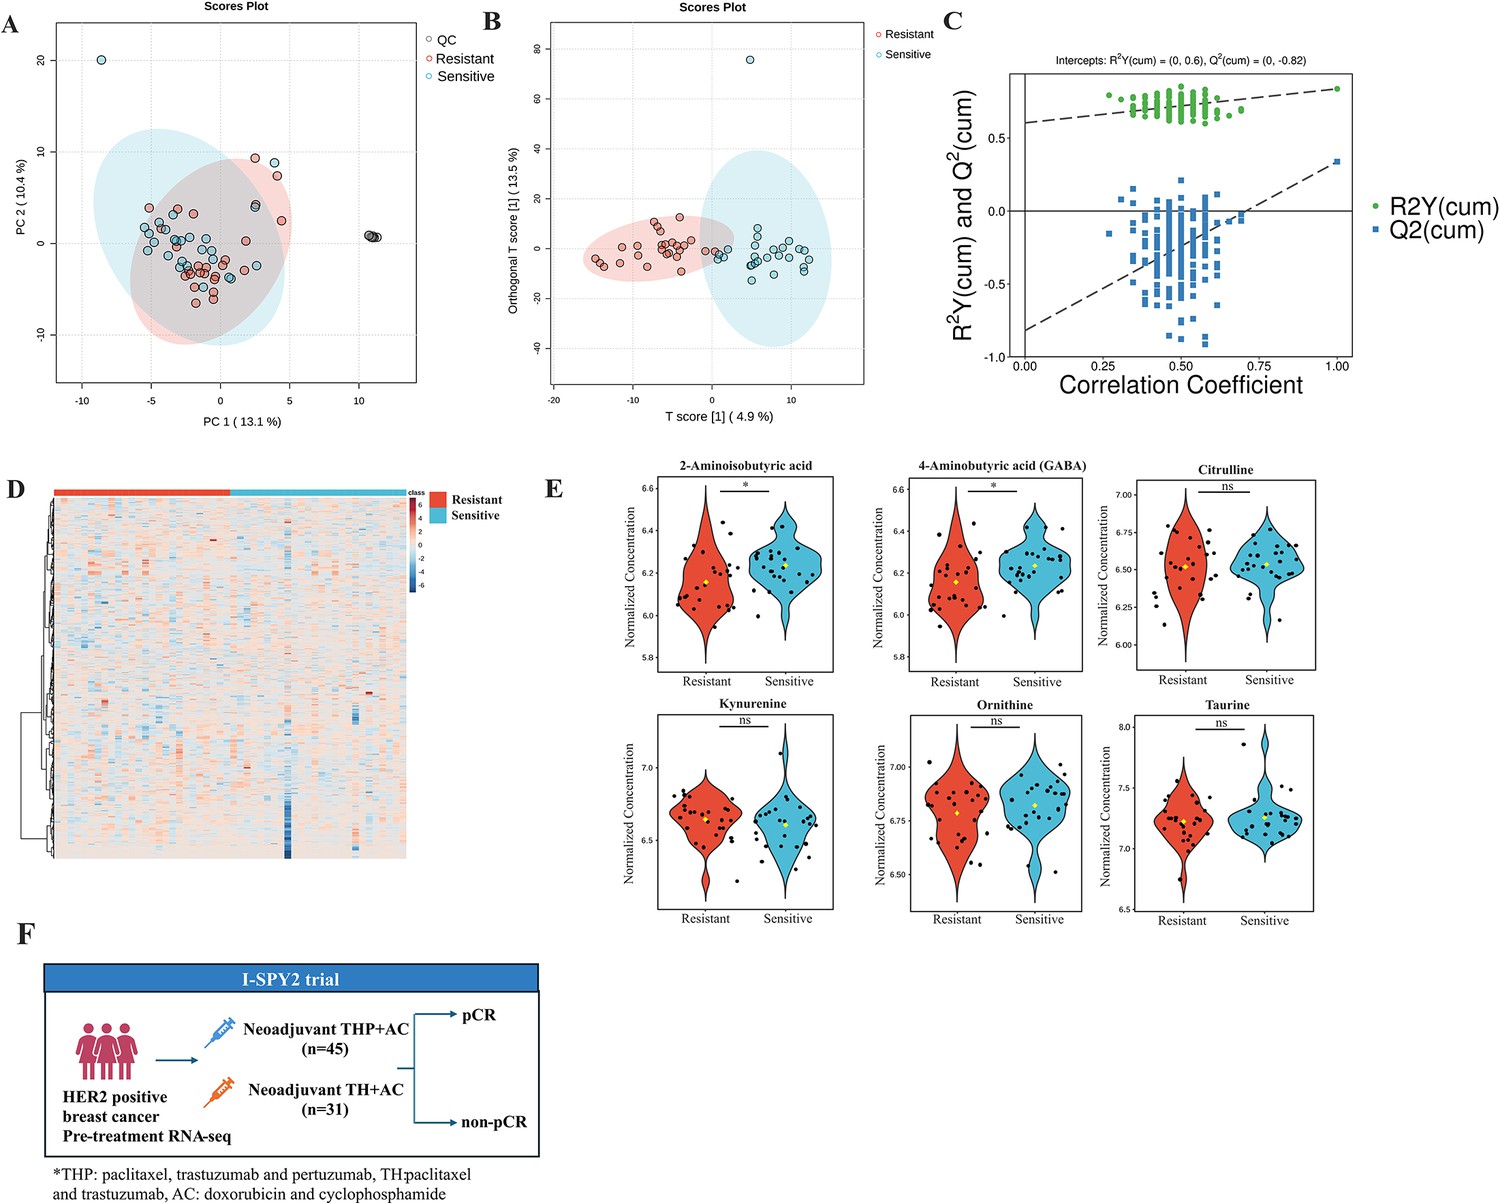
Quality control and differentiation analysis of plasma metabolites in trastuzumab-sensitive and primary-resistant human epidermal growth factor receptor 2 (HER2)-positive breast cancer patients.
(A) The distribution of quality control samples in principal component analysis (PCA) plots. (B) Orthogonal partial least squares-discriminant analysis (OPLS-DA) of plasma metabolites in trastuzumab-sensitive and primary-resistant patients. (C) The robustness of the OPLS-DA model. (D) Heatmap of plasma metabolites in trastuzumab-sensitive and primary-resistant patients. (E) Violin plots of different non-protein amino acids in trastuzumab-sensitive and primary-resistant patients. (F) Overview of the I-SPY2 trial in transcriptomic analysis.
Figure 2 with 3 supplements
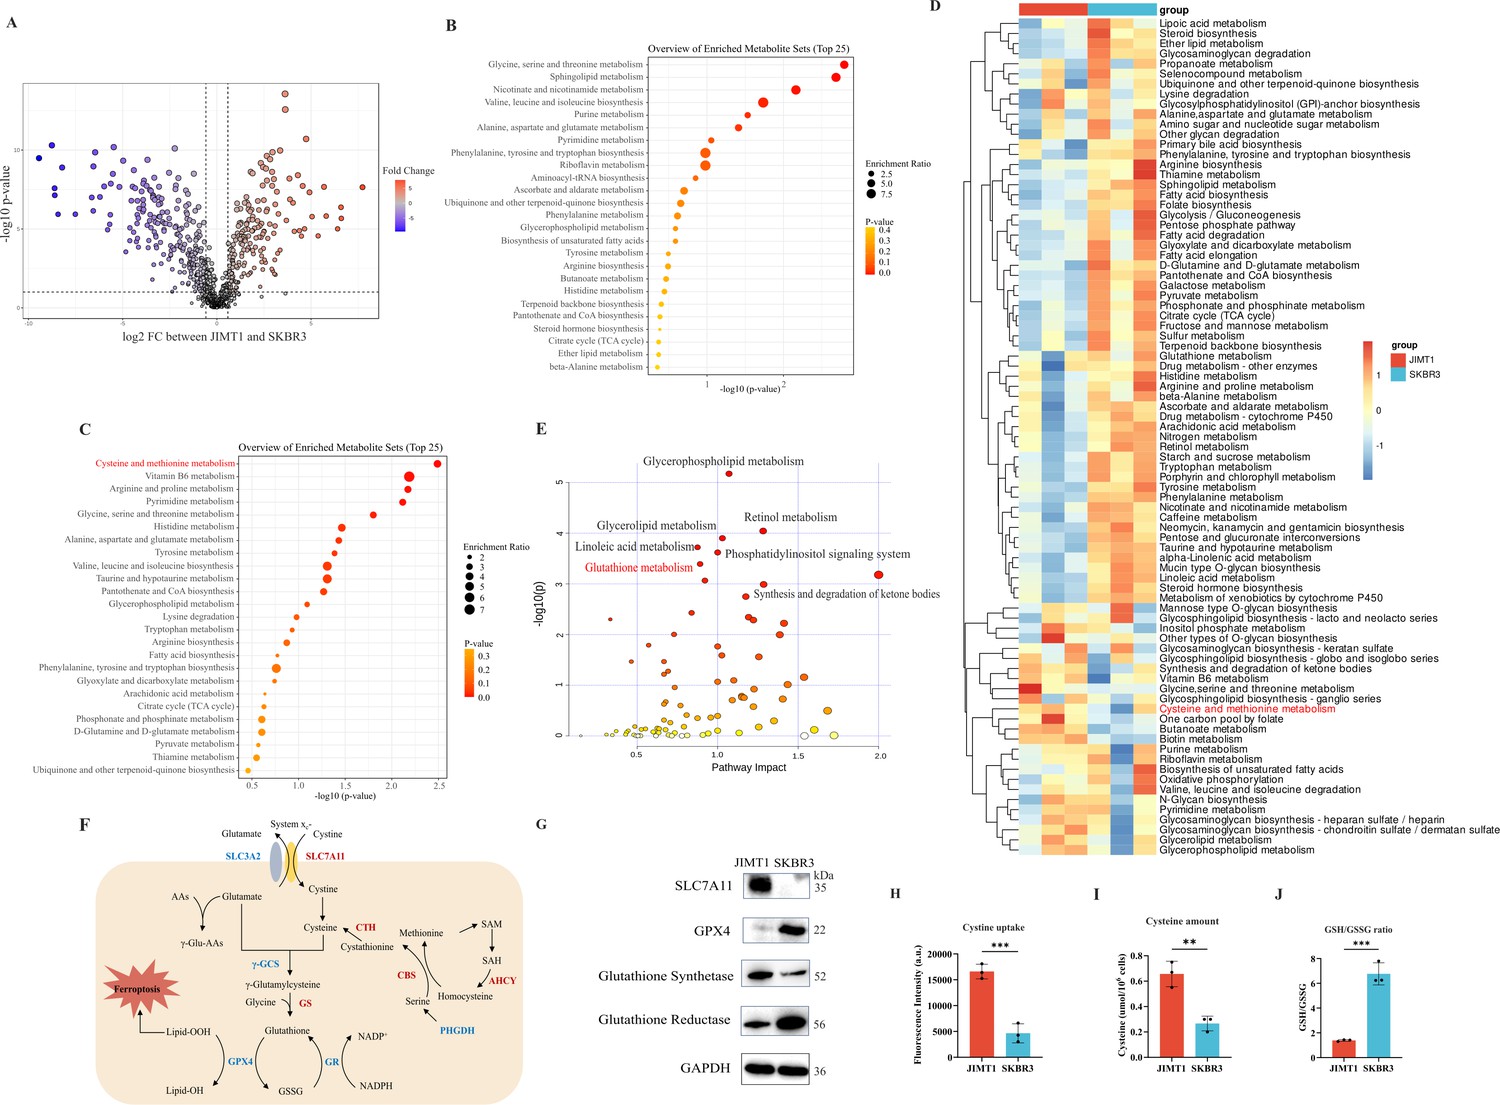
Heterogeneity of cysteine metabolism characteristics in human epidermal growth factor receptor 2 (HER2)-positive breast cancer with different trastuzumab responses.
(A) Volcano plot of hydrophilic metabolites in JIMT1 and SKBR3. (B) Upregulated metabolic processes in JIMT1 based on enrichment analysis of metabolites. (C) Downregulated metabolic processes in JIMT1 based on enrichment analysis of metabolites. (D) Different metabolic activities between JIMT1 and SKBR3 based on transcriptomics data. (E) Joint pathway analysis based on metabolomics and transcriptomics data. (F) Map of essential genes involved with cystine/cysteine metabolism. Upregulated genes in JIMT1 are highlighted in red and downregulated genes in JIMT1 are highlighted in blue. (G) Expression of essential proteins participating in cysteine and glutathione metabolism. (H) The comparison of cystine uptake ability between JIMT1 and SKBR3. (I) The comparison of intracellular cysteine abundance between JIMT1 and SKBR3. (J) The comparison of GSH:GSSG ratio between JIMT1 and SKBR3. Significances were determined by two-tailed unpaired t-test (H–J). ns, p≥0.05; *p<0.05; **p<0.01; ***p<0.001.
-
Figure 2—source data 1
PDF file containing original western blots for Figure 2G, indicating relevant bands.
- https://cdn.elifesciences.org/articles/103953/elife-103953-fig2-data1-v1.zip
-
Figure 2—source data 2
Original files for western blot analysis displayed in Figure 2G.
- https://cdn.elifesciences.org/articles/103953/elife-103953-fig2-data2-v1.zip
-
Figure 2—source data 3
Raw data files for Figure 2H-J.
- https://cdn.elifesciences.org/articles/103953/elife-103953-fig2-data3-v1.xlsx
Figure 2—figure supplement 1
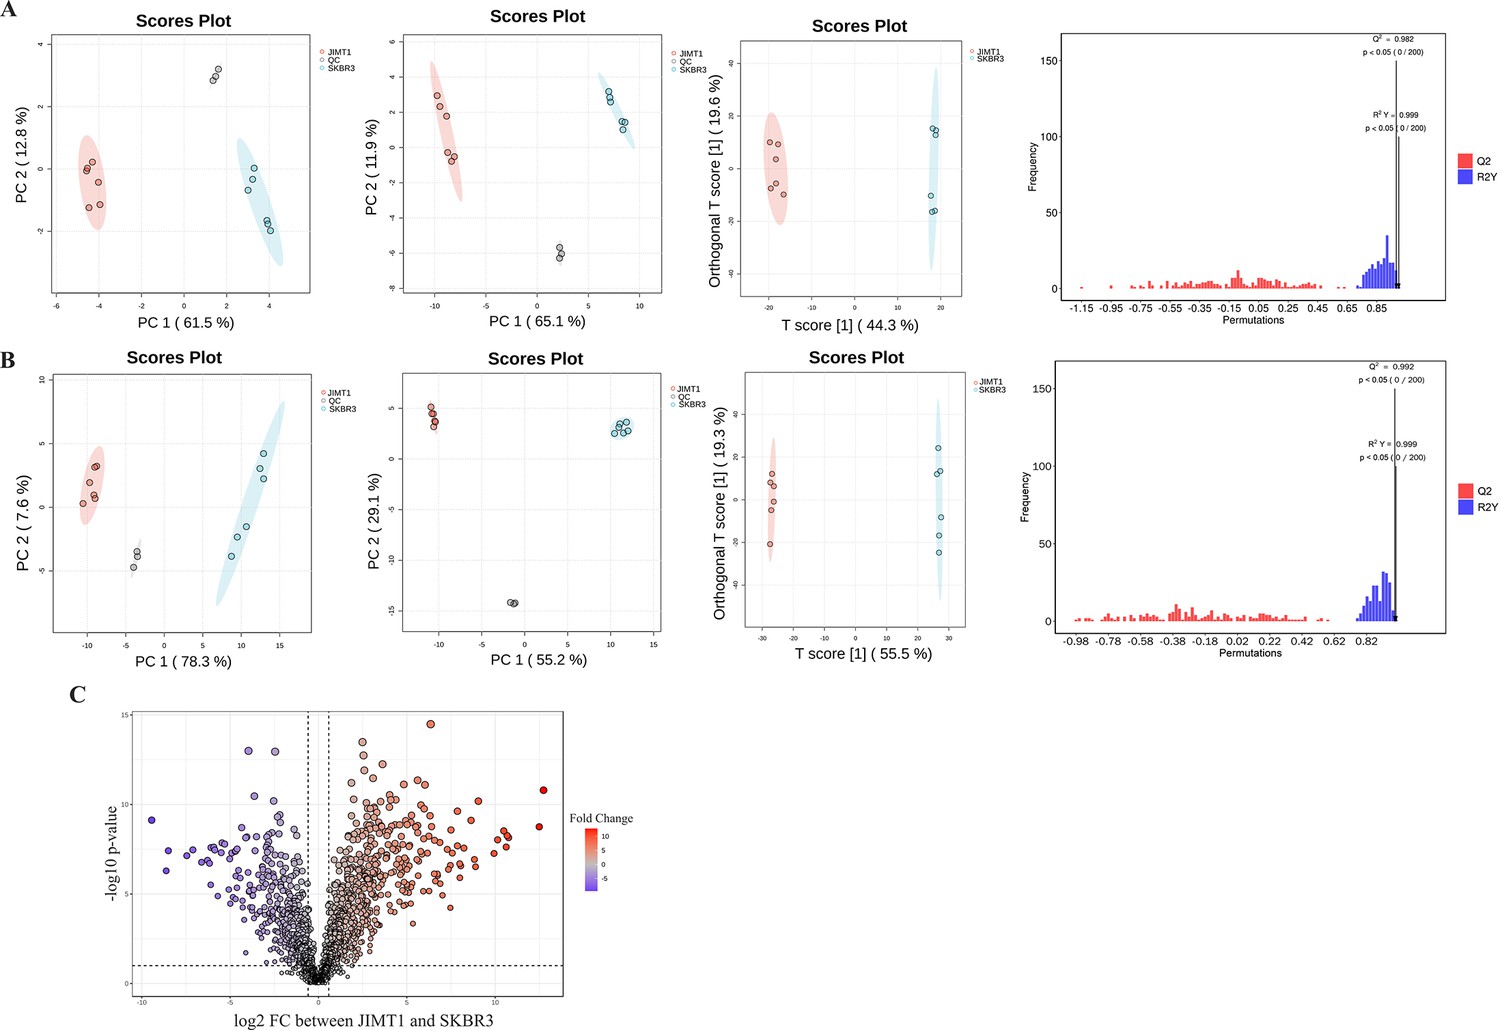
Quality control and differentiation analysis of metabolomic data in JIMT1 and SKBR3.
(A) Principal component analysis (PCA) and orthogonal partial least squares-discriminant analysis (OPLS-DA) of hydrophilic metabolites. (B) PCA and OPLS-DA of lipophilic metabolites. (C) Volcano plot of different lipophilic metabolites.
Figure 2—figure supplement 2
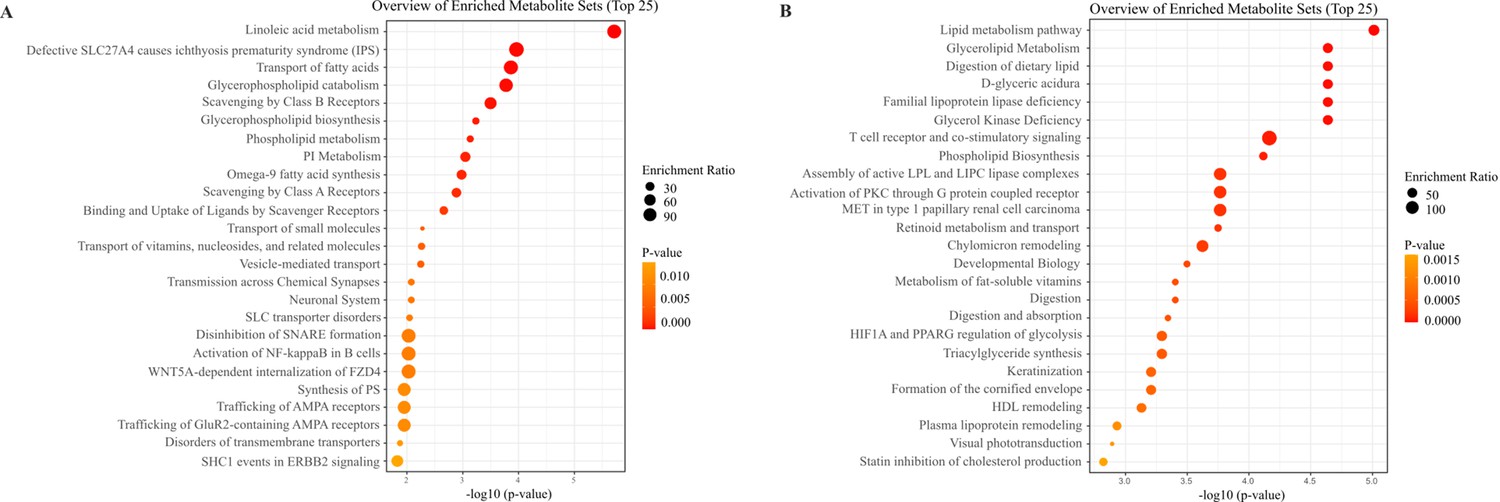
Enrichment analysis of different lipophilic metabolites in JIMT1 and SKBR3.
(A) Metabolic pathway enrichment of lipophilic metabolites upregulated in JIMT1. (B) Metabolic pathway enrichment of lipophilic metabolites downregulated in JIMT1.
Figure 2—figure supplement 3
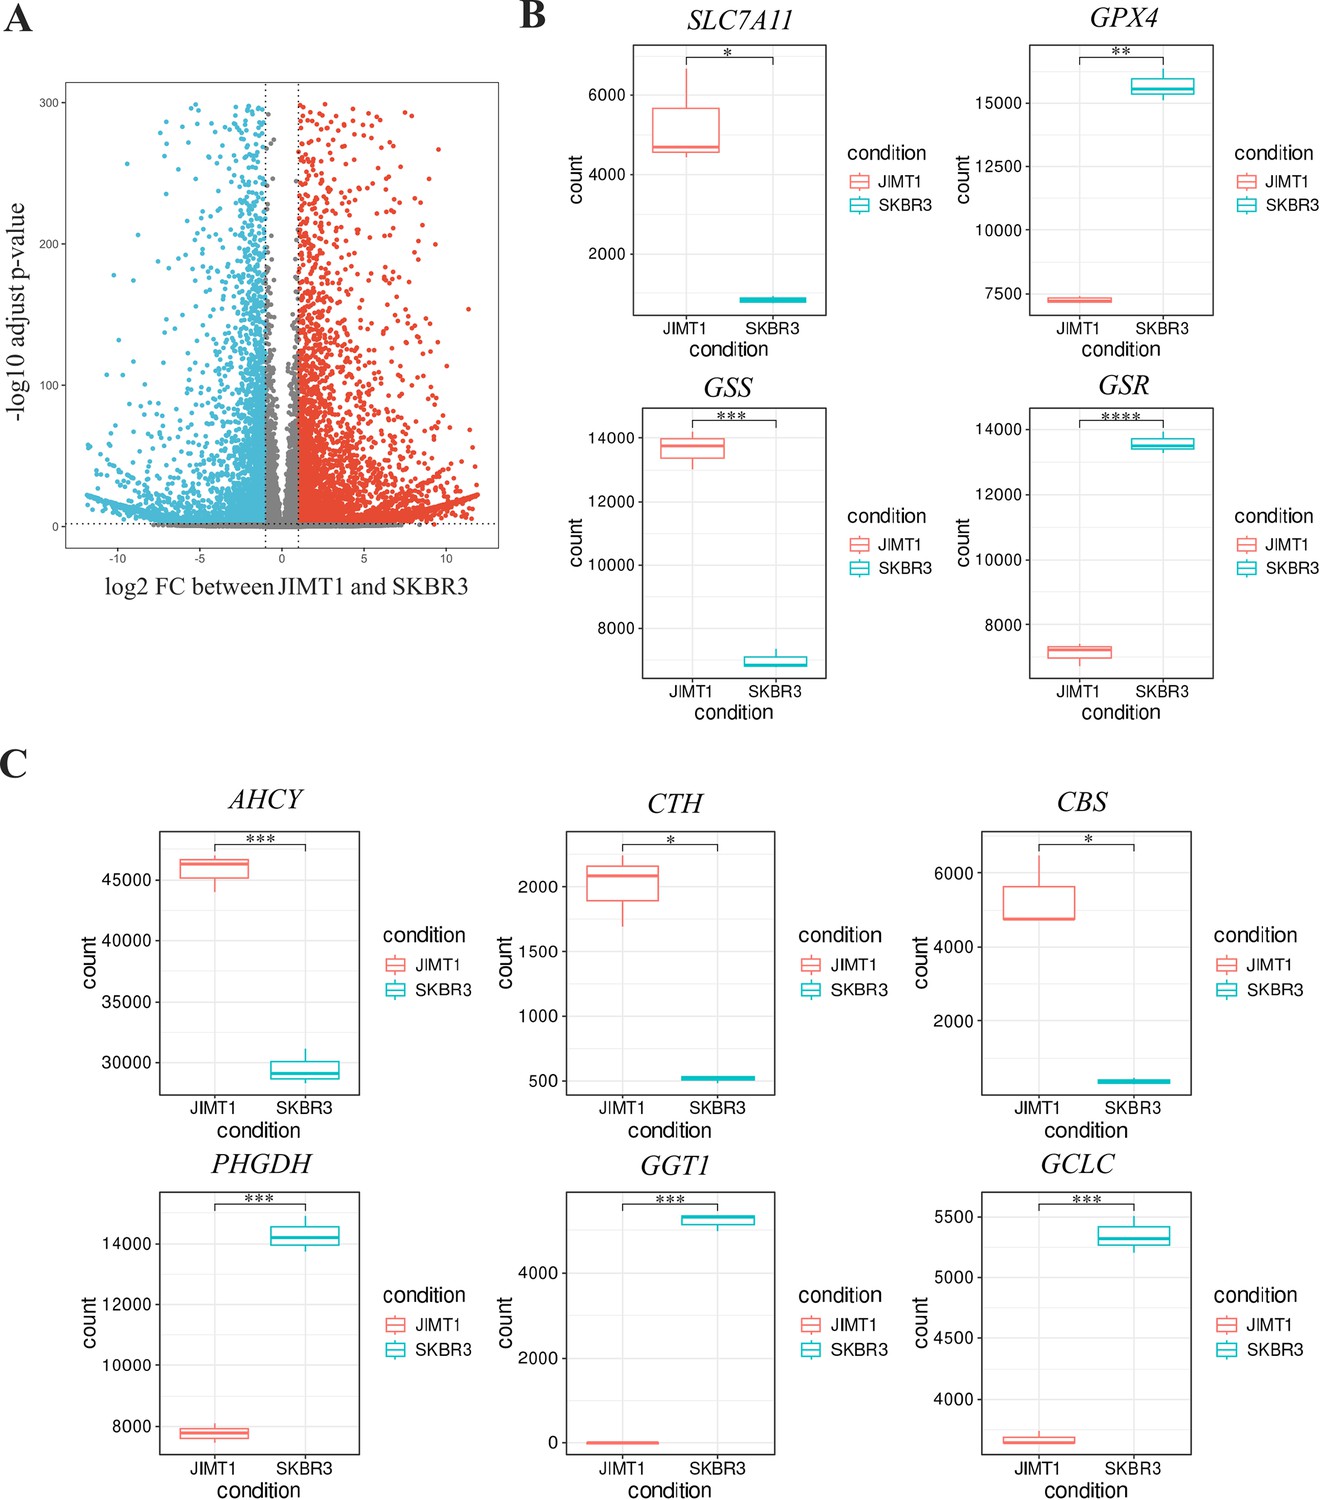
Analysis of transcriptomic data in JIMT1 and SKBR3.
(A) Volcano plot of different genes in JIMT1 and SKBR3. (B) Transcriptional expression of SLC7A11, GPX4, GSS, and GSR in JIMT1 and SKBR3. (C) Transcriptional expression of key genes involved with transsulfuration activity and γ-glutamyl-peptides synthesis activity (AHCY, CTH, CBS, PHGDH, CGT1, and GCLC) in JIMT1 and SKBR3.
Figure 3 with 1 supplement
Ferroptosis sensitivity of human epidermal growth factor receptor 2 (HER2)-positive breast cancer with different trastuzumab response.
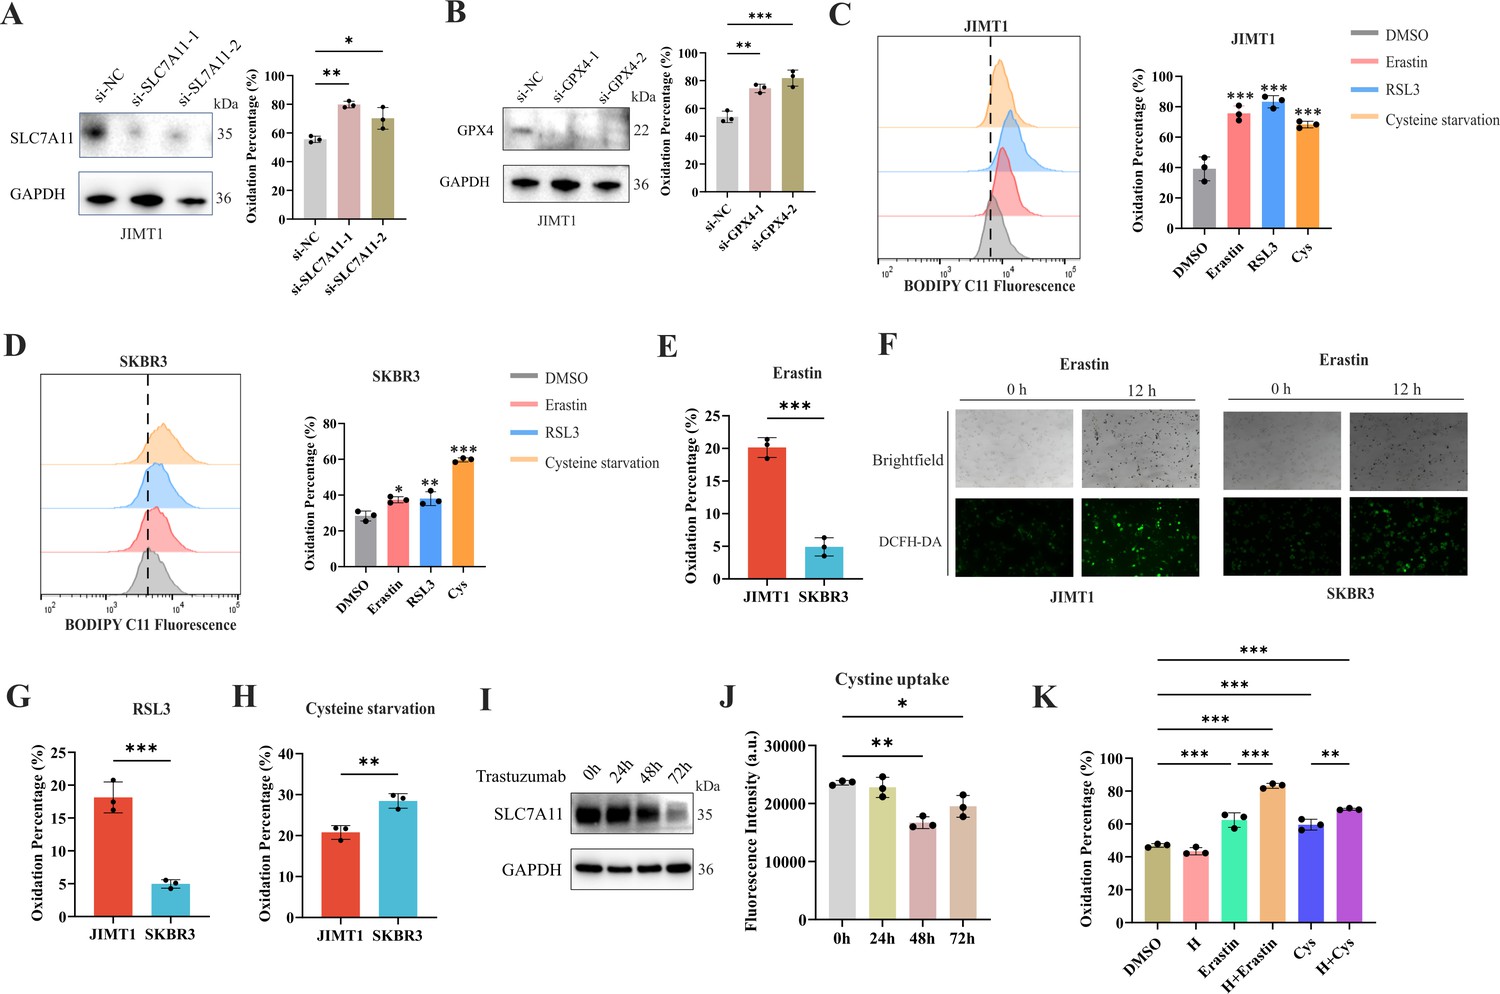
(A, B) Knockdown of SLC7A11 (A) and GPX4 (B) induced increased lipid peroxidation (BODIPY-C11) in JIMT1. (C, D) Treatment with erastin (10 μm), RSL3 (1 μm), and cysteine starvation for 12 hr induced lipid peroxidation (BODIPY-C11) in JIMT1 (C) and SKBR3 (D). (E, F) JIMT1 and SKBR3 featured different lipid peroxidation sensitivity to erastin by measuring BODIPY-C11 (E) and DCFH-DA (F). (G, H) JIMT1 and SKBR3 featured different lipid peroxidation sensitivity to RSL3 (G) and cysteine starvation (H). (I) SLC7A11 expression under different trastuzumab treatment time. (J) Cystine uptake ability under different trastuzumab treatment time. (K) The combination of erastin or cysteine starvation and trastuzumab increased lipid peroxidation in JIMT1. H, trastuzumab; Cys, cysteine starvation. Significances were determined by one-way ANOVA (A–D, J, K) and two-tailed unpaired t-test (E, G, H). ns, p≥0.05; *p<0.05; **p<0.01; ***p<0.001.
-
Figure 3—source data 1
PDF file containing original western blots for Figure 3A, B and C, indicating relevant bands.
- https://cdn.elifesciences.org/articles/103953/elife-103953-fig3-data1-v1.zip
-
Figure 3—source data 2
Original files for western blot analysis displayed in Figure 3A, B and C.
- https://cdn.elifesciences.org/articles/103953/elife-103953-fig3-data2-v1.zip
-
Figure 3—source data 3
Raw data files for Figure 3A–E, G, H, J and K.
- https://cdn.elifesciences.org/articles/103953/elife-103953-fig3-data3-v1.xlsx
Figure 3—figure supplement 1

Knockdown of genes and targeting cysteine metabolism in JIMT1 and SKBR3.
(A) Knockdown of SLC7A11 could increase lipid peroxidation in SKBR3. (B) Knockdown of GPX4 could increase lipid peroxidation in SKBR3. (C) Different sensitivity of JIMT1 and SKBR3 to treatment with erastin for 24 hr. (D) Different sensitivity of JIMT1 and SKBR3 to treatment with RSL3 for 24 hr. (E) Different sensitivity of JIMT1 and SKBR3 to treatment with cysteine starvation. (F) Transcriptional expression of key genes involved with transsulfuration activity and γ-glutamyl-peptides synthesis activity (AHCY, CTH, CBS, PHGDH, CGT1, and GCLC) in JIMT1 and SKBR3 after cysteine starvation. JCYS, JIMT1 cysteine starvation. SCYS, SKBR3 cysteine starvation. (G) The utilization of Fer-1 (10 μm) inhibits lipid peroxidation resulted from erastin and RSL3. (H) The utilization of Fer-1 (10 μm) inhibits lipid peroxidation resulted from cysteine starvation. Cys, cysteine starvation.
-
Figure 3—figure supplement 1—source data 1
PDF file containing original western blots for Figure 3—figure supplement 1A and B, indicating relevant bands.
- https://cdn.elifesciences.org/articles/103953/elife-103953-fig3-figsupp1-data1-v1.zip
-
Figure 3—figure supplement 1—source data 2
Original files for western blot analysis displayed in Figure 3—figure supplement 1A and B.
- https://cdn.elifesciences.org/articles/103953/elife-103953-fig3-figsupp1-data2-v1.zip
-
Figure 3—figure supplement 1—source data 3
Raw data files for Figure 3—figure supplement 1A–E, G and H.
- https://cdn.elifesciences.org/articles/103953/elife-103953-fig3-figsupp1-data3-v1.xlsx
Figure 4 with 1 supplement
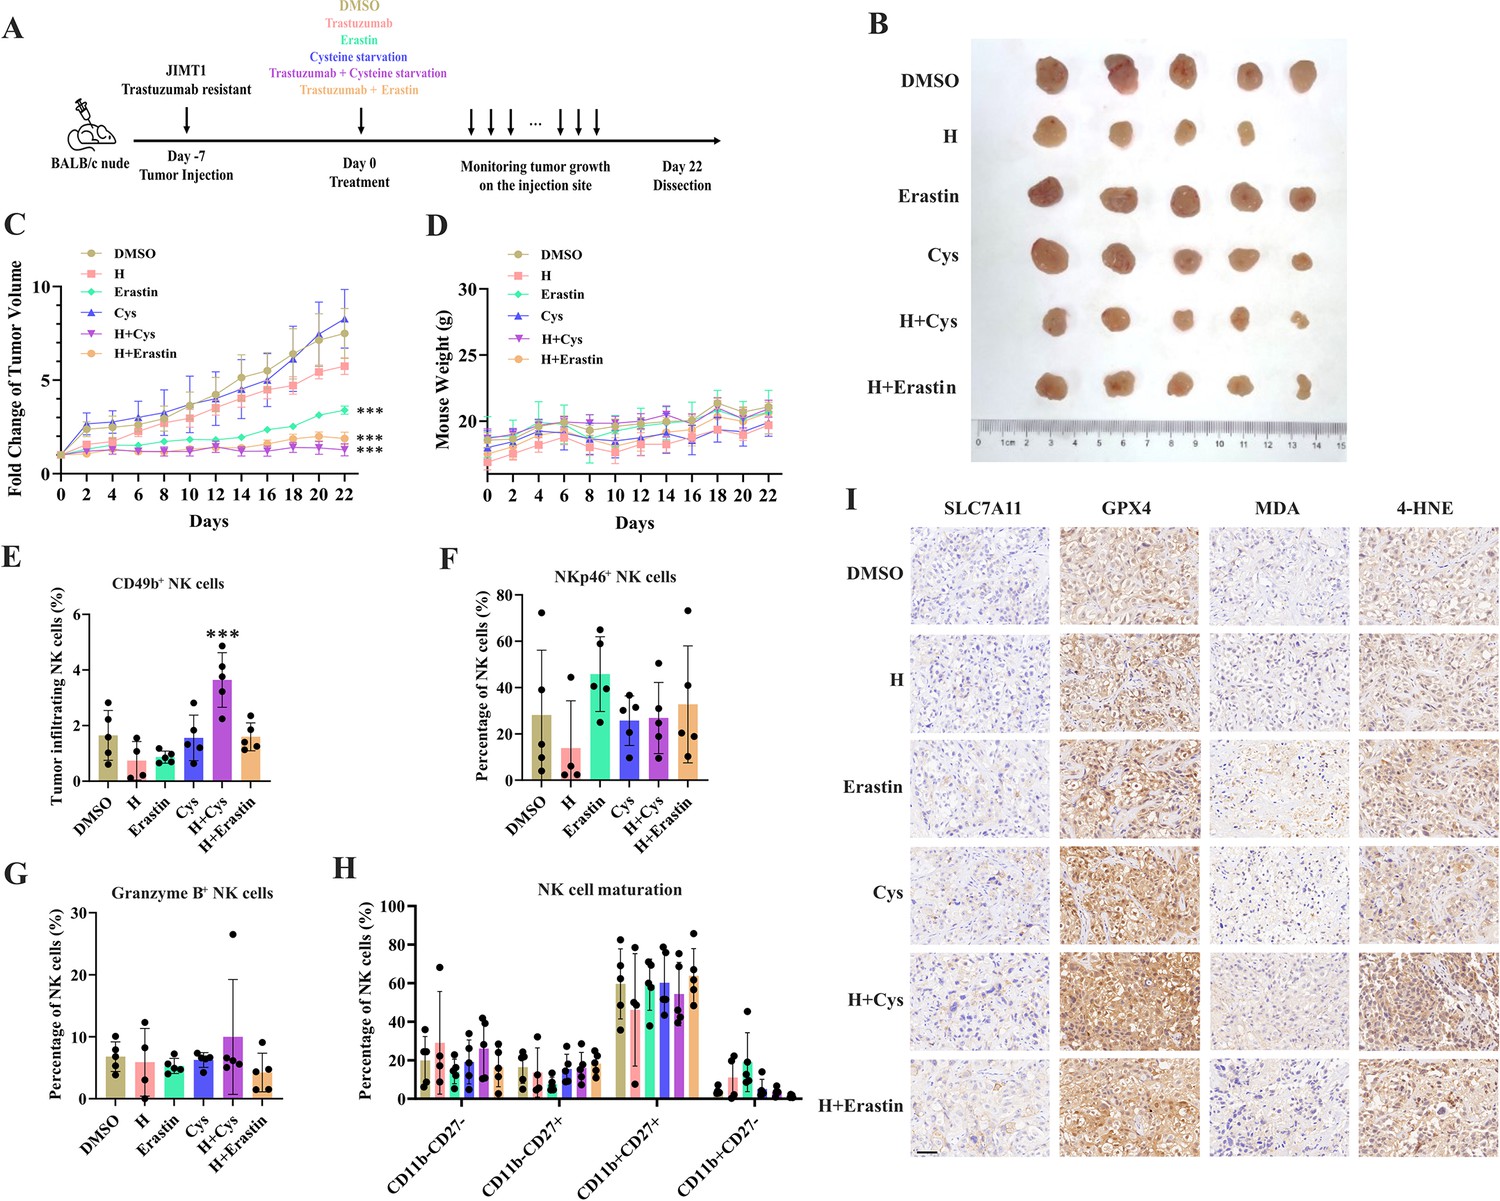
Targeting cysteine metabolism synergizes with trastuzumab to induce ferroptosis.
(A) Schematic outline of treatment on cysteine metabolism in trastuzumab-resistant breast cancer. JIMT1 cells were injected into the mammary fat pads of BALB/c nude mice at day 7. Treatment with DMSO, erastin, cysteine starvation, trastuzumab combined with or without erastin and cysteine starvation started at day 0 for 21 d. Tumor volume and mice weight were measured. The tumor growth was compared by paired individual fold change of tumor volumes. (B) Tumor of different treatment groups. (C) Fold change of tumor volume in different treatment groups. (D) Mice weight of different treatment groups. (E–H) Abundance of CD49b+ (E), NKp46+ (F), Granzyme B+ (G), and different development status (H) tumor-infiltrating NK cells. (I) Representing immunohistochemistry images of SLC7A11, GPX4, MDA, and 4-HNE in different treatment groups. Scale bar, 50 μm. H trastuzumab; Cys, cysteine starvation. Significances were determined by two-way ANOVA (C, D) and one-way ANOVA (E–H). ns, p≥0.05; *p<0.05; **p<0.01; ***p<0.001.
-
Figure 4—source data 1
Raw data files for Figure 4C–H.
- https://cdn.elifesciences.org/articles/103953/elife-103953-fig4-data1-v1.xlsx
Figure 4—figure supplement 1
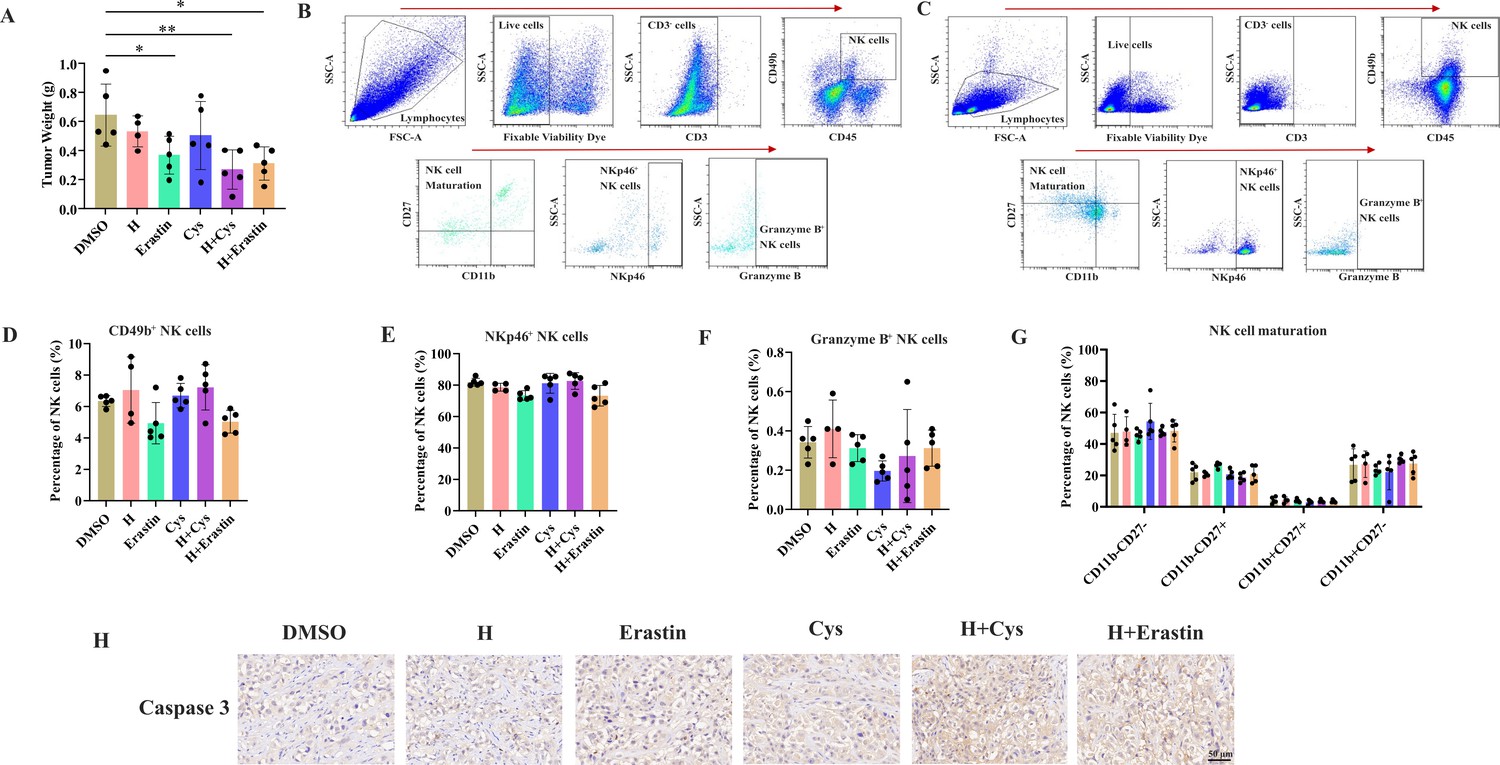
Detection of immune cell compositions in tumor and spleen samples.
(A) Tumor weight of different treatment groups. (B, C) Strategies in the flow cytometry analysis of NK cells in tumor (B) and spleen (C). (D–G) Abundance of CD49b+ (D), NKp46+ (E), Granzyme B+ (F), and different development status (G) NK cells in spleen. (H) Representing immunohistochemistry images caspase 3 in different treatment groups.
-
Figure 4—figure supplement 1—source data 1
Raw data files for Figure 4—figure supplement 1A and D–G.
- https://cdn.elifesciences.org/articles/103953/elife-103953-fig4-figsupp1-data1-v1.xlsx
Figure 5 with 2 supplements
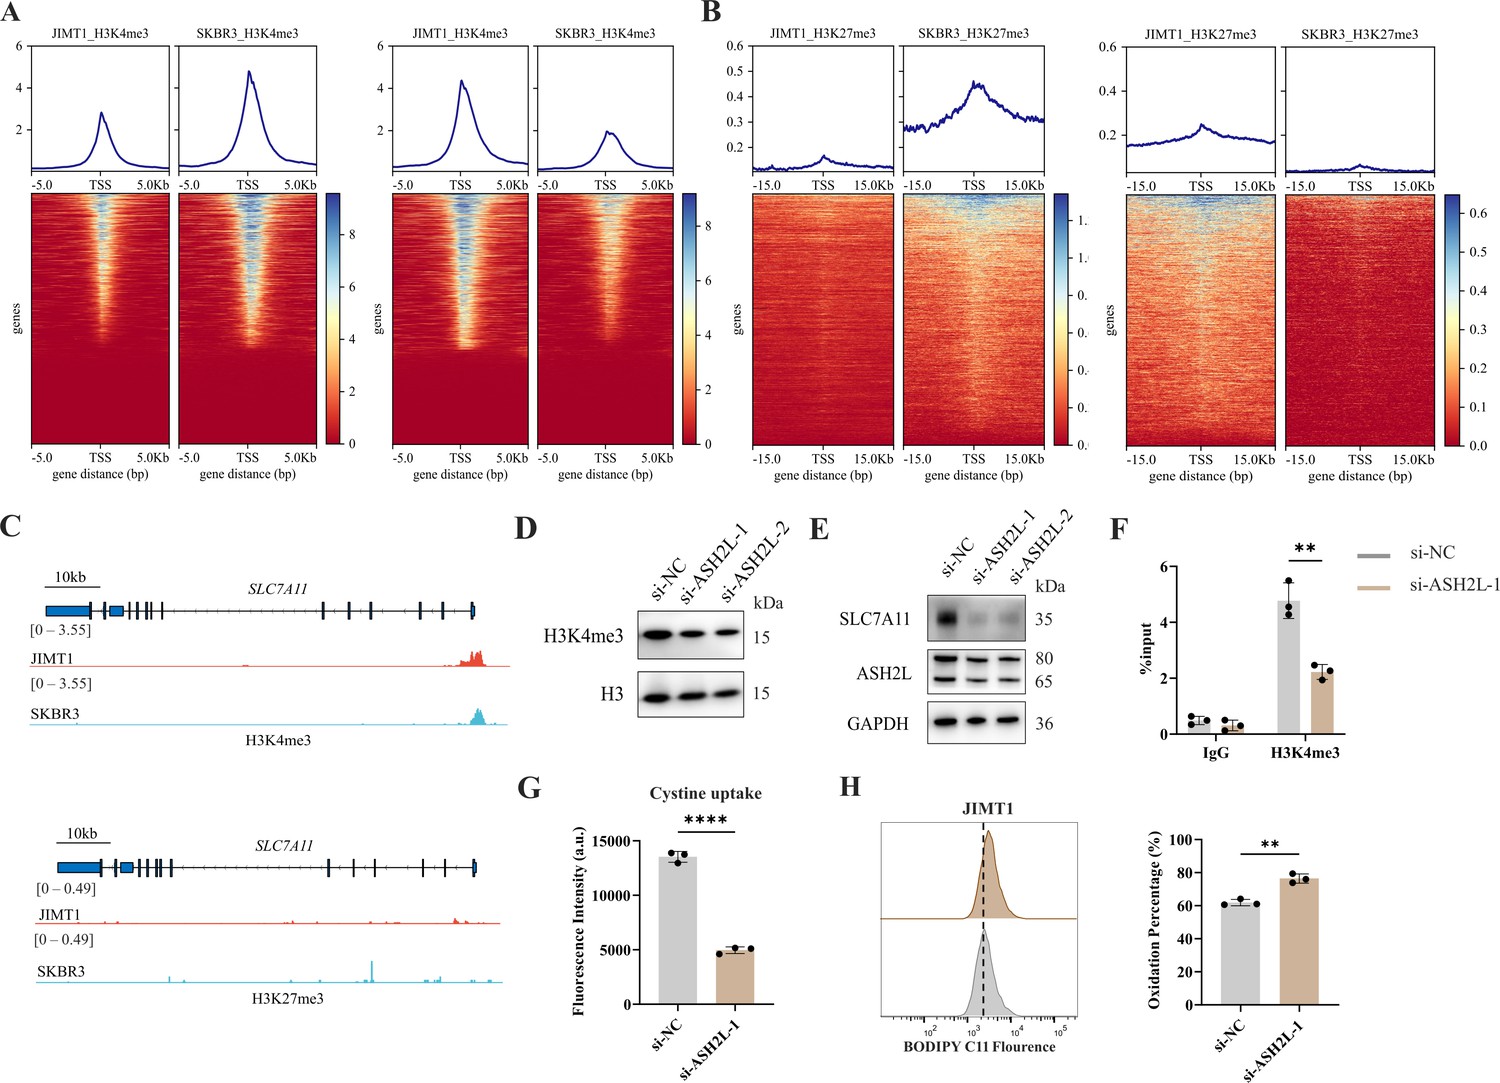
Increased H3K4me3 modifies SLC7A11 transcription and regulates cystine uptake.
(A, B) Alterations of H3K4me3 (A) and H3K27me3 (B) peaks between JIMT1 and SKBR3. (C) Different abundance of H3K4me3 and H3K27me3 at SLC7A11 promoter regions in JIMT1 and SKBR3. (D) Decreased ASH2L inhibited total H3K4me3 expression. (E) Decreased ASH2L inhibited SLC7A11 expression. (F) Decreased ASH2L suppressed H3K4me3 expression at SLC7A11 promoter regions. (G) Decreased ASH2L suppressed cystine uptake ability. (H) Decreased ASH2L induced lipid peroxidation and ferroptosis. Significances were determined by two-tailed unpaired t-test (F–H). ns, p≥0.05; *p<0.05; **p<0.01; ***p<0.001.
-
Figure 5—source data 1
PDF file containing original western blots for Figure 5D and E, indicating relevant bands.
- https://cdn.elifesciences.org/articles/103953/elife-103953-fig5-data1-v1.zip
-
Figure 5—source data 2
Original files for western blot analysis displayed in Figure 5D and E.
- https://cdn.elifesciences.org/articles/103953/elife-103953-fig5-data2-v1.zip
-
Figure 5—source data 3
Raw data files for Figure 5F–H.
- https://cdn.elifesciences.org/articles/103953/elife-103953-fig5-data3-v1.xlsx
Figure 5—figure supplement 1

Location of altered H3K4me3 and H3K27me3 peaks in JIMT1 and SKBR3.
(A) Enriched H3K4me3 peaks in JIMT1 (left) and SKBR3 (right). (B) Enriched H3K27me3 peaks in JIMT1 (left) and SKBR3 (right).
Figure 5—figure supplement 2
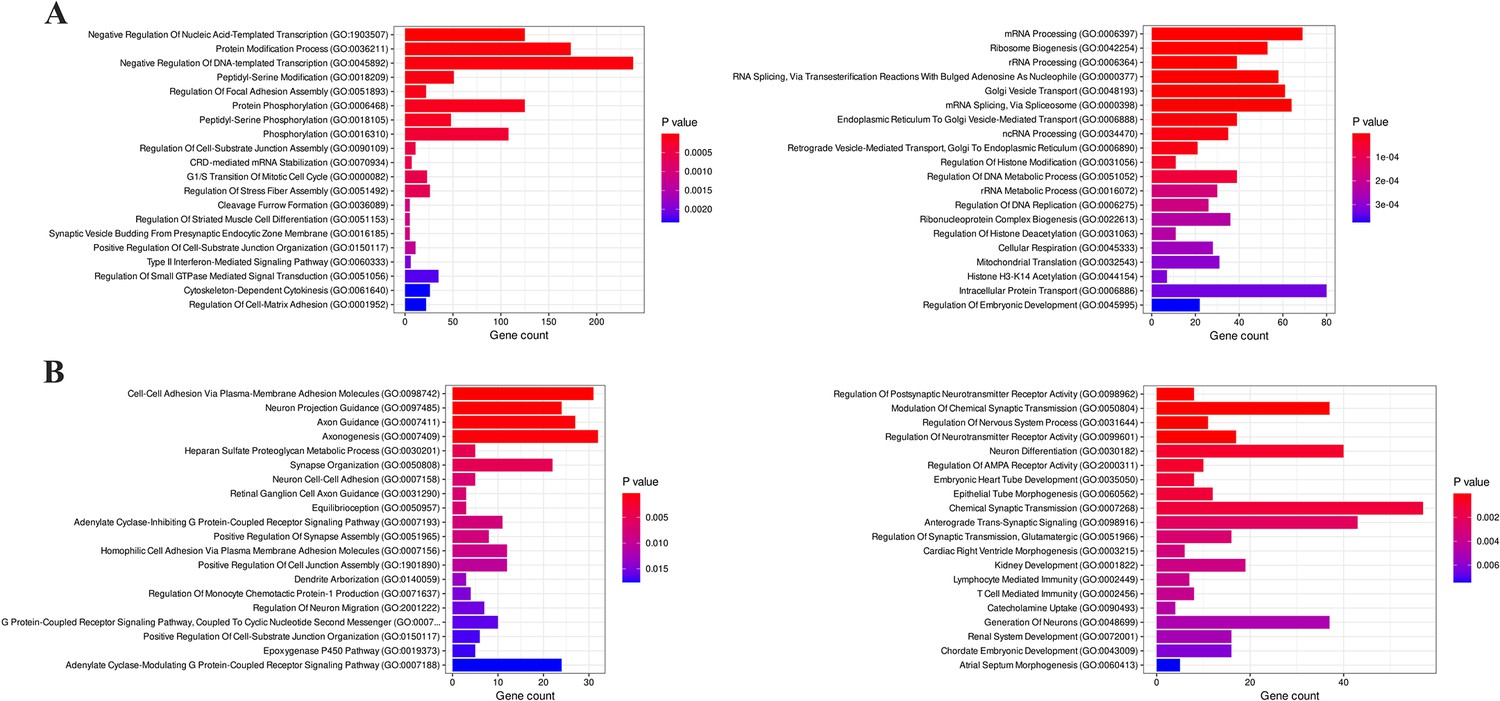
Enrichment analysis of biological processes related to H3K4me3 and H3K27me3 alterations.
(A) Biological processes involved with upregulated H3K4me3 in JIMT1 (left) and SKBR3 (right). (A) Biological processes involved with upregulated H3K27me3 in JIMT1 (left) and SKBR3 (right).
Figure 6 with 7 supplements
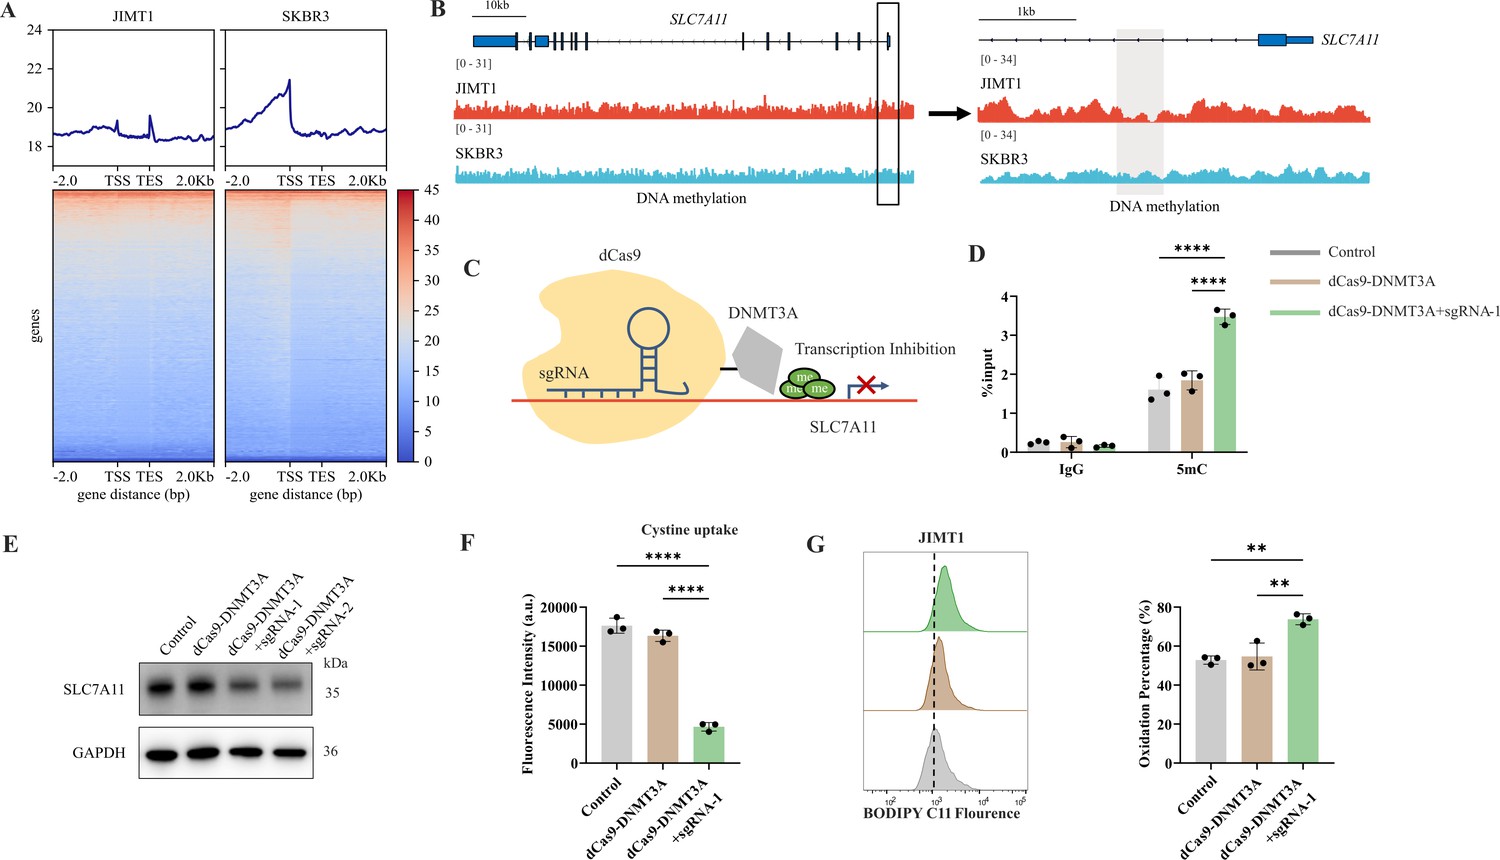
Decreased 5-mC modifications on SLC7A11 promoter relate with enhanced cystine uptake.
(A) Alterations of 5-mC peaks between JIMT1 and SKBR3. (B) Different abundance of 5-mC at SLC7A11 promoter regions in JIMT1 and SKBR3. (C) Schematic outline of CRISPR-based epigenetic editing. dCas9-DNMT3A increased methylation of specific CpG islands in SLC7A11 promoter regions and inhibited gene transcription. (D) dCas9-DNMT3A increased 5-mC levels at SLC7A11 promoter regions. (E) dCas9-DNMT3A inhibited SLC7A11 expression. (F) dCas9-DNMT3A suppressed cystine uptake ability. (G) dCas9-DNMT3A induced lipid peroxidation and ferroptosis. Significances were determined by one-way ANOVA (D, F, G). ns, p≥0.05; *p<0.05; **p<0.01; ***p<0.001.
-
Figure 6—source data 1
PDF file containing original western blots for Figure 6E, indicating relevant bands.
- https://cdn.elifesciences.org/articles/103953/elife-103953-fig6-data1-v1.zip
-
Figure 6—source data 2
Original files for western blot analysis displayed in Figure 6E.
- https://cdn.elifesciences.org/articles/103953/elife-103953-fig6-data2-v1.zip
-
Figure 6—source data 3
Raw data files for Figure 6D, F and G.
- https://cdn.elifesciences.org/articles/103953/elife-103953-fig6-data3-v1.xlsx
Figure 6—figure supplement 1

Different DNA methylation status between JIMT1 and SKBR3.
(A) Dot blot of 5-mC levels in JIMT1 and SKBR3. (B) Enriched differentially methylated regions (DMR) in JIMT1 (left) and SKBR3 (right). (C) Location of CG-DMRs in JIMT1 (left) and SKBR3 (right) across the whole genome.
-
Figure 6—figure supplement 1—source data 1
PDF file containing original western blots for Figure 6—figure supplement 1A, indicating relevant bands.
- https://cdn.elifesciences.org/articles/103953/elife-103953-fig6-figsupp1-data1-v1.zip
-
Figure 6—figure supplement 1—source data 2
Original files for western blot analysis displayed in Figure 6—figure supplement 1A.
- https://cdn.elifesciences.org/articles/103953/elife-103953-fig6-figsupp1-data2-v1.zip
Figure 6—figure supplement 2
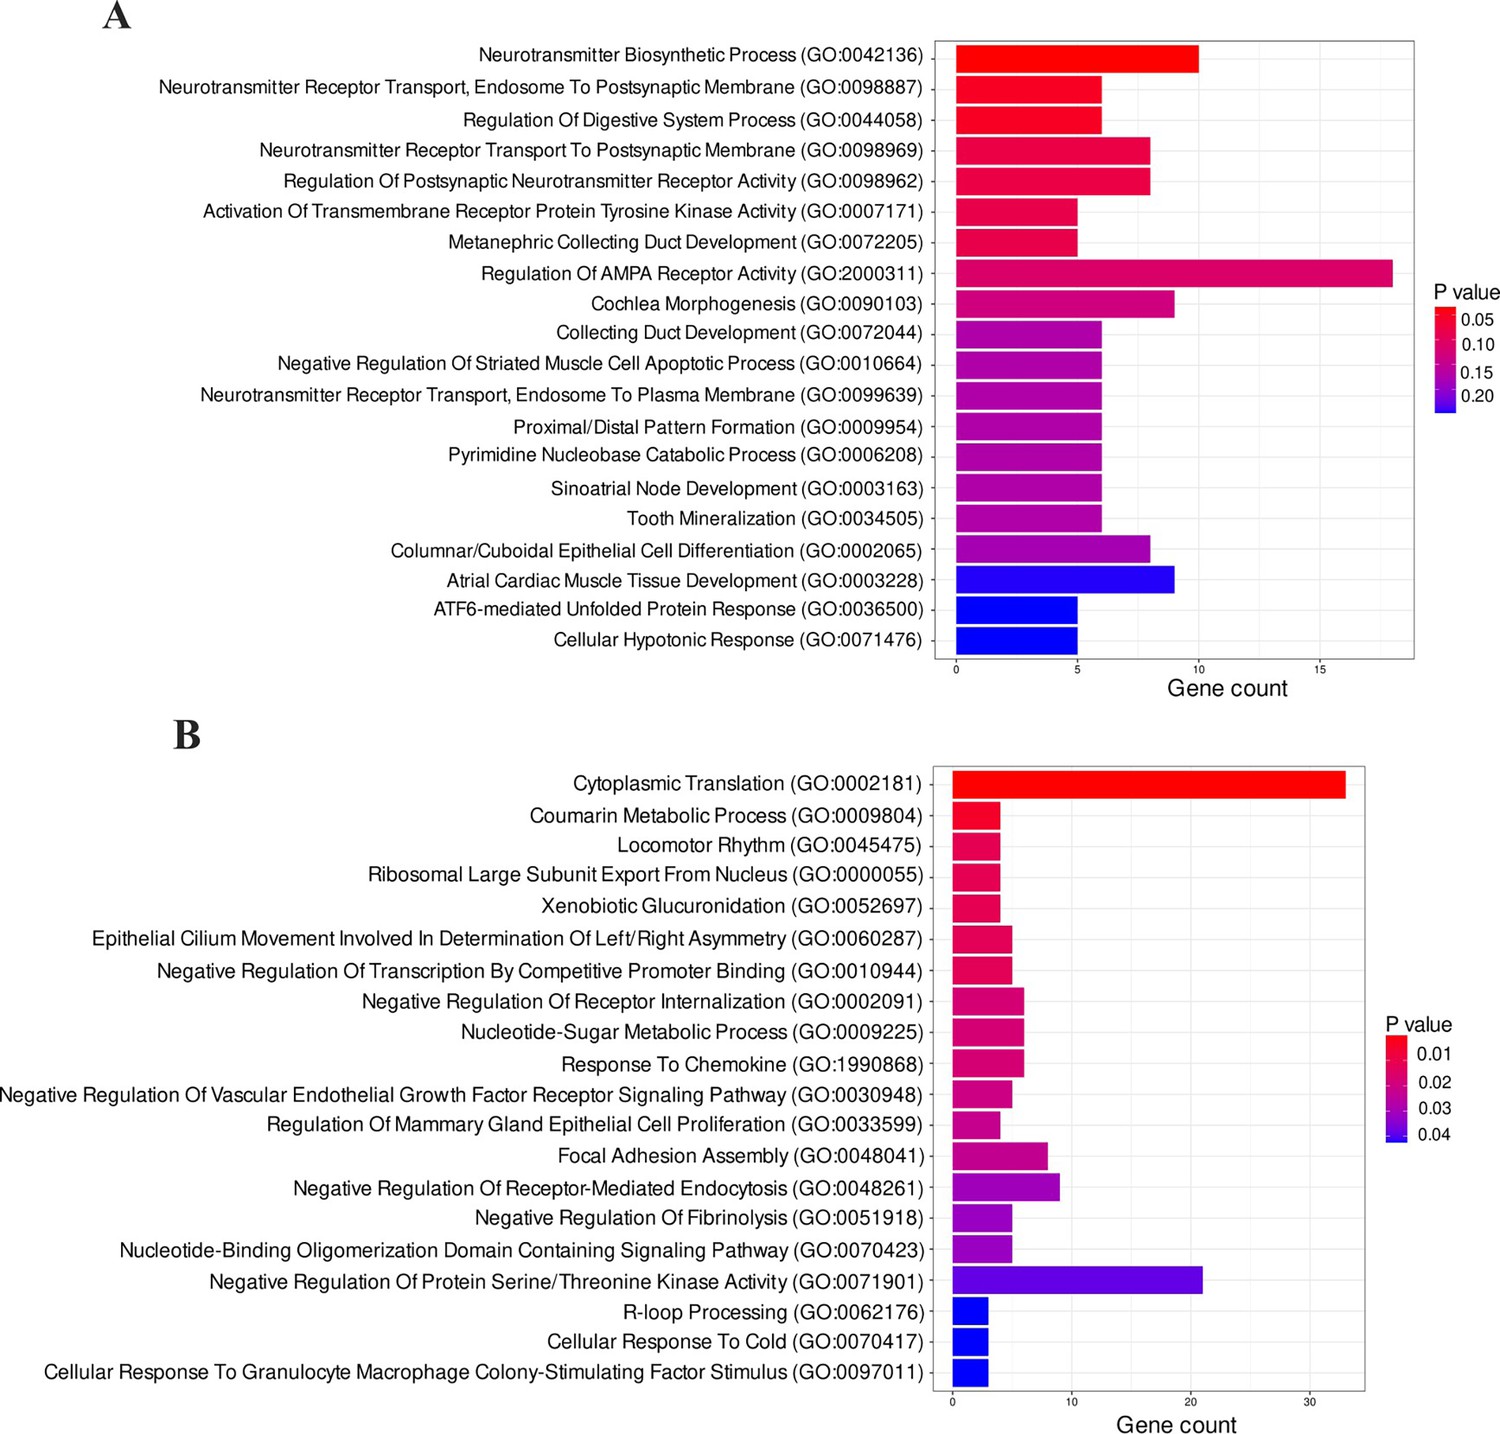
Enrichment analysis of biological processes related to DNA methylation alterations.
(A) Biological processes associated with upregulated DNA methylation in JIMT1. (B) Biological processes associated with upregulated DNA methylation in SKBR3.
Figure 6—figure supplement 3
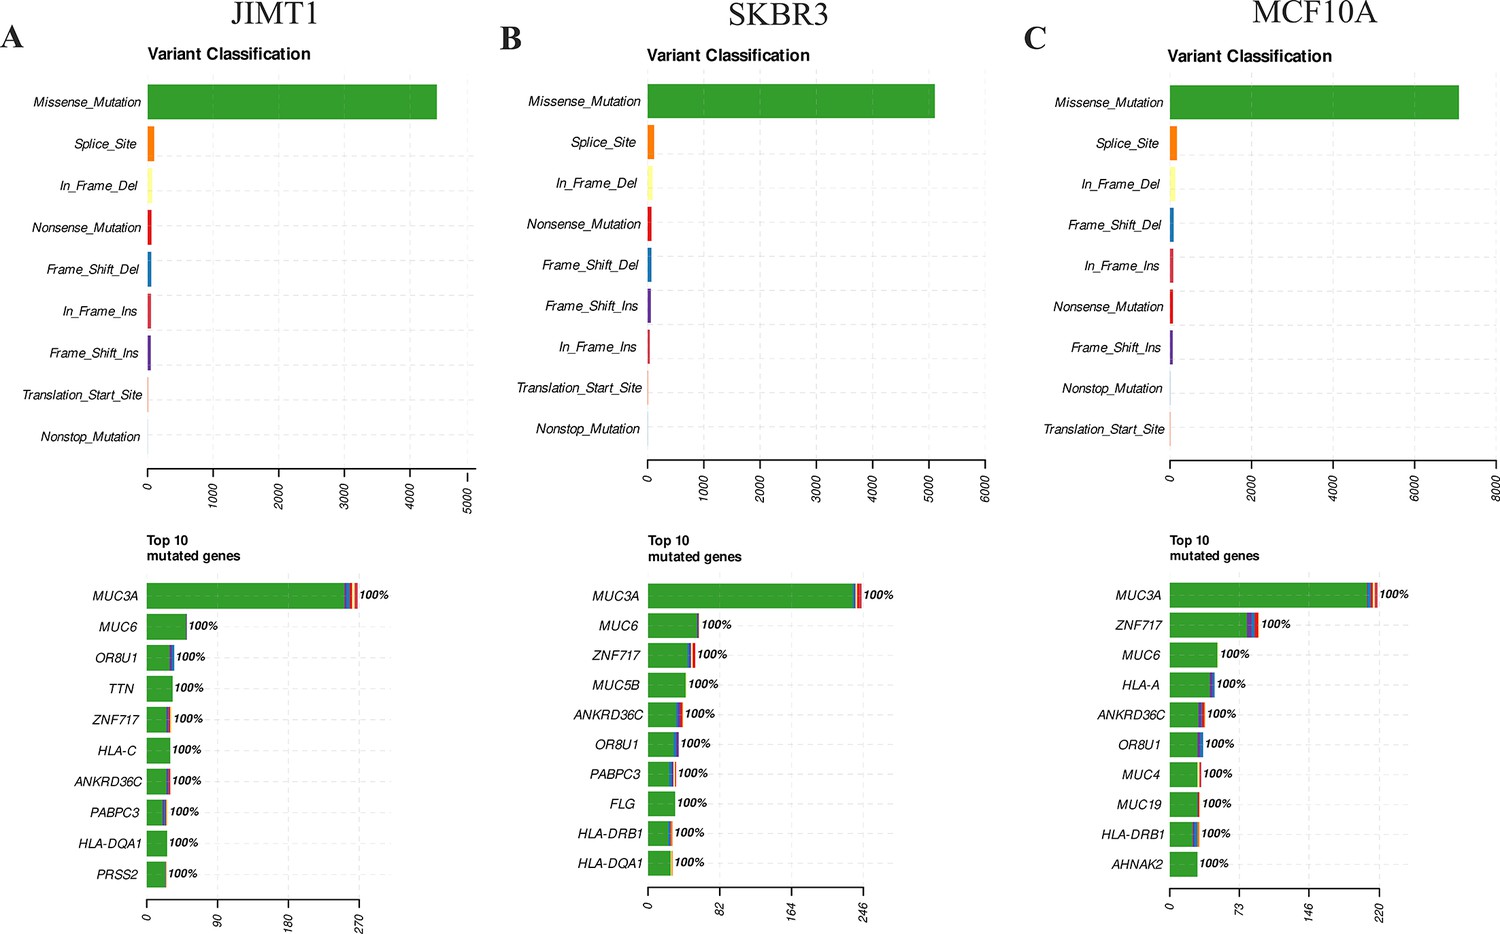
Genomic variations in JIMT1, SKBR3, and MCF10A.
(A) Variant classification and top 10 mutated genes in JIMT1 across the whole genome. (B) Variant classification and top 10 mutated genes in SKBR3 across the whole genome. (C) Variant classification and top 10 mutated genes in MCF10A across the whole genome.
Figure 6—figure supplement 4
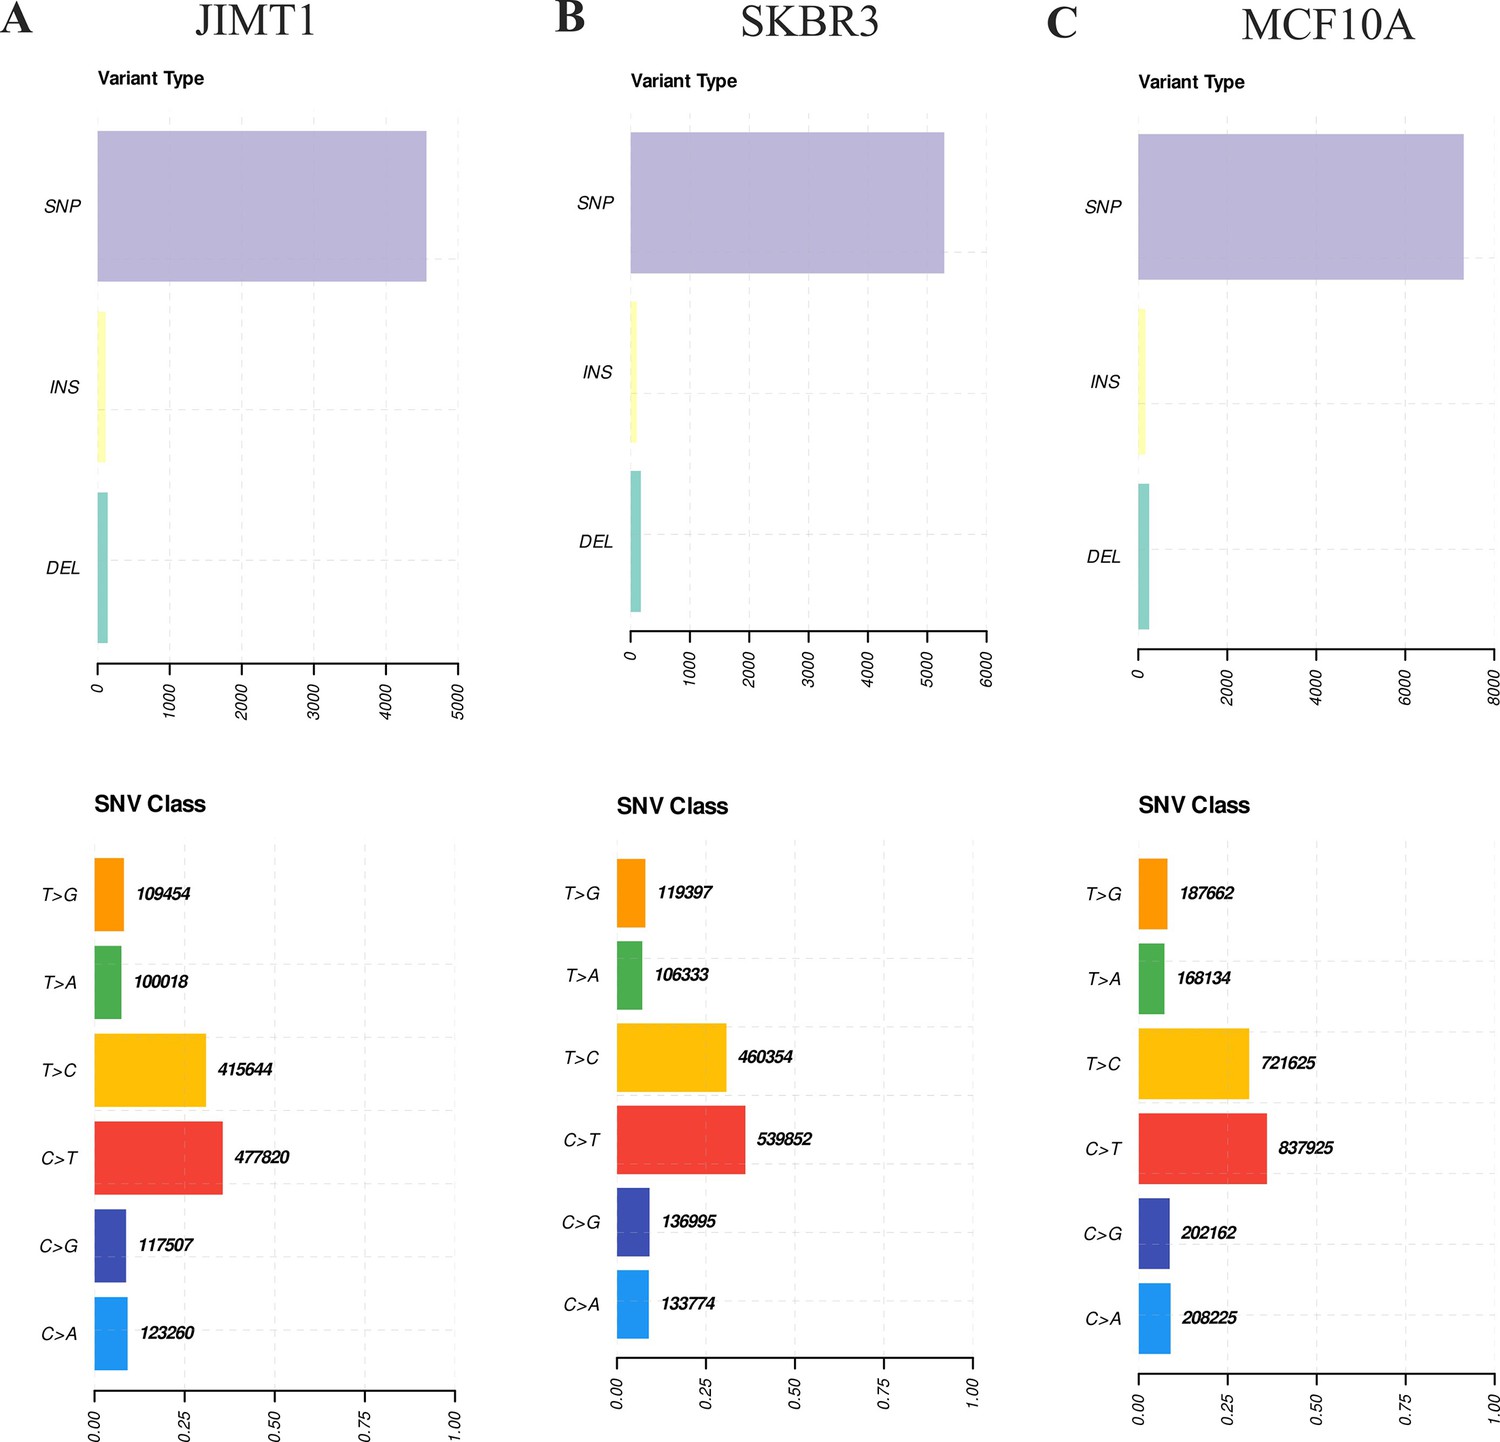
SNV characteristics in JIMT1, SKBR3, and MCF10A.
(A) The most frequent SNV type in JIMT1. (B) The most frequent SNV type in SKBR3. (C) The most frequent SNV type in MCF10A. SNV, single nucleotide variation.
Figure 6—figure supplement 5
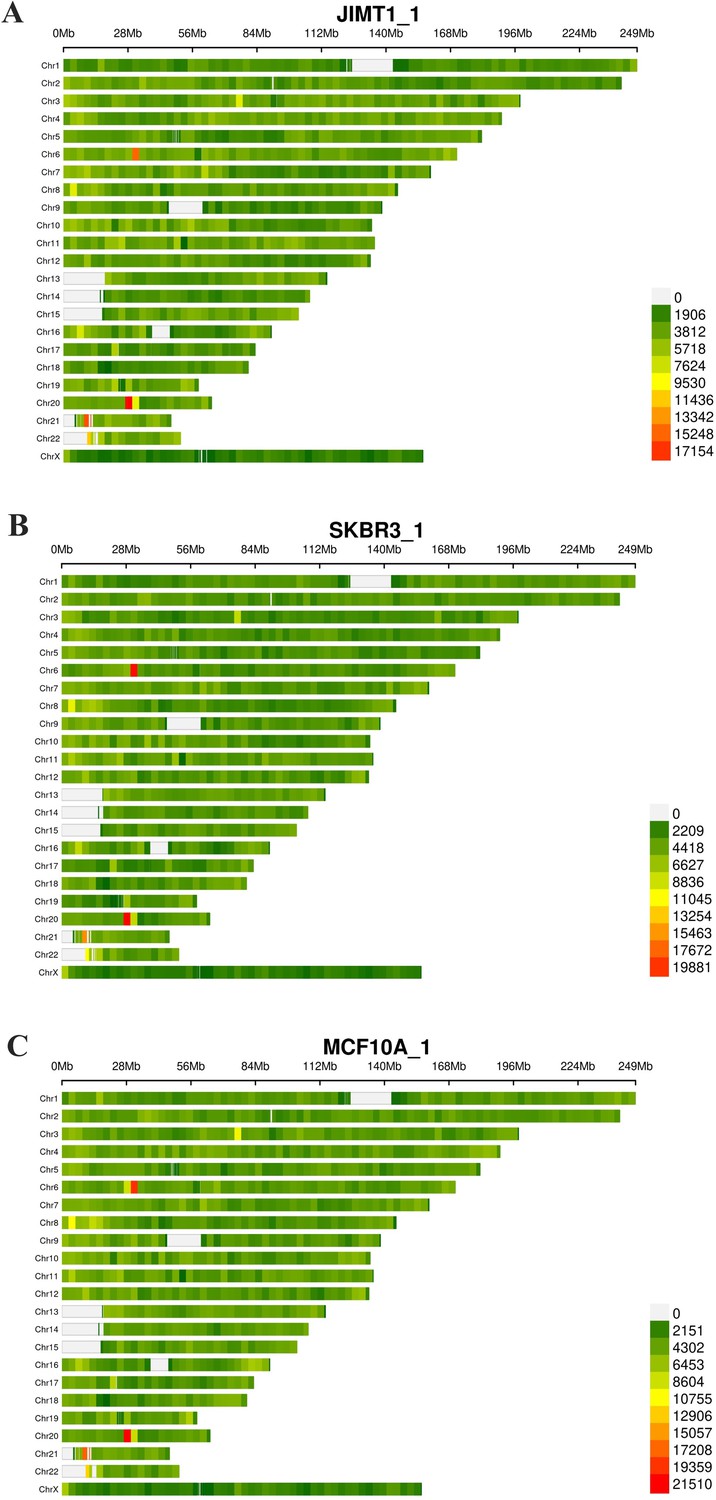
Density of SNP in JIMT1 (A), SKBR3 (B), and MCF10A (C) across the whole genome.
SNP, single nucleotide polymorphism.
Figure 6—figure supplement 6

Single nucleotide variations (SNVs) located in the exon region of SLC7A11 in JIMT1 (A), SKBR3 (B), and MCF10A (C).
Figure 6—figure supplement 7
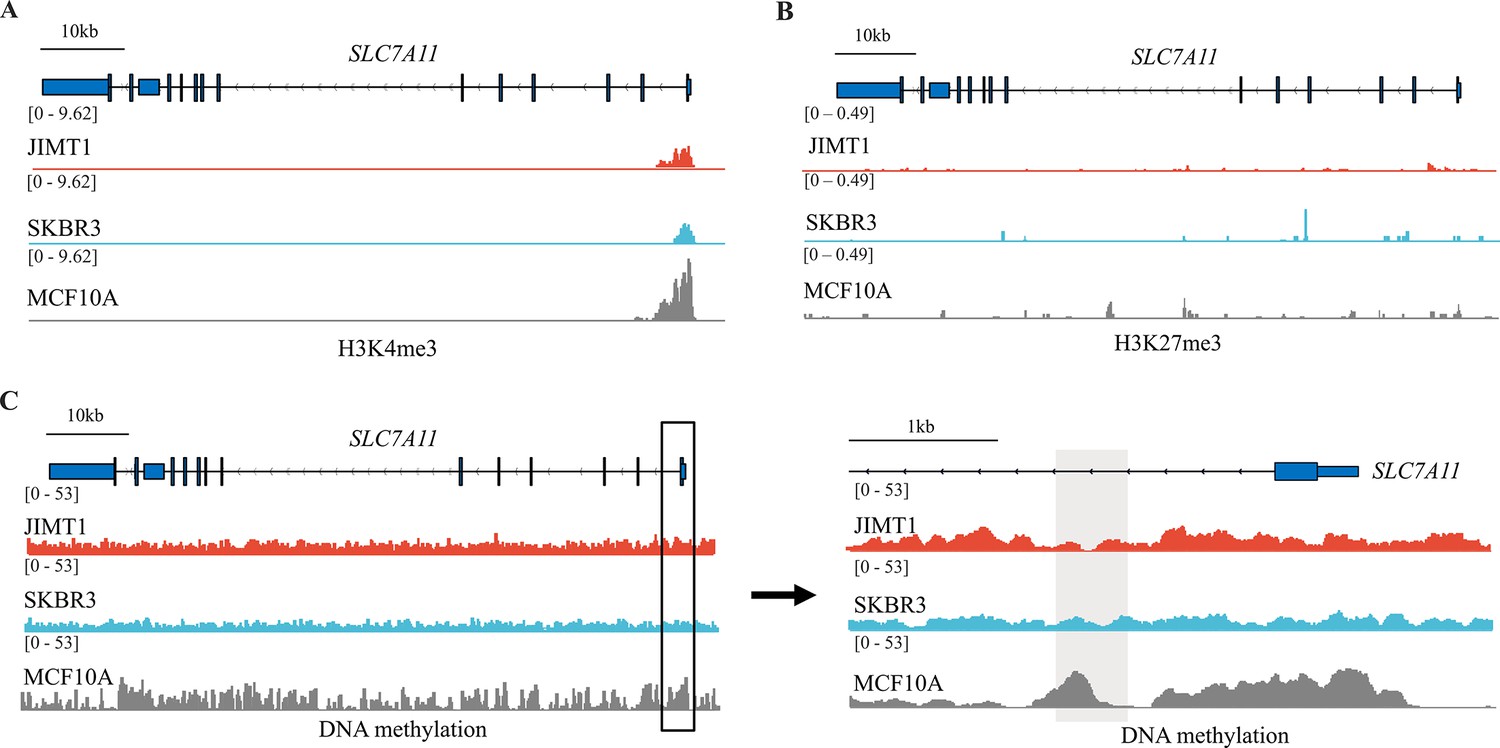
Different histone modifications and DNA methylation in SLC7A11 between JIMT1, SKBR3, and MCF10A.
(A, B) H3K4me3 (A) and H3K27me3 (B) peaks located in SLC7A11. (C) Abundance of 5-mC at SLC7A11 promoter regions.
Figure 7
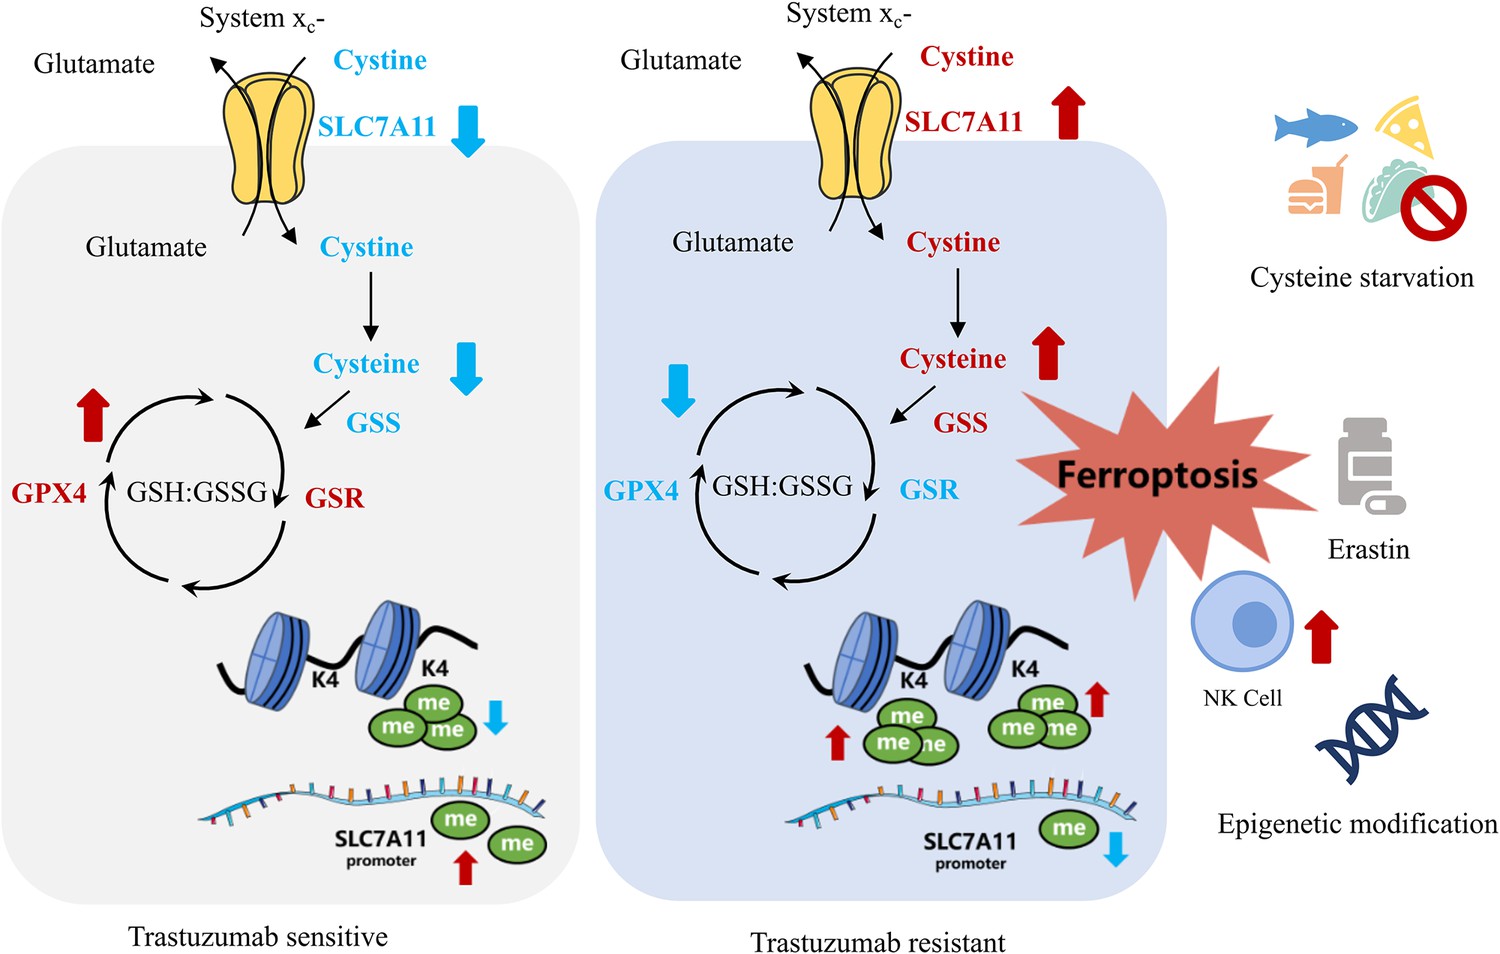
Summary of targeting cysteine metabolism in trastuzumab-resistant human epidermal growth factor receptor 2 (HER2)-positive breast cancer.
Additional files
-
Supplementary file 1
Oligonucleotide sequences and PCR primers sequences.
Table 1. Oligonucleotide sequences of siRNAs. Table 2. Oligonucleotides sequences of small guide RNAs (sgRNAs). Table 3. PCR primers sequences for ChIP and MeDIP tests.
- https://cdn.elifesciences.org/articles/103953/elife-103953-supp1-v1.docx
-
MDAR checklist
- https://cdn.elifesciences.org/articles/103953/elife-103953-mdarchecklist1-v1.pdf
Download links
A two-part list of links to download the article, or parts of the article, in various formats.
Downloads (link to download the article as PDF)
Open citations (links to open the citations from this article in various online reference manager services)
Cite this article (links to download the citations from this article in formats compatible with various reference manager tools)
Targeting SLC7A11-mediated cysteine metabolism for the treatment of trastuzumab-resistant HER2-positive breast cancer
eLife 14:RP103953.
https://doi.org/10.7554/eLife.103953.3


