Emergence of Dip2-mediated specific DAG-based PKC signalling axis in eukaryotes
- CSIR-Centre for Cellular and Molecular Biology, India
- Academy of Scientific and Innovative Research (AcSIR), India
- Department of Biology, Indian Institute of Science Education and Research (IISER), India
Figures
Figure 1 with 3 supplements
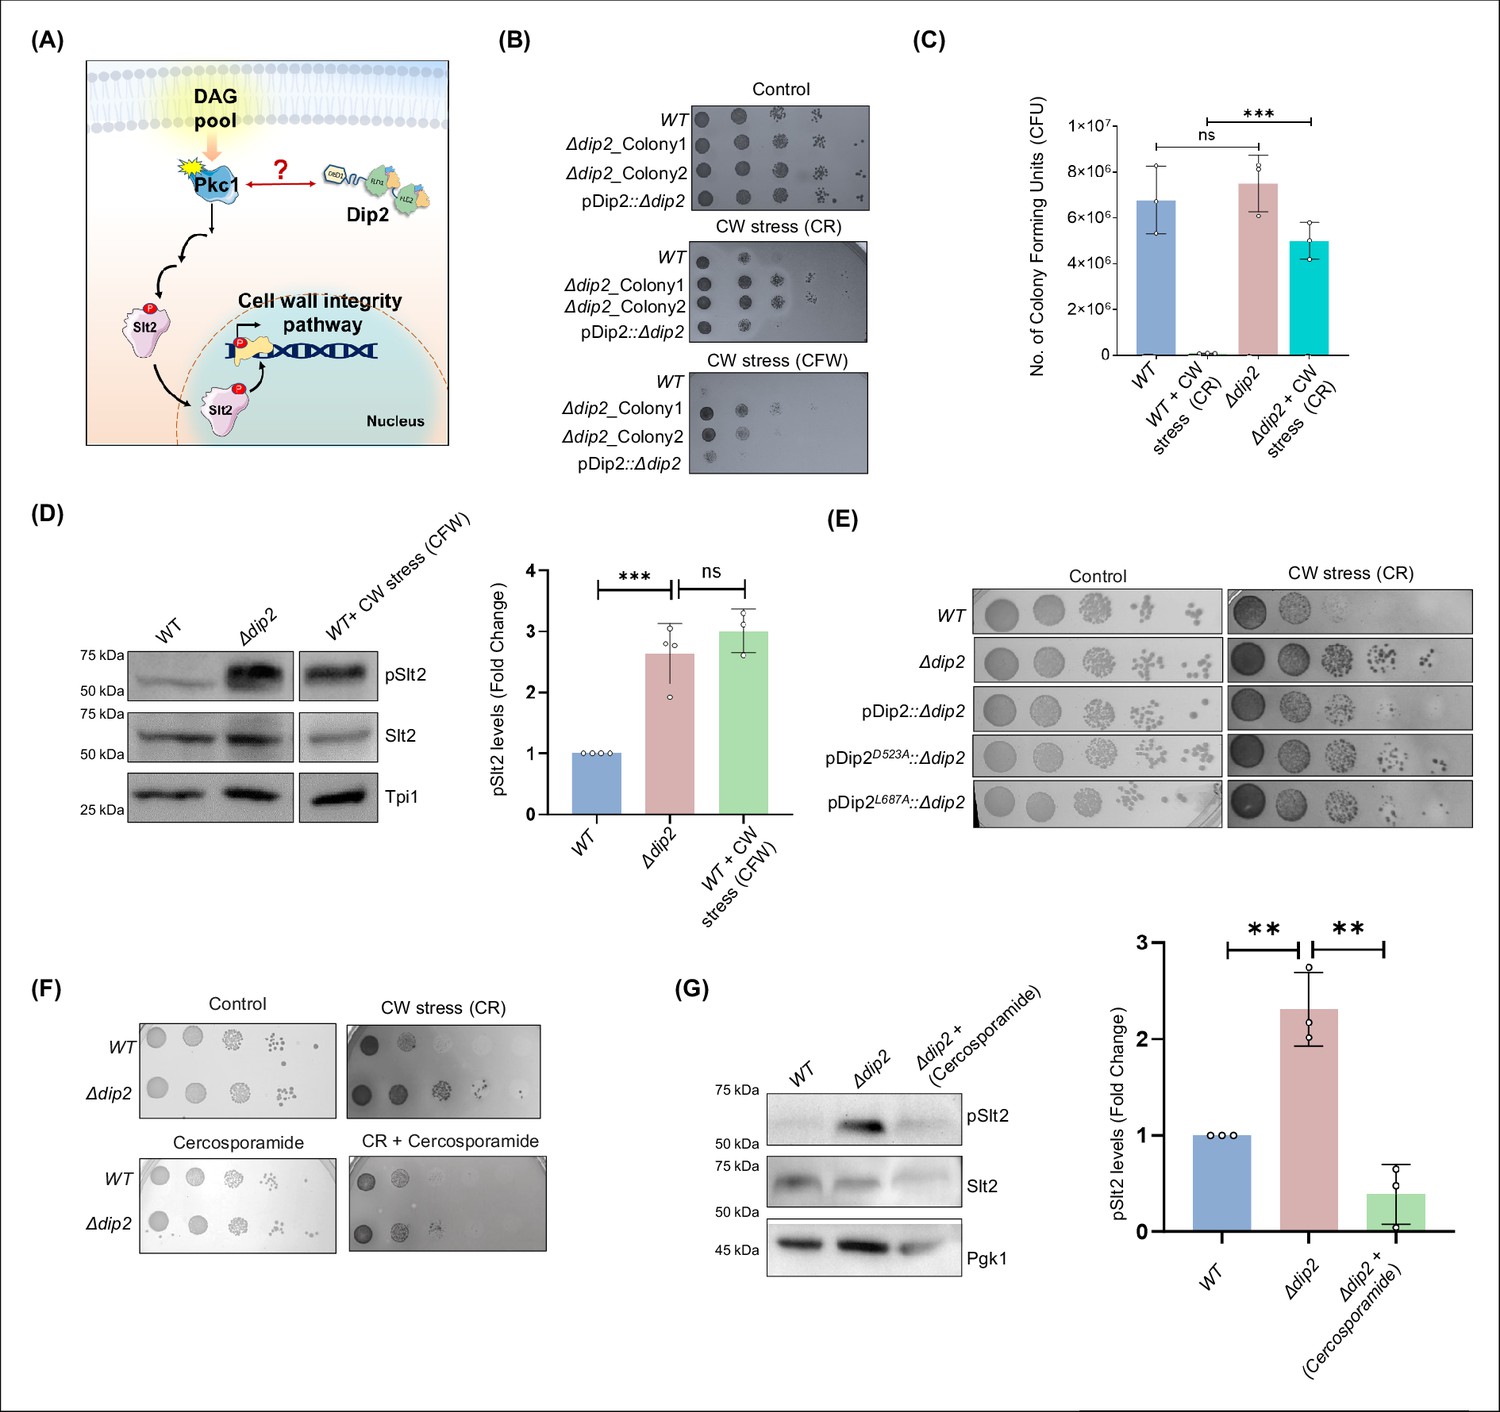
Deletion of disco-interacting protein 2 (Dip2) leads to increased cell wall stress resistance.
(A) A model depicting the possible role of Dip2 in regulating diacylglycerol (DAG) species required for protein kinase C (PKC) activation which governs the cell wall integrity (CWI) pathway in yeast by activating the downstream mitogen-activated protein kinase (MAPK) cascade. Activation of the MAPK cascade results in increased cell wall synthesis, thereby strengthening the cell wall. Dip2 has been depicted in its three-domain architecture, harbouring DMAP-binding domain 1 (DBD1), tandem fatty acyl-AMP ligase-like domains (FLD1 and FLD2). (B) Serial dilution assay for wild-type (WT), two biological replicates of Δdip2 (Δdip2_Colony1 and Δdip2_Colony2; Δdip2_Colony1 has been used for further experiments). pDip2::Δdip2 represents Δdip2_Colony1 complemented with Dip2 expressed under its native promoter. Control plate contains synthetic complete (SC) media and cell wall (CW) stress plate has either congo red (CR) (100 µg/mL) or calcofluor white (CFW) (50 µg/mL). N=3. (C) Colony forming units of WT and Δdip2 grown in SC media control and cell wall stress induced by CR (100 µg/mL). Data are represented as mean ± SD (unpaired, two-tailed Student’s t-test; n=3; ***p<0.001; ns = not significant). N=3. (D) Representative western blot showing pSlt2 (56 kDa) levels in WT and Δdip2 compared to the WT treated with CFW for 30 min, used as a positive control. Bar graph showing quantification of fold change in the pSlt2 levels, normalised with total Slt2. Triose phosphate isomerase (Tpi1) (27 kDa) has been used as a loading control. Data are represented as mean ± SD (unpaired, two-tailed Student’s t-test; n>3; ***p<0.001; ns = not significant). (E) Serial dilution assay image in synthetic complete (SC) media control plate and in the presence of Congo red (100 µg/mL) for WT and Δdip2 compared with Δdip2 complemented with wildtype and catalytically inactive Dip2 mutants (Dip2D523A and Dip2L687A), expressed in a plasmid pYSM7, under its native promoter. N=3. (F) Serial dilution assay for WT and Δdip2 grown in SD media control and in the presence of CR (100 µg/mL) and cercosporamide (2 µg/mL). N=3. (G) Representative western blot for WT, Δdip2, and cercosporamide treated Δdip2 showing the levels of pslt2 (56 kDa). Quantification of pSlt2 levels for Δdip2 treated with cercosporamide (5 µg/mL) compared to WT and Δdip2 control, normalised with total Slt2. Phosphoglycerate kinase (Pgk1) (45 kDa) has been used as a loading control. Data are represented as mean ± SD (unpaired, two-tailed Student’s t-test; N=3; **p<0.01; ns = not significant).
-
Figure 1—source data 1
Spot assay for WT, Δdip2, and pDip2::Δdip2 under cell wall stress.
PDF file containing original spot assay plate images for Figure 1B, indicating the relevant spots and treatments.
- https://cdn.elifesciences.org/articles/104011/elife-104011-fig1-data1-v1.zip
-
Figure 1—source data 2
Spot assay for WT, Δdip2, and pDip2::Δdip2 under cell wall stress.
Original files for spot assay plate images displayed in Figure 1B.
- https://cdn.elifesciences.org/articles/104011/elife-104011-fig1-data2-v1.zip
-
Figure 1—source data 3
Quantification of colony forming unit (CFU) for WT and Δdip2 in the presence of CR.
Excel file containing raw values for CFU counting displayed in Figure 1C.
- https://cdn.elifesciences.org/articles/104011/elife-104011-fig1-data3-v1.zip
-
Figure 1—source data 4
Western blot and quantification for wild-type (WT), Δdip2, and WT treated with calcofluor white (CFW).
PDF file containing original western blots for Figure 1D, indicating the relevant bands and treatments.
- https://cdn.elifesciences.org/articles/104011/elife-104011-fig1-data4-v1.zip
-
Figure 1—source data 5
Western blot and quantification for wild-type (WT), Δdip2, and WT treated with calcofluor white (CFW).
Original files for western blot analysis displayed in Figure 1D.
- https://cdn.elifesciences.org/articles/104011/elife-104011-fig1-data5-v1.zip
-
Figure 1—source data 6
Spot assay for the catalytic mutants of disco-interacting protein 2 (Dip2).
PDF file containing original spot assay plate images for Figure 1E, indicating the relevant spots and treatments.
- https://cdn.elifesciences.org/articles/104011/elife-104011-fig1-data6-v1.zip
-
Figure 1—source data 7
Spot assay for the catalytic mutants of disco-interacting protein 2 (Dip2).
Original files for spot assay plate images displayed in Figure 1E.
- https://cdn.elifesciences.org/articles/104011/elife-104011-fig1-data7-v1.zip
-
Figure 1—source data 8
Spot assay for wild-type (WT), Δdip2 in the presence of Congo red (CR) and cercosporamide.
PDF file containing original spot assay plate images for Figure 1F, indicating the relevant spots and treatments.
- https://cdn.elifesciences.org/articles/104011/elife-104011-fig1-data8-v1.zip
-
Figure 1—source data 9
Spot assay for wild-type (WT), Δdip2 in the presence of Congo red (CR) and cercosporamide.
Original files for spot assay plate images displayed in Figure 1F.
- https://cdn.elifesciences.org/articles/104011/elife-104011-fig1-data9-v1.zip
-
Figure 1—source data 10
Western blot and quantification for wild-type (WT), Δdip2, and Δdip2 treated with cercosporamide.
PDF file containing original western blots for Figure 1G, indicating the relevant bands and treatments.
- https://cdn.elifesciences.org/articles/104011/elife-104011-fig1-data10-v1.zip
-
Figure 1—source data 11
Western blot and quantification for wild-type (WT), Δdip2, and Δdip2 treated with cercosporamide.
Original files for western blot analysis displayed in Figure 1G.
- https://cdn.elifesciences.org/articles/104011/elife-104011-fig1-data11-v1.zip
Figure 1—figure supplement 1

Serial dilution assay in YPD media for wild-type (WT), Δdip2, pDip2::Δdip2 represents Δdip2 complemented with disco-interacting protein 2 (Dip2) expressed under its native promoter.
Control plate contains YPD media and cell wall (CW) stress plate has either congo red (CR) (100 μg/mL) or calcofluor white (CFW) (50 μg/mL). N=3.
-
Figure 1—figure supplement 1—source data 1
PDF file containing original spot assay plate images for Figure 1—figure supplement 1, indicating the relevant spots and treatments.
- https://cdn.elifesciences.org/articles/104011/elife-104011-fig1-figsupp1-data1-v1.zip
-
Figure 1—figure supplement 1—source data 2
Original files for spot assay plate images displayed in Figure 1—figure supplement 1.
- https://cdn.elifesciences.org/articles/104011/elife-104011-fig1-figsupp1-data2-v1.zip
Figure 1—figure supplement 2
Dip2-GFP mutant expression and pSlt2 quantification.
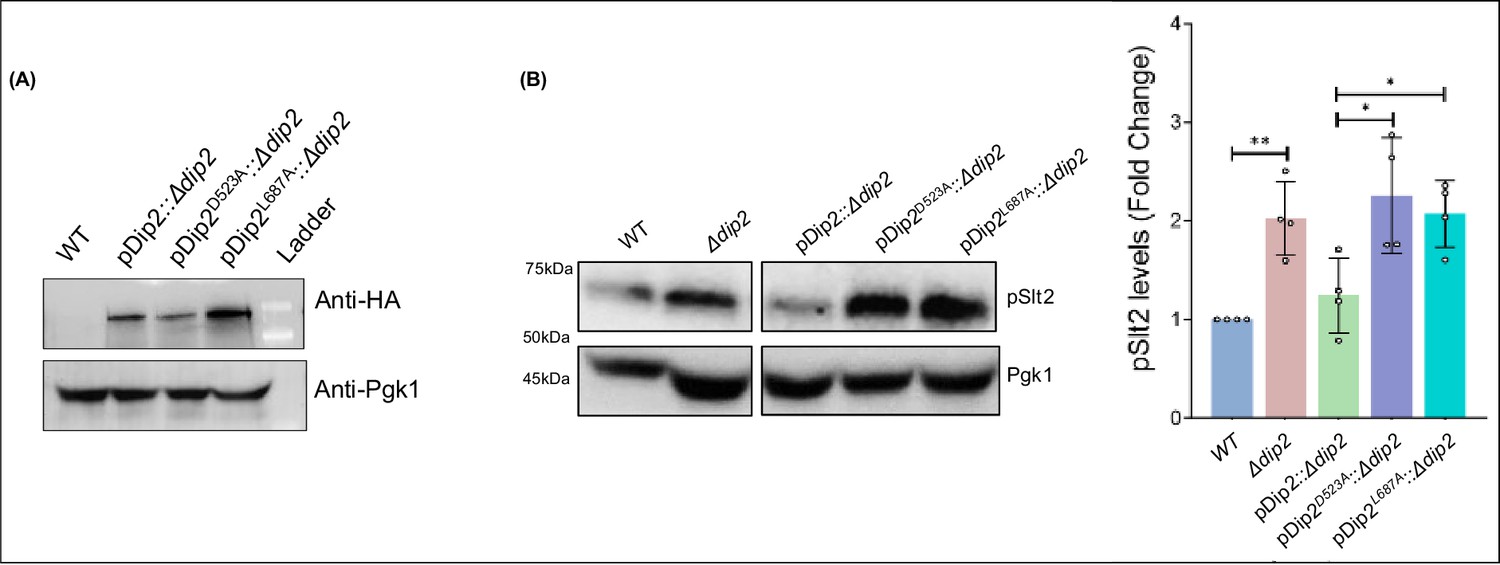
(A) Western blot image showing expression of wild-type Dip2-GFP-His-HA (219 kDa) and mutant Dip2 expressed in Δdip2.
WT serves as a negative control and Pgk1 (45 kDa) blot serves as the loading control. (B) Representative western blot image showing pSlt2 (56 kDa) levels on complementing Δdip2 with wildtype and catalytic mutant Dip2 (Dip2D523A and Dip2L687A). Quantification of pSlt2 levels for WT and mutant Dip2 complemented Δdip2 strain, normalised with total Slt2. Phosphoglycerate kinase (Pgk1) (45 kDa) has been used as a loading control. Data are represented as mean ± SD (unpaired, two-tailed Student’s t-test; N=3; *p<0.05; ns = not significant).
-
Figure 1—figure supplement 2—source data 1
PDF file containing original western blots for Figure 1—figure supplement 2A, indicating the relevant bands.
- https://cdn.elifesciences.org/articles/104011/elife-104011-fig1-figsupp2-data1-v1.zip
-
Figure 1—figure supplement 2—source data 2
Original files for western blot analysis displayed in Figure 4F.
- https://cdn.elifesciences.org/articles/104011/elife-104011-fig1-figsupp2-data2-v1.zip
-
Figure 1—figure supplement 2—source data 3
PDF file containing original western blots for Figure 1—figure supplement 2B, indicating the relevant bands.
- https://cdn.elifesciences.org/articles/104011/elife-104011-fig1-figsupp2-data3-v1.zip
-
Figure 1—figure supplement 2—source data 4
Original files for western blot analysis displayed in Figure 1—figure supplement 2B.
- https://cdn.elifesciences.org/articles/104011/elife-104011-fig1-figsupp2-data4-v1.zip
Figure 1—figure supplement 3
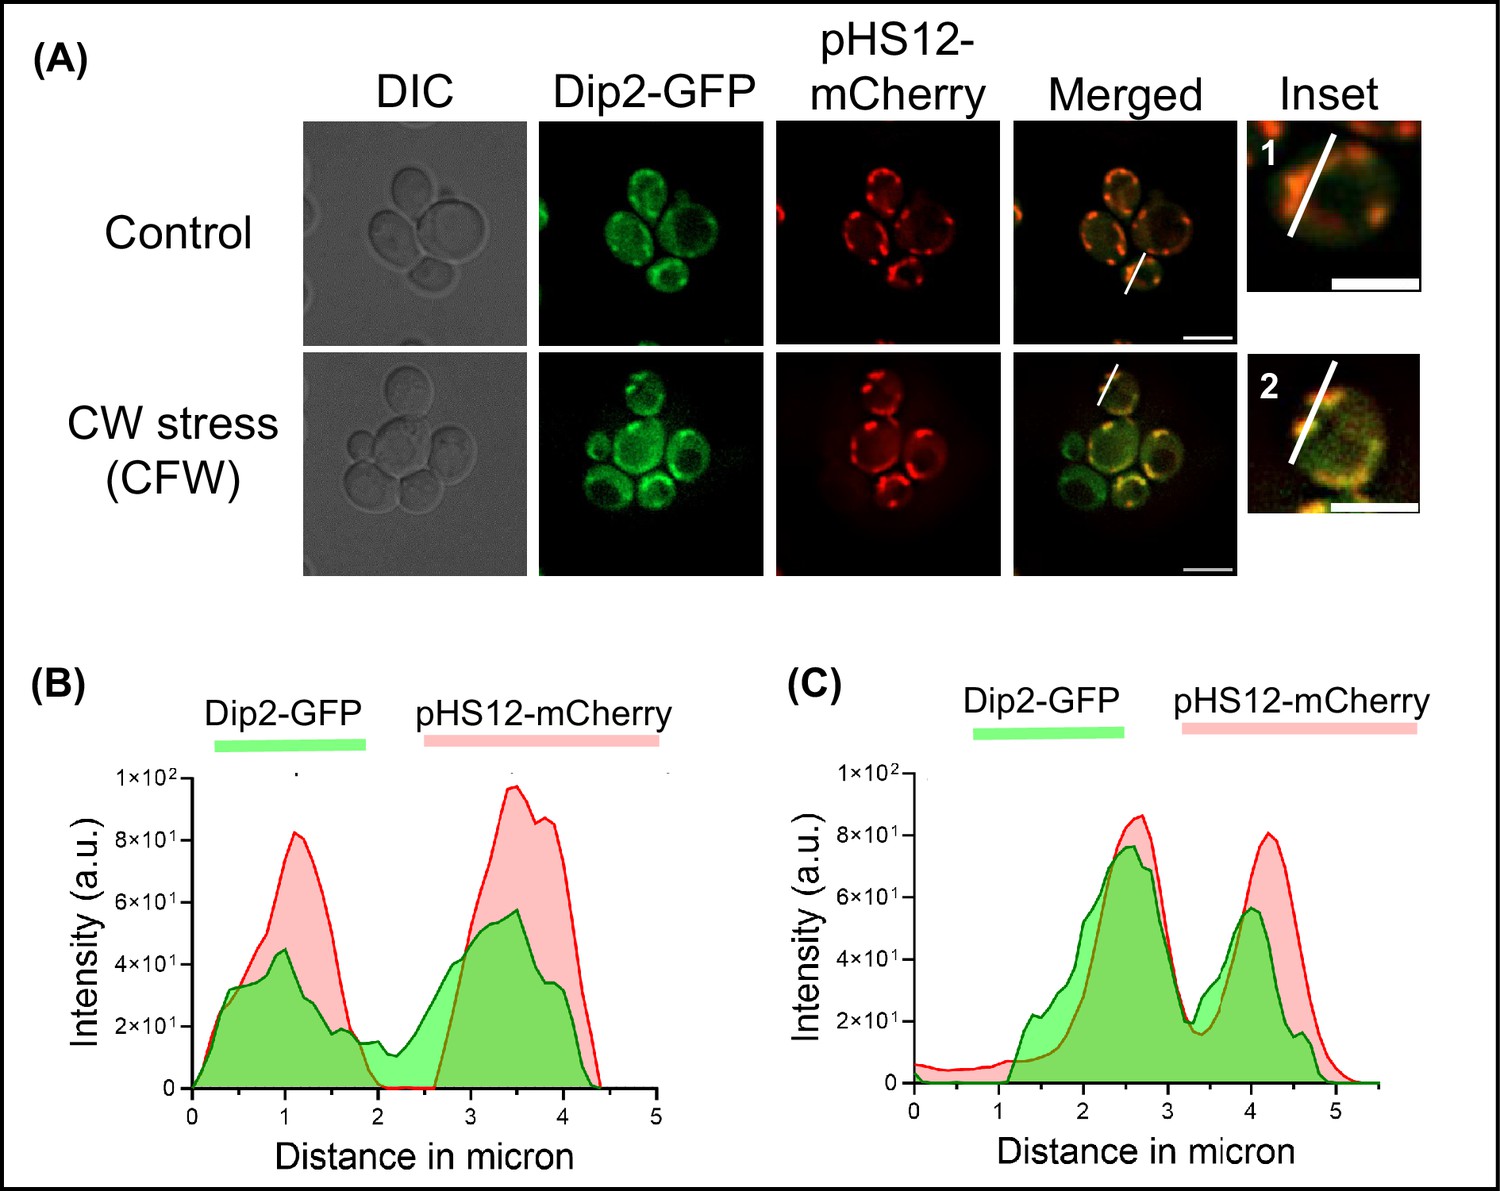
Localization of Dip2-GFP under cell wall stress condition.
(A) Microscopy image showing wild-type (WT) cells under normal condition (upper panel) and treated with calcofluor white (50 µg/mL) (lower panel). Endogenous disco-interacting protein 2 (Dip2) has been tagged with GFP, while mitochondria have been visualised by using a mitochondria-targeted mCherry plasmid transformed in Dip2-GFP cells. The enlarged images of representative bud cells for control and treated, marked with 1 and 2, respectively, are shown in inset. Scale bar = 5 µm. (B–C) Line scan of signal intensity along the white line shown in inset images of (A), marked 1 and 2, respectively.
-
Figure 1—figure supplement 3—source data 1
Original microscopy image for GFP and mCherry in disco-interacting protein 2 (Dip2)-GFP control.
- https://cdn.elifesciences.org/articles/104011/elife-104011-fig1-figsupp3-data1-v1.zip
Figure 2 with 3 supplements
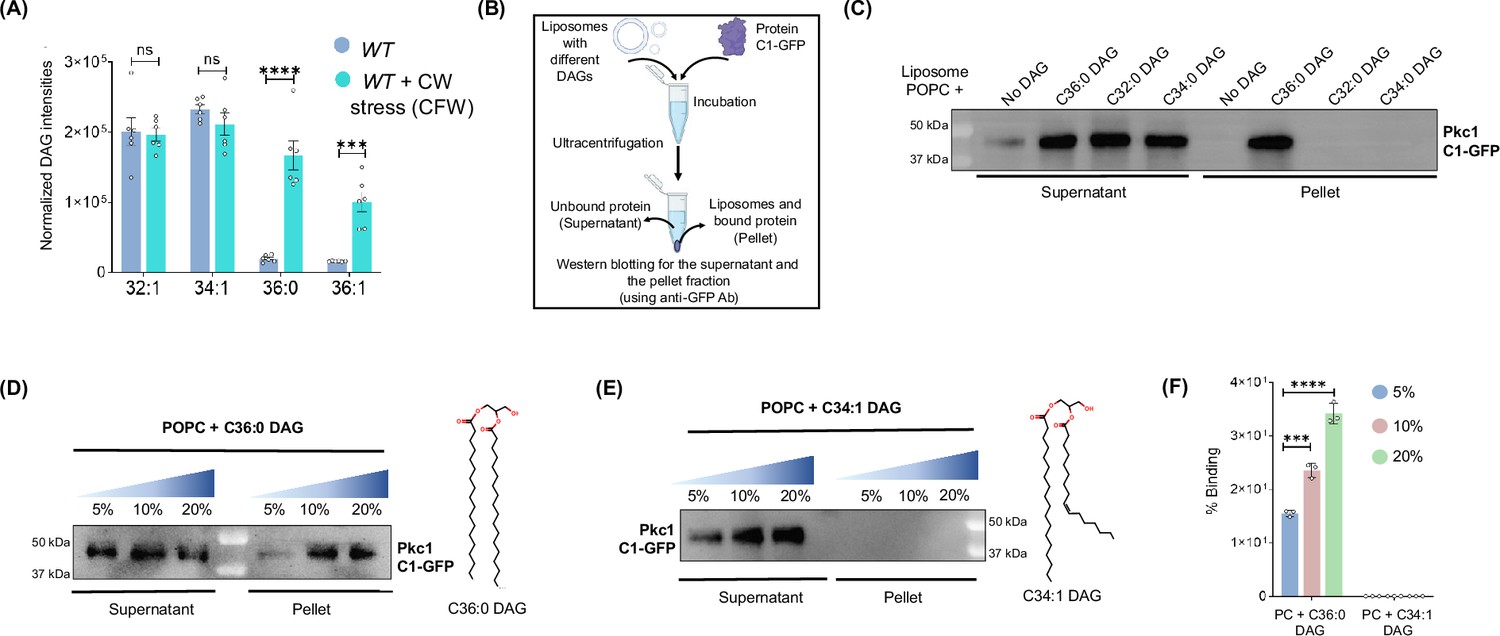
Disco-interacting protein 2 (Dip2)-regulated selective diacylglycerol (DAG) subspecies are associated with the activation of protein kinase C (PKC) signalling.
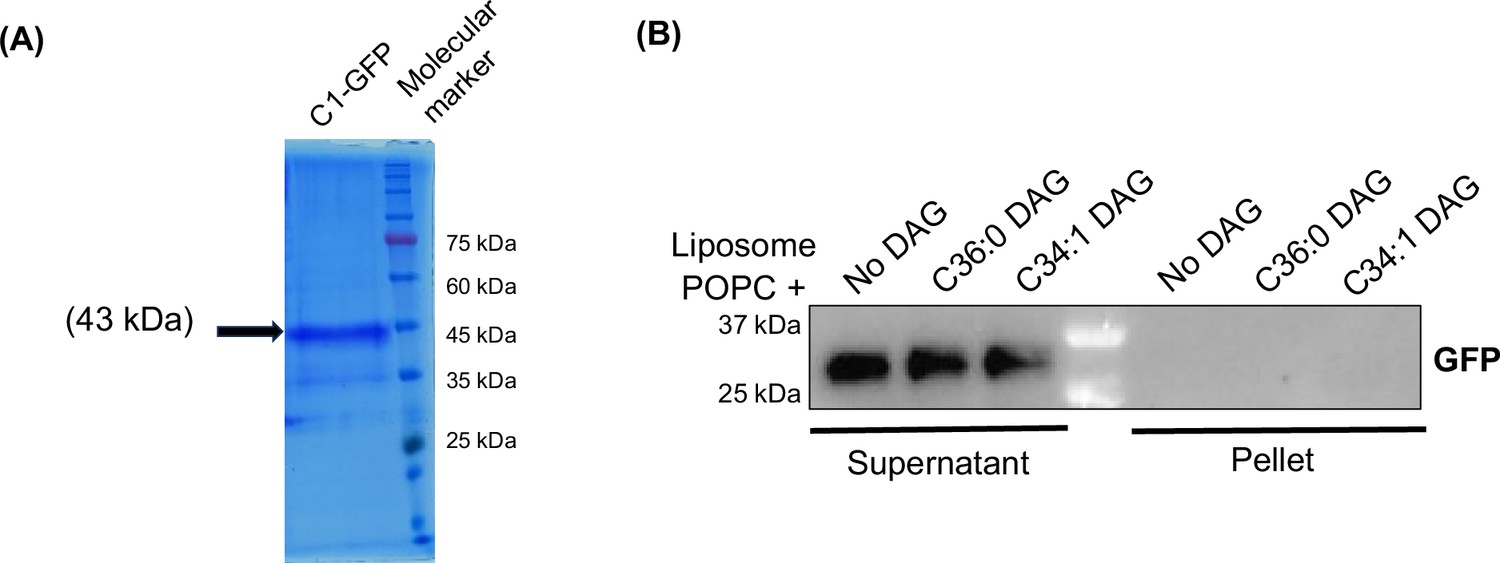
(A) Lipidomic analysis of wild-type (WT) treated with calcofluor white (CFW) (50 µg/mL) for 30 min. DAG intensities normalised to the total protein content in WT + CFW have been compared to the intensities from the same species in WT control sample. Data are represented as mean ± standard error of mean (SEM) (unpaired, two-tailed Student’s t-test; N=6). ****p<0.0001; ***p<0.001 ns=not significant. (B) A flowchart for the liposome sedimentation assay explaining the incubation of liposomes with protein, followed by ultracentrifugation and western blotting for supernatant (unbound protein) and pellet (bound protein) fraction. (C) Representative western blot for liposome sedimentation assay with different DAGs showing supernatant fraction (unbound protein) and pellet fraction (liposome bound protein), probed for C1 domain using anti-GFP antibody (43 k Da). N>3. (D) Western blot probing for C1 domain bound to different concentrations of C36:0 DAG containing liposomes (pellet fraction) and the unbound protein (supernatant fraction) using anti GFP antibody. Structure of respective DAGs is shown on the right side. N>3. (E) Western blot probing for C1 domain at different concentrations of C34:1 DAG containing liposomes in both pellet and supernatant fractions. Structure of respective DAGs has been shown on the right side. N>3. (F) Bar graph showing quantification of percentage binding of C1-GFP with increasing concentrations of specific (C36:0) and non-specific (C34:1) DAGs. Data are represented as mean ± SD (unpaired, two-tailed Student’s t-test; n=3; ***p<0.001; ns = not significant), N=3.
-
Figure 2—source data 1
Quantification of diacylglycerols (DAGs) in wild-type (WT) and calcofluor white (CFW)-treated WT.
Excel file containing raw values for DAG intensities displayed in Figure 2A.
- https://cdn.elifesciences.org/articles/104011/elife-104011-fig2-data1-v1.zip
-
Figure 2—source data 2
Western blot for C1-GFP incubated with different diacylglycerols (DAGs) containing liposomes.
PDF file containing original western blots for Figure 2C–E, indicating the relevant bands.
- https://cdn.elifesciences.org/articles/104011/elife-104011-fig2-data2-v1.zip
-
Figure 2—source data 3
Western blot for C1-GFP incubated with different diacylglycerols (DAGs) containing liposomes.
Original files for western blot analysis displayed in Figure 2C–E.
- https://cdn.elifesciences.org/articles/104011/elife-104011-fig2-data3-v1.zip
Figure 2—figure supplement 1
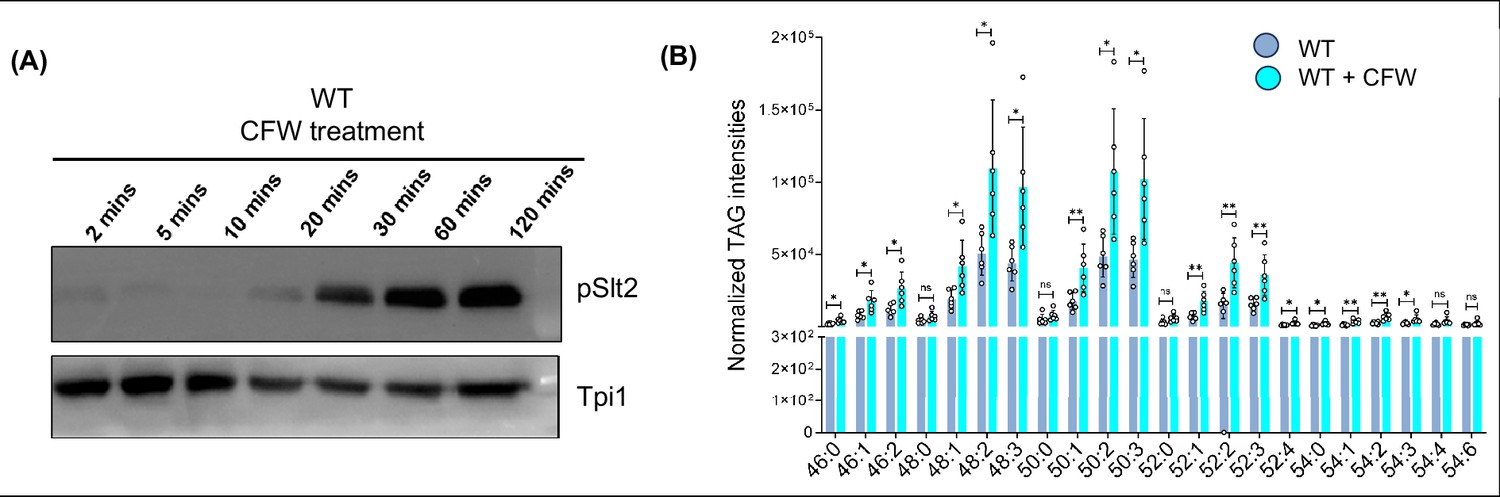
pSlt2 levels and TAG quantification in WT under cell wall stress condition.
(A) Representative western blot showing increasing activation of Pkc1 pathway (the level of pSlt2) in a time-dependent manner upon calcofluor white (CFW) treatment (50 μg/mL). Tpi1 (27 kDa) has been used as a loading control. (B) Lipidomic quantification of triacylglycerols (TAGs) for wild-type (WT) cells under cell wall stress in the presence of CFW (50 µg/mL) compared to WT under normal growth conditions.
-
Figure 2—figure supplement 1—source data 1
PDF file containing original western blots for Figure 2—figure supplement 1A, indicating the relevant bands.
- https://cdn.elifesciences.org/articles/104011/elife-104011-fig2-figsupp1-data1-v1.zip
-
Figure 2—figure supplement 1—source data 2
Original files for western blot analysis displayed in Figure 2—figure supplement 1A.
- https://cdn.elifesciences.org/articles/104011/elife-104011-fig2-figsupp1-data2-v1.zip
-
Figure 2—figure supplement 1—source data 3
Excel file containing raw values for triacylglycerol (TAG) intensities displayed in Figure 2—figure supplement 1B.
- https://cdn.elifesciences.org/articles/104011/elife-104011-fig2-figsupp1-data3-v1.zip
Figure 2—figure supplement 2
PKC C1 GFP expression and Negative control for GFP in liposome sedimentation assay.
(A) Coomassie stained SDS-PAGE gel image of purified Pkc1-C1 domain, expressed and purified from yeast. (B) Western blot showing no binding (in the pellet fraction) in case of incubation of liposomes with only GFP as a negative control.
Figure 2—figure supplement 3
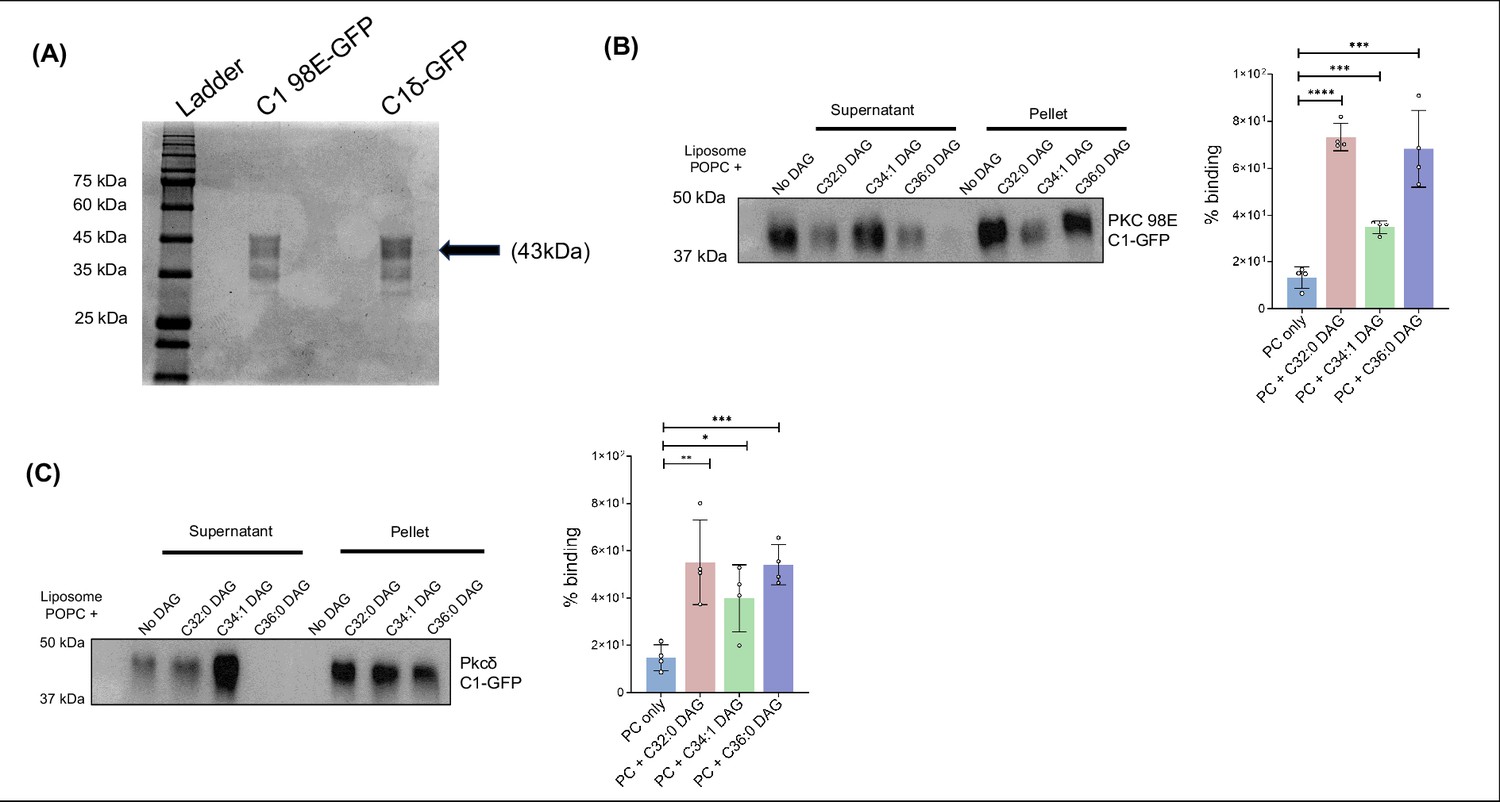
Lipisome sedimentation assay for PKC C1 domains form Drosophila melanogaster (C1 98E-GFP) and Rattus novegicus (C1δ-GFP).
(A) SDS-PAGE gel stained with Coomassie showing purified C1 domain of Drosophila melanogaster (C1 98E-GFP) and Rattus novegicus (C1δ-GFP). (B) Liposome binding assay for Pkc98E C1 domain from Drosophila melanogaster for multiple diacylglycerols (DAGs), probed using anti-GFP antibody. Bar graph showing the percentage of DAG binding of Pkc98E C1 domain for different DAG subspecies. (C) Liposome binding assay for Pkcδ C1 domain from Rattus novergicus for multiple DAGs, probed using anti-GFP antibody. Bar graph showing the percentage of DAG binding of Pkcδ C1 domain for different DAG subspecies.
-
Figure 2—figure supplement 3—source data 1
PDF file containing original western blots for Figure 2—figure supplement 3A-C indicating the relevant bands.
- https://cdn.elifesciences.org/articles/104011/elife-104011-fig2-figsupp3-data1-v1.zip
-
Figure 2—figure supplement 3—source data 2
Original files for western blot analysis displayed in Figure 2—figure supplement 3A-C.
- https://cdn.elifesciences.org/articles/104011/elife-104011-fig2-figsupp3-data2-v1.zip
Figure 3 with 2 supplements
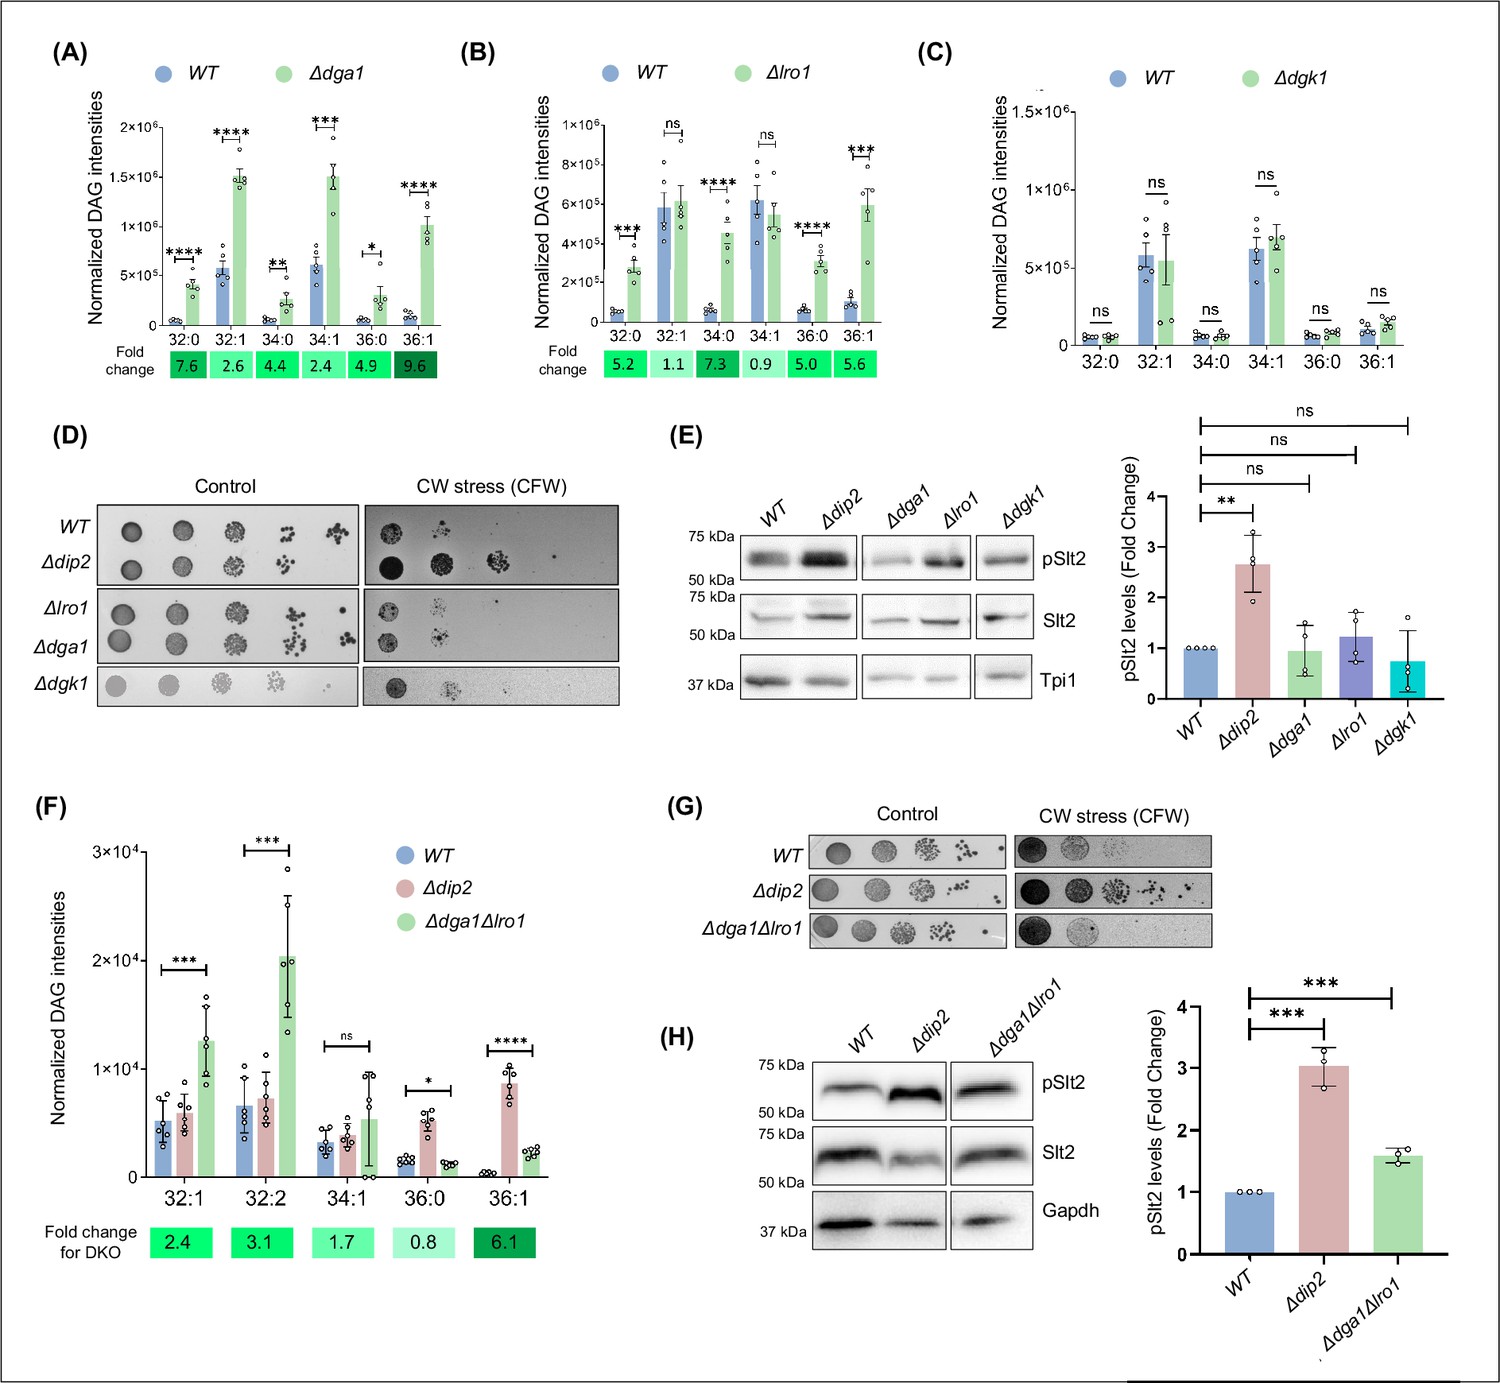
Protein kinase C (PKC) activation is independent of the bulk diacylglycerol (DAG) metabolism pathway.
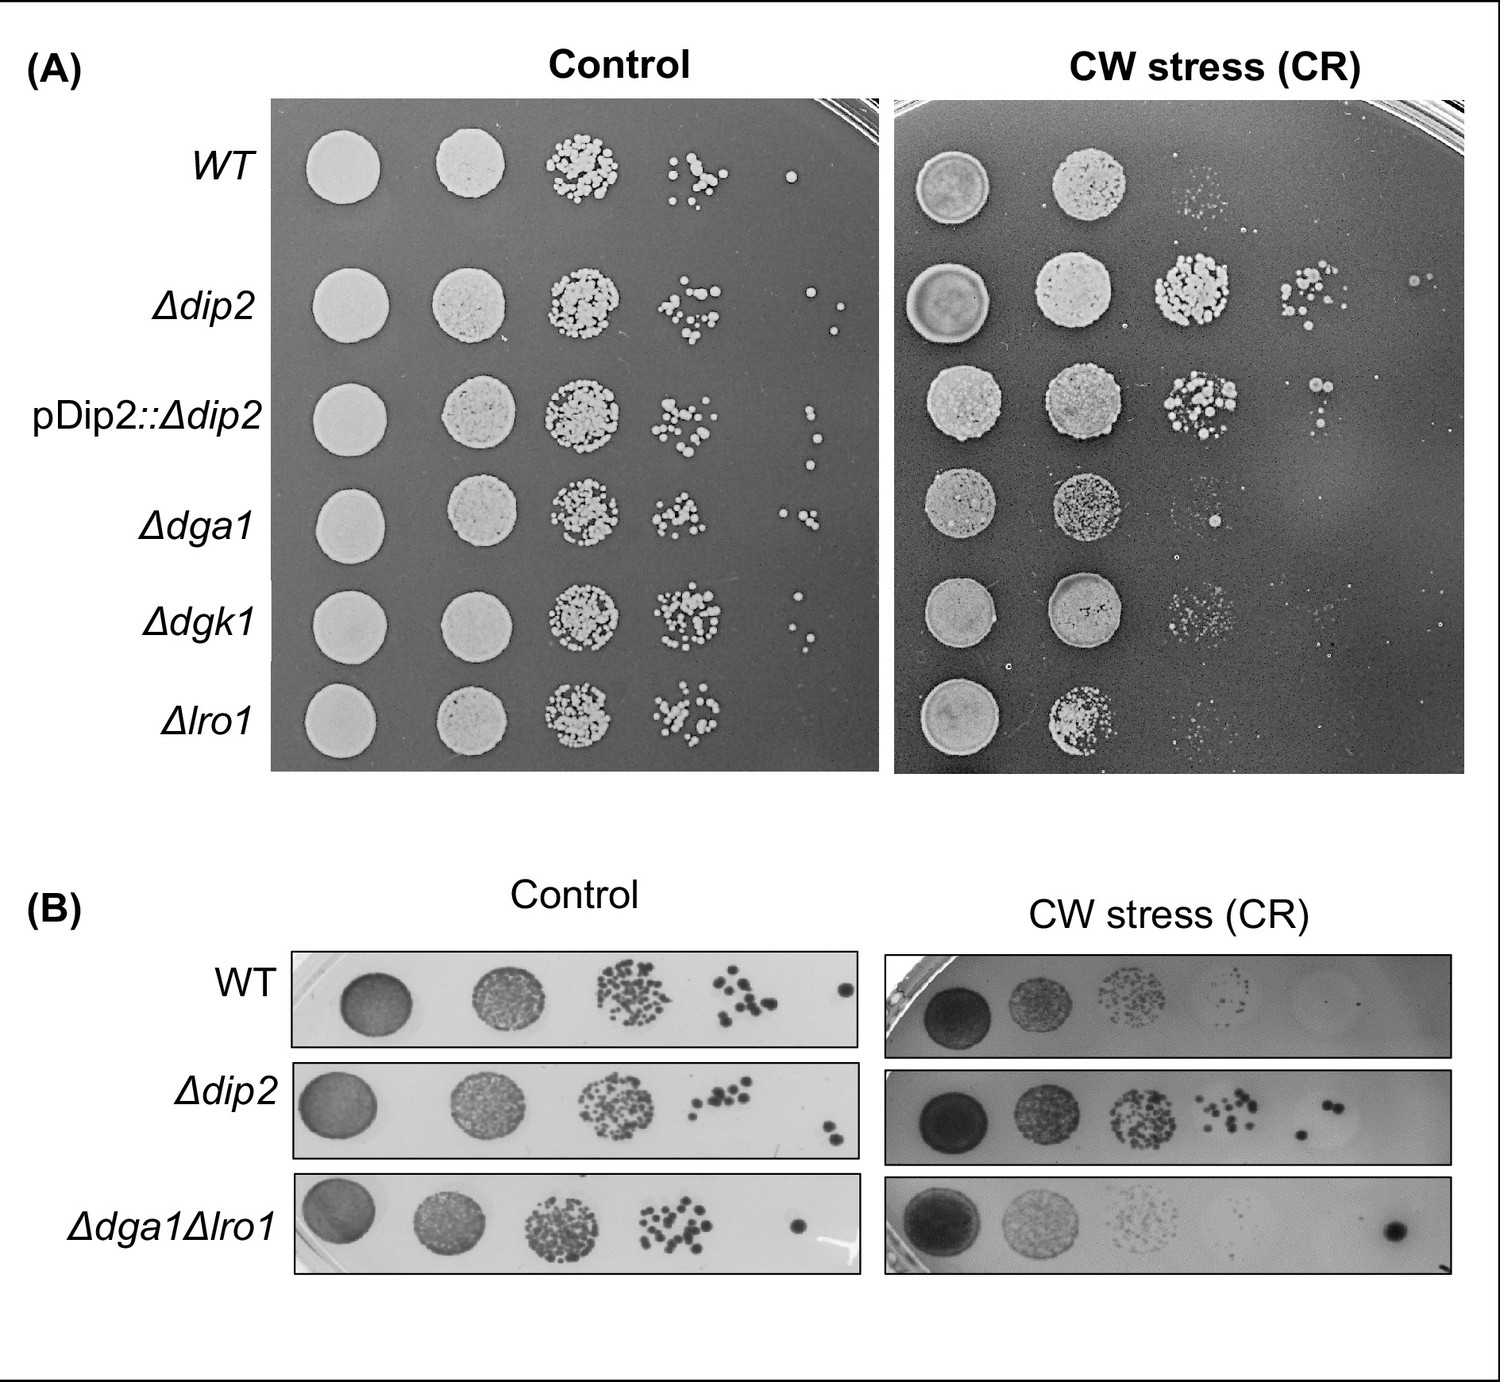
(A–C) Lipidomic analysis of DAGs in Δdga1, Δlro1, and Δdgk1, compared to wild-type (W)T. Fold change values are mentioned below and are represented as green colour gradient. Data are represented as mean ± SEM (unpaired, two-tailed Student’s t-test; N=5) ****p<0.0001; ***p<0.001; **p<0.01; *p<0.05; ns = not significant. (D) Serial dilution assay for single knockouts of bulk DAG acting enzymes (Dga1, Lro1 and Dgk1) in the presence of calcofluor white (CFW) (50 µg/mL), compared to synthetic complete (SC) media control plate. N=3. (E) Representative western blot and quantification of pSlt2 (56 kDa) levels in deletion strains of DAG metabolising enzymes. Fold change has been quantified with respect to the total Slt2. Triose phosphate isomerase (Tpi1) (27 kDa) has been used as a loading control. Data are represented as mean ± SD (unpaired, two-tailed Student’s t-test); N=4; ****p<0.0001; *p<0.05; ns = not significant. (F) DAG subspecies quantification using lipidomics for the double knockout of LRO1 and DGA1, compared to WT and Δdip2. Data are represented as mean ± SEM (unpaired, two-tailed Student’s t-test); n=6; ****p<0.0001; ***p<0.00; *p<0.05; ns = not significant. (G) Serial dilution assay image for the cell wall stress sensitivity of Δdga1Δlro1, compared to WT and Δdip2, in the presence of CFW (50 µg/mL), compared to SC media control plate. N=3. SC media control image is reused in Figure 3—figure supplement 2. (H) Representative western blot for pSlt2 (56 kDa) estimation in Δdga1Δlro1, compared to total Slt2 and a loading control Glyceraldehyde-3-phosphate dehydrogenase (Gapdh) (36 kDa). Fold change has been quantified with respect to the total Slt2. Data are represented as mean ± SD (unpaired, two-tailed Student’s t-test); N=3; **p<0.01; ns = not significant.
-
Figure 3—source data 1
Quantification of diacylglycerol (DAG) in Δdga1, Δlro1, Δdgk1, and Δlro1Δdgk1 DKO.
Excel file containing raw values for DAG intensities displayed in Figure 3A–C and F.
- https://cdn.elifesciences.org/articles/104011/elife-104011-fig3-data1-v1.zip
-
Figure 3—source data 2
Spot assay for single knock outs of diacylglycerol (DAG) acting enzymes.
PDF file containing original spot assay plate images for Figure 3D, indicating the relevant spots and treatments.
- https://cdn.elifesciences.org/articles/104011/elife-104011-fig3-data2-v1.zip
-
Figure 3—source data 3
Spot assay for single knock outs of diacylglycerol (DAG) acting enzymes.
Original files for spot assay plate images displayed in Figure 3D.
- https://cdn.elifesciences.org/articles/104011/elife-104011-fig3-data3-v1.zip
-
Figure 3—source data 4
Western blots and quantification for single knockouts of diacylglycerol (DAG) acting enzymes.
PDF file containing original western blots for Figure 3E, indicating the relevant bands.
- https://cdn.elifesciences.org/articles/104011/elife-104011-fig3-data4-v1.zip
-
Figure 3—source data 5
Western blots and quantification for single knockouts of diacylglycerol (DAG) acting enzymes.
- https://cdn.elifesciences.org/articles/104011/elife-104011-fig3-data5-v1.zip
-
Figure 3—source data 6
Spot assay for double knockouts of LRO1 and DGA1 in the presence of calcofluor white (CFW).
PDF file containing original spot assay plate images for Figure 3G, indicating the relevant spots and treatments.
- https://cdn.elifesciences.org/articles/104011/elife-104011-fig3-data6-v1.zip
-
Figure 3—source data 7
Spot assay for double knockouts of LRO1 and DGA1 in the presence of calcofluor white (CFW).
Original files for spot assay plate images displayed in Figure 3G.
- https://cdn.elifesciences.org/articles/104011/elife-104011-fig3-data7-v1.zip
-
Figure 3—source data 8
Western blots and quantification of pSLt2 for double knockouts of LRO1 and DGA1.
PDF file containing original western blots for Figure 3H, indicating the relevant bands.
- https://cdn.elifesciences.org/articles/104011/elife-104011-fig3-data8-v1.zip
-
Figure 3—source data 9
Western blots and quantification for single knockouts of diacylglycerol (DAG) acting enzymes.
Original files for western blot analysis displayed in Figure 3H.
- https://cdn.elifesciences.org/articles/104011/elife-104011-fig3-data9-v1.zip
Figure 3—figure supplement 1
Serial dilution assay for DGA1, LRO1 and DGK1 deletions under cell wall stress condition.
(A) Serial dilution assay for single deletions of diacylglycerol (DAG) acting enzyme genes (DGA1, LRO1, and DGK1) in the presence of congo red (CR) (100 μg/ml). N=3. (B) Serial dilution assay for the cell wall stress sensitivity of Δdga1Δlro1, compared to wild-type (WT) and ∆dip2, in the presence of CR (100 µg/mL), compared to synthetic complete (SC) media control plate. N=3. SC media control image is same as that of Figure 3G.
-
Figure 3—figure supplement 1—source data 1
PDF file containing original spot assay plate images for Figure 3—figure supplement 1A, indicating the relevant spots and treatments.
- https://cdn.elifesciences.org/articles/104011/elife-104011-fig3-figsupp1-data1-v1.zip
-
Figure 3—figure supplement 1—source data 2
Original files for spot assay plate images displayed in Figure 3—figure supplement 1A.
- https://cdn.elifesciences.org/articles/104011/elife-104011-fig3-figsupp1-data2-v1.zip
-
Figure 3—figure supplement 1—source data 3
PDF file containing original spot assay plate images for Figure 3—figure supplement 1B, indicating the relevant spots and treatments.
- https://cdn.elifesciences.org/articles/104011/elife-104011-fig3-figsupp1-data3-v1.zip
-
Figure 3—figure supplement 1—source data 4
Original files for spot assay plate images displayed in Figure 3—figure supplement 1B.
- https://cdn.elifesciences.org/articles/104011/elife-104011-fig3-figsupp1-data4-v1.zip
Figure 3—figure supplement 2
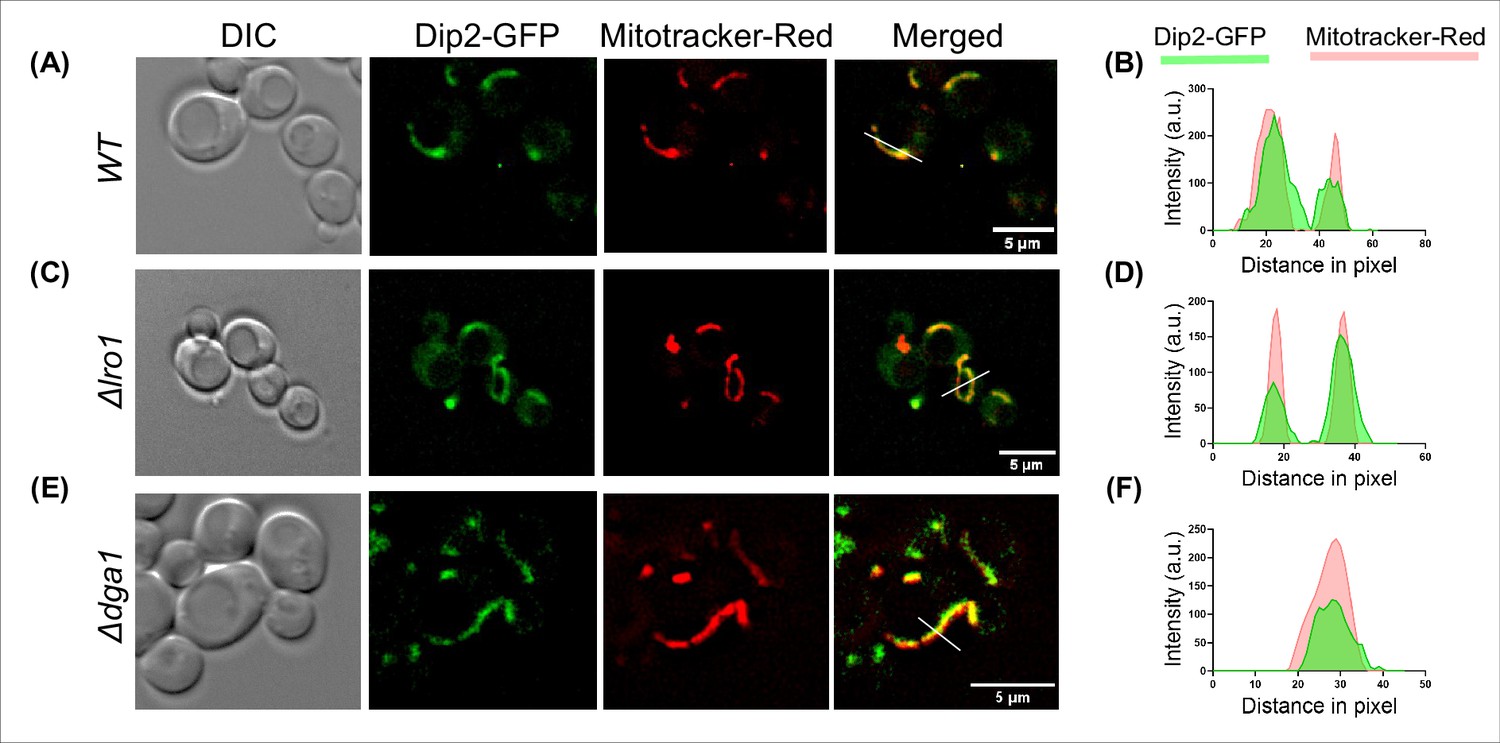
Live cell microscopy images showing the DIC images (left), disco-interacting protein 2 (Dip2) tagged with GFP (green), Mitotracker Red (red), and merged images for red and green channels (right) for (A) wild-type (WT), (C) Δlro1, and (E) Δdga1.
Scale bar represents 5 µm. Line scan of signal intensity along the white lines shown in the respective merged images of (B) WT, (D) Δlro1 and (F) Δdga1. Green and red peaks represent Dip2-GFP and mitotracker red, respectively.
Figure 4 with 4 supplements
Psi1-Plc1-Dip2 triad axis regulates selective diacylglycerol (DAG) subspecies to modulate protein kinase C (PKC) signalling.
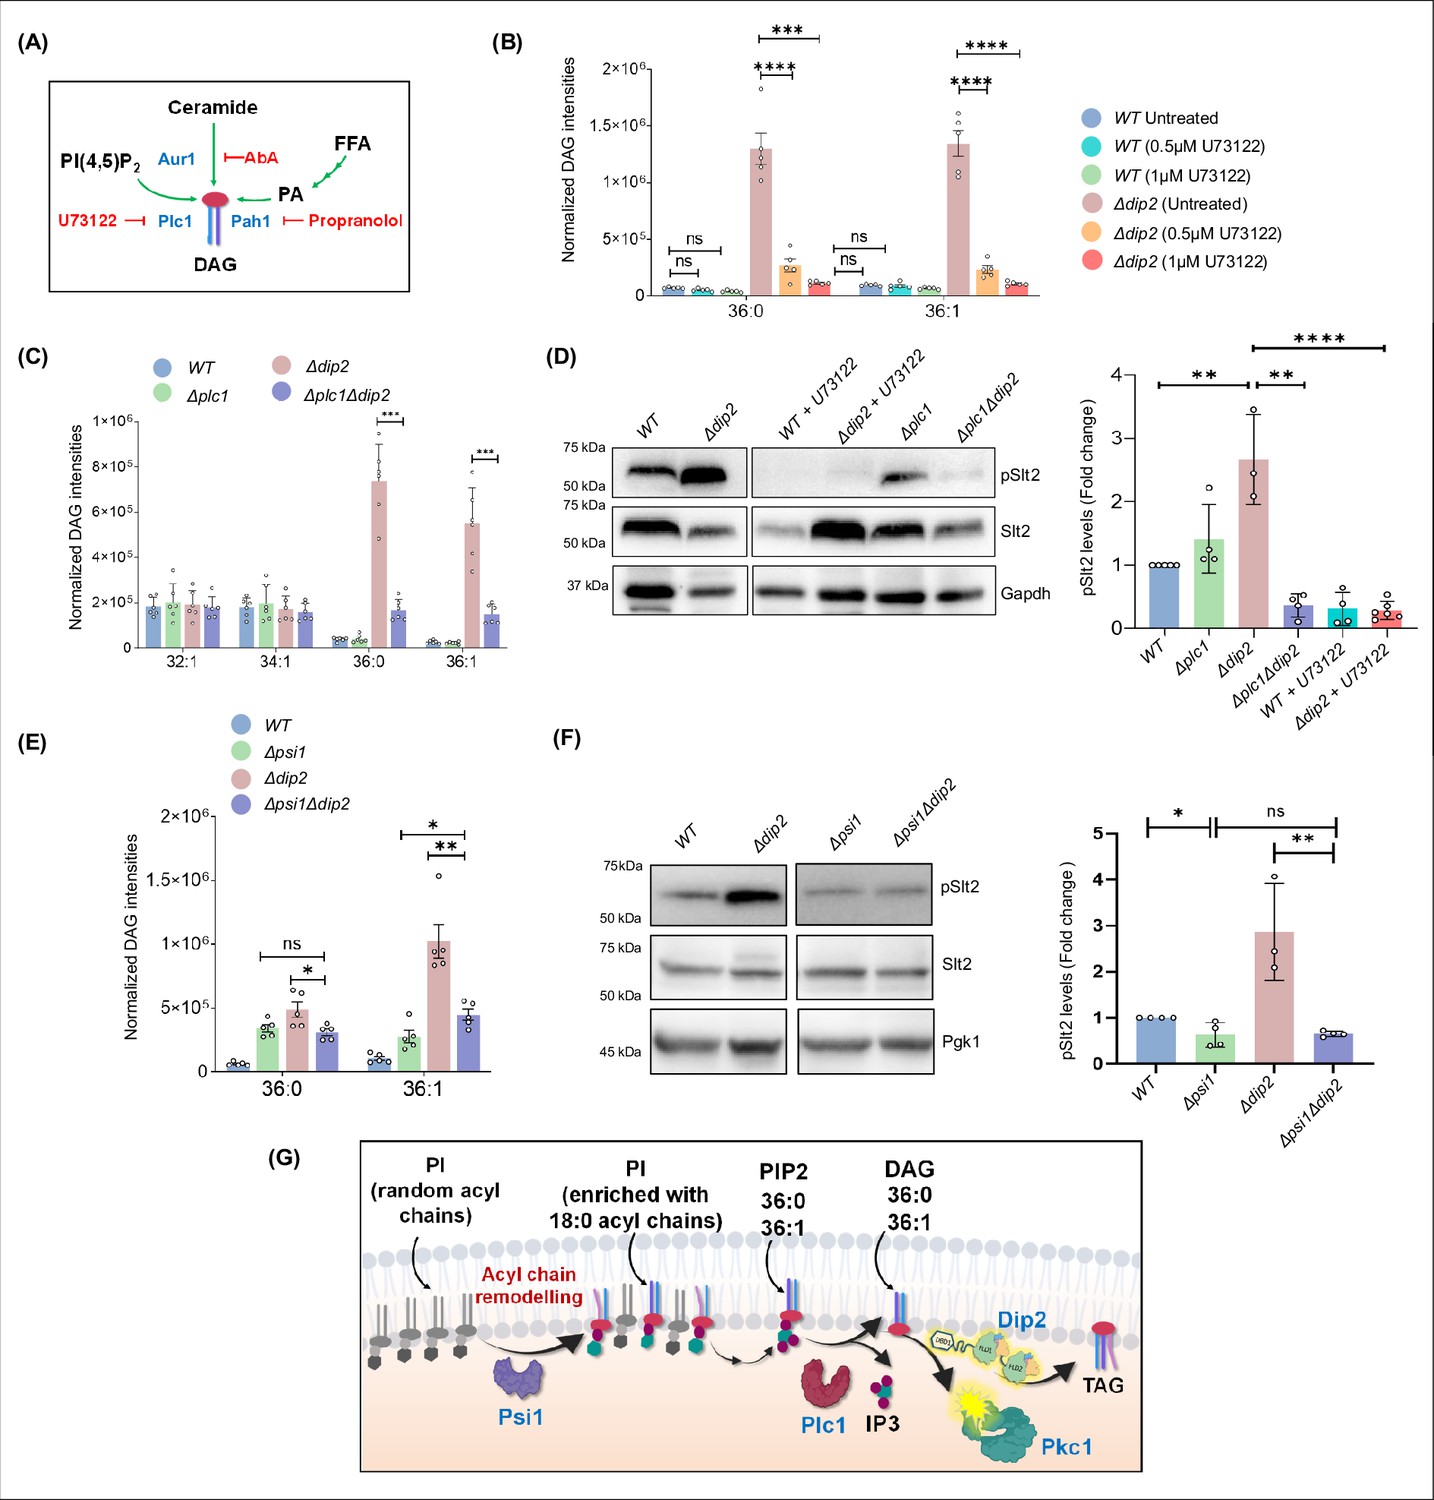
(A) Schematic showing various pathways (green arrows) that feed into the production of DAGs in the presence of various enzymes (shown in blue) and different chemical inhibitors (red) blocking the respective pathways. (B) Quantification of selective DAGs in wild-type (WT) and Δdip2 samples treated with two different concentrations, i.e., 0.5 and 1 µM of U73122. Data are represented as mean ± SEM (unpaired, two-tailed Student’s t-test; N=5). ****p<0.0001; ***p<0.001; ns = not significant. (C) Specific DAG quantification using lipidomics for deletion of Δplc1 and Δplc1Δdip2. Data are represented as mean ± SEM (unpaired, two-tailed Student’s t-test; n=6). ****p<0.0001; ***p<0.001 ns=not significant. N=6. (D) Representative western blot image and quantification of pSlt2 (56 kDa) levels for indicated samples. Fold change has been quantified with respect to the total Slt2. Gapdh (36 kDa) has been used as a loading control. Data are represented as mean ± SD unpaired, two-tailed Student’s t-test; N>4; ****p<0.0001; **p<0.01; ns = not significant. (E) Lipidomic analysis of specific DAGs in double knockout of PSI1 and DIP2, compared with WT and Δpsi1. Data are represented as mean ± SEM (unpaired, two-tailed Student’s t-test; **p<0.01; *p<0.05; ns = not significant. N=5). (F) Representative western blot image and quantification of pSlt2 (56 kDa) levels for indicated samples. Two data points for controls (WT and Δdip2) are same as that of D. Fold change has been quantified with respect to the total Slt2. Phosphoglycerate kinase (Pgk1) (45 kDa) has been used as a loading control. Data are represented as mean ± SD unpaired, two-tailed Student’s t-test; N>3; ****p<0.0001; ***p<0.001; ns = not significant. (G) Schematic showing Psi1-Plc1-Dip2 axis to regulate Pkc1 signalling where Psi1 remodels phosphoinositides (PI) to enrich it with C36:0 and C36:1 containing acyl chain, which is channelled to the selective DAGs via Plc1 and in turn activate Pkc1.
-
Figure 4—source data 1
Quantification of diacylglycerol (DAG) in wild-type (WT) and Δdip2 in the presence of Plc1 inhibitor.
Excel file containing raw values for DAG intensities displayed in Figure 4B.
- https://cdn.elifesciences.org/articles/104011/elife-104011-fig4-data1-v1.zip
-
Figure 4—source data 2
Quantification of DAG in double knockout of disco-interacting protein 2 (DIP2) and PLC1.
Excel file containing raw values for DAG intensities displayed in Figure 4C.
- https://cdn.elifesciences.org/articles/104011/elife-104011-fig4-data2-v1.zip
-
Figure 4—source data 3
Western blot and quantification of pSlt2 in the double knockout of disco-interacting protein 2 (DIP2) and PLC1 and in the presence of Plc1 inhibitor.
PDF file containing original western blots for Figure 4D, indicating the relevant bands.
- https://cdn.elifesciences.org/articles/104011/elife-104011-fig4-data3-v1.zip
-
Figure 4—source data 4
Western blot and quantification of pSlt2 in the double knockout of disco-interacting protein 2 (DIP2) and PLC1 and in the presence of Plc1 inhibitor.
Original files for western blot analysis displayed in Figure 4D.
- https://cdn.elifesciences.org/articles/104011/elife-104011-fig4-data4-v1.zip
-
Figure 4—source data 5
Quantification of diacylglycerol (DAG) in double knockout of disco-interacting protein 2 (DIP2) and PSI1.
Excel file containing raw values for DAG intensities displayed in Figure 4E.
- https://cdn.elifesciences.org/articles/104011/elife-104011-fig4-data5-v1.zip
-
Figure 4—source data 6
Western blot and quantification of pSlt2 in the double knockout of disco-interacting protein 2 (DIP2) and PSI1.
PDF file containing original western blots for Figure 4F, indicating the relevant bands.
- https://cdn.elifesciences.org/articles/104011/elife-104011-fig4-data6-v1.zip
-
Figure 4—source data 7
Western blot and quantification of pSlt2 in the double knockout of disco-interacting protein 2 (DIP2) and PSI1.
Original files for western blot analysis displayed in Figure 4F.
- https://cdn.elifesciences.org/articles/104011/elife-104011-fig4-data7-v1.zip
Figure 4—figure supplement 1

DAG quantification for WT and DIP2 KO treated with various inhibitors.
(A) Lipidomic analysis showing the levels of bulk diacylglycerols (DAGs) in wild-type (WT) and Δdip2 on treating with 0.5 and 1 μM of U73122. Data are represented as mean ± SEM (unpaired, two-tailed Student’s t-test). N=6. (B) Lipidomic analysis for the DAG subspecies in WT and Δdip2 in the presence and absence of Propranolol and (C) Aureobasidin. Data are represented as mean ± SEM (unpaired, two-tailed Student’s t-test; ns = not significant). N=6.
-
Figure 4—figure supplement 1—source data 1
Excel file containing raw values for diacylglycerol (DAG) intensities displayed in Figure 4—figure supplement 1.
- https://cdn.elifesciences.org/articles/104011/elife-104011-fig4-figsupp1-data1-v1.zip
Figure 4—figure supplement 2
DAG quantification and pSlt2 levels in double knockouts of PAH1 and DIP2.
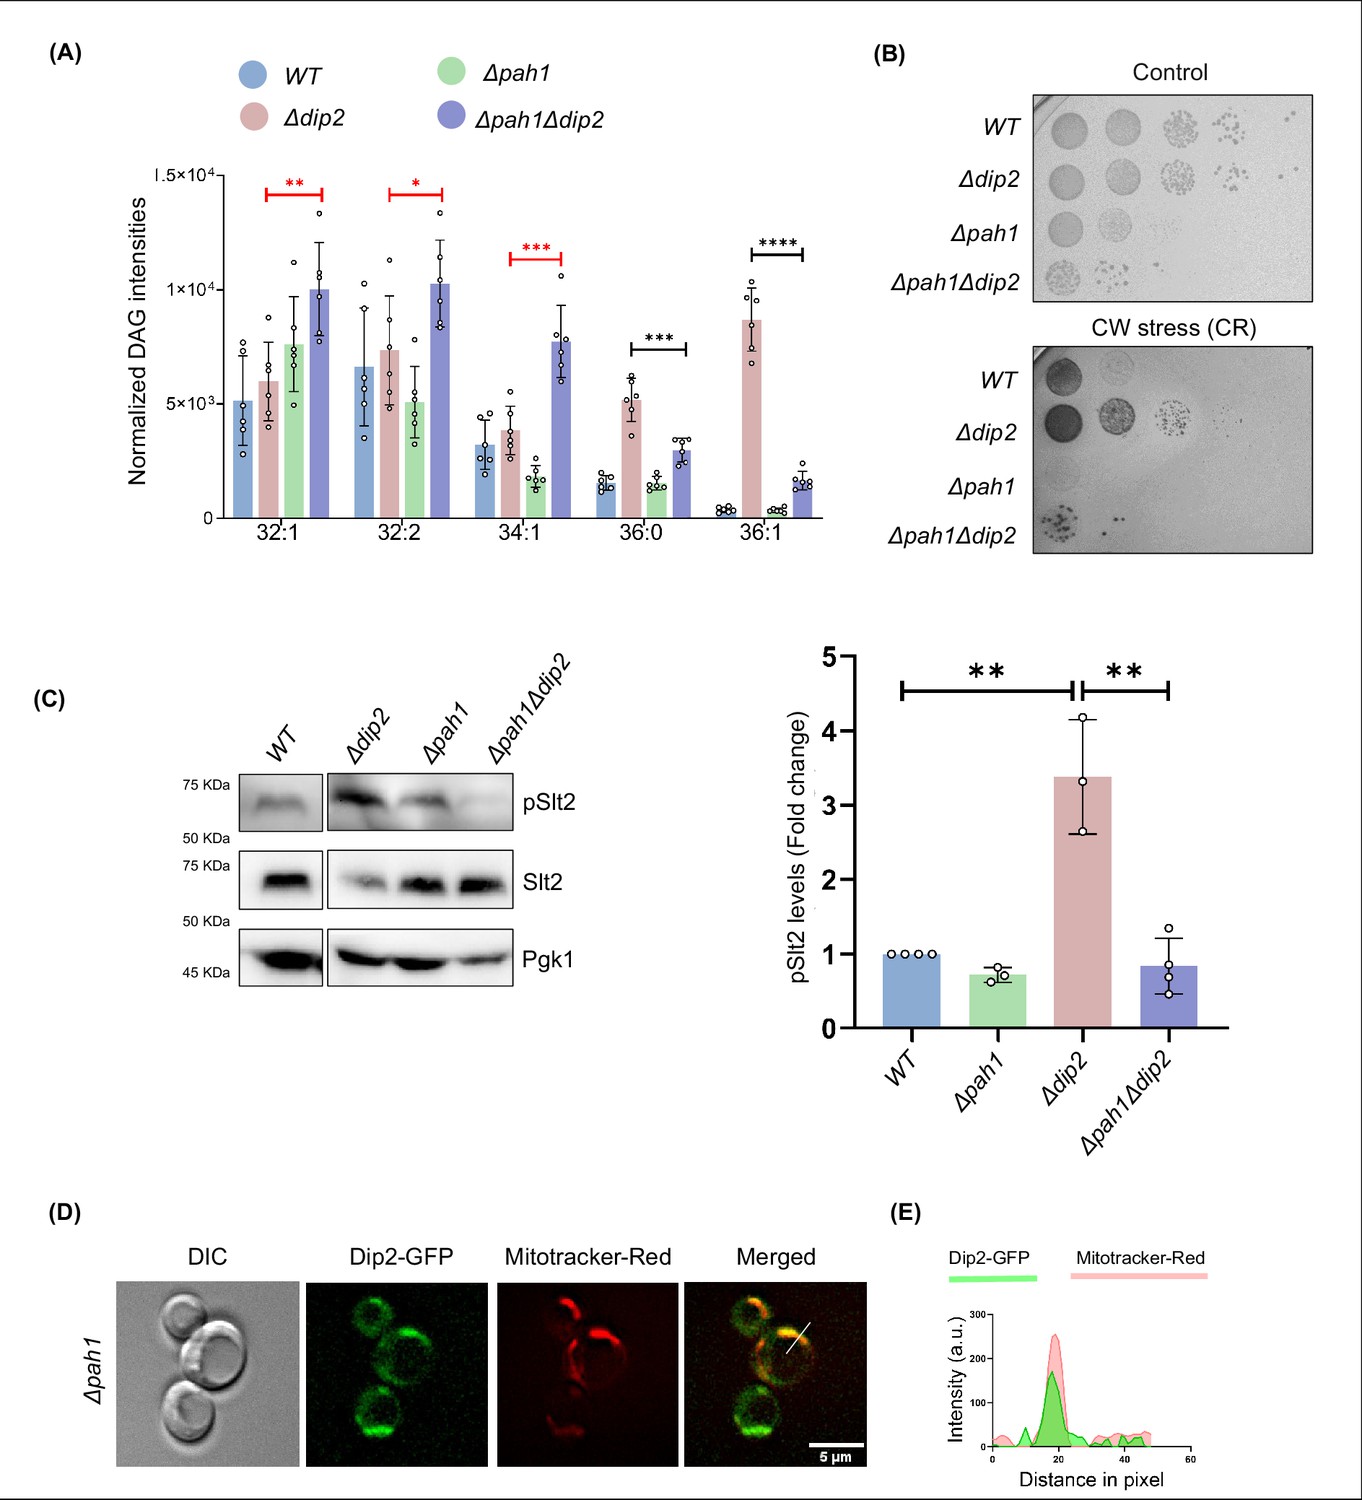
(A) Bar graph showing quantification of diacylglycerol (DAG) subspecies level in Δpah1 and Δpah1Δdip2 DKO. Significance in red shows an increase in DAG species while the black arrows show a decrease in DAGs. Data are represented as mean ± SEM (unpaired, two-tailed Student’s t-test; n=6). ****p<0.0001; ***p<0.001 ns=not significant. N=6. (B) Cell wall stress assay for Δpah1 and Δpah1Δdip2, compared with Δdip2, in the presence of congo red (100 µg/mL). (C) Western blot and quantification of pSlt2 (56 kDa) in Δpah1 and Δpah1Δdip2, normalized to total Slt2 (56 kDa). Pgk1 (45 kDa) is used as a loading control. Data are represented as mean ± SD (unpaired, two-tailed Student’s t-test; n=3; **p<0.01; ns = not significant). (D) Live cell microscopy image for Dip2-GFP in Δpah1 co-stained with Mitotracker Red (red). Scale bar represents 5 µm. (E) Line scan of signal intensity along the white line shown in the merged image. Green and red peaks represent Dip2-GFP and mitotracker red, respectively.
-
Figure 4—figure supplement 2—source data 1
Excel file containing raw values for diacylglycerol (DAG) intensities displayed in Figure 4—figure supplement 2A.
- https://cdn.elifesciences.org/articles/104011/elife-104011-fig4-figsupp2-data1-v1.zip
-
Figure 4—figure supplement 2—source data 2
Original files for spot assay plate images displayed in Figure 4—figure supplement 2B with relevant labelling.
- https://cdn.elifesciences.org/articles/104011/elife-104011-fig4-figsupp2-data2-v1.zip
-
Figure 4—figure supplement 2—source data 3
PDF file containing original western blots for Figure 4—figure supplement 2C indicating the relevant bands.
- https://cdn.elifesciences.org/articles/104011/elife-104011-fig4-figsupp2-data3-v1.zip
-
Figure 4—figure supplement 2—source data 4
Original files for western blot analysis displayed in Figure 4—figure supplement 2C.
- https://cdn.elifesciences.org/articles/104011/elife-104011-fig4-figsupp2-data4-v1.zip
-
Figure 4—figure supplement 2—source data 5
Original microscopy image for Figure 4—figure supplement 2D.
- https://cdn.elifesciences.org/articles/104011/elife-104011-fig4-figsupp2-data5-v1.zip
Figure 4—figure supplement 3
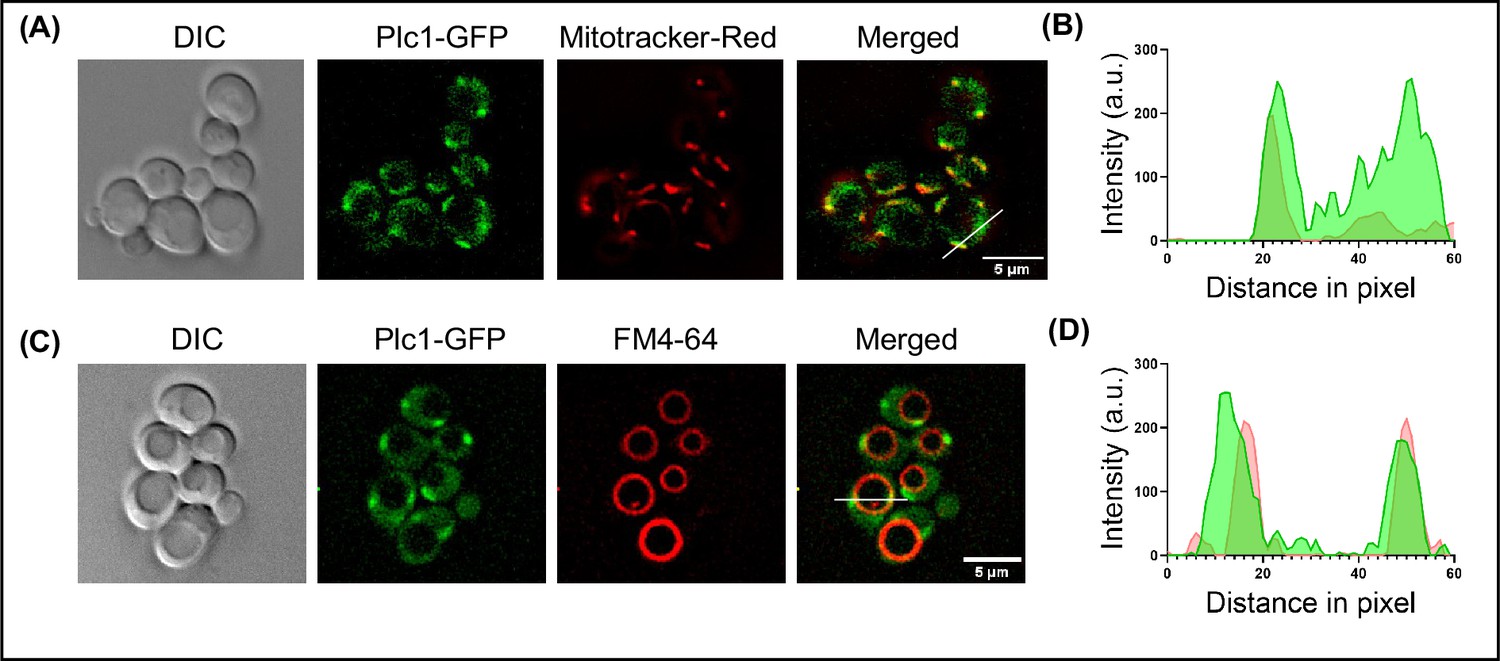
Partial localization of Plc1 with mitochondria and vacuole.
(A) Microscopy image panel showing DIC image (left), fluorescence for Plc1 tagged with GFP, mitotracker-red for staining mitochondria, and the merged image for both the fluorophores (right). Scale bar represents 5 µm. (B) Line scan plotted for the fluorescence intensity of Plc1-GFP along with mitotracker-red across the line shown in the merged panel. (C) Microscopy image panel for Plc1-GFP stained with FM4-64 for visualising vacuoles. The merged image for red and green channel is shown on the right. Scale bar represents 5 µm. (D) Fluorescence intensity plotted for GFP and FM4-64 along the line showing colocalisation of Plc1 with vacuole.
-
Figure 4—figure supplement 3—source data 1
Original microscopy image for Plc1-GFP in Figure 4—figure supplement 3A and C.
- https://cdn.elifesciences.org/articles/104011/elife-104011-fig4-figsupp3-data1-v1.zip
Figure 4—figure supplement 4
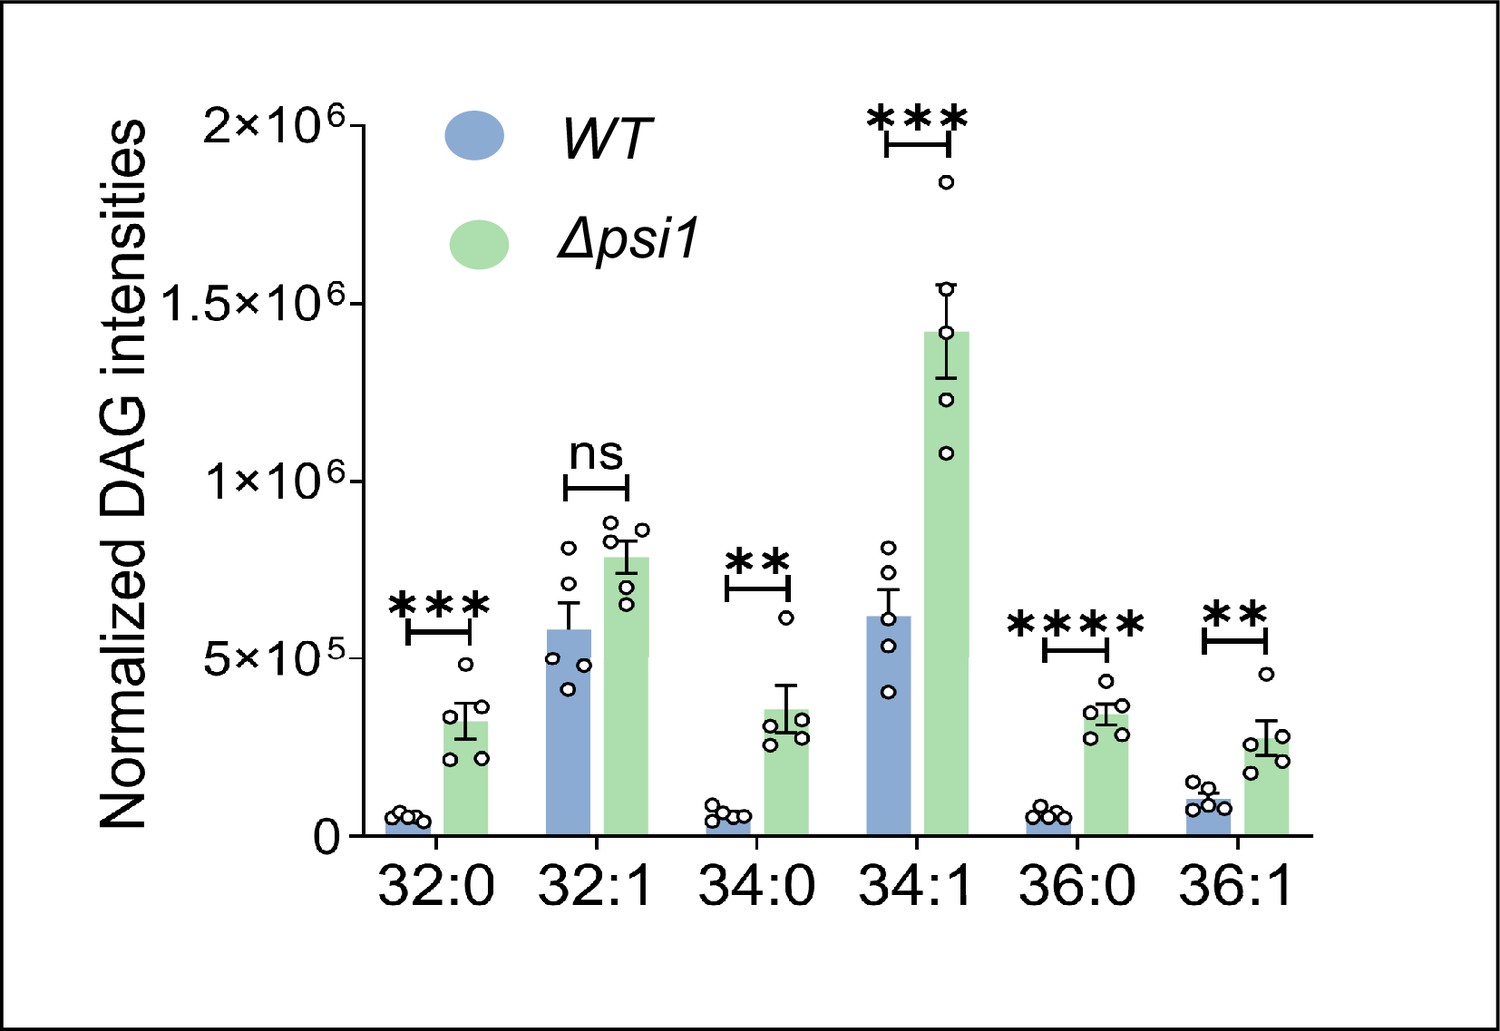
DAG subspecies quantification for Δpsi1 measured via lipidomics.
Data are represented as mean ± SEM (unpaired, two-tailed Student’s t-test; N=5). ****p<0.0001; ***p<0.001, **p<0.01, ns = not significant.
Figure 5 with 2 supplements
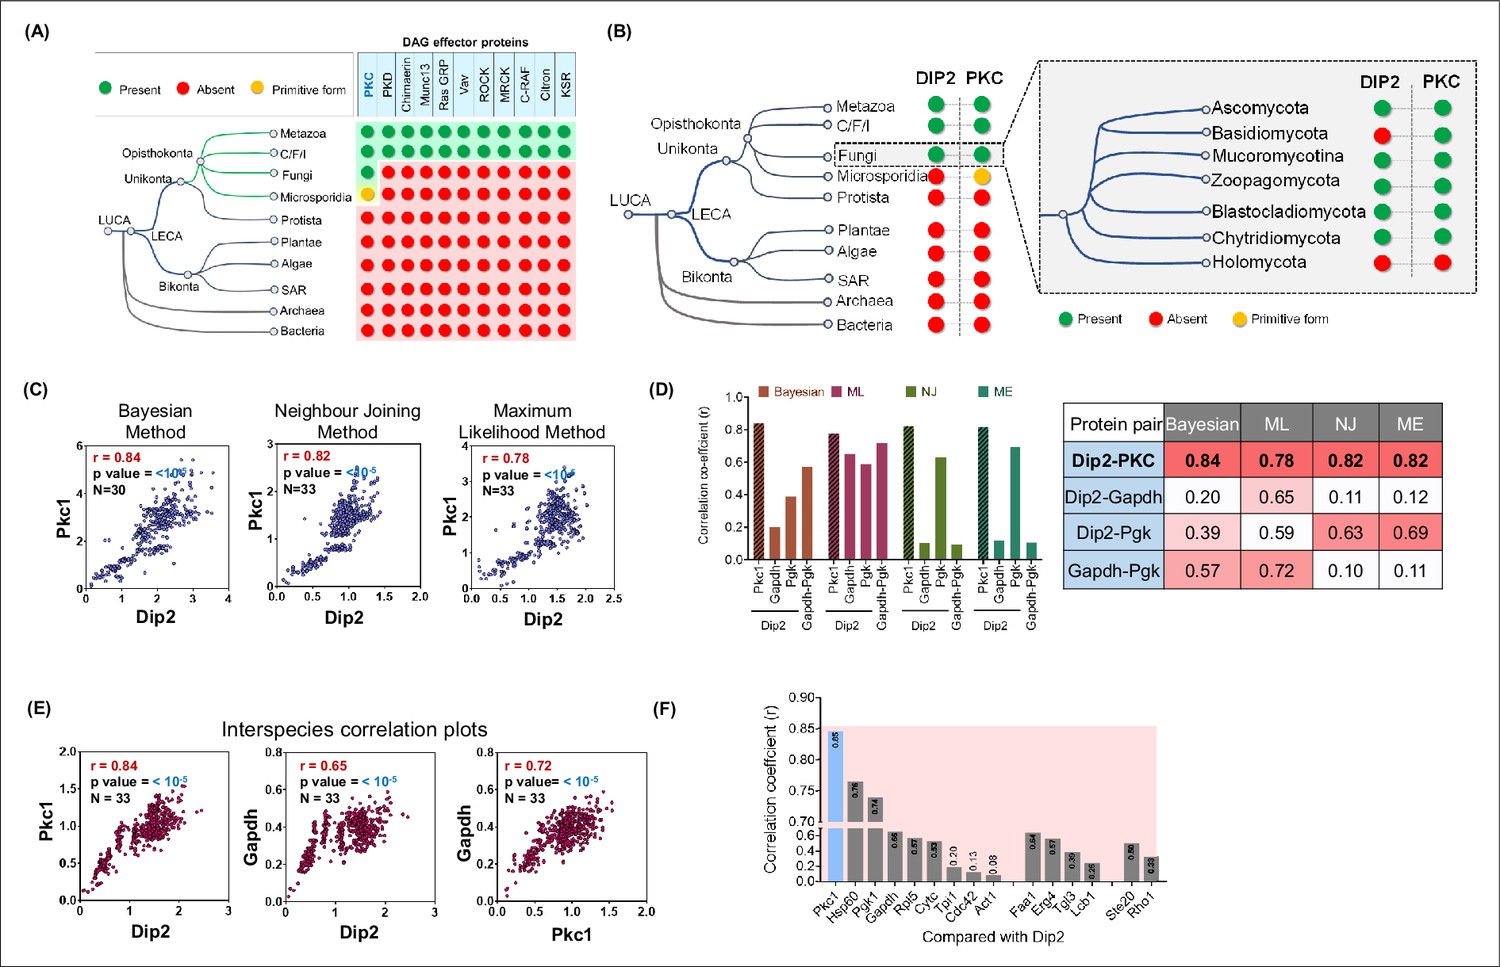
Disco-interacting protein 2 (Dip2) and protein kinase C (PKC) share a parallel history of co-emergence coevolution across Opisthokonta.
(A) Emergence and distribution of diacylglycerol (DAG) effector proteins across tree of life. Green circles represent presence, while red circles represent absence of effector proteins. Yellow circle represents the primitive form of PKC. List of DAG effectors is taken from a previous study (Colón-González and Kazanietz, 2006). (B) Phylogenetic profiling of Dip2 and PKC shows their co-emergence in Opisthokonta. Inset shows presence of Dip2 and PKC in different fungal branches (Ocaña-Pallarès et al., 2022). Green circle represents presence, red represents absence, while yellow circle represents a primitive form of PKC harbouring only C1 and kinase domain. (C) Interspecies coevolution plot (using patristic distance) between fungal Dip2 and PKC using three different phylogenetic algorithms, with the correlation coefficient value represented by r. Number of organisms and significance levels are indicated. (D) Interspecies correlation coefficient values (r) for Dip2 compared with PKC and control proteins Gapdh and Pgk using various algorithms for calculating phylogenetic distances. r value is calculated for Gapdh and Pgk the same way. The table contains the exact correlation coefficient values for all the above-mentioned protein pairs using different algorithms. (E) Coevolution analysis (using genetic distance) between Dip2 and PKC along with their individual comparison with control protein Gapdh. Number of organisms and significance levels are indicated. (F) Correlation coefficient values represented as bar graph for Dip2 compared with a set of housekeeping genes and lipid metabolising proteins.
-
Figure 5—source data 1
Quantification of interspecies correlation coefficient values for disco-interacting protein 2 (Dip2) and protein kinase C (PKC) using different algorithms.
Excel file containing correlation coefficient values for scatter plots displayed in Figure 5C.
- https://cdn.elifesciences.org/articles/104011/elife-104011-fig5-data1-v1.zip
-
Figure 5—source data 2
Quantification of interspecies correlation coefficient values for disco-interacting protein 2 (Dip2), protein kinase C (PKC), Gapdh, and Pgk1 using different algorithms.
Excel file containing correlation coefficient values for bar graphs displayed in Figure 5D.
- https://cdn.elifesciences.org/articles/104011/elife-104011-fig5-data2-v1.zip
-
Figure 5—source data 3
Quantification of interspecies correlation coefficient values using genetic distances for disco-interacting protein 2 Dip2, protein kinase C (PKC), and Gapdh.
Excel file containing correlation coefficient values for scatter plots displayed in Figure 5E.
- https://cdn.elifesciences.org/articles/104011/elife-104011-fig5-data3-v1.zip
-
Figure 5—source data 4
Quantification of interspecies correlation coefficient values for various housekeeping proteins and disco-interacting protein 2 (Dip2).
Excel file containing correlation coefficient values for bar graphs displayed in Figure 5F.
- https://cdn.elifesciences.org/articles/104011/elife-104011-fig5-data4-v1.zip
Figure 5—figure supplement 1
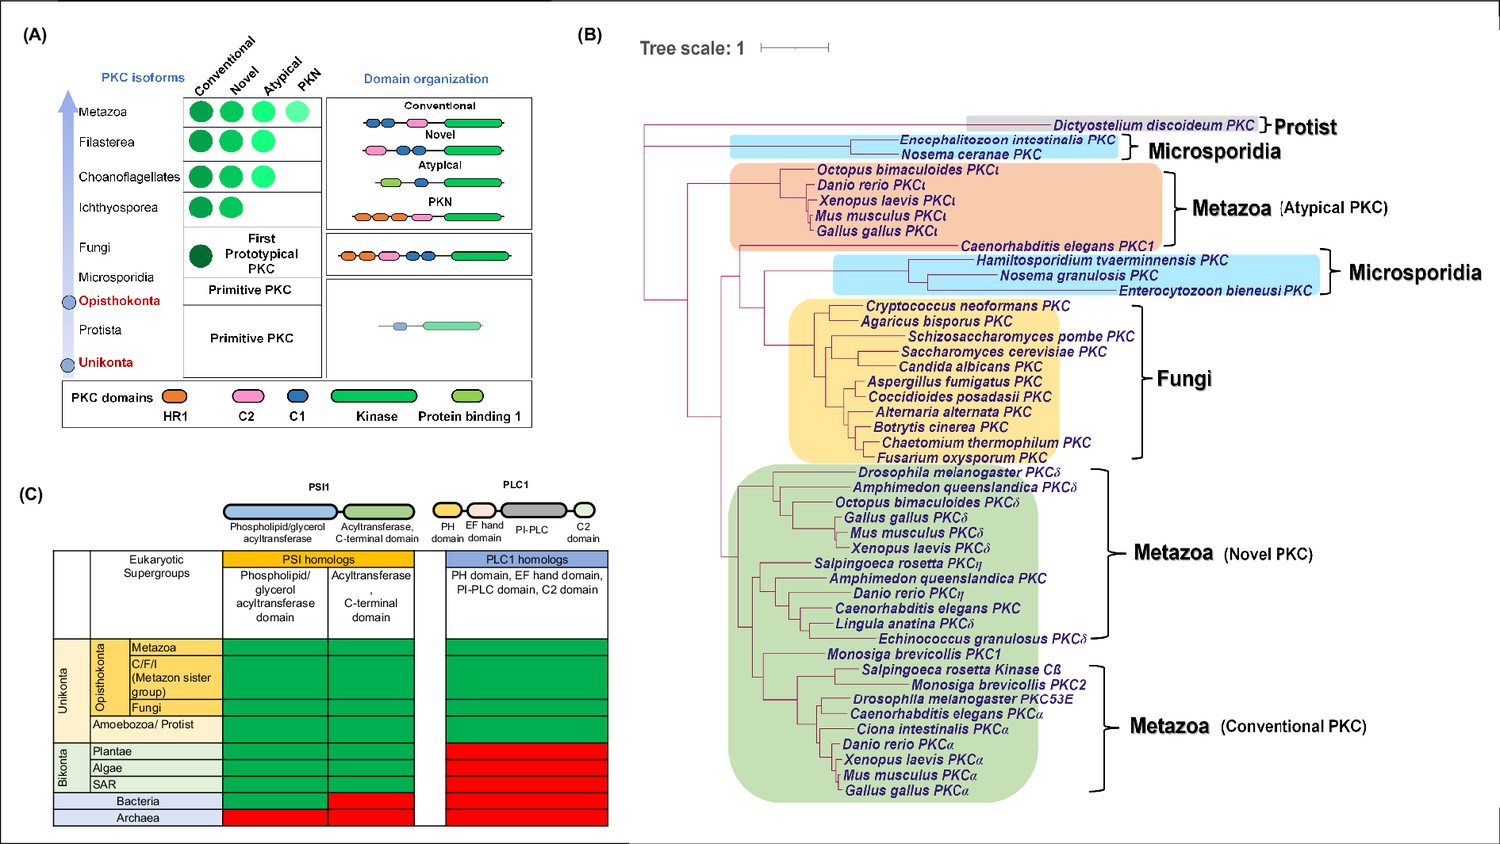
Phylogenetic analysis and distribution of PKC, PLC and PSI.
(A) A schematic showing domain architecture and distribution of protein kinase C (PKC) isoforms (green circles) across Unikonta. Further classification of PKC isoforms (conventional, novel, atypical and Protein Kinase C-Related Kinase (PKN)) and domain annotations are indicated. (B) Phylogenetic profiling of PKC showing its distribution among protists (grey), microsporidia (blue), fungi (yellow) and metazoan (green). Types of PKC isoforms found in metazoan are mentioned in brackets. (C) Distribution of Psi1 and Plc1 and their domains across tree of life. Domain organisations of both Psi1 and Plc1 are shown on the top. Green and red colours represent the presence and absence of the proteins in respective supergroups mentioned on the left side.
Figure 5—figure supplement 2
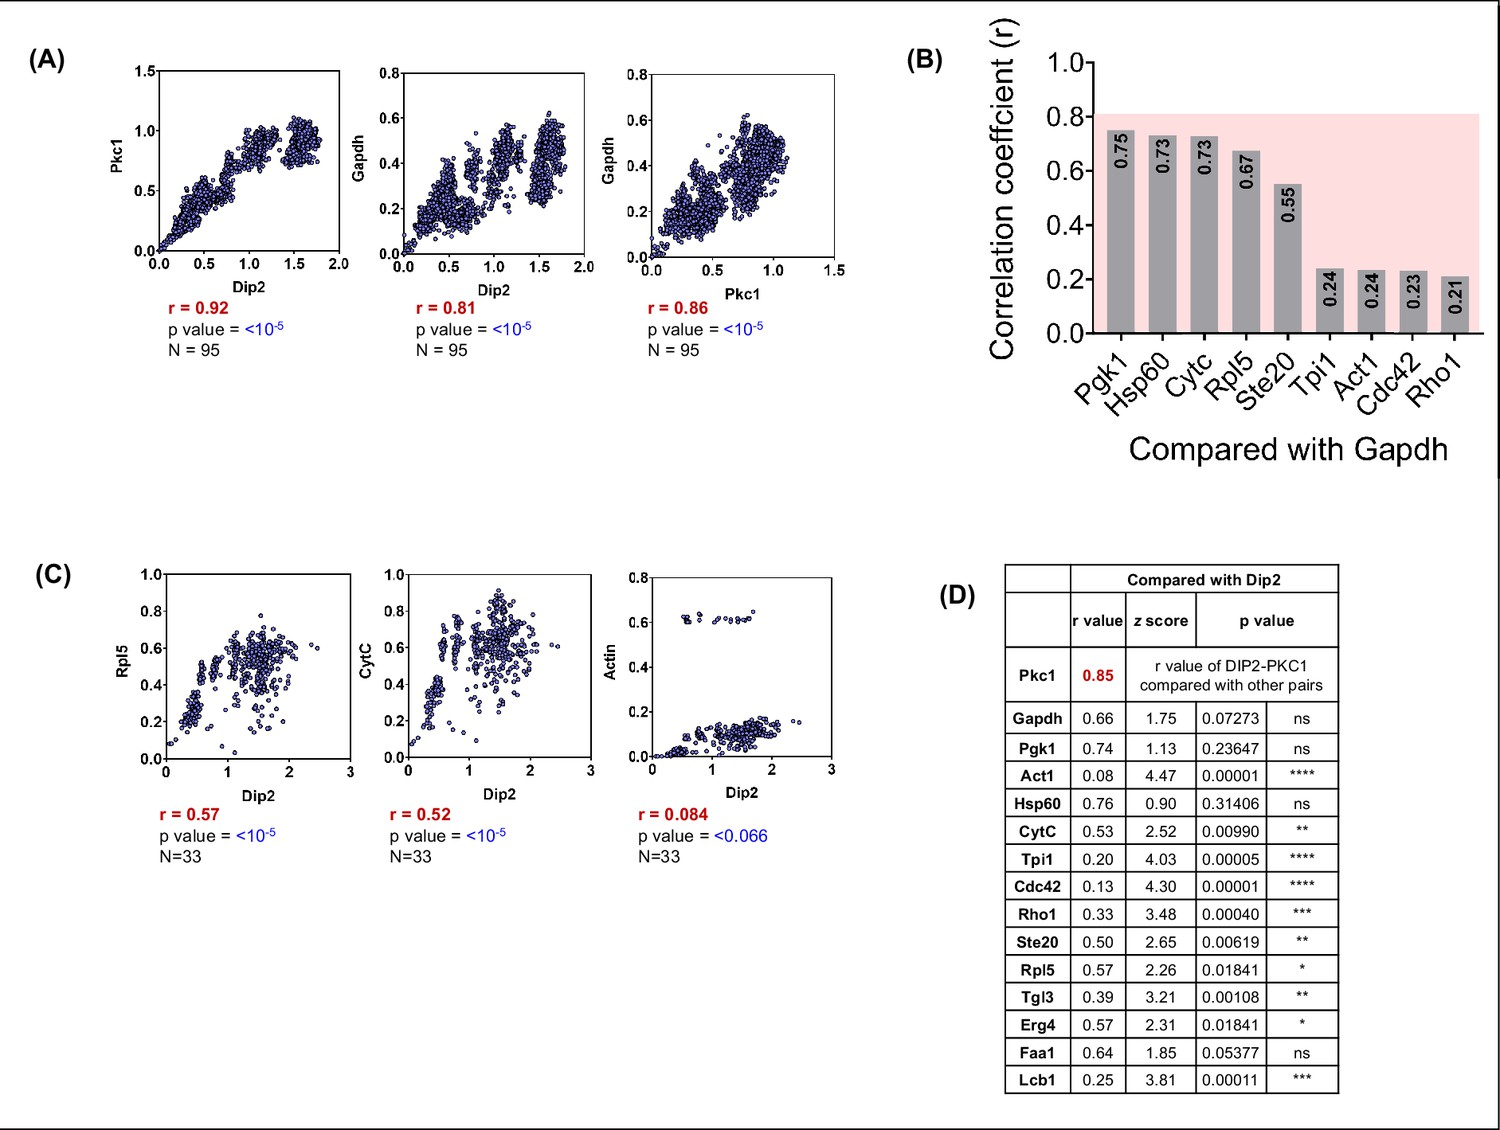
Coevolutionary analysis of Dip2 and PKC along with control proteins.
(A) Interspecies correlation plot for disco-interacting protein 2 (Dip2) & Pkc1 and Gapdh with Pkc1 and Dip2 each from all the fungal sequences present in KEGG Genome Database. (B) Correlation coefficient values represented as a bar graph for Gapdh compared to other protein controls. Pink colour window behind the bar graphs shows the empirical cut-off of 0.8 correlation coefficient. (C) Interspecies correlation plot between Dip2 and various control proteins like Ribosomal 60 s subunit protein L5 (Rpl5), Cytochrome C (CytC), and Actin. (D) A table representing the correlation coefficient (r-value), Fisher’s z-scores (z-score), and p-value for Dip2 compared with Pkc1 and other protein controls.
-
Figure 5—figure supplement 2—source data 1
Excel file containing correlation coefficient values for Figure 5A–D.
- https://cdn.elifesciences.org/articles/104011/elife-104011-fig5-figsupp2-data1-v1.zip
Figure 6
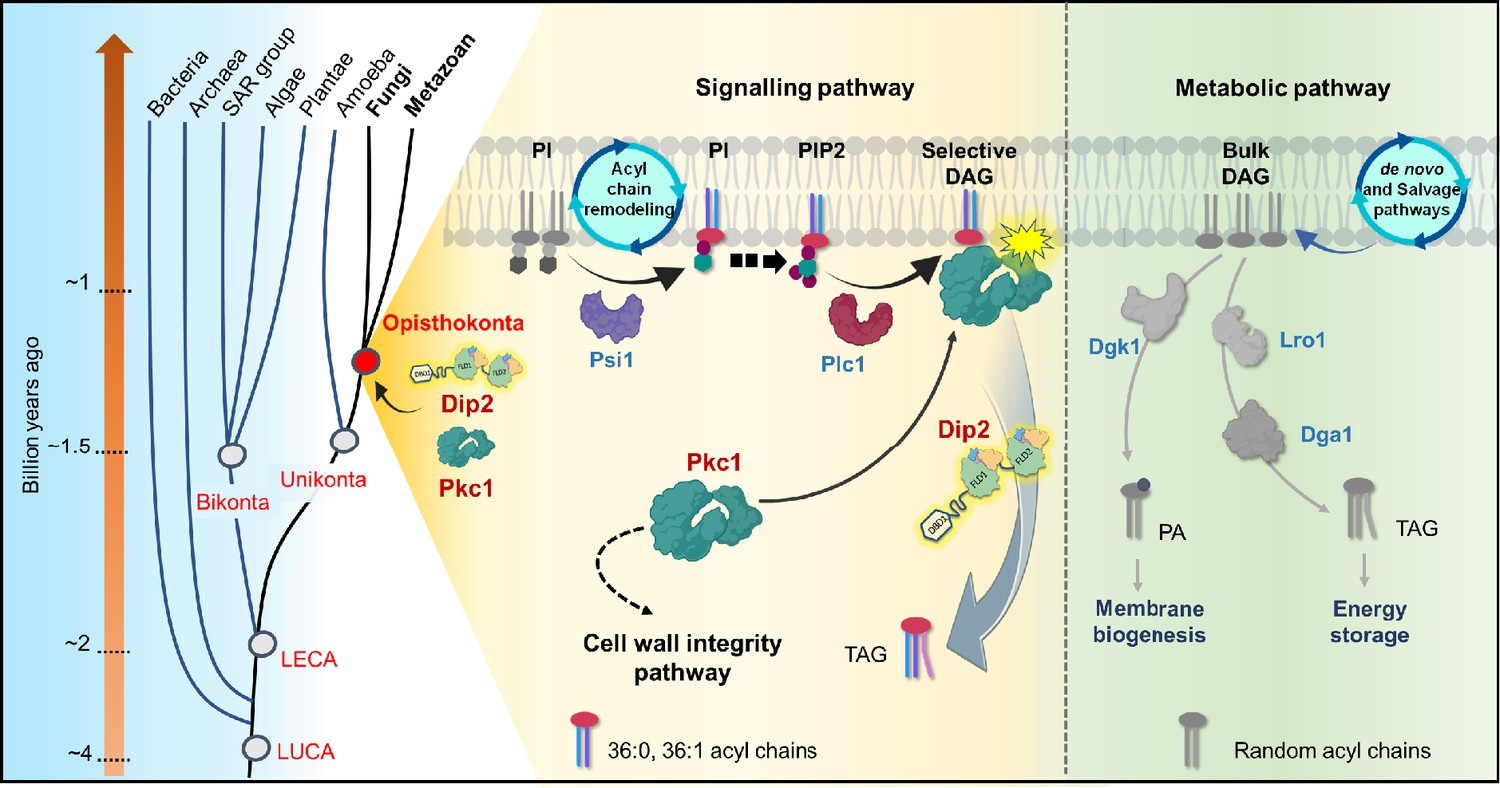
A graphical representation depicting the emergence of disco-interacting protein 2 (Dip2)-protein kinase C (PKC) axis and the evolution of selective diacylglycerol (DAG)-based PKC signalling in Opisthokonta.
Dip2 is recruited parallel to PKC in the tree of life at the root of Opisthokonta evolution ~1.2 billion years ago. This Dip2-PKC axis remains conserved across Fungi and Metazoan. Two distinct DAG pools are sourced from de novo or salvage pathways and acyl chain remodelling of PIs, leading to metabolic and signalling DAG pools, respectively. Remodelled phosphoinositides (PI, PIP, PIP2) by Psi1 are enriched with 18:0 acyl chains and channelled to corresponding PIP2, which forms respective DAG species (C36:0, C36:1) upon hydrolysis by Plc1. These selective DAG subspecies act as secondary messenger for PKC signalling and, therefore, regulate the CWI pathway in yeast. Dip2 maintains the levels of these selective DAGs by facilitating their conversion to triacylglycerols (TAGs), thereby creating a diversification of DAG function into metabolic and signalling pathways.
Author response image 1

Live cell microscopy for tracing Pkc1 localization.
(A) Microscopy image panel showing DIC image (left), fluorescence for (A) Pkc1 tagged with GFP, mitotracker-red for staining mitochondria and the merged image for both the fluorophores (right). Scale bar represents 5 µm. (B) Line scan plotted for the fluorescence intensity of Pkc1-GFP along with mitotracker-red across the line shown in the merged panel.
Additional files
-
Supplementary file 1
List of yeast strains.
- https://cdn.elifesciences.org/articles/104011/elife-104011-supp1-v1.docx
-
Supplementary file 2
List of Primers.
- https://cdn.elifesciences.org/articles/104011/elife-104011-supp2-v1.docx
-
Supplementary file 3
List of plasmids.
- https://cdn.elifesciences.org/articles/104011/elife-104011-supp3-v1.docx
-
Supplementary file 4
Software and algorithms.
- https://cdn.elifesciences.org/articles/104011/elife-104011-supp4-v1.docx
-
Supplementary file 5
Reagents or Resources.
- https://cdn.elifesciences.org/articles/104011/elife-104011-supp5-v1.docx
-
MDAR checklist
- https://cdn.elifesciences.org/articles/104011/elife-104011-mdarchecklist1-v1.pdf
Download links
A two-part list of links to download the article, or parts of the article, in various formats.
Downloads (link to download the article as PDF)
Open citations (links to open the citations from this article in various online reference manager services)
Cite this article (links to download the citations from this article in formats compatible with various reference manager tools)
Emergence of Dip2-mediated specific DAG-based PKC signalling axis in eukaryotes
eLife 14:RP104011.
https://doi.org/10.7554/eLife.104011.3


